Embed Size (px)
Citation preview

Risk Management in Gas Pipeline Transportation Systems
I Foro Global De Energia Peru Lima November 5th 2015
Alan Murray P Eng; FASME
CPTI Canada

There are an estimated 300 million PowerPoint users in the world.
They do 30 million presentations every day
About 1.5 million presentations are going on right now
2

90% of them are unbearable (conservative estimate)
9.9994% induce deep sleep
Hopefully this isn’t one
of them!
3

Unsafe Pipelines?
Video from www.state.ak.us.
2001 – Alaska - Corrosion
Pipelines are essential for the transportation of oil and gas.
Pipelines are not dangerous or unsafe, but their content, and
mistakes in their design, maintenance and management, can make
them unsafe
Failures can range from small leaks to major ruptures, the latter.
can have major consequences

PIPELINES ARE RELATIVELY SAFE Pipelines are a relatively safe mode for transporting energy:
95%
5%
Highway Other
TRANSPORTATION FATALITIES (Total = 45,026) 2006 Data from National Transportation Safety Board and Office of Pipeline Safety, USA
779
805
781
19
3
0
0 200 400 600 800 1000
Air
Sea
Rail
Pipeline (all)
Pipeline (Gas)
Pipeline (Liquid)

0
5
10
15
20
25
30
88 89 90 91 92 93 94 95 96 97 98 99 0 1 2 3 4 5 6 7 8 9
Fatalities Injuries
NATURAL GAS PIPELINE SAFETY: Latest U S Data… casualties
Gas pipeline failures can, and do, cause fatalities.
This is USA data:
Major increase
in fatalities &
injuries in 2000
A fishing vessel struck and ruptured a 16 inch submerged gas pipeline, killing 11 crew members
US Office of Pipeline Safety – all transmission gas lines (up to end of 2009). Not including gathering or distribution lines
Fatallities Injuries
Number/annum
Year

From a Regulatory perspective the challenge in Pipeline
Safety is to establish appropriate performance
standards and to work with the Industry to achieve
them. Regulations that deal with high consequence, low
probability events are likely to differ in important ways
from those which deal with low consequence, high
probability occurrences
Carlsbad –12 deaths
7
Pressure on Regulators for more proactive action

WHY DO PIPELINES FAIL?: Most Likely Threats
24%
18%
27%
5%
15%
8%3%
All other causes
Corrosion
Excavation
damage
Human error
Material failure
Natural force
Other outside force
Source: USA DOT PHMSA: September 2007
The major threats to a pipeline are obtained from failure statistics.
Here are some data for the USA (1987-2006, onshore lines):

Ground movement /Weather- related
Corrosion
Design/Manufacture/ Construction Fault

10
Higher Likelihood Categories
• External and internal corrosion,
• Third party damage,
• Operator or procedures error,
• Equipment failures,
• Natural forces damage,
• Stress corrosion cracking,
• Materials defects
• Construction errors
Alan Murray 2013

Threats do not stay Constant ISO/PDTS 12747 states ‘The integrity of the pipeline system will have deteriorated since installation.’
It gives this overview of how a pipeline’s ‘integrity’ deteriorates with time, and this deterioration is affected by differing threats:
*’Pipeline transportation systems — Recommended practice for pipeline life extension’. 2010
Note importance of staff and ‘culture’

PIPELINE SAFETY: Using Incident Rates
Failure or ‘Incident’ rates are ‘lagging’ indicators of safety.
They are a ‘reactive’ approach to improve safety, based on a trend.
‘Leading’ indicators of safety are proactive methods, such as:
hazard identifications; risk assessments; near misses; inspections;
training; competency testing; etc..
Leading indicators should improve safety, regardless of trends.
0
10
20
30
40
50
60
70
80
1 2 3 4 5 6 7 8 9 10 11 12 13 14 15
Fatalities Injuries
Year
Lagging indicators… reactive Leading indicators… proactive ?

TRADITIONAL APPROACH TO CONTROLLING THREATS
Historically the threats to pipelines have been managed and controlled by adopting ‘good practices’ .
Regulations issued by government departments;
Standards produced by standards-making organisations .
Depending on the level of risk and complexity involved, it is possible the adoption of good practice alone may not be sufficient .
For example, in high hazard situations, where the circumstances are not fully within the scope of the good practice, additional measures may be required to reduce risks.

14
Valve Spacing Isolating valves are installed for the purpose of isolating the pipeline for maintenance
and for response to operating emergencies.
Spacing Considerations include the nature and amount of service fluid released due to
repair and maintenance blowdowns, leaks, or ruptures. The size of a release depends
on how quickly the leak is detected and valves are activated to isolate the line plus the
volume that can drain naturally from the leak point.
CSA Z662 sets out the following valve spacing requirements.

MODERN APPROACH TO CONTROLLING THREATS
Virginia, 2008
Good practices have to be supplemented by use of Integrity Management Systems which involves using a ‘Risk Management Approach.
According to the USA’s PHMSA :
‘Good engineering is only part of the solution… a strong risk-based approach [ensures] the safety and reliability of … pipeline infrastructure’.
2007.

16
Failure Modes
Metal
Loss Cracking
Geotechnical
Failure
External
Damage
Material/
Construction
Defect Other
External
Corrosion
Hydrogen
Induced
Wash Out /
Erosion
Company/ first
party damage
Defective long Seam
weld
Fire
Internal
Corrosion
Stress
corrosion
Slope
Movement
Contractor /
Second party
damage
Defective girth weld Over
pressuring
Gouging Delayed
Cracking
(Mechanical
damage)
Undermining /
Subsidence
Third party
damage
Defective Spiral seam
weld
SCADA
malfunction
Immediate
Cracking
(Mechanical
damage)
Earthquake Vandalism Wrinkle /Buckle Lightning
Corrosion
fatigue
Terrorism Defective pipe body

17
Unusual Load conditions and structural response
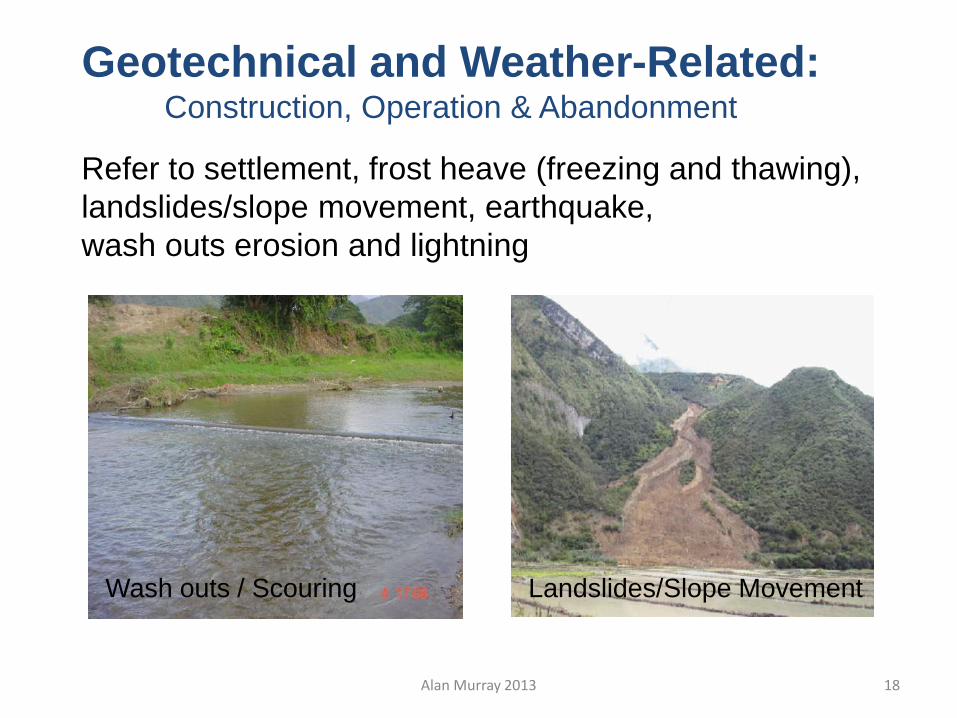
Geotechnical and Weather-Related: Construction, Operation & Abandonment
Refer to settlement, frost heave (freezing and thawing),
landslides/slope movement, earthquake,
wash outs erosion and lightning
Landslides/Slope Movement Wash outs / Scouring
Alan Murray 2013 18

1. Geohazards – Geotechnical
Rock Slide • Landslides involving mostly rock
• Can occur catastrophically or slowly (Rock Creep)
• Pipelines crossing the high mountains in wet climates with unfavorable structural geology or bedrock types are most vulnerable
Terrace, NW BC, Canada

1. Geohazards – Geotechnical
Debris Slide • Landslides involving rock, soil,
and trees
• Can occur catastrophically or slowly
• Pipelines crossing or adjacent to slopes >15 degrees in wet climates with silty and clayey soils are most vulnerable.
• Human activity and high antecedent or highly intense precipitation are common triggers
Bolivia, South America

1. Geohazards – Seismic
Lateral Spreading

Why do we do risk assessments?
• They can provide a comprehensive, consistent and objective basis for assessing, managing and demonstrating pipeline integrity
• Decisions based on risk considerations will reflect both the likelihood of failure and the potential consequences of failure – both are important!
• Decisions based on quantitative risk approaches can reflect the implications of the uncertainties inherent in estimation of both probabilities and consequences
Slide 22

Risk is calculated by combining the likelihood of an event, with its consequences:
Likelihood = ‘how often’; and
Consequence = ‘how good or bad’.
Safety is the absence of risk, or the reciprocal of riProbability is ‘chance’ – the chance of an uncertain event (‘hazard’ or ‘threat’) occurring.
Reliability is a probability - the probability that a system will perform its intended function during a specified period of time under stated conditions.
Consequence are the effects of the event (hazard) occurring.
SOME DEFINITIONS

We need to understand how the general public view risk, particularly when the risk is posed by my structure, e.g. a pipeline.
People judge that the risk posed by activities such as smoking is a voluntary activity, and hence, the resulting deaths are less troublesome than are other sorts of deaths.
The public will accept risks from voluntary hazards (e.g. driving a car) that are many times greater than from involuntary hazards, such as a pipeline failure.
RISK: ‘Voluntary’ & ‘Involuntary’
✓

RISK FATALITIES
Gas Distribution 13
Liquid Transmission 0
Gas Transmission 1
Highways (1992) 42500
Home accidents (1992) 19500
Accidental firearms 700
Accidental poisoning 4100
PIPELINE SAFETY: ‘Involuntary’ versus ‘Voluntary’ risks
USA Data - 1993
Pipelines cause relatively few fatalities compared to other risks that the
general public ‘volunteer’ to take.
The public do not ‘volunteer’ to take risks with pipelines, and hence they
consider fatalities resulting from pipeline failures as unacceptable.

Managing Risk
Risk Manager
Actual Risks
Perceived Risks
Managed by addressing every aspect that can
go wrong
Managed by communicating all the aspects
that will prevent a
failure

Managing Actual Risk Risk management must look at:
all threats, all consequences, and all barriers and
understand how all these threats and barriers interact in the system.
• Taking into account rare occurrences of failures due to unusual circumstances
27
Reason’s Swiss Chees model

Managing Perceived risk • Assuring public of safety - focus on many
measures that are taken to ensure safety.
• The public need to know if their family and property are “safe”.
28
• Acceptable levels of “safety” depend on one’s
control over risk
E.g., Driving ones own car (high risk is accepted)
versus air plane travel (low risk is expected).
• Pipelines are held to even higher standards!

© Penspen Ltd. 2013
Failure probability and consequences vary with the pipeline type, product, environment, etc..
Failure probabilities will be a prediction of the likelihood, over time, of all the likely failure modes in the pipeline.
Failure consequence analysis will depend on - release rate through orifices, toxicity of product, generation and dispersion of vapour clouds and flame jets, thermal radiation hazards, vapour cloud explosions, etc..
PIPELINE RISK: Probabilities and Consequences
General Public
Pipeline
External Hazards
Pipeline Hazards
Probability
Consequences
© Penspen Ltd. 2013
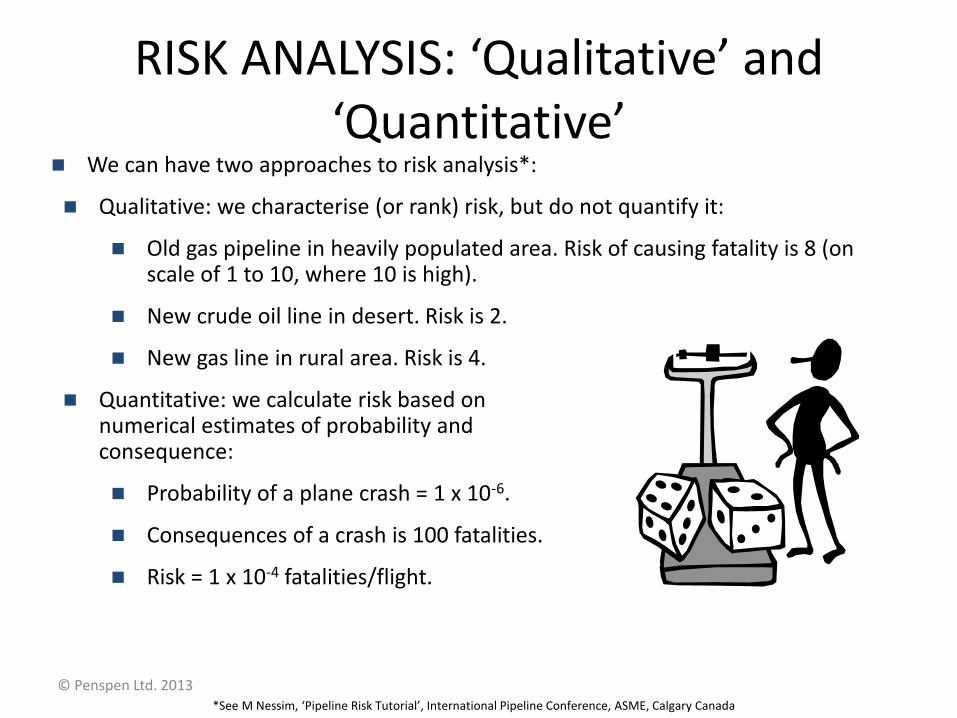
RISK ANALYSIS: ‘Qualitative’ and ‘Quantitative’
We can have two approaches to risk analysis*:
Qualitative: we characterise (or rank) risk, but do not quantify it:
Old gas pipeline in heavily populated area. Risk of causing fatality is 8 (on scale of 1 to 10, where 10 is high).
New crude oil line in desert. Risk is 2.
New gas line in rural area. Risk is 4.
Quantitative: we calculate risk based on numerical estimates of probability and consequence:
Probability of a plane crash = 1 x 10⁻⁶.
Consequences of a crash is 100 fatalities.
Risk = 1 x 10⁻⁴ fatalities/flight.
*See M Nessim, ‘Pipeline Risk Tutorial’, International Pipeline Conference, ASME, Calgary Canada

RA Levels and Approaches Source: API 580 RBI and 581 Resource Doc, ASME B31.8
Risk Assessment Levels
I II III
Level Description Qualitative Semi-Quantitative Quantitative
Failure Likelihood High, Medium, Low Damage Factor or Failure Frequency
Failure Frequency
Consequence
Safety/Business Interruption (Qualitative Descriptors)
Consequence Area or High/Medium/Low
Or Scoring (#)
Quantified Safety (fatalities),
Financial ($)
Results 5 x 5 Matrix 5 x 5 Matrix Risk Plots,
Risk Tables
Approaches Subject Matter Experts (SME)
SME + Relative Scoring/Index
• Probabilistic To be Validated by
SME 32

33
Analysis Methods • Any of the following risk analysis methods, or a combination of methods,
can be used. The method(s) chosen must be documented and consistently applied:
– Subject Matter Experts (SME)
– Relative Risk or Index Models
– Scenario Based Models
– Probabilistic Models
– RAM, Hybrid, and Other Models

RISK ANALYSIS: Estimating Risk… Qualitative
We can estimate the level of risk in a comparative, or relative, way to give us a ‘qualitative’ analysis*:
Consequence
Probability Very Low
Low Medium
High
Very Low
Low
Medium
High HIGH
MEDIUM
LOW
These analyses are easy to use, but only provide a risk ranking/priority, which may be difficult to justify.

RISK ANALYSIS: Estimating Risk… ‘Quantitative’
A risk analysis where each of the probability (frequency) and consequence components is quantified, and which provides a numerical estimate of risk, is called a ‘Quantitative Risk Analysis’ (QRA); for example:
These QRAs can overcome the limitations associated with qualitative risk analyses.
Probability = 2 x 10⁻³ Consequence = 3 x 10⁻²
Quantitative Risk = [(2 x 10-3) x (3 x 10-2)] = 6 x 10⁻⁵

Quantitative risk assessment (QRA) calculates absolute risk levels on both individuals and groups.
Calculate a ‘probability’ of becoming a casualty; e.g., 1 in a million chance of injury/annum.
Compare this calculated probability with a ‘target’ or ‘acceptable’ probability.
This target/acceptable probability may be obtained from the Regulatory Body.
Quantitative risk assessment will involve quite detailed calculations
RISK ASSESSMENTS: ‘QRA’
Pf
Risk = Pf x Cf
Cf
Risk < Acceptable

RISK MANAGEMENT: What is it?
System definition
Identify hazards
Perform risk calculations
Compare with
‘acceptable’
risk levels
Risk Assessment
Risk Analysis
Perform cost benefits
Decisions, Actions,
Mitigation
Risk Management
Risk management is the process of selecting appropriate risk reduction measures, and implementing them in the on-going management of the activity*:
*See M Nessim, ‘Pipeline Risk Tutorial’, International Pipeline Conference, ASME, Calgary Canada

Risk Tolerance No matter what type of risk assessment approach is used pipeline operators must identify risks, prioritize them, and implement strategies to reduce the risk to a tolerable level. Risk reduction comes at a cost. Setting and communicating risk criteria can be challenging. Defining risk tolerability criteria helps decision-makers objectively evaluate risk reduction options based on the companies risk tolerance.

Tolerable versus Intolerable
• The key is to determine a level of risk that is intolerable
(reduce at any cost) and a level of risk that is tolerable (nothing needs to be fixed).
• For risks that fall between the two levels, operators should work to lower the risk in areas where the benefits outweigh the costs.
• How low is low enough? • There are a number of approaches for defining risk criteria
and the degree of risk tolerance is expected to vary from company to company.
• Some are qualitative, semi-quantitative, or quantitative.

Risk Acceptance Criteria
• Criteria can be established on the basis of: human life
• environmental damage
• equipment/property damage
• business loss
• litigation costs
• other factors.
• For natural gas pipelines, human life or life safety isa driving factor

Challenge – Lack of Consensus on Risk Acceptance Criteria
• What is the possible basis for acceptance criteria? – International precedent (e.g. Individual Risk or FN Curve criteria)
• Should they necessarily apply here?
– Historical performance (e.g. m3 spilled per km-yr of operation)
• Is past performance acceptable going forward?
– Risk level implied by current codes and best practices
• How to calculate the implied risk level?
• A key issue with acceptance criteria – What to do if you can’t meet the criteria?
Slide 47

52
Exposure to Risk from a Gas Pipeline Break
• Calculated based on known population densities
Individual Risk is calculated as the total risk exposure on every population source within the impact distance


55
r = 1009 ft.
Constant Consequence N American model
660 ft.
660 ft.
Pipeline diameter “d” (inches) = 36”
MAOP 1650 psig: PIR = 1000 ft
PIR = 0.69 pd2
Pipeline diameter “d” (inches) = 30”
MAOP 1000 psig: PIR = 655 ft
Pipeline diameter “d” (inches) = 18”
MAOP 600 psig: PIR = 304 ft
20 houses within circle

56
C-FER HCA determined by Pres. & Diameter
0
100
200
300
400
500
600
700
800
900
1,000
1,100
1,200
1,300
1,400
1,500
1,600
1,700
0 250 500 750 1,000 1,250 1,500 1,750 2,000 2,250 2,500
Maximum Operating Pressure (psig)
Dis
tan
ce (
ft)
3"
4"
6"
8"
10"
12"
16"
20"
24"
30"
36"
42"

Typical Risk Criteria (Safety) -Individual Risk – e.g., MIACC:
Slide 57
Pipelines must share space they cannot “sterilise” land use

Individual Risk Iso-Risk Plot (Point Source)
Courtesy Jim Mihill Slide 58

Pipelines are a safe form of transportation but they do sometimes fail due to:
Defects (dents, corrosion…) introduced at manufacture and during service that grow to critical size:
we can prevent, detect , assess and repair these defects.
Natural forces:
Depending on the severity we can prevent or mitigate these failures, through design.
Operator/equipment errors:
these failures are reduced by good management and maintenance.
Theft and sabotage (increasing in some places ).
CONCLUSIONS
Things are not always as they seem…
61

Remember Safety First!
62
Preguntas?


![Gas Transportation Agreement · Gas Transportation Agreement BNEDOCS 224412786_10.doc Details Pipeline [Insert name/s of pipeline/s] Jurisdiction [insert relevant State for governing](https://img.dokumen.tips/doc/110x75/5e22054c218f66483541b587/gas-transportation-agreement-gas-transportation-agreement-bnedocs-22441278610doc.jpg)


![[Transport]modeling of oil product and gas pipeline transportation](https://img.dokumen.tips/doc/110x75/55c4ce16bb61ebc9218b457d/transportmodeling-of-oil-product-and-gas-pipeline-transportation.jpg)


