Embed Size (px)
Citation preview

Master of Science Thesis
KTH School of Industrial Engineering and Management
Energy Technology EGI-2015-MJ211X
SE-100 44 STOCKHOLM
Risk Index for High Power
Transformers
Tomás Sucena Paiva Camelo

-2-
Master of Science Thesis EGI 2015: MJ211X
Risk Index for High Power Transformers
Tomás Sucena Paiva Camelo
Approved
Date
Examiner
Reza Fakhrai
Supervisor
Bahram Saadatfar
Commissioner
Contact person
Abstract
The Risk Index is a useful tool which allows quick conclusions regarding the possibility of something
going wrong with a specific device or situation. In this work, the devices are high power transformers
belonging to a specific company.
This company is EDP Renováveis (EDPR) which develops, manages and maintains wind farms with a
total installed capacity of 9,036 MW (at the end of 2014), in ten countries located in Europe, North
America and Brazil. Each of these wind farms has a substation with, at least, one high power transformer.
High power transformers are expensive devices and are crucial to the proper operation of the wind farm.
As so, they present great importance to EDPR. In order to maintain them and make sure, as far as
possible, that a break-down does not happen, the company performs several tests a year on these pieces of
equipment, taking note of any symptom that might cause alarm. These tests use different methods, and
are performed by various entities with diverse time schedules.
The amount of information to be taken into account for the Risk Index calculation is vast. From the
location to the features of the transformer, going through the above mentioned tests, a sizable amount of
data must be collected and processed. The Risk Index allows the ranking of the various conditions
according to their real seriousness. For instance, if two transformers are in bad state, it should be able to
determine which of them brings more negative consequences.
The Risk Index is obtained by predicting the possible scenarios resulting from the symptoms that the
transformer is displaying. The consequences resulting from each symptom have to be determined with the
information that was gathered in solid previous research work, and using the knowledge available from
experts in the area. The consequences have also to be estimated, using formulas based on real cases that
have occurred, and taking into account all the influencing parameters of that specific equipment. Testing
the algorithms in several transformers with different problems and environments (location, rated power,
manufacturer, etc.) and comparing the results among them is the ultimate method to improve the
reliability of these formulas.

-3-
In order to complement the idea of the Risk Index, a Fail Index is also developed in this work. It simply
pretends to illustrate the likelihood of failure of a given transformer. This index does not allow
comparisons among different information, but it might be useful for a more down-to-earth analysis. It
basically splits the transformer in its components. The state of each component is then decomposed in
percentages, which are attributed to the results of the tests that contribute to evaluate the given
component.
Coming up with a risk index is not useful just for itself: it must be followed by a structured program that
can efficiently process a great deal of information, and display the results in an intuitive way for its users.

-4-
Table of Contents
Abstract ........................................................................................................................................................................... 2
1 Introduction .......................................................................................................................................................... 6
1.1 Risk Management and Risk Assessment ................................................................................................. 9
1.2 EDP Renewables......................................................................................................................................... 9
1.3 Objectives ...................................................................................................................................................10
1.4 Tests Performed to the Transformers ...................................................................................................10
1.5 Introduction to Programming .................................................................................................................11
2 Methodology .......................................................................................................................................................12
3 Health and Risk Index .......................................................................................................................................13
3.1 Available Tests ...........................................................................................................................................13
3.2 Assessment Systems .................................................................................................................................17
3.2.1 AS1 .....................................................................................................................................................17
3.2.2 AS2 .....................................................................................................................................................17
3.2.3 AS3 .....................................................................................................................................................17
3.2.4 AS4 .....................................................................................................................................................18
3.2.5 AS5 .....................................................................................................................................................18
3.2.6 AS6 .....................................................................................................................................................20
3.2.7 AS7 .....................................................................................................................................................21
3.2.8 AS8 .....................................................................................................................................................22
3.2.9 AS9 .....................................................................................................................................................22
3.2.10 AS10 ...................................................................................................................................................22
3.3 Relation between the Available Parameters and the Transformer’s Components .........................23
3.4 Fail Index ....................................................................................................................................................28
3.5 Risk Index...................................................................................................................................................29
3.5.1 Differentiating Components ..........................................................................................................29
3.5.2 Differentiating Transformers .........................................................................................................30
3.5.3 Other Important Factors ................................................................................................................31
3.5.4 Risk Index Calculation ....................................................................................................................31
4 Computer Program ............................................................................................................................................38
4.1 Information Gathering .............................................................................................................................41
4.2 Processes and Threads .............................................................................................................................44
4.3 Data Structure ............................................................................................................................................45
4.3.1 Independent variables .....................................................................................................................45
4.3.2 Tables and Arrows ...........................................................................................................................45
4.3.3 Lists ....................................................................................................................................................46
4.3.4 Arrow of Lists...................................................................................................................................47

-5-
4.3.5 Memory when the program is off .................................................................................................48
4.4 Synchronization .........................................................................................................................................50
5 Conclusions .........................................................................................................................................................60
Bibliography .................................................................................................................................................................61
Annex I .........................................................................................................................................................................62
Annex II ........................................................................................................................................................................66
Annex III ......................................................................................................................................................................67
Annex IV ......................................................................................................................................................................71
Annex V ........................................................................................................................................................................79
Annex VI ......................................................................................................................................................................80
-6-
(1)
1 Introduction
A transformer is an electric device which is used to modify certain characteristics of an electrical currents.
In this specific case, the interest is towards the transformers that pass medium voltage high voltage, and
vice-versa.
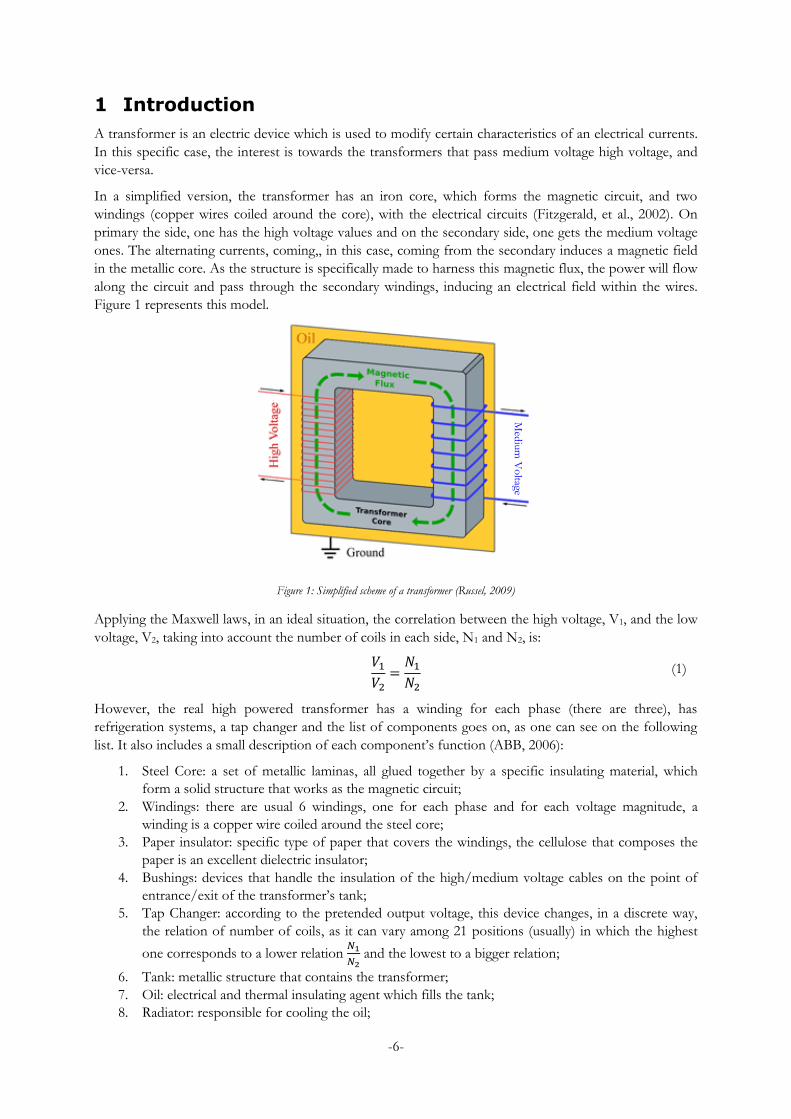
In a simplified version, the transformer has an iron core, which forms the magnetic circuit, and two
windings (copper wires coiled around the core), with the electrical circuits (Fitzgerald, et al., 2002). On
primary the side, one has the high voltage values and on the secondary side, one gets the medium voltage
ones. The alternating currents, coming,, in this case, coming from the secondary induces a magnetic field
in the metallic core. As the structure is specifically made to harness this magnetic flux, the power will flow
along the circuit and pass through the secondary windings, inducing an electrical field within the wires.
Figure 1 represents this model.
Figure 1: Simplified scheme of a transformer (Russel, 2009)
Applying the Maxwell laws, in an ideal situation, the correlation between the high voltage, V1, and the low
voltage, V2, taking into account the number of coils in each side, N1 and N2, is:
𝑉1𝑉2=𝑁1𝑁2
However, the real high powered transformer has a winding for each phase (there are three), has
refrigeration systems, a tap changer and the list of components goes on, as one can see on the following
list. It also includes a small description of each component’s function (ABB, 2006):
1. Steel Core: a set of metallic laminas, all glued together by a specific insulating material, which
form a solid structure that works as the magnetic circuit;
2. Windings: there are usual 6 windings, one for each phase and for each voltage magnitude, a
winding is a copper wire coiled around the steel core;
3. Paper insulator: specific type of paper that covers the windings, the cellulose that composes the
paper is an excellent dielectric insulator;
4. Bushings: devices that handle the insulation of the high/medium voltage cables on the point of
entrance/exit of the transformer’s tank;
5. Tap Changer: according to the pretended output voltage, this device changes, in a discrete way,
the relation of number of coils, as it can vary among 21 positions (usually) in which the highest
one corresponds to a lower relation 𝑁1
𝑁2 and the lowest to a bigger relation;
6. Tank: metallic structure that contains the transformer;
7. Oil: electrical and thermal insulating agent which fills the tank;
8. Radiator: responsible for cooling the oil;
Med
ium
Vo
ltage

-7-
9. Fans: help with the circulation of air within the radiator;
10. Pumps: few EDPR’s transformers have pumps to help with the oil circulation, therefore it will
not be taken into consideration in this report;
11. Control Cabinet: used for checking the correct functioning of the transformer;
12. Oil Conservator: as the oil warms up or cools down, it occupies more or less space, therefore a
specific compartment is needed for when the oil expands;
13. Ground connections: conductive wires that connect different components of the transformer to
the ground;
14. Smaller Components
o Neutral disconnect switch: device which covers the cases the neutral has to connect to
the ground;
o Silica gel: as it was said before, the oil expands and contracts, which implies that
sometimes air has to get in the tank, however, the water vapor must not enter because it
ruins the oil quality, therefore silica gel is needed to absorb it;
o Seals, valves and gaskets;
o Support Structure;
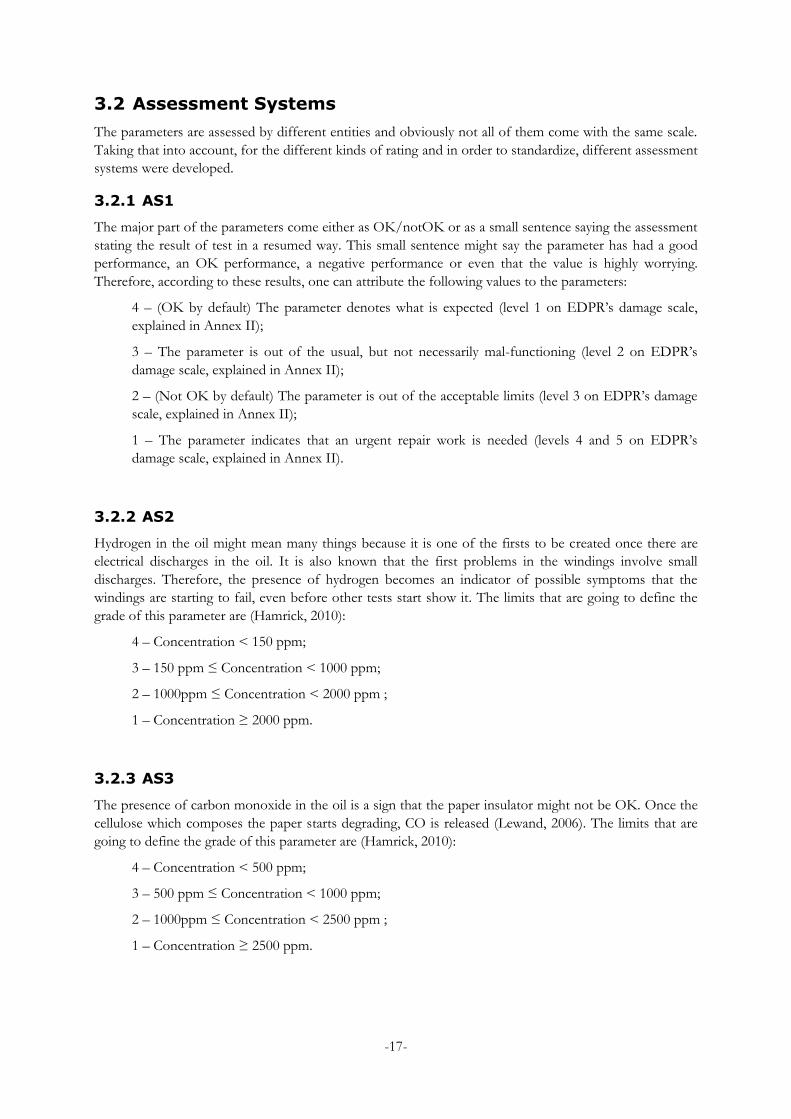
Figure 2 shows a picture of a high power transformer with some of the components previously listed
identified with the respective number:
Figure 2: Picture of a high power transformer (Global Market, 2011)
12 4
8
9
6

-8-
It is possible to say that the amount of components present in such devices is not particularly small, hence
the need for different tests. Regarding this topic, there is a study presented by the University of Cape
Town, South Africa, which follows the life of 4015 transformers with different ages and operating in
different conditions, during 10 years (1996-2006). This is the graph that was developed (Figure 3), taking
into account severe and intermediate failures (Jagers, et al., 2007):
Figure 3: Share of severe and intermediate failures along the components (Jagers, et al., 2007)
Looking at the causes for the referred failures, Munchin RE, a reinsurance company, which has much
experience with transformers, has published a list of the most common reasons that can cause
breakdowns (Bartley, 2005):
Lightning Surges: immense power discharges from lightning bolts;
Line Surges/External Short Circuit: peaks in voltage and current related with the grid connection;
Poor Workmanship-Manufacturer: if the transformer is badly manufactured, as in wrong ground
connection circuits or defected insulations inside the transformers;
Deterioration of Insulation: with time and usage, this cause is unavoidable;
Overloading: when the transformer is often working above its power capacity;
Moisture: presence of water dissolved in the oil;
Inadequate Maintenance;
Loose Connections.
The most interesting cases nowadays, for a company which owns several of these devices and has an
organized system of maintenance, are probably overloading, deterioration of the insulation and moisture.
Mainly because they are easier to control and are quite likely to occur, at least when compared with
lightning surges, for example. The owner of a transformer may be powerless to avoid those situations, for
instances: it might be the grid that is overloading the transformer; or the device may have an intrinsic
problem with water infiltration; or even the deterioration of the insulation that can also be caused by
overloading or line surges, although it can very well happen just for the usage and age of the transformer.

-9-
(2)
(3)
1.1 Risk Management and Risk Assessment
In general, risk management refers to the process of dealing with possible problems; unfavorable
situations that are not necessarily going to happen. Therefore, on one hand, there is an area related with
identifying the risks, knowing what is at stake, and, on the other hand, there is dealing with this risk, trying
to minimize the probabilities of negative consequences to occur while reducing the amount of resources
spent to mitigate these chances.
Looking into the specific case of the transformers, there is the possibility of not spending money on
maintenance procedures. The possible consequence of that is for the transformer to break down before its
time and money has to be spent to fix the problem. Although, worse than the direct repair costs, is the
time the transformer has to be stopped. Every hour the transformer is not working might represent a big
amount of electric energy which is not being sold. For instance, using a very plausible situation, in
Portugal, a 20 MW wind farm with a feed-in tariff of 85 €/MWh, on a typical day, with the wind blowing
with a constant speed of 7 m/s (constant speed is unrealistic but the number 7 m/s is when wind turbines
are at around one third of their total capacity), would have a total cost of, approximately:
𝐶 = 𝐹𝑎𝑐𝑡𝑜𝑟. 𝑃𝑜𝑤𝑒𝑟. 𝑃𝑟𝑖𝑐𝑒. 𝑁𝐻𝑜𝑢𝑟𝑠 ,
𝐶 =1
3× 20 × 85 × 24 ≈ 13.600 €/𝑑𝑎𝑦 .
As it is possible to see, it is not a small number and, furthermore, repairing a transformer can take
between five and sixty days, depending on several parameters discussed later on the report.
To avoid this kind of situation as much as possible, preventive maintenance should be performed on the
transformers, which comes in the form of regular tests and inspections. These tests also cost money;
therefore, there is a balance between the costs related with maintenance with the potential costs of repairs.
However, this thesis is more related with risk assessment, which is a quantification of the risk. With the
results from the tests, which are indicators on the transformers’ health and with the parameters which
constitute reference to the possible loss of money, there is enough information to develop a systematic
risk assessment tool.
Risk is considered to be a relation between the probability of something happening and the consequences
of that same thing actually happen (Stamatelatos, 2000). In the case of “consequences” being a
quantifiable number, which in this case is a monetary cost, one can say risk is (ABB, 2006):
𝑅𝑖𝑠𝑘 = 𝑃𝑟𝑜𝑏𝑎𝑏𝑖𝑙𝑖𝑡𝑦 × 𝐶𝑜𝑛𝑠𝑒𝑞𝑢𝑒𝑛𝑐𝑒𝑠 .
The methods to calculate those two important parameters are explained along the report.
1.2 EDP Renewables
EDP Renováveis, or EDPR, is a multi-national company, leader in renewable power production. Very
basically, it develops, manages and maintains wind and solar power plants. As the number of solar plants
is still quite low when compared to the wind farms, the focus of this thesis is towards wind.
Most of the times, associated to the wind power plants, there are high powered transformers to manage,
wherein EDPR has about 100 of these devices. Even though they are not prone to breakdown frequently,
they do fail now and then. These failures can cost significant amounts of money, mainly because, once
these transformers stop working, they compromise the production of the wind turbines which they are
connected to; if the production stops, energy is not sold, so big amounts of money can be lost. As it was
already exemplified, in order to decrease the risk of these unfortunate events, EDPR carries on a series of
tests in a regular basis. The main reason for regular tests is to detect a possible problem the earliest as
possible. If there is a result from one particular test which starts to deviate from its optimum value, EDPR

-10-
can detect it right away and is able to take decisions with time. This way, the company has the possibility
to choose if the transformer should keep working or if the transformer should be fixed before greater
(and more expensive) damages occur.
Tests to transformers can be done in many ways. They vary on the thoroughness, on the components in
analysis, on the time spent, on the money invested and on a number of other factors. With this into
consideration, EDPR demands five different types of tests, which are explained in 1.4.
Information from these assessments should be stored, analyzed and prioritized in a way the department of
Central Maintenance is able to take the best decision. The problem relies on the fact that different tests
assess different parameters but none of them can tell clearly what the state of the transformer is.
1.3 Objectives
The general objective of this work is to create a tool to manage the test data and information of the
EDPR coming from the tests previously mentioned. A transformer’s fail index will be developed in order
to illustrate, in one number, the probability of failure of each transformer.
More than the need to know which transformers are not performing well, there is the need to know where
EDPR should focus its attention and resources. Not all the transformers have the same importance to
EDPR. Some cover only a very small share of EDPR’s production capacity, some are still in guaranty,
some are more expensive to fix and other differences which may exist will be explored in this thesis.
Therefore, a risk index shall be developed. This will be a ranking which prioritizes the different
transformers’ situations, gathering all the available information to EDPR in one number.
In addition, a software is developed to implement the index on the transformers fleet of the company.
1.4 Tests Performed to the Transformers
It was said before that, to assess the state of the transformers and, this way, helping with the calculation of
the probabilities, EDPR performs five types of tests to the transformers:
Monthly Inspection, MI – 1 time per month: one technician, through a naked eye inspection, fills
in a form with the basic things that are possible to observe.
Regular Maintenance, RM – 3 times per year: a hired maintenance company writes a report on the
physical condition of the transformer; it can be performed with the device connected to the grid
or without such connection (possibility to gather more information). This analysis counts with
hired specialized technicians which check thoroughly every component without using advanced
electrical equipment. Basically, it is a more complete version of the MI.
Oil Analysis, OA – 2 times per year: a sample with oil from the transformer is sent to a specific
laboratory. This laboratory tests it to different compounds and gives a grounded report about the
state of several components of transformer.
Infra-red tests, IR – 1 time per year: a specific company is hired to take infra-red pictures
throughout the substation, providing information regarding the temperature of key components
in the substation. It is quite effective in the way it detects easily asymmetries with the temperature
distribution along the transformer. For instance, if one bushing is damaged, by comparison with
the other two, this one is going to denote a different temperature, which allows a quite intuitive
conclusion regarding its state.
Electrical Tests, ET – 1 time every three years: a group of hired technicians and engineers goes to
the wind farm and, with the production stopped, perform several electrical tests. This group has
to bring with them specific equipment and they can test several parameters such as the resistances

-11-
of insulators, the core and winding responses to several types of input quantities and the well-
functioning of the tap changer.
1.5 Introduction to Programming
The software will be divided into two programs: one main program, written in C language, which is a
typical high-level language for programming; and one secondary program, responsible for the graphical
looks of this tool, developed in C++ language (as opposed to C, it facilitates image control).
According to the software’s purposes, the programmer shall write a code in a given language, using its
proper rules. This code is not more than a succession of instructions that the programmer wants the
processer to execute. Although, the processor does not “understand” words or letters, therefore the code
shall be translated into machine language by programs inherent to the computer (compilation). As this
procedure is also done by a computer program, the programmer must oblige a serious of language rules so
the code can be translated. After the compilation, the user has access to an executable, which is the
program itself (Kernighan, et al., 1998).
The guidelines for the program are:
Open a window with instructions (so the user knows how to operate the program);
Automatic reading of documents (that contain the results from the transformers’ tests);
Interaction with the user, being able to present:
o A ranking with the health of the different transformers;
o Specific information regarding the different transformers;
o A map of Europe with colorful dots representing the different wind farms (the color
would change according to different risk index values).
The structure of a complex program is usually quite organized. There is one main file, where the program
starts and ends, which should be simple and use few lines. For this to be possible, the programmer has to
“call” functions that are defined in other files. Therefore, only in these files it is possible to find more
specific code. Nevertheless, there has to be always an effort to use data abstraction. This is a concept used
in programming which refers to maintaining the code “clean”; that is, instead of very long functions and
using a lot of numbers, one should always divide functions, by calling other functions to process smaller
steps, which shall have intuitive names. The numbers shall be replaced by codes, which are words that
represent numbers and are defined elsewhere; the advantage is that words explain clearly what the number
is, whereas a code full of numbers is very hard to understand. Besides this concept, the programmer shall
also follow other guidelines. Using adequate data structures so the program is fast to access the
information and it does not take much space in the disk. Robustness is also a concept to be respected, as it
is related to the ability of the program to deal with unexpected inputs by the user without breaking down
or stop it from continuing. Lastly, one shall design the program to be as fast and efficient as possible. For
that, good algorithms and solutions must be used to handle the different problems that appear during the
programming of complex projects.

-12-
2 Methodology
The implementation of the Risk Index to a whole fleet of transformers has to be done through a
systematic method; as so, a computer program comes up as the most systematic tool known nowadays. To
design this software, efficient programming will be used, taking into account the best possible balance
between memory usage and computing speed. However, before implementing the program, one must
have the theoretical part developed.
The theoretical part consists of developing formulas which are based on the possible outcomes of a
transformer break-down. This requires much research regarding transformers’ tests and characteristics. To
complement that knowledge, the contribution of the experienced workers on the electrical central
maintenance department of EDPR is also fundamental to accomplish a solid Risk Index. Providing the
Risk Index with true cases that happened with transformers in EDPR is also important to fine tune the
final tool.

-13-
3 Health and Risk Index
In this chapter it is explained, step by step, how to calculate both the health and the risk index. Firstly,
there is the need to know what is available to EDPR and what is important within that information.
Secondly, an algorithm must be developed in order to put it together in two different numbers, the Health
Index and the Risk Index.
3.1 Available Tests
Different parameters are studied when tests are performed on the transformers. In this chapter, a list of all
the available parameters is presented, providing also information on the origin of the test and what the
assessment system is. For example, OA stands for Oil Analysis and AS2 for Assessment System 2, later
explained. In Annex I it is possible to find complete information on what exactly are the tests for each
parameter and a more detailed explanation of the causes.
1. Dissolved Gas, DG – according to the different amounts of gases present in the gas, it is
possible to conclude whether there are problems related to electrical discharges or to thermal
faults. Measuring the quantities of hydrogen and carbon monoxide it is also quite important to
detect possible problems with the windings and/or paper insulator at an early stage. The sources
for this information are mentioned when the assessment systems are explained.
1.1. Hydrogen, H2 – if hydrogen is being produced inside the transformer, it is very likely there
is a problem with the windings.
a) OA – AS2
1.2. Carbon Monoxide, CO – certain amounts of this compound are indicators of a defect in
the paper insulator.
a) OA – AS3
1.3. Partial Discharges, PD – it happens due to one of these reasons: incomplete impregnation
or humidity in the paper insulator, oversaturation of the oil, or cavitation.
a) OA – AS4
1.4. Low Energy Discharges, D1 – it might happen between bad connections in fittings,
bushing and tank, between windings and on the tap-changer.
a) OA – AS4
1.5. High Energy Discharges, D2 – serious damages with the bushings or windings are likely to
cause arcing between themselves and between them and other components, releasing gases
which are detected in this test.
a) OA – AS4
1.6. Thermal Fault, T<300°C, T1 – these faults are likely to be caused by overloading. If not, it
may also be triggered by problems with the oil circulation.
a) OA – AS4
1.7. Thermal Fault, 300°C<T<700°C, T2 – this problem may be related either with problems
in connections, such as the tap changer or the bushings connections, or on the insulators
between the turns of the windings.
a) OA – AS4
1.8. Thermal Fault, T>700°C, T3 – These temperatures are reached in case of serious problems
with the core and/or windings, which cause situations such as discharges between the core and
the tank, currents through the tank surface or short-circuits between the core’s plates.
a) OA – AS4
2. Moisture, Mois – moisture refers to the percentage of water present within the oil. Although it
makes part of the Physical-Chemical tests, as it is a very good indication on the state of the paper
insulator, it was decided it should feature as a separated parameter. Moisture is also highly
undesirable for the transformer because it ruins the dielectric functions of the oil.
a. OA – AS5

-14-
3. Physical-Chemical, PC – it tests features such as color, dielectric functions and water content.
a. OA – AS1
4. Sulfur Compounds, SC – this test looks for sulfur compounds within the oil. This chemical
element is an indicator that the oil is not OK, as it changes its dielectric features (Wan, et al.,
2013), but it also means the copper wires are being corroded.
a. OA – AS1
5. Furanic Compounds, FC – these compounds, if existing, are the result of insulating paper
degradation.
a. OA – AS1
6. Oil level, OL – in every transformer there is an indication on the oil level inside the transformer.
If it is out of the limits, several types of problems might be occurring; for example, if the upper
limit is reached, it may be related with dilatation of oil due to high temperatures or if the level is
below the lower limit, the transformer might be losing oil when it shouldn’t.
a. MI
b. RM
7. Oil Leakages, OLk – problems with the tank, oil conservator or valves might cause oil leakages.
a. MI
b. RM
8. Tap Changer Oil Level, TCOL – also in the tap changer there is an oil system that needs to be
checked.
a. MI
b. RM
9. Tap Changer Oil Leakages, TCOLk – this test is just a verification if there are any oil leakages
coming from the tap changer.
a. MI
b. RM
10. Insulator of Bushings, BIns – the bushing insulators should also be inspected regularly, since the
transformer loses drastically its efficiency or even stops working if problems happen with the
bushings.
a. MI
b. RM
c. ET
11. Radiators, Rad – this a simple test in which the technicians do a visual inspection to the radiators.
a. MI
b. RM
12. Forced Cooling Operation, FCO – verifying if the ventilation of the radiators is working
properly.
a. MI
b. RM
13. Silicagel, S – it is a visual test to the silicagel, if it shows signs of being saturated in water, it has to
be changed.
a. MI
b. RM
14. Ground Connections, GC – proper ground connections are very important for the well-
functioning of the transformer, therefore it should be always checked.
a. MI
b. RM
15. Control Cabinet, CC – inspection to the control cabinet to verify if everything is working
accordingly to what is expected.
a. MI
b. RM
AS9
AS9
AS9
AS9
AS9
AS9
AS9
AS9
AS9
AS10

-15-
16. Neutral Switch, NS – the neutral cable has to be able to connect to the ground in case of
emergencies, therefore, this device, responsible for that function, must be regularly checked.
a. MI
b. RM
17. Highest Oil Temperature, HOT – each transformer has an indication on the highest oil
temperature registered since last check-up. This value is noted down once a month.
a. MI – AS6
18. Highest Winding Temperature, HWT – similar situation as the HOT, but with the winding
temperature.
a. MI – AS7
19. Tap Changer Condition, TCC – verification of the functionalities of the tap changer.
a. RM – AS1
20. Tap Changer Number of Operations, TCNO – every month the number of operations made by
the tap changer is registered.
a. MI – AS8
21. Highest Tap Changer Position, HTCP – it registers the highest position the tap changer got
every month, which is irrelevant for this study. This value depends much more on the grid and
the wind farm characteristics than on the transformer’s health.
a. MI
22. Lowest Tap Changer Position, LTCP – it registers the lowest position the tap changer got every
month, which is also irrelevant for this study, for the same reasons as the previous parameter.
a. MI
23. Temperature of HV Bushings, HVT – infra-red pictures provide information regarding the
temperature of the high voltage bushings.
a. IR – AS1
24. Temperature of MV Bushings, MVT – the same test as the previous one but for the medium
voltage bushings.
a. IR – AS1
25. Temperature of Radiators, RT – infra-red pictures provide information regarding the distribution
of the temperature along the radiators, which can be an intuitive indicator that something is
wrong.
a. IR – AS1
26. Foundations, F – verification of the support structure of the transformer.
a. RM – AS1
27. Gaskets and Seals, GS – verification of the seals and gaskets which are visible from the outside
of the transformer.
a. RM – AS1
28. Tank Corrosion, TC – inspection of the tank surface, checking for corrosion.
a. RM – AS1
29. Valves, Vlv – check-up of the well-functioning of the valves.
a. RM – AS1
30. Internal Insulators, IIns – evaluation of the insulation impedance between different points of the
transformer, testing mainly the paper insulator.
a. ET – AS1
31. Transformation Ratio, TR – verification of the transformer’s transformation ratio. If it is not
correct, it is likely either the windings or the tap changer are not ok.
a. ET – AS1
32. Excitation Test, ExT – tests to the core and windings of the transformer.
a. ET – AS1
33. Leakage Reactance Test, LkRT – verification if the short-circuit resistance and reactance is
according to what is expected.
a. ET – AS1
AS9

-16-
34. Static Resistance Tests, SRT – tests to the resistance of the windings.
a. ET – AS1
35. Dynamic Resistance, DR – check-up of currents’ characteristics while the tap changer is in
action.
a. ET – AS1
36. Sweep Frequency Response Analysis, sFRA – analysis of the transformer’s response to different
low voltage frequencies.
a. ET – AS1
-17-
3.2 Assessment Systems
The parameters are assessed by different entities and obviously not all of them come with the same scale.
Taking that into account, for the different kinds of rating and in order to standardize, different assessment
systems were developed.
3.2.1 AS1
The major part of the parameters come either as OK/notOK or as a small sentence saying the assessment
stating the result of test in a resumed way. This small sentence might say the parameter has had a good
performance, an OK performance, a negative performance or even that the value is highly worrying.
Therefore, according to these results, one can attribute the following values to the parameters:
4 – (OK by default) The parameter denotes what is expected (level 1 on EDPR’s damage scale,
explained in Annex II);
3 – The parameter is out of the usual, but not necessarily mal-functioning (level 2 on EDPR’s
damage scale, explained in Annex II);
2 – (Not OK by default) The parameter is out of the acceptable limits (level 3 on EDPR’s damage
scale, explained in Annex II);
1 – The parameter indicates that an urgent repair work is needed (levels 4 and 5 on EDPR’s
damage scale, explained in Annex II).
3.2.2 AS2
Hydrogen in the oil might mean many things because it is one of the firsts to be created once there are
electrical discharges in the oil. It is also known that the first problems in the windings involve small
discharges. Therefore, the presence of hydrogen becomes an indicator of possible symptoms that the
windings are starting to fail, even before other tests start show it. The limits that are going to define the
grade of this parameter are (Hamrick, 2010):
4 – Concentration < 150 ppm;
3 – 150 ppm ≤ Concentration < 1000 ppm;
2 – 1000ppm ≤ Concentration < 2000 ppm ;
1 – Concentration ≥ 2000 ppm.
3.2.3 AS3
The presence of carbon monoxide in the oil is a sign that the paper insulator might not be OK. Once the
cellulose which composes the paper starts degrading, CO is released (Lewand, 2006). The limits that are
going to define the grade of this parameter are (Hamrick, 2010):
4 – Concentration < 500 ppm;
3 – 500 ppm ≤ Concentration < 1000 ppm;
2 – 1000ppm ≤ Concentration < 2500 ppm ;
1 – Concentration ≥ 2500 ppm.
-18-
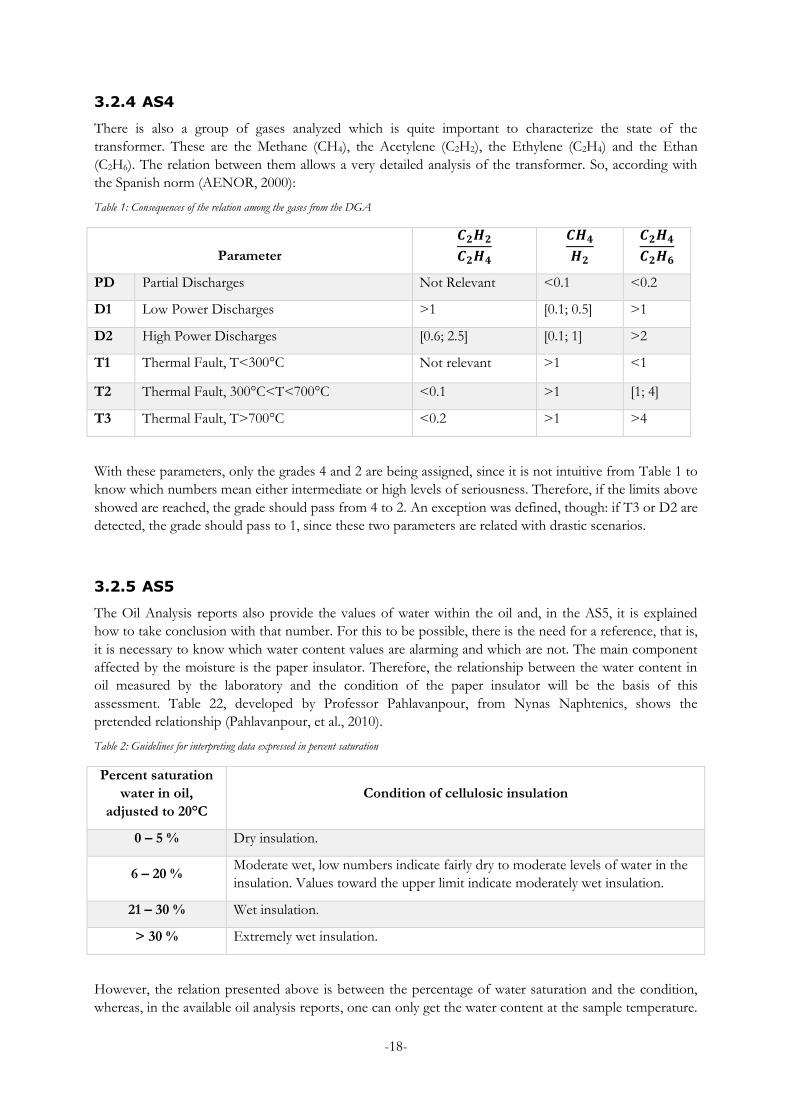
3.2.4 AS4
There is also a group of gases analyzed which is quite important to characterize the state of the
transformer. These are the Methane (CH4), the Acetylene (C2H2), the Ethylene (C2H4) and the Ethan
(C2H6). The relation between them allows a very detailed analysis of the transformer. So, according with
the Spanish norm (AENOR, 2000):
Table 1: Consequences of the relation among the gases from the DGA
Parameter
𝑪𝟐𝑯𝟐𝑪𝟐𝑯𝟒
𝑪𝑯𝟒𝑯𝟐
𝑪𝟐𝑯𝟒𝑪𝟐𝑯𝟔
PD Partial Discharges Not Relevant <0.1 <0.2
D1 Low Power Discharges >1 [0.1; 0.5] >1
D2 High Power Discharges [0.6; 2.5] [0.1; 1] >2
T1 Thermal Fault, T<300°C Not relevant >1 <1
T2 Thermal Fault, 300°C<T<700°C <0.1 >1 [1; 4]
T3 Thermal Fault, T>700°C <0.2 >1 >4
With these parameters, only the grades 4 and 2 are being assigned, since it is not intuitive from Table 1 to
know which numbers mean either intermediate or high levels of seriousness. Therefore, if the limits above
showed are reached, the grade should pass from 4 to 2. An exception was defined, though: if T3 or D2 are
detected, the grade should pass to 1, since these two parameters are related with drastic scenarios.
3.2.5 AS5
The Oil Analysis reports also provide the values of water within the oil and, in the AS5, it is explained
how to take conclusion with that number. For this to be possible, there is the need for a reference, that is,
it is necessary to know which water content values are alarming and which are not. The main component
affected by the moisture is the paper insulator. Therefore, the relationship between the water content in
oil measured by the laboratory and the condition of the paper insulator will be the basis of this
assessment. Table 22, developed by Professor Pahlavanpour, from Nynas Naphtenics, shows the
pretended relationship (Pahlavanpour, et al., 2010).
Table 2: Guidelines for interpreting data expressed in percent saturation
Percent saturation
water in oil,
adjusted to 20°C
Condition of cellulosic insulation
0 – 5 % Dry insulation.
6 – 20 % Moderate wet, low numbers indicate fairly dry to moderate levels of water in the
insulation. Values toward the upper limit indicate moderately wet insulation.
21 – 30 % Wet insulation.
> 30 % Extremely wet insulation.
However, the relation presented above is between the percentage of water saturation and the condition,
whereas, in the available oil analysis reports, one can only get the water content at the sample temperature.

-19-
(4)
(5)
So, with the next formula, one has to pass the water content (WC) to the given percentage. It is also
needed the temperature at which the oil was when the sample was taken (T).
%𝑠𝑎𝑡 =𝑊𝐶
𝑊𝑆× 100,
𝑊𝑆 = 107−1567 𝑇⁄ .
Once this number is obtained, one can finally evaluate the results from 1 to 4.
Table 3: Grading the moisture parameter
Percent saturation
water in oil,
adjusted to 20°C
Grade
0 – 5 % 4
6 – 20 % 3
21 – 30 % 2
> 30 % 1

-20-
3.2.6 AS6
The highest oil temperature is taken once a month and is a good indicator on the possible overloading of
the transformer. All transformers come with information regarding the maximum oil temperature above
the ambient temperature the transformer is able to handle, ΔTO. Taking that into account, the following
scale is applied to the results every month.
A – T < Tmax+ΔTO
B – Tmax+ΔTO < T < Tmax+ΔTO+10
C – Tmax+ΔTO+10 < T < Tmax+ΔTO+20
D – T > Tmax+ΔTO+20
T = Maximum oil temperature registered that month
Tmax = average maximum temperature that month in that region
One should mention that, for the warmest months, this scale is not very useful. All the transformers are
set to send an alarm once the temperature reaches ΔT+30 (30 as in 40 oC, the warmest ambient
temperature possible, minus 10oC, for safety) and they will stop when ΔT+40 oC is reached. Therefore, if
the temperature that month does reach 40 oC, the transformer is not be allowed to get to the grades C or
D.
However, if a limit is reached in one month, it does not mean there is reason for worrying. Hence, it is
needed a storing process of information: one has to know the amount of times the temperature of the oil
passed beyond the acceptable values. Once this number is sufficient to be alarming, the parameter will
start changing. For example, if one transformer is rated B for 6 months, C for 3 and was never rated D
this parameter will score 3. The chain for this logic is in Figure 14 (any situation that does not fit in the
considered intervals means the score is 1).
Figure 4: Scheme of AS6
ScoreNDNCNB
0 - 12
0 - 20 4
1 - 2 2
3 - 6 0 3
13 - +∞0 - 2 0 3
3 - 6 0 2

-21-
3.2.7 AS7
The highest winding temperature is taken once a month and is a good indicator on the possible
overloading of the transformer. All transformers come with information regarding the maximum winding
temperature above the ambient temperature the transformer is able to handle, ΔTW. Taking that into
account, the following logic is applied to the results every month.
A – T < Tmax+ΔTW
B – Tmax+ΔTW < T < Tmax+ΔTW+10
C – Tmax+ΔTW+10 < T < Tmax+ΔTW+20
D – T > Tmax+ΔTW+20
T = Maximum oil temperature registered that month
Tmax = average maximum temperature that month in that region
However, AS7 pretends to indicate if a specific transformer has suffered overloading. For that, it needs a
storing process of information: it will store the amount of times the temperature of the oil passed beyond
the acceptable values. Once this number is sufficient to be alarming, the parameter will start changing. For
example, if one transformer is rated B for 6 months, C for 3 and was never rated D this parameter will
score 3. The chain for this logic is in Figure 5 (any situation that does not fit in the considered intervals
means the score is 1).
Figure 5: Scheme of AS7
ScoreNDNCNB
0 - 12
0 - 20 4
1 - 2 2
3 - 6 0 3
13 - +∞0 - 2 0 3
3 - 6 0 2

-22-
3.2.8 AS8
Quantitative – According to several manufacturers of tap changers, such as Leminsa, Maschinenfabrik Reinhausen and HM, the total number per year should not exceed 15.000 operations (Maschinenfrabrik Reinhausen, 2013). Therefore, taking that into consideration:
4 – N<AN
3 – AN<N<1.2AN
2 – 1.2AN<N<1.5AN
1 – N>1.5AN
N – Number registered that month
AN – Average Number (AN is assumed to be 1250, which is 15.000 divided by 12 months)
3.2.9 AS9
This assessment system and the next one were developed to deal with information coming from different
sources. In this specific system, the grade that prevails is the last one. The parameters using this
assessment system use AS1 to evaluate the results from each test and, then, keep the last updated value.
3.2.10 AS10
Similarly to AS9, this system starts by evaluating the results from each of the latest tests with the AS1. The
difference is that the type of test which prevails depends on its accuracy, on the results themselves and on
how recent the results are. In terms of accuracy, the Electrical Tests are more accurate than the Regular
Maintenance, which is more accurate than the Monthly Inspection (enough to compare among these three
because the other tests do not use this system). So, if the latest grade obtained in any of the three is worse
or equal than the ones previously registered, this is the one to prevail. However, if a MI does not detect a
problem which was detected in the last RM or ET, the final grade has to be the one from the most
accurate test. The same situation between the RM and the ET.

-23-
3.3 Relation between the Available Parameters and the
Transformer’s Components
In this chapter, a list with all the relevant components of the transformer is presented. Each component is
related to the available parameters in a probabilistic way. For example, if the Dissolved Gas Analysis
accuses a problem, one cannot say, with certainty, the problem comes from the steel core or the windings,
the paper insulator or the oil itself. One can only say what the more probable causes are. Thus, each
component shows the influencing parameters. To each parameter, within a component, a percentage is
attributed; this pretends to define the importance a specific parameter has to the health of a certain
component.
Steel Core
Table 4: Influencing parameters for the steel core
Parameter Share Reason
1.8-T3 20% Serious problems with the core, such as space between the metallic laminas, are likely to increase vibration and, therefore, overheating. 17-HOT 20%
32-ExT 10% This is mainly a test to the windings, but if the magnetic circuit is not good, this test will not be OK.
33-LkRT 25% Of course that leakages from the magnetic circuit is directly related with the quality of the steal core.
36-sFRA 25% A damaged core is likely to create undesirable harmonics which are detected in this test.
Windings
Table 5: Influencing parameters for the windings
Parameter Share Reason
1.1-H2 10% Possible short-circuits between coils cause the release of hydrogen particles which are detected in the gas analysis.
1.5-D2 10% If there are arcs between windings or sparks, this test will detect it.
1-T1,T2,T3 10% Depending on the seriousness of the problem there will be more or less heat release from the windings.1
4-SC 6% Problems in the copper might also be detected with the sulfur compounds tests, produced when the copper is corroded.
18-HWT 20% More direct than the oil analysis, this parameter is effective to detect higher temperatures within the windings.
31-TR 11% If the windings are unbalanced, meaning that at least one of them has a problem, this test will detect it.
32-ExT 11% This test is specifically designed to detect problems with the windings impedance and conductance in conditions that other tests cannot.
34-SRT 11% If something is wrong with the impedance of the windings, this test is very likely to detect it.
36-FRA 11% If the windings are damaged, its frequency response will probably be out of the norm.

-24-
Paper Insulator
Table 6: Influencing parameters for the paper insulator
Parameter Share Reason
1.2-CO 10% CO will be released when the first problems with the paper insulator starts failing.
1-PD, D1, D2
10% If this component is damaged, it is likely both the thermal and the electrical
insulation within the windings start to fail.1 1.7-T2 10%
2-Mois 20% It is known that moisture is a very good indicator on the paper state.
3-PC 5% Eventual paper degradation is able to change the physical-chemical characteristics of the oil.
5-FC 30% The more degradation of the paper insulator, the more furanic compounds are detected in the oil.
30-IIns 15% If the electrical features of the insulator are not good, it means the paper insulator is experiencing problems as well.
Bushings
Table 7: Influencing parameters for the bushings
Parameter Share Reason
1-D1, D2 10% It is on the bushings that more electrical potential is focused, therefore, it is normal that, if a problem occurs with them, electrical discharges will take place.1
1.6-T1 10% A bad connection with the bushings and the current may have to pass through a thinner “path”, which means overheating.
10-BIns 30% Electrical and visual inspection to the bushings are crucial to evaluate their state.
17-HOT 5% Bushings with problems are very likely to overheat and transmit this heat to the oil.
23-HVT 25% If the infra-red tests show an anomaly with one of the bushing’s temperature, there is reason for concern. 24-MVT 20%
1 In case that one of the components is influenced by more than one discharge or thermal parameter, they will not be taken into account more than once. That is, instead of one component having a different percentage, for example, for D1 and D2, it will be the same parameter for both, if one of the two is evaluated with 2, it is enough for the parameter to get that grade.

-25-
Tap Changer Mechanics Table 8: Influencing parameters for the tap changer
Parameter Share Reason
1.4-D1 10% Serious problems with the tap changer might cause electrical discharges between the device and the tank.
1.7-T2 10% The possibility of existing a loose connection with the tap changer exists and, if every piece is not properly installed, there might be overheating coming from this component.
8-TCOL 10% The oil level is always a good indicator on the well-functioning of any device.
9-TCOLk 10% Oil leakages are also a possible concern.
17-HOT 5% This parameter is important for the same reason the 1.7-T2 is.
19-TCC 15% The verification of all the functionalities of the tap changer is one of the most important parameters.
20-TCNO 10% If the number of operations performed by the tap changer is significantly different from the usual, there might be reasons for concern.
31-TR 5% If the mechanical part of the tap changer has a problem, it may affect the transformation ratio.
35-DR 25% This test is specific to test the resistance of the transformer while the tap changer is working.
Radiator
Table 9: Influencing parameters for the radiator
Parameter Share Reason
1.6-T1 10% The smallest problems related with high temperature might be caused by lack of refrigeration.
6-OL 15% Problems with the oil level are probably related with refrigeration miss-functioning.
11-Rad 25% A watchful eye from experienced technicians might detect a damaged radiator.
17-HOT 20% If the radiators are not working fine, the oil is likely to reach undesirable temperatures.
25-RT 30% An infra-red shot to this component might be very elucidative regarding its state.
Fans
Table 10: Influencing parameters for the fans
Parameter Share Reason
12-FCO 100% This is a test where the fans are forced to work and its well-functioning is verified.
Oil
Table 11: Influencing parameters for the oil
Parameter Share Reason
3-PC 50% The oil quality depends mainly on its physical-chemical properties and on the presence of sulfur compounds. The other tests performed on the oil are solely indicators of the state of other components of the transformer. 4-SC 40%
17-HOT 10% If the oil is not OK, the transformer tends to overheat more.

-26-
Control Cabinet
Table 12: Influencing parameters for the control cabinet
Parameter Share Reason
15-CC 100% It is the only parameter that is related with the control cabinet state.
Tank and Oil Conservator
Table 13: Influencing parameters for the tank and oil conservator
Parameter Share Reason
6-OL 10% If the oil level is not OK, there is a slight chance it is related to damages in the oil conservator or in the tank.
7-OLk 50% If there are leakages, it is quite likely they come from problems with the transformer’s structure.
28-TC 40% Visual inspection for corrosion can tell much about the tank and the oil conservator.
Ground Connections
Table 14: Influencing parameters for the ground connections
Parameter Share Reason
14-GC 100% It is the only parameter that is related with the ground connections’ state.
Smaller Components
Neutral disconnectors
Valves
Silica gel
Seals and gaskets
Support Structure
Table 15: Influencing parameters for the smaller components
Parameter Share Reason
13-S 20% For each one of these small components, there is only one simple test. As they all figure within the same parameter, the percentages are the same for all. These smaller components are easy to fix, so the moment the problem is detected,
it is obvious for the technicians what to do. Nevertheless, if, for some reason, the
device is not fixed, it might represent a risk to the transformer.
16-NS 20%
26-F 20%
27-GS 20%
29-Vlv 20%

-27-
To conclude this chapter it would be interesting to observe which parameters are used the most to
evaluate the different components. Table 16 shows the group of parameters that are used more than once.
Table 16: Most used parameters
Steel Core Windings Paper insulator Bushings
Tap Changer Mechanics Radiator Oil Tank count
1-DGA 20% 30% 30% 20% 20% 10% 0% 0% 6
3-PC 0% 0% 5% 0% 0% 0% 45% 0% 2
4-SC 0% 6% 0% 0% 0% 0% 40% 0% 2
6-OL 0% 0% 0% 0% 0% 15% 0% 10% 2
18-HOT 20% 0% 0% 5% 5% 20% 15% 0% 5
31-TR 0% 11% 0% 0% 5% 0% 0% 0% 2
32-ExT 20% 11% 0% 0% 0% 0% 0% 0% 2
36-FRA 25% 11% 0% 0% 0% 0% 0% 0% 2
This way, it is possible to conclude the Dissolved Gas Analysis, as the test that can more easily identify
different kinds of problems, is the one that is more often taken into consideration and, therefore, the most
influent. Also because five out of the six components it influences are crucial for the transformer’s well-
functioning. Right after, there is the Highest Oil Temperature; the reason for this is related with the fact
that almost any problem with the transformer causes an increase of temperature of the oil.
These two tests are also the indicated to detect overloading, problems with the insulation and moisture;
which were the causes mentioned in the introduction to a company such as EDPR.

-28-
(6)
(7)
(8)
(9)
3.4 Fail Index
It is important to EDPR to have an idea of the probability of failure of its transformers. Therefore, to
provide this information, a simple formula was developed.
From the previous chapters, one can relate the parameters with the state of each component with a certain
amount of certainty. So, it is possible to evaluate each component based on the effect of different
parameters. For example, the oil’s probability of failure is influenced in the following way:
45% - Physical-Chemical Test, PC;
40% - Sulfur Compounds, SC;
15% - Highest Oil Temperature, HOT.
Although each parameter is evaluated from 1 to 4, each component will have a probability of failure from
0 to 1. Therefore, before anything else, the grades of the parameters have to pass to a similar scale:
4 – 0;
3 – 1/3;
2 – 2/3;
1 – 1.
Now, it is possible to say the Oil’s Probability of Failure (from 0 to 1) is:
𝑃𝐹𝑎𝑖𝑙(𝑂𝑖𝑙) = 0.45 × 𝑃𝐶 + 0.4 × 𝑆𝐶 + 0.15 × 𝐻𝑂𝑇 .
So, in general, for a component x, influenced by n parameters P, with a certain weight W, the formula is:
𝑃𝐹𝑎𝑖𝑙(𝑐𝑜𝑚𝑝 𝑥) = 𝑊1. 𝑃1 +𝑊2. 𝑃2 +⋯+𝑊𝑛. 𝑃𝑛 .
To get the final Fail Index, an association between the state of each component and the influence it has on
the overall state of the transformer shall be made. The final formula chooses the components that have
the possibility to cause breakdowns; the one with the highest percentage of failure becomes, logically, the
percentage of failure of the transformer. There is a slight exception because it exists a component which
aggregates two different components, the ground connections and the oil. This is because these two
smaller devices are less influencing in what refers to breaking-down the transformer. For example, if there
is a problem with the ground connections, the transformer might still work for a while, with a very bad
efficiency, though. The same happens with the oil. It is true that, most of the times, damages in the tap-
changer would not cause a severe failure on the transformer. Although, it was seen in Figure 3 that this
was the component responsible for more severe and intermediate failures. Followed by the bushings and
windings, which are also taken into consideration in Equation 8.
𝐹𝑎𝑖𝑙 𝐼𝑛𝑑𝑒𝑥 = 𝑀𝐴𝑋 (𝑃𝐹𝑎𝑖𝑙(𝐶𝑜𝑟𝑒); 𝑃𝐹𝑎𝑖𝑙(𝑊𝑖𝑛𝑑𝑖𝑛𝑔𝑠); 𝑃𝐹𝑎𝑖𝑙(𝑃𝑎𝑝𝑒𝑟𝐼𝑛𝑠𝑢𝑙𝑎𝑡𝑜𝑟);
𝑃𝐹𝑎𝑖𝑙(𝐵𝑢𝑠ℎ𝑖𝑛𝑔𝑠); 𝑃𝐹𝑎𝑖𝑙(𝑇𝑎𝑝𝐶ℎ𝑎𝑛𝑔𝑒𝑟); 𝑃𝐹𝑎𝑖𝑙(𝑂𝑖𝑙&𝐺𝐶)) ,
PFail(Oil&GC) =𝑃𝐹𝑎𝑖𝑙(𝑂𝑖𝑙)+𝑃𝐹𝑎𝑖𝑙(𝐺𝑟𝑜𝑢𝑛𝑑𝐶𝑜𝑛𝑛𝑒𝑐𝑡𝑖𝑜𝑛𝑠)
2 .

-29-
3.5 Risk Index
The level of complexity of this index is substantially higher. The first big difference to the Fail Index is
that it needs more information. The second difference is that it really needs elaborated formulas so it is
possible to look at one number and conclude about the importance of spending resources on that specific
transformer.
3.5.1 Differentiating Components
To assess the seriousness of the situation when a component gives away a bad performance, a range of
characteristics were taken into account in order to differentiate the components in a systematical way.
Table 17 shows the variables that are used to categorize the components, which will be useful for the risk
index.
Table 17: Characteristics which differentiate the components
Description Code Units
Cost of device The cost of this specific component. CDev €
Probability to be fixable
Probability of, once this component breaks down, to be fixed without replacing it.
PFix 0->1
Time to fix Time the transformer has to be stopped so the component
can be fixed. TFix day
Time to replace Time the transformer has to be stopped so the component
can be replaced. TRep day
Time to manufacture
Time the specific device takes to be ordered, manufactured and brought to the wind farm.
TMan Day
Probability of availability in stock
How probable it is to exist a replacement in stock. PAv 0->1
Probability to cause major failure
Probability of, once this component breaks down, a major repair is needed in order to fix it.
PMF 0->1
The cost of a device is not a constant quantity, though. The price of a tap changer for a transformer of 20
MW is not the same as for one of 50MW. Also the high and low voltage of the transformer might change
the price of a specific device, but as it does not happen always and it is too complicated to form an
algorithm for such a small change in the overall risk index, the voltages will not be taken into
consideration. The solution for the differences in price varying with the power was to ask not only for one
price, but for three. One theoretical component price for a 30 MW transformer, one for 50 MW and a last
one for 80 MW. With this information, the program will interpolate the values for transformers with other
power capacities (Figure 6).
Figure 6: Example of interpolation, defining the price for the powers 30,50 and 80 MW
0
2000
4000
6000
8000
10000
12000
30 50 80
Pri
ce
Power
Relation between the price of a component and the power of the transfromer

-30-
3.5.2 Differentiating Transformers
Once the components are differentiated within the transformer, one has to use the same logic among the
transformers. The characteristics taken into consideration are presented in Table 18:
Table 18: Features which differentiate the transformers
Description Code Units
Possible Power Outage The power capacity which is compromised, if the
transformer has to stop. PPO MW
Brand/Manufacturer Quality
Quality of the transformer depending on the manufacturer.
MnQ 1->3
Brand/Manufacturer Reliability
Evaluation of the trustworthiness of the manufacturer, in terms of support provided in case of breakdowns.
MnR 1->3
Country of Manufacturer
The further away the manufacturer is from the transformer, the less likely it is for assistance to be provided in case of problems with a transformer.
MnC 1->3
Age From the date of production, the program calculates
the age of the transformer. Age Year
Guarantee From the expiration date of the guarantee, the program
tells if the transformer is in guarantee or not. Gr 1-0
Cost of Transformer The price of the transformer. CTf €
Power Capacity With these three characteristics, the program is able to considerate if there are permanent or/and temporary
replacements available in the EDPR fleet for a specific transformer (see Annex V).
APRep ATRep
1-0 High Voltage
Low Voltage
Oil Temperature Limit It is needed for the Assessment System 6. ΔTO K
Winding Temperature Limit
It is needed for the Assessment System 7. ΔTW K
Country installed According to the country and district installed, the following characteristics change.
District installed
Price of electricity per month2
Price the electricity is sold in this specific country. EPr €/MWh
Cost of workforce Price of the workforce when this is ordered with a
reasonable time in advance. CWf1 €/day
Cost of workforce urgently
Price of the workforce when this is ordered with an urgent demand.
CWf2 €/day
Capacity factor2
Factor which is multiplied to the PPO, which, according to the expected wind speed for each month,
damps, more or less, the power capacity.3 Fppo 0->1
Workforce waiting time Time the workforce takes to be “ordered” and to arrive
at the wind farm. TW day
Distance to warehouse Distance from the wind farm to the warehouse. DW km
2 As repairs and decisions to repair take time, this factor will be half a month in advance when the program makes its calculations. 3 Technically, this value can only be accurate if specified for each wind turbine. Turbines may be dimensioned to have their maximum power capacity at different intervals of wind speed, therefore, for the same wind speed, some might be producing on their maximum capacity and others might not. Nevertheless, those differences are not that relevant in case of EDPR because its farms have all the same purpose (to sell energy to the grid) and, therefore, the differences on the output power curves of wind turbines cannot vary much.

-31-
(10)
3.5.3 Other Important Factors
It is assumed the cost to repair a transformer in a repair center and its transportation depends on too
many variables to be possible to predict according to the type of transformer or on the results of the
parameters. Therefore, an approximate price is defined based on EDPR experience and it is the same for
all the transformers. The same logic is applied to the time the major repair takes. Codes: CMR [€] and
TMR [day].
The time to replace a transformer is also important for the calculations, although, it is not supposed to
change with the available parameters, thus, it shall be considered the same for all the program’s situations.
Code: TfRep [day].
In order to calculate the cost related to the transportation of a possible substitute from the warehouse to
the wind farm, besides the distance (DW from Table 188), it depends on the average truck speed so it is
possible to calculate the time it will take to arrive to the farm. Code: ATS [km/h].
If, by any chance, there is the need to wait for a transformer to be manufactured, one needs an estimation
of the time to manufacture. It represents the time the transformer takes to be ordered, manufactured
and brought to the wind farm. Code: TfMan [day].
The average maximum temperature at a certain region is useful for the Assessment Systems 6, 7 and 8
and has to be provided to the program as well. Code: Tmax [ºC].
3.5.4 Risk Index Calculation
In this chapter it is explained how the risk index is obtained. The so called “risk index” pretends to
prioritize the transformers according to their health status and importance. As usual in the enterprise
world, importance means money. Therefore, the result of the index is bonded to the costs that can be
avoided, which is the first sub-chapter: estimating the amount of money which is possible to be lost when
related to different specific problems that might occur with the transformer. The word risk brings with it a
notion of probabilities as well, because the problems previously calculated did not really happen yet,
therefore, the second sub-chapter explores how likely it is for this negative scenario to happen. Regarding
the word “index”, it implies that the final result for the RI is not given in euros or dollars, but in a scale
from 0 to 100. Thus, the last step is to relate the probable costs with a numeric and intuitive scale.
3.5.4.1 Consequences Calculation
The consequences of a failure are measured as the cost they might represent. Here, it is estimated the
troubles related to Minor Failures, when one of the components has a defect and it is possible to repair
the transformer in loco; and to Major Failures, when the transformer has to leave the wind farm and go to a
repair center, or even when it must be replaced.
These consequences are, logically, calculated in case EDPR does not take an action to prevent the failure;
otherwise, it would not be a risk calculation. Therefore, the costs are calculated assuming the component
has already broken down and corrective measures have to be taken as soon as possible.
Minor Failures
Starting with the minor failures, it was defined the index should consider the consequences related to a
problem in each of the components. That is, for each device which composes the transformer, there is a
an estimation on how much the damage will cost to EDPR. They are called “minor” because they are
related to components that, in principal, can be fixed or replaced in the substation, without the need to
take the transformer to a repair center. The formula for this calculation is:
𝐶𝑜𝑛𝑠(𝐶𝑜𝑚𝑝 𝑥) = 𝐺𝑟𝐶𝑜𝑛𝑠(𝐶𝑜𝑚𝑝 𝑥) + 𝑁𝑜𝐺𝑟𝐶𝑜𝑛𝑠(𝐶𝑜𝑚𝑝 𝑥).

-32-
(11)
(12)
331) (13)
(14)
(15)
(16)
(17)
The formula shows there is a term which is subject to the guarantee state, GrCons(Comp x), and another
which is independent from it, NoGrCon(Comp x). Regarding the first term (see Equation 11): if the
guarantee is expired, one has to consider the costs of fixing the component, CFix, and the costs of
replacing it, CRep. Each of the costs is multiplied by the respective probability, PFix and (1-PFix), which
is the probability of replacement, the complement of PFix. If the guarantee is still on, EDPR might still
have to pay; it depends on the reliability of the manufacturer, MnR, and on the country the transformer
was installed in relation to its manufacturer’s country, MnC (better explained on 3.5..2). As these two last
values are graded from 1 to 3 and a factor from 0 to 1 is needed, these are divided by three. This way, in
the best-case scenario (MnR=MnC=3), EDPR will not pay anything, whereas in the worst-case scenario
(MnR=MnC=1), EDPR will have to pay eight-ninths (8/9) of the expenses.
𝐺𝑟𝐶𝑜𝑛𝑠(𝐶𝑜𝑚𝑝 𝑥) = {𝑃𝐹𝑖𝑥. 𝐶𝐹𝑖𝑥 + (1 − 𝑃𝐹𝑖𝑥). 𝐶𝑅𝑒𝑝, 𝐺𝑟 = 0
[𝑃𝐹𝑖𝑥. 𝐶𝐹𝑖𝑥 + (1 − 𝑃𝐹𝑖𝑥). 𝐶𝑅𝑒𝑝] × (1 −𝑀𝑛𝑅
3
𝑀𝑛𝐶
3) , 𝐺𝑟 = 1
.
The determination of the cost to replace and to fix are shown in Equation 12 and 13, respectively. CRep
depends on the cost of the device to be replaced and on the time to replace it. The time to replace has to
be multiplied by the cost of the workforce, which depends on the availability of a replacement in stock,
PAv. If there is a replacement, the repair will take place as soon as possible, implying that the technicians
will be called with emergency, costing the EDPR a higher price for the workforce, CWf2. If the stock is
out, the repair will only take place when the replacement gets to the wind farm, implying a lower cost of
workforce, CWf1, since there will be time to contract the right technicians. The cost to fix depends solely
on the time to fix, TFix, and on the cost for urgent workforce.
𝐶𝑅𝑒𝑝 = 𝐶𝐷𝑒𝑣 + 𝑃𝐴𝑣. 𝑇𝑅𝑒𝑝. 𝐶𝑊𝑓2 + (1 − 𝑃𝐴𝑣). 𝑇𝑅𝑒𝑝. 𝐶𝑊𝑓1 ,
𝐶𝐹𝑖𝑥 = 𝑇𝐹𝑖𝑥. 𝐶𝑊𝑓2 .
Regarding the term independent from the guarantee state, NoGrCons(Comp x), similarly to the first term,
it depends mainly on the probability of the component to be fixable, PFix. The remaining factors to be
taken into account when replacing, C’rep, and fixing, C’fix, the component are taken into consideration in
Equation 14:
𝑁𝑜𝐺𝑟𝐶𝑜𝑛𝑠(𝐶𝑜𝑚𝑝 𝑥) = (1 − 𝑃𝐹𝑖𝑥). 𝐶′𝑟𝑒𝑝 + 𝑃𝐹𝑖𝑥. 𝐶′𝑓𝑖𝑥.
The time that the transformer is stopped while the problem is not taken care of is independent of the
guarantee state. C’rep (Equation 15) depends on the cost of the transformer to be stopped, CStop, and on
the time it will effectively be stopped. This time depends on the time to replace that specific component,
TRep, and on the probability of an available replacement in stock, PAv. This probability will determine if
EDPR only has to wait for the workforce to arrive to the wind farm, TW, or if it has to wait for the
replacement component to be ordered to the manufacturer and to arrive to the wind farm, TMan. C’fix
(Equation 16) depends only on the time to fix the given component, TFix, and on the time the workforce
takes to get to the wind farm, TW.
𝐶′𝑟𝑒𝑝 = 𝑃𝐴𝑣. (𝑇𝑅𝑒𝑝 + 𝑇𝑊). 𝐶𝑆𝑡𝑜𝑝 + (1 − 𝑃𝐴𝑣). (𝑇𝑀𝑎𝑛 + 𝑇𝑅𝑒𝑝). 𝐶𝑆𝑡𝑜𝑝 ,
𝐶′𝑓𝑖𝑥 = (𝑇𝐹𝑖𝑥 + 𝑇𝑊). 𝐶𝑆𝑡𝑜𝑝 .
CStop quantifies the cost for a given transformer to be stopped, calculated as the multiplication of the
power compromised, in MW, PPO, by the capacity factor, which depends on the time of the year, Fppo;
and on the electricity price in that country, in €/MWh, EPr. This cost is multiplied by 24 hours because it
is needed to be in €/day, as the unit used for all the times used in the previous formulas are also in days.
𝐶𝑆𝑡𝑜𝑝 = 𝑃𝑃𝑂. 𝐹𝑝𝑝𝑜. 𝐸𝑃𝑟 × 24 .
The future program should make these calculations for each component. However, there are some that
can never be associated to minor failures; these are the steal core, the windings and the paper insulator.

-33-
(18)
(19)
(20)
Major Failure
Once the problem existing with the transformer is not simply solved by replacing or fixing a given
component, it either goes to a repair center or its life has come to an end. If the transformer is quite old
and suffers a major failure, it will be recycled, not fixed. For this reason a probability is estimated in order
to accommodate the two different situations; Prob(new) is the probability of a new transformer to be
required. Besides that probability, the consequences of a major failure, ConsMF, also depend on the costs
related with a new transformer, ConsNew, and on the monetary consequences of sending the damaged
device to a repair center, ConsFix:
𝐶𝑜𝑛𝑠𝑀𝐹 = 𝑃𝑟𝑜𝑏(𝑛𝑒𝑤). 𝐶𝑜𝑛𝑠𝑁𝑒𝑤 + [1 − 𝑃𝑟𝑜𝑏(𝑛𝑒𝑤)]. 𝐶𝑜𝑛𝑠𝐹𝑖𝑥 .
According to the knowledge gathered, the probability of a new transformer to be needed, Prob(new),
depends on the age factor, AF (explained on 3.5.4.2), on the paper insulator state (using the calculations
already made for the Fail Index, PFail(Paper Insulator)) and on the quality of the manufacturer, MnQ. The
age factor and the state of the paper insulator are the most important factors and equally important, since
the paper insulator is an indicator on the usage of the transformer; therefore, they both have a weight of
45%. Not as important, but also a factor that might have a certain importance when deciding if the
transformer must be replaced forever, is the brand, MnQ, of this transformer. If it is a bad manufacturer,
it might not be worth the resources to fix it. It is true the age factor already takes MnQ into account, but
in that calculation, MnQ is used to assess fiscally the transformer; whereas, in Equation 19 it is used as a
factor to take a decision, just as an employee of EDPR would do.
𝑃𝑟𝑜𝑏(𝑛𝑒𝑤) = 45%.𝐴𝐹 + 45%.𝑃𝐹𝑎𝑖𝑙(𝑃𝑎𝑝𝑒𝑟𝐼𝑛𝑠𝑢𝑙𝑎𝑡𝑜𝑟) + 10%.3 −𝑀𝑛𝑄
2 .
The consequences related with a new transformer, ConsNew, depend logically on the guarantee, Gr,
because if it is still valid, the price of a new transformer, CTf, does not need to be taken into
consideration; and they depend on the costs to be stopped. Firstly, the cost to be stopped, per day, CStop,
is multiplied by the number of days expected for a replacement to arrive to the substation. This time
depends on the availability of a permanent replacement, APRep. Depending on this availability, EDPR
has to negotiate with suppliers and sub-contracted companies and wait either for a new transformer to
come from the manufacturer, TfMan, or for the permanent replace to be picked up at the warehouse, TW,
and brought to the wind farm. The time involved on the transportation of the device depends on the
distance between the wind farm and the warehouse, DW, and on the average speed of the truck, 24.ATS
(the units must be km/day). The cost of the actual transportation of the replacement transformer is being
neglected since it would represent a very small percentage of the whole consequences. Finally, there is the
time to change the damaged transformer for a replacement, TfRep; it has to multiplied by the cost to be
stopped plus the cost of the workforce, CWf1.
𝐶𝑜𝑛𝑠𝑁𝑒𝑤 = (1 − 𝐺𝑟). 𝐶𝑇𝑓 + 𝐶𝑆𝑡𝑜𝑝. {𝑇𝑊 +
𝐷𝑊
24.𝐴𝑇𝑆, 𝐴𝑃𝑅𝑒𝑝 = 1
𝑇𝑓𝑀𝑎𝑛, 𝐴𝑃𝑅𝑒𝑝 = 0+ (𝐶𝑆𝑡𝑜𝑝 + 𝐶𝑊𝑓1)𝑇𝑓𝑅𝑒𝑝 .
The consequences related with a major repair, ConsFix (Equation 21), follow the same logic as ConsNew.
If the transformer is still in guarantee, one must take into account the price of a major repair, CMR. If
there are no replacements available, whether permanent, APRep, whether temporary, ATRep, one must
wait for the transformer to be repaired, TMR; in case there is a replacement available, there is the time to
bring it to the wind farm. The time to replace a transformer must be accounted once or twice, depending
on the situation. If there is one temporary replacement available, but not a permanent one, the maneuvers
of exchanging a transformer will happen twice. If there is no transformer available, the transformer must
be taken from and installed back in the substation, without spending time to install and uninstall a

-34-
(21)
(22)
(23)
replacement, which means the total costs will be equivalent to only one maneuver of exchange (one
exchange is also the case of a permanent replacement).
𝐶𝑜𝑛𝑠𝐹𝑖𝑥 = (1 − 𝐺𝑟). 𝐶𝑀𝑅 + 𝐶𝑆𝑡𝑜𝑝. {
𝑇𝑊 + 𝑇𝑀𝑅, 𝐴𝑇𝑅𝑒𝑝 = 0 ∩ 𝐴𝑃𝑅𝑒𝑝 = 0
𝑇𝑊 +𝐷𝑊
24. 𝐴𝑇𝑆, 𝑜𝑡ℎ𝑒𝑟𝑤𝑖𝑠𝑒
+ 𝑇𝑓𝑅𝑒𝑝. (𝐶𝑆𝑡𝑜𝑝 + 𝐶𝑊𝑓1). {2, 𝐴𝑇𝑅𝑒𝑝 = 1 ∩ 𝐴𝑃𝑅𝑒𝑝 = 0 1, 𝑜𝑡ℎ𝑒𝑟𝑤𝑖𝑠𝑒
.
3.5.4.2 Probabilities
The probabilities, similarly to the consequences, are also calculated for two types of failure: one
contributes to the components failures, and the other, the age factor, influences damages related with
major failures.
Component Failure
The probability of one component to be damaged, PFail (comp x), was already shown how to calculate in
chapter 3.5. It is a direct consequence of the tests performed. However, even if the parameters cannot
detect any mal-functioning, there is always a probability of a certain device to fail. Thus, if nothing is
detected by the parameters, the probability should not be zero:
𝑃𝑟𝑜𝑏(𝑐𝑜𝑚𝑝 𝑥) = {𝑃𝑟𝑜𝑏𝐷, 𝑃𝐹𝑎𝑖𝑙(𝑐𝑜𝑚𝑝 𝑥) = 0
𝑃𝐹𝑎𝑖𝑙(𝑐𝑜𝑚𝑝 𝑥), 𝑃𝐹𝑎𝑖𝑙(𝑐𝑜𝑚𝑝 𝑥) ≠ 0 .
ProbD is the probability by default and it is assumed that, even if there is no indication of damage, the
component will fail 0.3% of the times.
Age Factor
It was also mentioned before an Age Factor, AF, which is a value related to the probability of a major
failure to happen, independently of the parameters’ results. Even if the tests do not show a flaw with the
transformer, there is always a slight chance something will go wrong either way. Here, it is assumed this
probability increases with time and with the quality of the manufacturer, providing also a way to
differentiate the assets, even if everything seems to be within the parameters. It is worth mention this is
not a real probability, but a factor; it just becomes a probability when multiplied by the other parameters
present in the formulas of the final Expected Value (chapter 2.5.4.3) and Major Failure calculations
(chapter 2.5.4.1).
The ABB transformer manual, among other sources, suggests that the relation between the probability of
failure and the transformer’s age is not a known or certified function, but that the most approximate
estimation is a bathtub shape (Figure 7). It is also suggested that the first couple of years are an exception
to this curve, since there is an additional probability related with problems in manufacturing and installing
the device (might take until two years to detect them). From other sources, such as Munich RE website, it
is said the quality of the manufacturer is determinant to the reliability of the devices. Therefore, the quality
of the EDPR’s transformers must be assessed from 1 to 3, according to their brand, in which 3 is the best
grade and 1 the worst.
In order to achieve a bathtub shape, it was defined a relation of AF ∝ age4, whereas to the first two years a
quadratic function was set as the best option. The function is presented in Equation 23.
𝐴𝐹 =
{
1 − 𝑃𝑟𝑎𝑛𝑑
𝐴𝑔𝑒𝑚𝑎𝑥4 × 𝐴𝑔𝑒4 + 𝑃𝑟𝑎𝑛𝑑 , 𝐴𝑔𝑒 > 2
1 − 𝑃𝑟𝑎𝑛𝑑
𝐴𝑔𝑒𝑚𝑎𝑥4 × 𝐴𝑔𝑒4 + 𝑃𝑟𝑎𝑛𝑑 + 𝑃𝐵𝑎𝑑𝑀𝑎𝑛 (1 −
𝐴𝑔𝑒2
4) , 𝐴𝑔𝑒 ≤ 2
.

-35-
(24)
(25)
Prand represents the probability of a brake-down to happen randomly, without any warning, and it is
constant throughout the lifetime of the transformer. Agemax is the age at which the age factor reaches its
maximum value. PBadMan represents the probability of the transformer has been badly manufactured, that
is, the transformer comes with inherent problems from the factory itself. These values depend only on the
brand, as it is possible see in Table 19.
Table 19: Factors that depend on the Manufacturer Quality
MANUFACTURER QUALITY PRAND AGEmax [year] PBADMAN
3 3% 55 3%
2 4.5% 52.5 4.5%
1 6% 50 6%
Taking into account what was said before, it is possible to trace the graph present on Figure 7.
Figure 7: Graph with AF(age)
3.5.4.3 Expected Value
The Expected Value, EV, has to be, invariably, a relation between the probability and the consequences
and it has to sum up all the different contributions. It has been seen that the contributions for possible
costs could come from a major failure or from a failure in each of the components. Therefore, summing
the 12 existing components with the major failure, one gets 13 contributions, Cont i:
𝐸𝑉 =∑𝐶𝑜𝑛𝑡 𝑖
13
𝑖=1
.
The first contribution is influenced by the age and brand of the transformers, that is, the Age Factor. Even
if the transformers have all the components in a perfect state, they will show up a bit differently in the
overall ranking. It was considered that this factor would bring, as consequences, major repairs:
𝐶𝑜𝑛𝑡 1 = 𝑀𝐹𝐹. 𝐴𝐹. 𝐶𝑜𝑛𝑠𝑀𝐹 .
MFF is called major failure factor and it makes sure that, after summing up all the contributions, the
probability to happen a major failure never exceeds 100%. In this case, MFF is always 0.15, which means
that even if the age factor, AF, becomes 1, it will only affect 15% of the actual probability of occurring a
major failure. The remaining 85% will come from the possibility of the components to cause major failure.
0
0,2
0,4
0,6
0,8
1
1,2
0 10 20 30 40 50 60
AF
Age [years]
AF
Brand 3
Brand 2
Brand 1

-36-
(26)
(27)
(28)
From the second to the thirteenth contribution, the formula is always the same (Equation 26). This is so,
because they all represent a component of the transformer that can cause both major and minor
consequences (except for the cases in which the probability of causing major failure, PMF, is either 0 or
1). If the state of the component is considered to perfect, PFail(comp x)=0, the consequences related with
a failure in that component, Cons(comp x), are simply multiplied by the probability of failure given by
default, ProbD. Otherwise, there will be a contribution to the major failure, composed of the probability
of that component to cause a major failure, PMF, times the probability of component x to fail, Prob(comp
x), times the consequences of a major failure, ConMF, times the complement of the major failure factor,
MFF’ (later explained). In case the major failure does not happen, (1-PMF), that probability should be
multiplied by Prob(comp x) and by the consequences related with that component, Cons(comp x).
𝐶𝑜𝑛𝑡 𝑥 = {𝑀𝐹𝐹′. 𝑃𝑀𝐹𝑥. 𝑃𝑟𝑜𝑏(𝑐𝑜𝑚𝑝 𝑥). 𝐶𝑜𝑛𝑠𝑀𝐹 + (1 − 𝑃𝑀𝐹𝑥). 𝑃𝑟𝑜𝑏(𝑐𝑜𝑚𝑝 𝑥). 𝐶𝑜𝑛𝑠(𝑐𝑜𝑚𝑝𝑥), 𝑃𝐹𝑎𝑖𝑙(𝑐𝑜𝑚𝑝𝑥) ≠ 0
𝑃𝑟𝑜𝑏𝐷. 𝐶𝑜𝑛𝑠(𝑐𝑜𝑚𝑝 𝑥), 𝑃𝐹𝑎𝑖𝑙(𝑐𝑜𝑚𝑝 𝑥) = 0 .
MFF’, complementing MFF, is the same for the 12 above contributions. Every time the state of a
component is not perfect, there is a probability that it causes a major failure, PMF. For instances, if the
steal core breaks down, there will be certainly a major failure, therefore PMF(steal core)=1; whereas if the
tap-changer suffers a damage, it has a probability of PMF(tap-changer)=0.6, since the transformer might
be fixed without the need of a major repair. The problem is that, after a certain number of components
damaged, the sum of the contributions to the EV (Equation 24), related to a major failure, might exceed
the reasonable limit, which is related to the total consequences of a major failure. This could happen
because the PMFs are estimated for each component, not taking into consideration that the sum of all the
probabilities that contribute to the major failure should never exceed 100%. One can see in Equations 25
and 26 that the factors multiplying the ConsMF are highlighted; this is just to help the reader to realize the
importance of the factors MFF and MFF’ in preventing the sum of those factors to exceed 1. Therefore,
to fight this problem, the program will be summing up the PMFs of the components, which are in a state
different from perfect, in a variable called SUM (Equation 28). Once this SUM is higher than 100%, MFF’
will start decreasing in a way that the sum of the factors MFF’.PMF is never higher than 0.85 (which is 1–
MFF). Equation 27 illustrates what it has been said:
𝑀𝐹𝐹′ = (1 −𝑀𝐹𝐹). {1, 𝑆𝑈𝑀 ≤ 100%
1𝑆𝑈𝑀⁄ , 𝑆𝑈𝑀 > 100%
;
𝑆𝑈𝑀 =∑{𝑃𝑀𝐹𝑥, 𝑃𝑟𝑜𝑏(𝑐𝑜𝑚𝑝 𝑥) ≠ 0
0, 𝑃𝑟𝑜𝑏(𝑐𝑜𝑚𝑝 𝑥) = 0
12
𝑥=1
.
The sum of all this contributions, the EV, will represent the money which is at stake at a certain moment.
3.5.4.4 Index
Regardless the monetary value, one has to look at the index and conclude instantaneously about the
seriousness of the situation. However, the amount of money which can be considered serious might be
relative; besides, after a certain point, what one sees when looking at the value is just a big number. To
avoid these problems, the decision makers in EDPR shall give their input in order to have a true reliable
scale, on their opinion. The relation between money and the scale of importance is most likely not linear,
therefore, the value function was developed using the bisection technic. The principle of this method is to
recursively find the middle point of importance between two monetary values. This is achieved using the
following example (A. Bana e Costa, 2013):
Find ‘X€’ so that the difference in importance
between 0€ and X€ is equal to the difference in
importance between X€ and 3,000,000€.
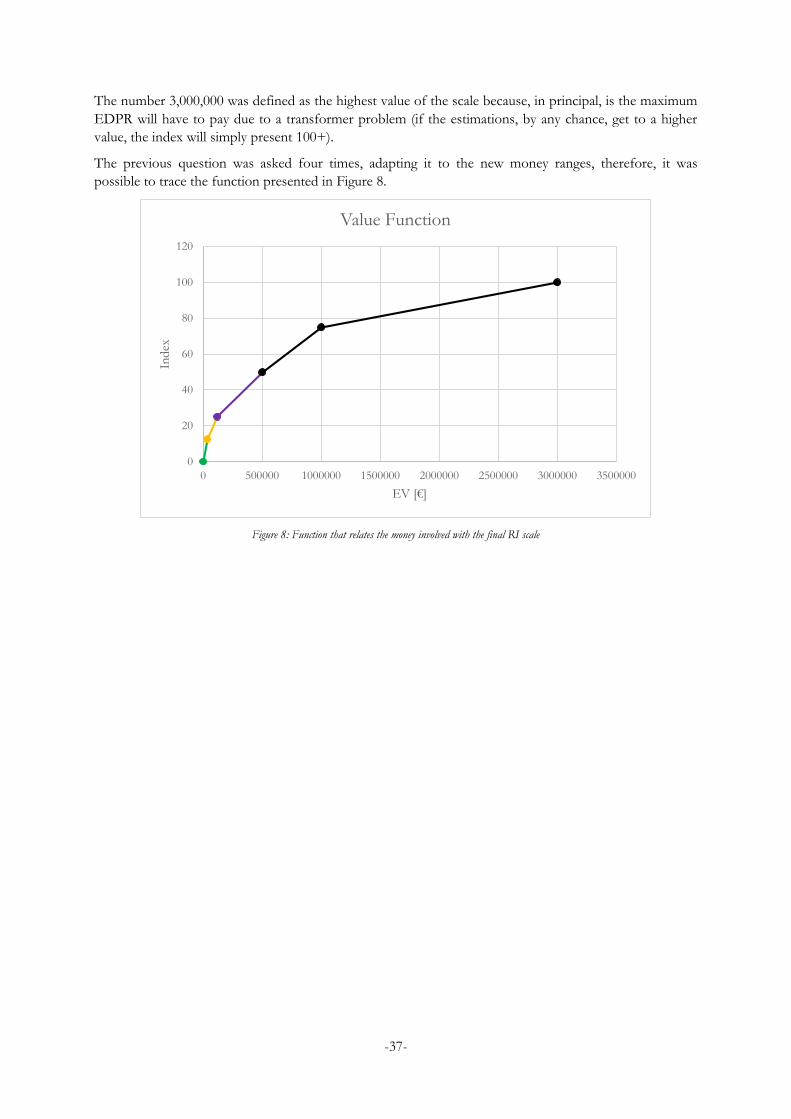
-37-
The number 3,000,000 was defined as the highest value of the scale because, in principal, is the maximum
EDPR will have to pay due to a transformer problem (if the estimations, by any chance, get to a higher
value, the index will simply present 100+).
The previous question was asked four times, adapting it to the new money ranges, therefore, it was
possible to trace the function presented in Figure 8.
Figure 8: Function that relates the money involved with the final RI scale
0
20
40
60
80
100
120
0 500000 1000000 1500000 2000000 2500000 3000000 3500000
Ind
ex
EV [€]
Value Function

-38-
4 Computer Program
It was said in the introduction that the overall program was divided in 2 programs: one written in C++,
which is responsible for keeping the map working and one developed in C, responsible for all the rest of
the functionalities. This is, basically, what the overall program does:
Manages Information
o Reads information: The program is regularly checking if new documents were inserted. If
they were, the program calculates the RI and reorganizes the risk ranking.
o Calculates the RI: according to the formulas developed in the previous chapter and with
the information inputted by the user, the program is able to calculate the RI.
o Stores Information: The information inputted regarding each transformer has to be
stored and ready to use when the time to make calculations arises.
o Prepares Map File: a file with information so the Map functionality is able to work.
o Displays Information Offline: similarly to the case of the map, every time there are news
with the transformers, a specific folder is updated, so the user can use it whether the
program is on or off.
Manages User - communicates with the user, as the program is able to answer to commands
written by them.
Manages Map - Every time new inputs are provided to the main program, the software passes the
information in a pre-processed way to the program developed to draw the map. This part of the
program does not make any calculation; it only displays what is provided in its input file.
In Figure 9, it is possible to see the looks of the program when in use.
Figure 9: Example of the program while running

-39-
There are three windows opened which are all important:
Dialogue Box (Figure 10): here, the user is able to interact directly with the program, being
capable to ask for different kinds of information;
Figure 10: Dialogue Box
Map (Figure 11): shows where the transformers are in Europe and their value of Risk Index,
depending on the color;
Figure 11: Map with transformers
Folder with the program (Figure 12): where the user can start the program, input files and access
to information offline.

-40-
Figure 12: Folder Containing the program
Besides these windows, there is also a PDF document with the instructions (Annex III), which the user
might choose to close or open it, according to their will. These instructions show the user how to
communicate in the dialogue box and how to input new data in the program.
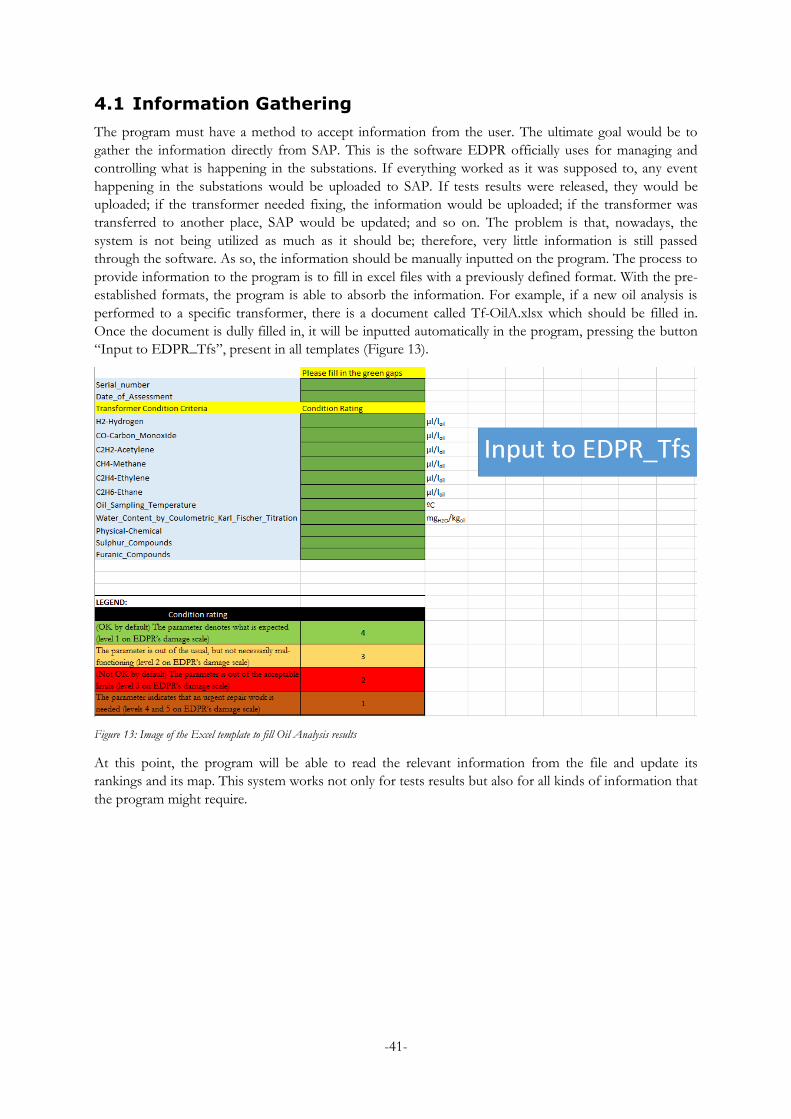
-41-
4.1 Information Gathering
The program must have a method to accept information from the user. The ultimate goal would be to
gather the information directly from SAP. This is the software EDPR officially uses for managing and
controlling what is happening in the substations. If everything worked as it was supposed to, any event
happening in the substations would be uploaded to SAP. If tests results were released, they would be
uploaded; if the transformer needed fixing, the information would be uploaded; if the transformer was
transferred to another place, SAP would be updated; and so on. The problem is that, nowadays, the
system is not being utilized as much as it should be; therefore, very little information is still passed
through the software. As so, the information should be manually inputted on the program. The process to
provide information to the program is to fill in excel files with a previously defined format. With the pre-
established formats, the program is able to absorb the information. For example, if a new oil analysis is
performed to a specific transformer, there is a document called Tf-OilA.xlsx which should be filled in.
Once the document is dully filled in, it will be inputted automatically in the program, pressing the button
“Input to EDPR_Tfs”, present in all templates (Figure 13).
Figure 13: Image of the Excel template to fill Oil Analysis results
At this point, the program will be able to read the relevant information from the file and update its
rankings and its map. This system works not only for tests results but also for all kinds of information that
the program might require.

-42-
The program is part of a folder called EDPR_Tfs, containing an application and several folders inside,
which can be handled by the user. The items inside are represented in Table 20 and shown in Figure 14:
Table 20: items inside the main folder of the program
Name Type Function
Excel_Templates Folder Any information that the user wishes to provide to the program should
be done with previously established formats, which can be found inside
this folder. After the templates are filled in with new information, the
file is automatically copied to the “Input_files” folder, in which the
program is able to read the document and send it to the “Recycle_Bin”
once processed (“Input_files” is inside “Excel_Templates”, see Figure
155).
Info_offline Folder If the user has not activated the program, it is still possible to see the
information regarding rankings and individual information of the
existing transformers. The folder has one file with the list of all the
transformers existing (called Tfs_list) and one file for each of the
transformers with all of their characteristics and the results of the last
tests performed (each one called with its transformer code, see Annex
VI).
Recycle_Bin Folder Any input file that is processed by the program ends up here, in case the
user wants to reuse the file.
EDPR_Tfs Application In order to actually start the program, the user should run this
application. It will open a dialogue window, a map and the instructions
(present on Annex III) to handle the program.
Figure 14: How the folder should look like to the user
Figure 15: How the Excel_Templates looks like inside

-43-
Table 20 and Figures 14 and 15 show what is visible to the user (explanation of each one of the Excel
templates in Annex IV). However, there will be another folder not visible to the user which provides the
vital tools for the well-functioning of the program. It is here the program stores the already processed
information from one session to another. That is, between the closing and the reopening of the program,
information has to be stored somewhere so the application does not have to re-ask for all the information
regarding the transformers. It is important that this folder is not visible for the user because, if anything is
slightly changed inside this folder, the program might stop working. It is also in this folder that the map
program is kept. This folder is called programmer_folder and is defined as an occult folder, so the user
cannot see it.
-44-
4.2 Processes and Threads
In order for the program to facilitate the user with the communication functionality while the it is
handling the inputted files and while the map is active and able to interact, there is a need for the division
of the program. The software is divided in two processes, one to manage the information and the user and
the other to manage the map. It would be possible to launch them in three separated processes, since
managing information and communicating with the user are different activities that work simultaneously;
although, the solution found to have this functionalities working simultaneously was to use threads.
The component of the computer responsible for running the programs is called processor and, in normal
computers, there is only one. Therefore, the processor, in order to attend all the different processes that
are taking place, has to be always alternating the running programs and managing the time it provides to
each one.
Processes are in constant competition for time in the processor. The same happens with threads, which
are subdivisions of the same process, with the difference that, besides competing among themselves, the
process they make part of also competes with other processes. The big advantage of opening threads,
comparing to launching different processes is that the first option shares the same internal memory and
the second does not, and this capacity is very useful in the case of this project. Otherwise, the complexity
of the program would have to increase substantially due to the functions needed to perform
communication between two processes.

-45-
4.3 Data Structure
A computer program is only able to perform calculations and handle information if this data is attributed
to variables and data structures allocated during the running of the program itself. As, in this case, there is
a big amount of information to handle, from the test results of all the transformers to the information
needed to make the calculations, it is necessary different kinds of data structures.
There are several types of data structure used in this program, which are going to be explained in the next
lines.
4.3.1 Independent variables
When writing in C and C++ language, it is possible to declare an integer variable with a certain name
(Figure 166). This way it is possible to attribute whole numbers to this variable and, then, use it either in
calculations or to print it in the command line (communication with user) or in a document. As it is
possible to declare an integer, it is possible declare decimal numbers (float), characters for writing (char)
and other type of basic variable.
Figure 16: Example on how the program structures its memory, regarding independent variables
These simple structures, “Float” and “Int”, were used in the program, for example, to keep information
regarding the “other important factors”, from chapter 0.
4.3.2 Tables and Arrows
Besides the possible different types, it is possible to declare a variable which represents not only one
number, but an arrow or a table of them (Figure 17).
Figure 17: Example on how the program structures its memory, regarding tables and arrows
In the program, the table structure is used to store the following information (the names within
parenthesis represent the acronyms defined on 3.5.1 and 3.5.2):
- Components data: 9 rows for the different components, 9 columns for the characteristics
(CDev, PFix, TFix, TRep, TMan, PAv, PMF);
- Capacity factors: 12 rows for the months, 7 columns for the countries (Fppo);
- Electricity prices: 12 rows for the months, 7 columns for the countries (EPr)
- Workforce prices and times: 3 rows for the conditions, 7 columns for the countries (CWf1,
CWf2, TW);

-46-
- Relations between manufacturers and countries: 11 rows for the manufacturers’ countries, 7
columns for the countries in which EDPR has wind farms (MnC);
- Coordinates for the map (it has 3 levels): 60 options for the different regions, 5 for the
different positions inside the region and 2 for the x and y coordinate.
4.3.3 Lists
As opposed to the idea of the tables that, with two numbers, it is possible to get directly to the
information, and where the memory space required has to be defined in the beginning and has to be kept
unchanged until its release, there is the list concept. This is no more than a chain of structures (Figure 18).
Every time there is the need for it, the program allocates space for the structure and inserts it in the chain
in the desired order, where the structures have two connections: one to the previous and another one with
the next in the chain. It is possible to change the structure position in the chain, so it always follow an
order, and remove it whenever it is necessary. This is the main advantage of the list and it is why it is used
in the case of the transformers, since its number is not constant in time. The only thing that has to be
defined from the beginning is what is inside each structure.
Figure 18: Example on how the program structures its memory, regarding lists
In the specific case of this program, there were used two different lists, one with the transformers
information and another with the dots that must be transmitted to the map process. To the first
mentioned list, the structures are ordered according to the RI value and each one contains:
Transformer code: used to identify each transformer;
Serial number;
Risk and Fail Index;
Name of the region and country;
Name of the wind farm;
Date from last update: every time the transformer changes place or whenever new test results
come, this date is updated;
Cost of the transformer (CTf);
Power of the transformer and the possible power outage (P, PPO);
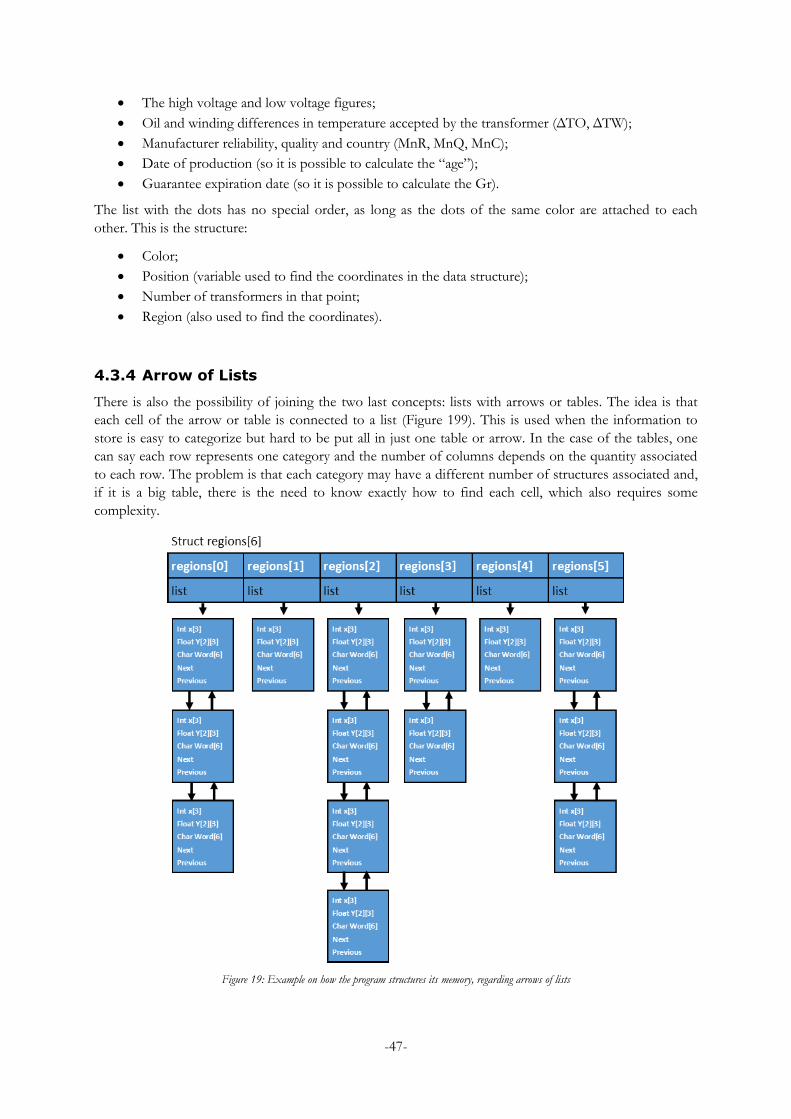
-47-
The high voltage and low voltage figures;
Oil and winding differences in temperature accepted by the transformer (ΔTO, ΔTW);
Manufacturer reliability, quality and country (MnR, MnQ, MnC);
Date of production (so it is possible to calculate the “age”);
Guarantee expiration date (so it is possible to calculate the Gr).
The list with the dots has no special order, as long as the dots of the same color are attached to each
other. This is the structure:
Color;
Position (variable used to find the coordinates in the data structure);
Number of transformers in that point;
Region (also used to find the coordinates).
4.3.4 Arrow of Lists
There is also the possibility of joining the two last concepts: lists with arrows or tables. The idea is that
each cell of the arrow or table is connected to a list (Figure 199). This is used when the information to
store is easy to categorize but hard to be put all in just one table or arrow. In the case of the tables, one
can say each row represents one category and the number of columns depends on the quantity associated
to each row. The problem is that each category may have a different number of structures associated and,
if it is a big table, there is the need to know exactly how to find each cell, which also requires some
complexity.
Figure 19: Example on how the program structures its memory, regarding arrows of lists

-48-
Therefore, it was chosen to store the information regarding the distances between each region and the
closest warehouse in an arrow of lists. It is an arrow with seven structures, one for each country. Each of
these structures is connected with one list, which size corresponds to the number of regions existent in
each country. This way is better than a simple list because it is much quicker to find the distance of a
specific region, since it is not necessary checking so many elements of the list before finding the pretended
region. It is the difference between checking at most 21 (from France) and 89 (from all the seven
countries) regions every time a number from the list is needed. Comparing to a table, the space required is
much less since the table would require 147 (7 countries times the 21 regions of France) instead of 89
structures. The composition of these structures is quite simple:
Distance to the closest warehouse (DW);
Name of the region.
4.3.5 Memory when the program is off
It was seen that the program can easily get space for storing memory, but this only lasts as long as the
software is turned on. The moment the program is closed, all the allocated memory should be freed.
Therefore, while the program is off, all the information that is in the structures above mentioned has to be
kept in text documents inside the folder which the user has no access to (the programmer_folder). This
means that, when the program is opened, the first thing it does is to read those documents and rebuild the
data structures. Every time new information is inputted in the program, the documents are also
immediately updated, so that, when the program has to be turned off, everything is already prepared so
there is no loss of information.
The files inside the programmer_folder are:
Tfs_list: it has two functions, wherein the first one is to keep a copy of the file present on the
Info_offline and the other is to enable the program to create the data structure when it starts.
More_tfs: file that contains a list that follows the same order as the previous one, and both are
equally important to create the data structure. It has a practical use, keeping the rest of the
information necessary to create the data structure when the program starts. The information is
not all in the same file because Tfs_list is shown to the user and much of the information is not
interesting to the user. Each line of these two lists represents one transformer, therefore, one
structure of the list (chapter 4.3.3); each word of those lines has the information used to fill in
those structures.
[Tf_Code]: one file per each transformer which only purpose is to present information to the user
when it is needed. These are the same folders existing in the Info_offline folder. The problem is
that the user is able to change the information present on the Info_offline; therefore, to make
sure the information available is always correct, the program keeps those files in the hidden folder
and is able to reproduce them whenever it is necessary.
More_[Tf_Code]: one file per each transformer existing to keep information crucial to the risk
index calculation. It presents a practical format to the program but uninteresting to the user. It
has the grades of the tests organized by parameters, instead of organized by tests and it has the
consequences calculations for each component.
Gen files: all the files that start with “Gen” on the excel files (present in Annex IV), once
inputted, are kept here to create the rest of the data structures when the program starts. This
information is necessary to create the tables from chapter 4.3.2 and the arrow of lists from 4.3.4.
Map folder: inside this folder, it is possible to find the application to run the map that, once again,
should be controlled by the program and not the user. Besides the application, there is the file in
which the characteristics of the dots are kept in. This file is the one used to make the remaining
list mentioned in chapter 4.3.3.

-49-
Instructions: it is also useful to keep them in this folder so the user cannot erase them by mistake.
They open automatically when the program starts and can be opened in the command line, while
the program is running.

-50-
4.4 Synchronization
A part of the data structure, the list of transformers, is accessed both by the thread which communicates
with the user (thread_user) and the thread that processes the information (thread_info). This might create
complications if there is not a way to synchronize this access. The most serious problem that might
happen is when the program is printing the risk ranking in the command line (Figure 10) and, at the same
time, the list with the transformers is being modified by the thread responsible for the inputs. Taking also
into account that the two threads are in constant competition between themselves for the processor; if, by
any chance, the moment the thread_user has an instruction to pass to the next transformer structure of
the list (Figure 20), its processor time suspends, and the thread_info restarts working (Figure 21) when it
is taking that same transformer out of the list (Figure 22). Therefore, when the thread_user gets back to
the processor and tries to print the information present in the structure, it will be pointing to “nothing”,
making the program to crash (Figure 23).
Figure 20: Example on lack of synchronization, thread_user in processor.
Figure 21: Example on lack of synchronization, thread_info in processor.

-51-
Figure 22: Example on lack of synchronization, thread_info deletes structure.
Figure 23: Example on lack of synchronization, thread_user lost the structure and crashes when trying to print something that does not exit.
Besides this worst-case scenario, there is the possibility of incoherencies when printing the list of
transformers. For example, it can happen that when the ranking is being printed, one structure was put
back on another point of the structure, so the printed ranking may be repeating transformers or missing
transformers.
To avoid these problematic situations, there is a tool in C programming called Mutex. The Mutex is a
function one should use before situations as the one described above, which denies one thread from
working if the same function has been called by another thread. Therefore, in this specific program, when
the list of the transformers is being read or modified, the thread which is doing it, locks the Mutex before
starting and unlocks it after the maneuver is complete. The exception to this statement is that the
thread_user never modifies the list, whereas the thread_info has situations in which it reads and it changes

-52-
the given list. As so, the Mutex is not needed when the thread_info reads, since the thread_user can be
reading at the same time with no kind of complications.

-53-
5 Sotonera Case Study
Sotonera is a wind farm in the province of Aragon, in Spain, and counts with a 20MW power transformer.
This transformer was taken to repair in September 2014, because it was showing concerning amounts of
gases. From 2010 to 2014, the oil analysis was always denoting the symptoms of thermal faults. However,
other than that, all the other parameters seemed to be OK. There were electrical tests in 2011 that did not
show any problem, as well as the regular maintenances every year that did not detect problems.
Nevertheless, three years accusing the same problem in the oil analysis was enough to take this
transformer to a repair center, leaving in the substation a temporary replacement. Once the repair center
disassembled the transformer to develop a diagnosis, the real problem was unveiled and the result was
unexpected: a small piece of steal was left forgotten inside the transformer. It was found between the
windings and the core, causing electrical currents to go through places it should not, enabling the
formation of the gases typically related to thermal faults.
Despite the dissolved gas analysis showing really concerning results (T3: T>700ºC), as there were no other
evidences of problems, EDPR took four years to take the decision of proceeding with a major repair.
In this chapter, it is shown how the program reacts to the inputs EDPR had access back then and some
comparisons are made.
5.1 Characteristics of the Transformer
In Sotonera, the transformer has the characteristics shown in Picture 20, which is the table used as input
to the program.
Figure 20: Insertion of the transformer of Sotonera in the program
It is worth noticing that the power is 20MW, which is relatively small. The brand is top quality and the
guarantee is already expired.

-54-
5.2 Scenario before Oil Analysis
The program counts already with transformers that actually exist. In Picture 21 it is possible to see the risk
ranking when the transformers just have positive results from the tests and in Picture 22 there are shown
the given transformers in a map.
Figure 21: List of the transformers before the results of the Oil Analysis
Figure 22: Map with the transformers before the results of the Oil Analysis
It was possible to observe that, even when the test results are all positive, there are differences in the RI.
The transformer in Sotonera is actually the one with the lower scale, whereas the Margonin substation
presents the devices with the highest index. If the user does not understand why, it is possible to open the
files that have the information regarding the device in Margonin, which is the A006 (Picture 23).

-55-
Figure 23: Transformer A006, in Poland
One can read in the file that, in Margonin, the transformer has 66MW associated and a lower
manufacturer quality; characteristics that are quite important for the index calculation. Another piece of
information which is implicit is that the electricity in Poland is sold for a much higher price than in Spain.
These three characteristics are enough to cause such a difference in the overall ranking. The parameter
that is present in every consequence calculation and, therefore, the most influencing, is the “Cost to be
Stopped”, CStop, which depends directly on the possible power compromised and on the price of the
electricity.
5.3 Scenario after Oil Analysis
The oil analysis results from 2010 were inputted in the program; the consequences in the risk ranking are
shown in Picture 24.
Figure 24: List of the transformers after the results of the Oil Analysis
It is also possible to open the file of A013 and observe more carefully the results (Picture 25 and 26).

-56-
Figure 25: File of A13 after the Oil Analysis showing the components state
Figure 26: File of A13 after the Oil Analysis, showing the test results
From Figure 26, it is possible to conclude the results only denote problems with temperatures higher than
700ºC, leaving all the other parameters with the maximum grade. The consequences in the overall state of
the program are presented in Figure 25: it affected the steal core and windings, which is precisely where
the damage occurred. The risk ranking shows a significant increase of the Sotonera’s risk, which was
enough to cause the dot in the map to turn yellow (Picture 27).

-57-
Figure 27: Map with the transformers before the results of the Oil Analysis
The functionality of alerting the user for an odd test result was successfully accomplished, since, both in
the ranking shown in Picture 24 and the map in Picture 27, there is a noticeable difference from the
damaged transformer to the remaining ones. However, it is not such of a big difference so it can be
considered a case of high concern. The index would definitely be higher if more signs of problems would
have come from the other tests. Although, as it did not happen, the program does not allow a high index,
especially for a 20MW transformer located in Spain, where the electricity is the cheapest in Europe and it
is right next to the warehouse, where the spare parts are.
5.4 Hypothetical Scenarios
In order to obtain a point of comparison, it was inputted in the program a transformer with the same
power capacity as the one in Poland (66MW) in Spain, with the same conditions as Sotonera. One can see
in Figure 28 the transformer A015 in a substation called SotoneraP66.
Figure 28: Risk ranking with the fictitious transformer in SotoneraP66

-58-
It is possible to conclude the power really has a great deal of importance when the calculations are made,
as it was mentioned before. As in the case of the original Sotonera, also a problem in the Oil Analysis was
simulated on SotoneraP66, as Picture 29 shows.
Figure 29: Risk ranking with a damaged fictitious transformer in SotoneraP66
The difference is considerable between two transformers which only difference is the power compromised
in case of break-down. To verify the disparity in the ranking when the transformer in Poland suffers the
same damage, Picture 30 was also obtained.
Figure 30: Risk ranking with a fictitious damage in Margonin
Picture 30 showed that the difference between a damage in Poland is way more concerning than in
Sotonera for the original power capacities, 27 to 13; however, if the transformer in Spain is also 66MW,
the difference is only two. The difference of 2 points between both in the two damaged 66MW
transformers (27-25) and in the two healthy 66MW (7-5) comes from the fact that the two main factors,
the PPO and the EPr, do not change with the damage. With the real and the hypothetical scenarios, the
map presents one yellow dot, for the real Sotonera, and two purples, one for the hypothetical damaged
transformer in Poland and one for the fictitious 66MW damaged transformer in Spain (Figure 31).

-59-
Figure 31: Map showing the hypothetical scenarios

-60-
6 Conclusions
It is possible to conclude that, when evaluating what to do regarding a transformer situation, a person is
able to take into consideration many parameters, even without giving it much thought. However, hardly
can an employee be pragmatic and never forget some of the smaller parameters. Even harder is to
compare different problematic situations and know how to prioritize. A well-structured program is not
only capable of that, but it is also able to take as many parameters as needed and it always make the
calculations in the same way, being as systematic as a tool can be.
It is undeniable that, to develop this program, subjectivity has had to be used. The author had to choose
which of the available parameters to EDPR the program should use; the weights attributes to them,
despite being shared and discussed with other people in EDPR, were not part of a universal truth; the
formulas, although developed with a logical thread, were written by one person. Nevertheless, with a
mindset of continuous improvement and exposing the program to different situations, by adjusting the
formulas and the values of some parameters, it will be less and less subjective.
Once this program is working at the expected capacity, by uploading information directly from the
company’s software, it will have a big utility for the department of central maintenance of EDPR.
Especially because it will be possible to check the whole fleet state with one map and with one program,
where the information is organized and displayed in an intuitive way.
Finally, one can conclude that this model of program is easily expanded to other devices that EDPR might
have, such as medium voltage transformers and contact breakers, providing the base for a more
automatized maintenance in EDPR.

-61-
Bibliography
ABB. 2006. ABB TrafoServ Handbook. 2006.
AENOR. 2000. Equipos eléctricos impregnados en aceite en servicio. Madrid : Asociación Española de
Normalización y Certificación, 2000.
Bartley. 2005. An Analysis of Transformer Failures, Part 2: Causes, Prevention and Maximum Service
Life. Munich RE. [Online] 2005. [Cited: 01 13, 2015.]
https://www.hsb.com/TheLocomotive/AnAnalysisOfTransformersPart2.aspx.
Fitzgerald, A. E., Kingsley, Charles and Umans, Stephen D. 2002. Electrical Machinery. s.l. : Mc Graw,
2002.
Global Market. 2011. Global Market. [Online] 2011. [Cited: 03 03, 2015.]
http://chhg.gmc.globalmarket.com/products/details/high-quality-power-transformer-237300.html.
Hamrick, Lynn. 2010. Dissolved Gas Analysis for Trasformers. s.l. : ESCO Energy Systems, 2010.
Jagers, J N, et al. 2007. Transformer Reliability and Condition Assessment in a South African Utility. Cape Town :
s.n., 2007.
Kernighan, Brian W. and Richie, Dennis M. 1998. The C Programming Language - Tha ANSI edition. s.l. :
Prentice-Hall, 1998.
Pahlavanpour, Eklund and Sundkvist. 2010. Revised IEC Standard for Maintenance of in Service Insulation
Oil. s.l. : Faisal Soomro, 2010.
Russel, Randy. 2009. Windows 2 Universe. [Online] 2009.
http://www.windows2universe.org/physical_science/physics/electricity/voltage_transformers.html.
Stamatelatos, Micheal. 2000. Probabilistic Risk Assessment: What is it and why is it worth performing it? s.l. :
NASA Office of Safety and Mission Assurance, 2000.
Wan, T., et al. 2013. Influence of copper ions in transformer oil properties and adsorption treatment. Human Electric
Power Corporation Reasearch Institute. Changsha : s.n., 2013.

-62-
Annex I
Oil Analysis
Dissolved Gas Analysis - according to the different amounts of gases present in the gas, it is possible to
conclude whether there are problems related to electrical discharges or to thermal faults. Measuring the
quantities of hydrogen and carbon monoxide is also quite important to detect possible problems with the
windings and/or paper insulator at an early stage. The gases analyzed are Hydrogen, H2, Methane, CH4,
Ethylene, CH, Ethane, CH, Acetylene, CH, Carbon Monoxide, CO, Carbon Dioxide, CO2, Oxygen, O2,
and Nitrogen, N2; wherein the latest three are not taken into account to the scope of this project.
It is useful to take into consideration that there is an internationally recognized method to indicate the
several types of transformers failures according to the measures of the gas previously mentioned
(AENOR, 2000). These possible problems, which became parameters for the fail and risk index, are:
Partial Discharges, PD – corona discharges that are able to decompose the wax present in
the paper insulator, they also produce small perforations on the paper.
Low Energy Discharges, D1 – they can happen either in the paper or in the oil. They are
characterized by a carbonized perforation of the paper, carbon threads on the paper surface or carbon
particles in the oil.
High Energy Discharges, D2 – arcing in the oil or paper, being possible to observe serious
damages and carbonization of the paper, metals melting on the points of discharge and extensive
carbonization of the oil.
Thermal Fault, T<300°C, T1 – excessive temperature causes the paper to turn brown.
Thermal Fault, 300°C<T<700°C – in this temperature range the paper becomes
carbonized.
Thermal Fault, T>700°C – above the 700°C, also the oil starts to carbonize, metals start to
gain color and, after the 1000°C mark, there is melting of metals.
The remaining parameters chosen for the project are:
Hydrogen – provides indication on problems with the windings, while it contributes to the
conclusions regarding the previous parameters.
Carbon Monoxide – provides information regarding damages with the paper insulator;
Physical-Chemical Analysis – it measures the following characteristics: color, appearance, density,
interfacial tension, breakdown voltage, acidity, water content and the dielectric dissipation factor. This
provides information regarding the quality of the oil. The feature Water Content, also known as Moisture,
is also used as a separated parameter because it is quite important to know the state of the paper insulator.
Sulfur Compounds – this test looks for sulfur compounds within the oil. If these chemical elements show
up, it means the copper wires are being corroded. What EDPR usually does in those situations is to add a
passivation chemical into the oil so it protects the copper. As this passivation does not last forever, this
test must be done with some regularity so it is possible to know when to add the product again. Besides
the fact that these compounds mean the copper is being corroded, they also damage the dielectric quality
of the oil.
Furanic Compounds – as the paper insulator is made out of unbleached sulfate cellulose, which is
composed of furanic compounds, this parameter measures the degradation of the paper.
The oil analysis has the advantage, or disadvantage, depending on the situations, of being able to erase its
symptoms. This is because the oil can be replaced if it becomes too defected. The advantage would be if

-63-
the oil had compromising particles deriving from an internal damage of the transformer that has been
fixed and, therefore, the oil would be clean again and its tests would be according to state of the
transformer since then. Moreover, those particles are rarely good for the oil’s dielectric quality, therefore,
it is possible to provide that quality if it is needed. The disadvantage is when the oil is replaced but the
possible internal problem with the transformer was not fixed; the consequences are clear when the oil
analysis say the transformer is in good health, when, in reality, it was just a miss-information.
Nevertheless, if the transformer does have a problem, the particles will keep being produced until this test
starts to detect it again.
Monthly Inspection
There is a different technician in charge of each EDPR substation. One of the functions of this technician
is to fill in a form every month with his naked-eye assessment of the transformer. Several aspects have to
be checked but only these are taken into account for this project:
Oil Level – in every transformer there is an indication on the oil level inside the transformer. If it is out of
the limits, several types of problems might be occurring.
Oil Leakages – problems with the tank, oil conservator or valves might cause oil leakages.
Tap Changer Oil Level – also in the tap changer there is an oil system that needs to be checked.
Tap Changer Oil Leakages – this test is just a verification if there are any oil leakages coming from the tap
changer.
Bushings Insulators – outside appearance of the bushings.
Radiators – this a simple test in which the technicians do a visual inspection to the radiators.
Forced Cooling Operation – verifying if the ventilation of the radiators is working properly.
Silicagel – it is a visual test to the silicagel, if it shows signs of being saturated in water, it has to be
changed.
Ground Connections – visual check-up of the ground connections of the transformer.
Control Cabinet – inspection to the control cabinet to see if everything is working accordingly to what is
expected.
Neutral Switch – the neutral cable has to be able to connect to the ground in case of emergencies,
therefore, this device must be regularly checked.
Highest Oil Temperature – each transformer has an indication on the highest oil temperature every time it
is checked (once a month).
Highest winding temperature – similar situation as the previous one, but for the windings.
Tap Changer Number of Operations – every month the number of operations made by the tap changer is
registered.

-64-
Infra-Red
This test is basically infra-red pictures taken throughout the substation, providing information regarding
the temperature of key components in the substation. It is quite effective in the way it detects easily
asymmetries with the temperature distribution along the transformer. For instance, if one bushing is
damaged, by comparison with the other two, this one is going to denote a different temperature, which
allows a quite intuitive conclusion regarding its state. The following tests were found relevants.
Temperature of HV Bushings, HVT – infra-red pictures provide information regarding the temperature of
the high voltage bushings.
Temperature of MV Bushings, MVT – the same test as the previous one but for the medium voltage
bushings.
Temperature of Radiators, RT – infra-red pictures provide information regarding the temperature along
the radiators.
Regular Maintenance
A hired maintenance company writes a report on the physical condition of the transformer; it can be
performed with the device connected to the grid or without such connection (possibility to gather more
information). This analysis counts with hired specialized technicians which check thoroughly every
component available without emptying the oil from the transformer. From all the tests they perform,
these were the chosen to integrate this project:
Oil Level – in every transformer there is an indication on the oil level inside the transformer. If it is out of
the limits, several types of problems might be occurring.
Oil Leakages – problems with the tank, oil conservator or valves might cause oil leakages.
Tap Changer Condition – from the top of the transformer, it is possible to access the tap changer and
chack if everything looks s it should.
Tap Changer Oil Level – also in the tap changer there is an oil system that needs to be checked.
Tap Changer Oil Leakages – this test is just a verification if there are any oil leakages coming from the tap
changer.
Bushings Insulators – outside looks of the bushings.
Radiators – this a simple test in which the technicians do a visual inspection to the radiators.
Forced Cooling Operation – verifying if the ventilation of the radiators is working properly.
Silicagel – it is a visual test to the silicagel, if it shows signs of being saturated in water, it has to be
changed.
Ground Connections – visual check-up of the ground connections of the transformer.
Control Cabinet – inspection to the control cabinet to see if everything is working accordingly to what is
expected.
Neutral Switch – the neutral cable has to be able to connect to the ground in case of emergencies,
therefore, this device must be regularly checked.
Foundations – verification of the support structure of the transformer.
Gasket and Seals – verification of the seals and gaskets which are visible from the outside of the
transformer.

-65-
Tank Corrosion – visual inspection of the tank surface, checking for corrosion.
Valves – visual assessment of the valves which are possible to see from the outside of the transformer.
Electrical Tests
A group of hired technicians and engineers goes to the wind farm and, with the production stopped,
perform several electrical tests. This group has to bring with them specific equipment and they can test
several parameters such as the resistances of insulators, the core and winding responses to several types of
electrical inputs and the well-functioning of the tap changer. Some of the parameters are “shared” with
other kinds of tests, therefore, not all of the parameters have the name of the test.
Paper Insulator – this parameter, when associated to the Electrical Tests, is the result of two particular
analysis. One is called Resistance Insulation Test, where a DC current is used to test the electric
characteristics of the transformer’s insulators, such as its impedance, and the other is called Power Factor
Insulation, in which AC current is used to analyze more electrical features of the insulators, such as the
capacitance. As the main insulator is the one involving the windings, made out of paper, these tests are
categorized in the parameter of Paper Insulator.
Insulator of Bushings – the same technics used as the ones used for the Power Factor Insulation. The
capacitance obtained is then compared with the theoretical values and a conclusion regarding the state of
the bushings is possible to be taken.
Transformation Ratio – also known as Ratio Test, it simply applies an AC voltage to the transformer and
checks if the ratio between the primary and the secondary are in agreement with what is expected.
Excitation Test – also known Open-circuit Test at low voltage, it tests the core and windings. In the core
it may identify cut sheets or defective joints, whereas in t windings, it might detect short-circuited turns,
turns in open-circuit, defective connections, among other problems.
Leakage Reactance Test – verification if the short-circuit resistance and reactance are as it was theoretically
expected.
Static Resistance Tests – tests to the resistance of the windings to see if the transformer has maintained its
efficiency. If not, it might mean there are windings hot points, tap-changer problems, truns in open-circuit
or short-circuited turns.
Dynamic Resistance – checkup of the electrical values while the tap changer is in action, allowing a good
analysis to this component’s performance.
Sweep Frequency Response Analysis – analysis of the transformer’s response to different low voltage
frequencies. It is very effective to get to know possible problems with the windings, such as physical
displacements, deformations or distortions of windings.

-66-
Annex II
EDPR has made a document to help technicians to categorize damages of oil-filled transformers. This
document defines damages in 5 different levels:
1. Category 1 – Normal.
There are not damages in the transformer.
2. Category 2 – Beginning of an appreciable damage.
Initial signs of damage that should be checked more carefully in the next preventative maintenance service, as for example:
Signs of corrosion;
Some loose LV/HV/ground connections;
Fiberglass mesh of the vault;
Oil staining/dirt collection, low oil level;
External damage to the cabinet, tank, or fins;
Pressure gauge indicates a vacuum.
3. Category 3 – Advanced deterioration,
Appreciable damages are found in the transformer and risk of failure in the medium term .The following damages will be included in this level:
Significant signs of corrosion;
Signs of overheating in cables;
Cuts or nicks on the cables;
Cracks in the cooling fins with flowing or dripping oil;
Significant cracks in the fiberglass or concrete of the vault;
The maximum temperature indicator on the temperature gauge indicates a temperature significantly above normal;
Loose transformer anchorages to the mechanical structure;
Soil around the vault is collapsing.
4. Category 4 – Very advanced deterioration and risk of failure.
The transformer has deterioration or a damage that needs to be repaired urgently. An oil sample should be taken for DGA analysis. Some examples of this category are:
Significant cracks to the fiberglass or concrete that result in the transformer being out of level;
Tank shows evidence of swelling;
Loud operation;
Spurious voltage related faults on the turbine.
5. Category 5 – Imminent failure or already present.
The component is in a very advanced deterioration state and there is a risk of an imminent failure or the component has already failed. The following types of damage will be included in this level:
Severely low oil levels or evidence of a large amount of oil loss;
Large cracks in the cooling fins causing a large loss of oil;
Blown fuse;
Loud noises.

-67-
Annex III

-68-

-69-

-70-
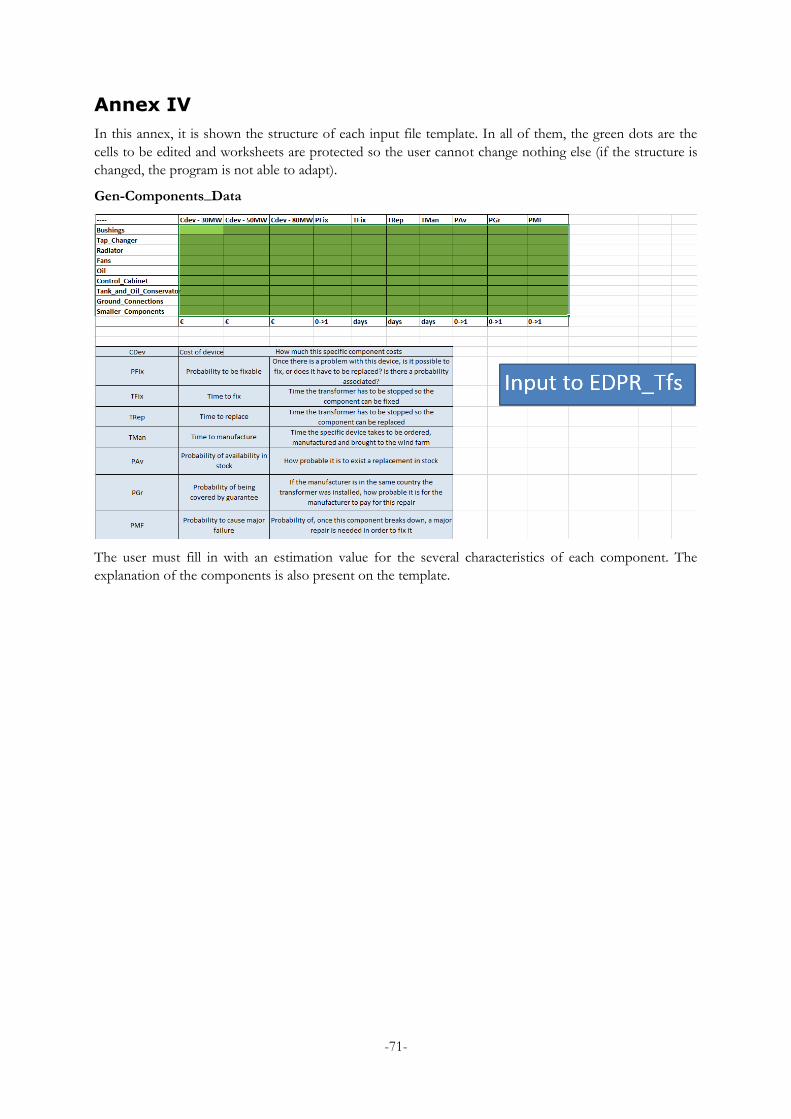
-71-
Annex IV
In this annex, it is shown the structure of each input file template. In all of them, the green dots are the
cells to be edited and worksheets are protected so the user cannot change nothing else (if the structure is
changed, the program is not able to adapt).
Gen-Components_Data
The user must fill in with an estimation value for the several characteristics of each component. The
explanation of the components is also present on the template.

-72-
Gen-Distances
As the program cannot guess the distances between countries and regions, one must provide that
information. Here, it should be the distance between the region’s capital and the closest warehouse. For
now, there is only one in Europe, which is in Spain, but there is a project of opening a new one in Poland.

-73-
Gen-General_Data
The information in the basic characteristics is not expected to be changing much, but it might be a tool
for the user if there is a need for a quick fine-tuning of the program. The same for the capacity factor. The
other parameters might change in an annual basis.

-74-
Gen-Relations_between_countries
It was mentioned during this report that the support provided by the manufacturers depends also on the
country the transformer is installed relatively to their headquarters’ country. It tends to decrease with the
distance. This is also adjustable, providing the user one more tool to fine tuning the results of the RI.
Gen-Temperatures
The average maximum temperature is a characteristic that depends on each region and on each month.
Therefore, a quite big table is required to fill in. Fortunately, it is not something that is expected to change
much often.

-75-
Test Results
All the test results templates are quite similar. The image shown above is the one regarding the monthly
tests. The cells that have a unit afterwards mean that they should be filled-in with a measure, whereas, the
ones that have nothing must have a grade from 1 to 4. If the user has doubts with the scale, there is always
a legend to explain.

-76-
Tf-New
All the basic characteristics to differentiate the transformers are asked here. The user is asked to grade the
reliability and the quality of the manufacturer as the computer has no way to know for itself. For that,
some examples are provided, but, generally, it is quite intuitive for a person who is working regularly with
transformers to make this appreciation. The user is asked not use “special characters” because the
program will not be able to recognize them. Therefore, even if the user uses special characters, such as ñ,
ó, ï, the program will show a message saying the inputted file is not filled in properly.
The program will attribute one TfCode to the new transformer and the test grades to calculate the RI will
be all assumed to be the maximum until the test results come. While not all the type of tests are submitted,
the assumption is still there, therefore, until that moment, the program keeps an asterisk after the code, as
it is possible to check in figure 10.

-77-
Tf-Exit
To take a transformer out of EDPR’s fleet, one just have to fill in this file saying which transformer to
delete and where it went. This information will remain in the transformer file so the user is able to check it
later.
Tf-Fix
This document is basically to fight a problem existing with the Assessment System 10. The most accurate
tests are the ones performed with larger time intervals. For instances, when the ET detects a problem,
only after three years the ET is performed again. It may very well happen that the transformer is fixed
meanwhile and the damaged component(s) is corrected way before the second ET. The consequence
would be the transformer to be healthy even if the health index would be showing there were still
problems. Therefore, to avoid this incoherence, the user fills in the table in the figure above, saying which
transformer was fixed and which components were back to their standard state so the assessment that
showed a problem can be disregarded.
The program will change every parameter that influences the component(s) marked with X back to the
maximum grade. This way, the program can keep running normally and changing the grades of the
parameters as new tests are inputted.
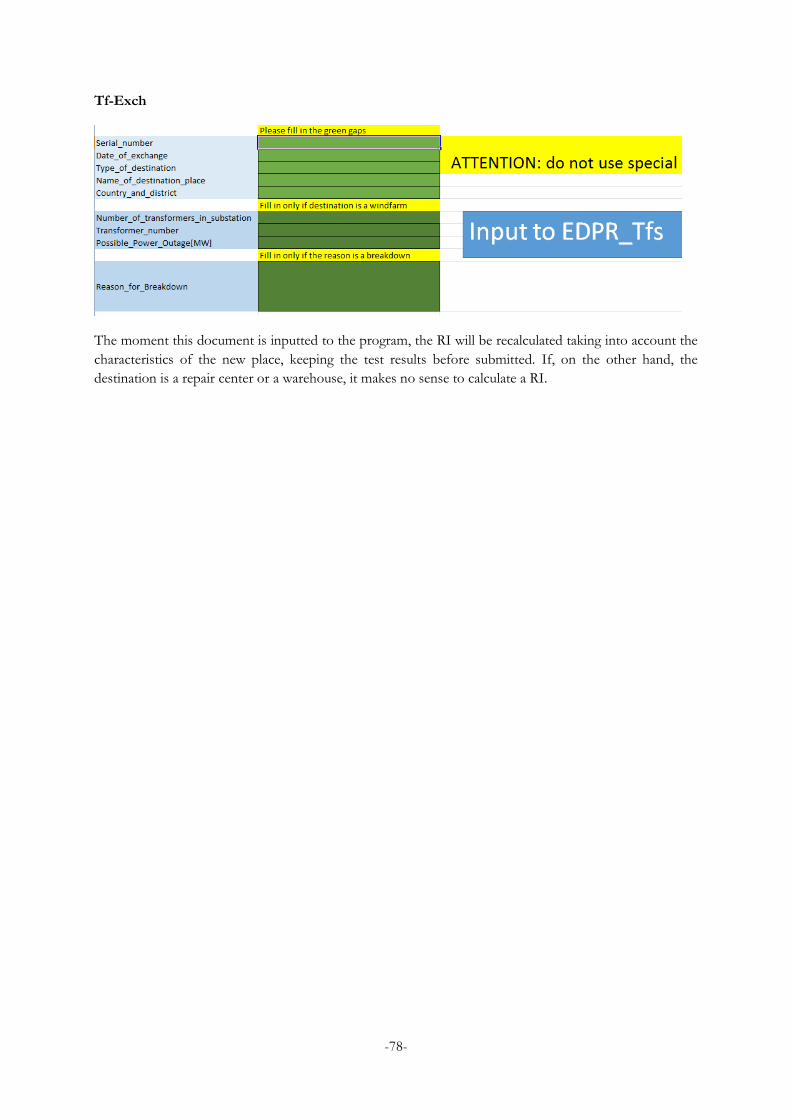
-78-
Tf-Exch
The moment this document is inputted to the program, the RI will be recalculated taking into account the
characteristics of the new place, keeping the test results before submitted. If, on the other hand, the
destination is a repair center or a warehouse, it makes no sense to calculate a RI.

-79-
Annex V
Here, it is explained what are the criteria to choose a replacement for a given transformer. Once a
transformer suffers a major failure and it has to go to a repair center, EDPR has to quickly replace it for a
device that does not compromise much the production of the wind farm. There can be two options
regarding this maneuver: if there is one transformer available in EDPR which matches perfectly the
characteristics of the damaged one, a permanent replacement is possible. On the other hand, if there is a
device that can handle the substation’s requirements in a non-ideal way, one has a temporary replacement,
in which the damaged transformer, after repair, is installed back in its substation.
Many criteria could be applied to have an ideal match for a replacement, in fact, there are six: power
capacity, primary voltage, secondary voltage, weight, volume and short-circuit voltage. Although, in reality,
usually problems with weight and volume are easily worked out, as so, they are not determinative. The
short-circuit voltage is not very important as well, so, in the end, the program will take into account only
three criteria to check for a replacement.
To define a permanent transformer, the conditions are:
𝑃𝑜𝑤𝑒𝑟 𝐶𝑎𝑝𝑎𝑐𝑖𝑡𝑦 𝑜𝑓 𝑅𝑒𝑝𝑙𝑎𝑐𝑒𝑚𝑒𝑛𝑡, 𝑃𝑅 = 𝑃𝑜𝑤𝑒𝑟 𝐶𝑎𝑝𝑎𝑐𝑖𝑡𝑦 𝑜𝑓 𝐷𝑎𝑚𝑎𝑔𝑒𝑑, 𝑃𝐷 ,
𝐻𝑖𝑔ℎ 𝑉𝑜𝑙𝑡𝑎𝑔𝑒 𝑣𝑎𝑙𝑢𝑒 𝑜𝑓 𝑅𝑒𝑝𝑙𝑎𝑐𝑒𝑚𝑒𝑛𝑡, 𝐻𝑉𝑅 = 𝐻𝑖𝑔ℎ 𝑉𝑜𝑙𝑡𝑎𝑔𝑒 𝑣𝑎𝑙𝑢𝑒 𝑜𝑓 𝐷𝑎𝑚𝑎𝑔𝑒𝑑,𝐻𝑉𝐷 ,
𝐿𝑜𝑤 𝑉𝑜𝑙𝑡𝑎𝑔𝑒 𝑣𝑎𝑙𝑢𝑒 𝑜𝑓 𝑅𝑒𝑝𝑙𝑎𝑐𝑒𝑚𝑒𝑛𝑡, 𝐿𝑉𝑅 = 𝐿𝑜𝑤 𝑉𝑜𝑙𝑡𝑎𝑔𝑒 𝑣𝑎𝑙𝑢𝑒 𝑜𝑓 𝐷𝑎𝑚𝑎𝑔𝑒𝑑, 𝐿𝑉𝐷 .
To define a temporary replacement, the conditions are:
𝑃𝑅 >𝑃𝐷2 ,
0.9𝐻𝑉𝐷 ≤ 𝐻𝑉𝑅 ≤ 1.1𝐻𝑉𝐷 ,
0.9𝐻𝐿 ≤ 𝐿𝑉𝑅 ≤ 1.1𝐿𝑉𝐷 .
Therefore, every time the risk index is calculated for one transformer, the program will check, taking into
account these criteria, if there is at least one replacement in available in the repair center.

-80-
Annex VI
Format of the file existing for each transformer:

-81-