Embed Size (px)
Citation preview
Risk framing of U.S. intermodal transportation hazardous spills
in news and social media
by
Kristen Alley Swain, Ph.D.
Principal Investigator
Meek School of Journalism and New Media
Farley Hall 135
University of Mississippi
University, MS 38677
NCITEC Project No. 29-2013
Conducted for
NCITEC
May 2016

ii
DISCLAIMER
The contents of this report reflect the views of the authors, who are responsible for the
facts and the accuracy of the information presented herein. This document is disseminated
under the sponsorship of the Department of Transportation University Transportation
Centers Program, in the interest of information exchange. The U.S. Government assumes
no liability for the contents or use thereof.

ABSTRACT
This study explores how freight companies publicly responded to serious hazardous spills
through the systematic analysis of: the social media presence and online influence of all 2,782
carrier companies and all U.S. newspaper coverage of 5,555 serious spills between 2001 and
2012. The study examined the social media presence/influence of the 2,782 transportation
companies involved in the serious spills, using Klout influence, TweetReach exposure, and
HowSociable magnitude scores. U.S. newspaper coverage of the accidents was coded if stories
appeared within five days of each “serious” accident between 2001 and 2012. This data were
compared with descriptive secondary data for the same accidents in the US-DOT Pipeline and
Hazardous Materials Safety Administration database. Three coders analyzed the entire universe,
which consisted of 267 stories in 87 newspapers, covering 54 accidents. This means 95.2% of the
5,555 most serious spills in a decade received no news coverage. Story variables included
transportation mode, publication, geographic location, spill impacts, spill damage, accident
causes, source types, source attribution, crisis responses, news coverage over time, story play
(placement, length, graphics), what was spilled, health effects, risk to public and workers, public
safety advice, and blame. Most freight companies had no social media presence. Few companies
communicated regularly about anything, through any social media channels. Companies with
fewer accidents were more likely to have social media accounts, while those with the most
accidents typically had no social media presence. No companies communicated directly about
any of the 5,555 spills. This pattern contradicts conventional public relations practice of “getting
out in front” of a crisis. Only 22% had a Klout score over 25, 16% had a Twitter account, less
than 1% had a Facebook page, only 0.1% had a LinkedIn page, and none had a Youtube account.
The companies with higher social media scores had the most damaging and expensive accidents.
Train companies typically had higher Klout scores, while trucking companies typically had mid-
range Klout scores. Companies with mass explosion hazards or high-threat cargo spills –
including radioactive materials and flammable gas – had a very low or non-existent SM presence.
Companies with the strongest SM presence were significantly more likely to have accidents
involving fatalities, gas dispersion, evacuations, fires, hazardous waste, and closure of major
roads. Some companies with dangerous track records had no social media account or did not use
them to inform the public about spills. Companies with higher Klout scores were significantly
more likely to have accidents involving fatalities and injuries. Companies with higher
TweetReach scores were more likely to have accidents involving a fire, explosion, or hazmat
fatality. U.S. newspaper coverage of serious transportation spills was almost non-existent. Spills
were more likely to be covered when journalists had access to authoritative sources, when the
perceived risk to citizens was higher, when someone was blamed, or when the spill involved an
unusual chemical or situation. Although the spills posed serious threats including potentially fatal
outcomes, invisible risks such as a gas leak, and involuntary exposure, most spills involving
fatalities, injuries, toxic inhalation, gas dispersion, fires, explosions, water contamination and
environmental damage received little coverage. Spills involving extremely dangerous materials
including radioactive materials, poisonous gas, or mass explosion hazards were not more likely to
receive coverage. Spills with a stronger visual element such as derailment or objective
severity/threat were less likely to receive attention. Access to police, fire/EMS reports did not
promote news coverage. High-impact events such as spills causing injuries, evacuations, toxic
gas leaks and road closings were not more likely to receive attention. Social amplification of risk
appeared to have little, if any, effect on the news coverage. This study raises additional questions
about whether the dearth of public communication about freight spills has caused damage beyond
the cost of the spills, and how transportation companies should weigh the risk of reputational
harm vs. societal benefits of improved communication about spills.

ACKNOWLEDGMENTS
The author wishes to express gratitude to the five journalism and integrated marketing
communication graduate students who assisted with the extensive data collection required for
this project: Grant Apgar, Jennifer Brown, Shannon Rountree, and Christina Steube, and
Jeffrey Wright. The author also appreciates the ongoing support and guidance from
University of Mississippi’s NCITEC grants coordinator Waheed Uddin of civil engineering,
as well as the support from Meek School dean Will Norton and associate dean Charlie
Mitchell. In addition, the excellent theoretical and methodological advice from University of
North Carolina journalism professor Dan Riffe was most appreciated and helpful.

TABLE OF CONTENTS
Abstract iii
Acknowledgments iv
Table of contents v
List of tables vi
List of figures vii
Introduction 1
Objective 2
Scope 3
Methodology 4
Findings 6
Online presence analysis 6
Media hypothesis tests 8
Story characteristics 10
Transportation modes 10
Crisis response phases 10
Impacts 11
Evacuations 11
Health impacts 11
Accident causes 11
Blame 12
Cost estimates 13
Discussion of results 16
Conclusions 17
Online presence conclusions 17
Media coverage conclusions 18
Recommendations 19
Acronyms, abbreviations, and symbols 21
References 22

LIST OF TABLES
Table 1: Social media presence of 10 freight companies with the most hazardous spills 6
Table 2: High-visibility freight companies by major impact: Klout and Twitter 7
Table 3: High-visibility freight companies by major impact: HowSocial and TweetReach 7
Table 4: Top 10 locations of serious hazardous freight spills, 2001-2012 9
Table 5: Specific health problems by transportation mode, as reported in news stories 12
Table 6: Impacts by transportation mode, for covered spills vs. all spills 13
Table 7: Hazardous chemical spills that caused health impacts: Stories vs. all accidents 14
Table 8: Hazardous chemical spills that caused other major impacts: Stories vs. all accidents 15

1
INTRODUCTION
The risk of hazardous freight spills increases the challenges and potential costs of operating the
intermodal network of highways, rails, waterways, airports, and shipping terminals in the U.S. These
risks are exacerbated by traffic congestion and aging infrastructure, ultimately jeopardizing American
competitiveness in the global economy. Between 2003 and 2012, 161,079 hazardous spills in the U.S.
involving highway, air, rail and waterways exceeded $701 billion in cleanup and mitigation (Pipeline
and Hazardous Materials Safety Administration, 2013). Social amplification of risk can strongly affect
public responses to hazardous spills.
The project examined a decade of risk framing in news coverage about U.S. intermodal transportation
incidents involving hazardous materials, as well as freight company brand strength and social media
presence. Social amplification of risk has been shown to strongly influence public responses to crises,
including these types of accidents. The results of this unique study will be used to expand and refine
the principal investigator’s outrage-mitigation risk framing model, in order to identify ways to reduce
outrage and misinformation in public risk messages following intermodal transportation hazmat
incidents.
This study examined all 5,555 hazardous spills classified as “serious” between Jan. 1, 2003 and Dec.
31, 2012 that US-DOT classified as “serious” in the federal Pipeline and Hazardous Materials Safety
Administration database. To this secondary data spreadsheet, two types of primary data were
appended: social media presence/branding data for each of the 2,782 freight companies and data about
news coverage across all of the 5,555 spills. The study examined how information about serious
hazardous spills is communicated to the public during different crisis phases (i.e., Coombs, 2007) and
how media strategies are used to communicate about spills (i.e., Lez-Herrero & Pratt, 1996).
First, the social media presence and online influence of all 2,782 shipping companies was examined, to
highlight the extent that freight companies can communicate directly with the public about serious
hazardous spills and how online presence can influence decision-making about how a freight company
responds to a hazardous spill. Then all of the newspaper coverage appearing in U.S. media was
collected for all of the 5,555 serious spills. Finally, all stories about all accidents between 2001 and
2012 were systematically analyzed using a common code sheet. The social media and content analysis
data were added to the original spreadsheet of descriptive secondary data that U.S. DOT had reported
about the same accidents in the Pipeline and Hazardous Materials Safety Administration database.

2
OBJECTIVE
This project is designed to determine what the public learns about serious freight spills directly (via
social media) and indirectly (via news media). It explores how freight companies publicly responded to
serious toxic spills through a three-part systematic analysis:
1. The social media presence and online influence of all 2,782 freight companies;
2. The extent that U.S. newspaper coverage appeared about the 5,555 serious freight spills
between 2001 and 2012;
3. A comprehensive content analysis of all newspaper stories that appeared about the 5,555
accidents during this time period.

3
SCOPE
This study explores how freight companies publicly responded to serious hazardous spills through the
systematic analysis of the social media presence and online influence of freight companies and all of
the U.S. newspaper coverage about any of the 5,555 serious spills reported by USDOT between 2001
and 2012. The project examined the social media presence of the 2,782 transportation companies
involved in these serious spills using social media presence data, as well as Klout influence,
TweetReach exposure and HowSociable magnitude scores.
USDOT categorized all of these spills as “serious” based on costs, amount of toxic releases, fatalities,
injuries, environmental damage and other severe health impacts. The data were compared with
descriptive secondary data for the same accidents reported in the US-DOT Pipeline and Hazardous
Materials Safety Administration database. The universe consisted of 267 stories in 87 newspapers,
covering 54 accidents. The coverage that was analyzed did not include stories published later than five
days following each spill in the database or stories from non-newspaper media sources such as
television and radio news transcripts, magazine articles, blog reports, etc.

4
METHODOLOGY
Social media analysis. The original research question for the social media analysis (phase 1) was “Are
transportation companies more likely to communicate with the public about hazardous spills, if they
already use social media?” Initially, Twitter was chosen as a platform for vetting the freight companies
because it is a common way citizens that follow breaking news such as hazardous spills. Coders
collected and examined all available tweets, via http://topsy.com, a website allows for real-time
searches of the social web. However, Topsy searches revealed that none of the freight companies
posted any tweets about serious hazardous spills. In light of this discovery, a new research question
was developed to examine the social media presence of these companies, highlighting one dimension
of their preparedness to inform the public.
An original analysis method was then developed to measure the social media presence and online
brand strength of all freight companies. The social media presence/influence of the 2,782
transportation companies involved in the 5,555 serious spills was examined using three scores: Klout
influence, TweetReach exposure, and HowSociable magnitude scores. The Klout score is a company’s
overall social media influence, based on its presence on Twitter, Facebook, Wikipedia, LinkedIn, and
YouTube (score<25 = little or no presence). The TweetReach exposure score reflects the number of
company tweets, follower counts, and retweets. The How Sociable magnitude score reflects a
company’s level of social media activity, on a scale of 1 to 10 (0 = no activity).
The social media analysis measured brand strength using company influence scores, social media
participation, company tweets, Twitter followers, impressions (reach) scores, company stock prices
before and after the incident, and brand magnitude (exposure) scores. Contextual data identified
whether each company had a public presence on social media and whether each company
communicated within three months after an incident.
This contextual data identified whether each company had a public presence on a wider variety of
social media sites including Twitter, Facebook, Wikipedia, LinkedIn, and YouTube. This data was
used to examine social media presence and reputational threat of all companies involved in the 5,555
hazardous freight spills.
Content analysis. The systematic news analysis examined the indirect communication between
transportation companies and public audiences via the news media, about the most serious
transportation accidents over the 10-year period. The news media analysis (phase 3) used two sampling
strategies to obtain a comprehensive sample.
In examining news presence (phase 2), search terms for all 5,555 serious transportation spills that were
listed in the US-DOT database were used to search the Lexis-Nexis full-text U.S. newspapers database.
This process identified news coverage of accidents that appeared within 5 days of each incident, 2001-
2012. Newspaper stories were chosen as the unit of analysis, since they typically provide the most
comprehensive coverage of events. Two different keyword combinations were used for each search, to
ensure comprehensive vetting (date, city, carrier company, mode of transportation, what was spilled).
The first round of searches used the name of the transportation company, location, date of the accident,
and the common name of the chemical spilled as search terms, to identify all stories covering any of

5
the 5,555 the accidents. The Lexis-Nexis news database was used to vet all 5,555 incidents in the
serious accidents database, to identify all incidents that received news coverage within 5 days of each
incident. The coders performed three different keyword combination searches for each spill:
Used three different keyword combinations per search:
Accident date + city + company
Accident date + city + mode of transportation
Accident date + (spill! or accident!) + what was spilled
An article qualified if it mentioned a hazardous freight spill within the first paragraph, was not an
opinion piece, and was not part of a round-up of briefs. A second Lexis-Nexis search used more
generic search terms, not including company names or chemical names. This search yielded an 191
additional stories, indicating that most stories included little identifying information about the
accidents or who was involved. In a third search reliability check, coders searched for stories for the
top 10 accidents in various categories (most expensive accidents, most fatalities/injuries, highest
quantity of chemicals released, etc.). This procedure did not yield additional stories.
This three-step comprehensive vetting process yielded only 267 stories in 87 newspapers, covering
only 54 accidents. This means 95.2% of 5,555 serious spills in a decade received no news coverage.
The average number of stories per spill was only 0.05. The average number of stories per covered
accident is 4.9. If every accident had received that much coverage, the universe would have been
27,466 stories.
An in-depth coding instrument then was developed to analyze all stories. It was designed to identify
patterns in reputation management, risk framing, and crisis communication messages. Story variables
included transportation mode, publication, geographic location, spill impacts, spill damage, accident
causes, source types, source attribution, crisis responses, news coverage over time, story play
(placement, length, graphics), what was spilled, health effects, risk to public and workers, public safety
advice, and blame.
All stories that reported any of the 5,555 accidents were analyzed. Thus, the content analysis was
performed on the entire universe of stories, not a sample. Three coders performed an in-depth content
analysis of all stories found. More than half the stories were double-coded for inter-coder reliability.
The news analysis was based on five hypotheses:
H1: Spills characterized by greater perceived risks (severity or seriousness) are more likely to
receive news coverage.
H2: Most hazardous spills will be covered because they are visually interesting.
H3: Since reporters are expected to choose stories based on traditional news values (including
timeliness, impact, prominence, conflict/controversy, unusualness and proximity), spills
characterized by traditional news values will receive more news coverage.
H4: Spills will receive more coverage when newsrooms have access to police, firefighter or
EMS reports about the accidents.
H5: Reporters will rely on officials for spill information more than freight company
representatives or other non-official sources.

6
FINDINGS
Online presence analysis
Most freight companies had a virtually non-existent online presence. Only 22% of shipping companies
had a Klout score over 25 (with scores ranging from 3 to 96), 20.4% had a Twitter account, 13% had a
HowSocial score of 1 or more (indicating any type of social media presence), 4.6% had a Wikipedia
page, 2.5% had a Facebook page, 0.5% had a LinkedIn page, and none of the companies had a
YouTube account. The average number of tweets among all companies was 600. Among companies
that did have a Twitter account, only 41.8% had a TweetReach score (indicating any level of Twitter
activity).
Freight companies with higher social media scores had the most damaging accidents, in terms of total
cost. Only 22% of companies had a Klout score over 25, only 16% had a Twitter account, less than 1%
had a Facebook page, 0.1% had a LinkedIn page, and none had a Youtube account. The train
companies typically had higher Klout scores, while trucking companies typically had mid-range Klout
scores. Companies with mass explosion hazards or high-threat cargo spills – including radioactive
materials and flammable gas – had a very low or non-existent SM presence.
Companies with the strongest social media presence were significantly more likely (p<.05) to have
accidents involving fatalities, gas dispersion, evacuations, fires, hazardous waste, and closure of major
roads. Some companies with dangerous track records did have social media accounts – but did not use
them to inform the public of spill hazards. Companies with higher Klout scores were significantly
more likely to have accidents involving fatalities and injuries. Companies with higher TweetReach
scores were significantly more likely to have accidents involving a fire, explosion, or hazmat fatality.
Table 1 shows the low or non-existent social media presence of 10 companies with the most accidents.
Table 1: Social media presence of 10 freight companies with the most hazardous spills
# Accidents Klout score TweetReach HowSocial
1. Univar Corp. 75 45 0 0
2. Marathon Petroleum 62 0 0 0
3. Ferrell Gas 60 0 0 0
4. Austin Powder 41 0 0 0
5. Ecolab 41 0 0 0
6. CHS 39 49 0 0
7. Hess Corp. 29 44 0 0
8. Motiva Enterprises 29 89 0 0
9. Magellan Pipeline 27 0 0 0
10. Olin Corp. 25 0 0 0
Ave. for these companies 42.8 22.7 0.0 0.0
Ave. for all companies 5,555 53.3 27,821 0.5

7
Table 2: High-visibility freight companies by major impact: Klout and Twitter
Accident Characteristics
% of spills Klout score:
50+ #Tweets
(100,000+) #Twitter followers
(1,000+)
Damage over $500,000 81.4 20.6 11.7 12.0
Environmental damage 13.6 1.5 1.6 1.7
Evacuation 18.9 2.3 *2.3 *2.1
Explosion 3.3 0.4 0.3 0.3
Fatalities 2.0 0.3 *0.1 **0.1
Fire 10.0 1.2 **1.0 **0.9
Gas dispersion 13.7 **1.3 2.1 **2.4
Hazmat waste 3.3 **0.2 2.1 0.5
Injuries 7.7 0.5 1.3 1.2
Major artery closed 36.9 **4.0 5.2 5.1
Radioactive waste 0.1 0.0 0.0 0.0
Spillage 90.4 11.3 13.1 12.1
Toxic inhalation 1.8 *0.2 0.2 0.2
Vehicle left road/track 27.9 3.6 4.1 **4.3
Vehicle overturn 32.2 **3.5 4.5 4.6
Water/sewer damage 8.6 1.1 *0.9 1.0
* p<.05, ** p<.01
Table 3: High-visibility freight companies by major impact: HowSocial and TweetReach
Accident Characteristics
% of cases
HowSocial magnitude score: 2+
TweetReach exposure: 20,000+
Ave % higher-viz companies
Damage over $50,000 81.4 11.6 13.1 15.2%
Environmental damage 13.6 1.7 *1.8 12.5%
Evacuation 18.9 2.9 2.7 14.8%
Explosion 3.3 0.4 0.4 12.1%
Fatalities 2.0 0.1 **0.1 5.0%
Fire 10.0 1.2 **1.2 12.0%
Gas dispersion 13.7 2.5 **2.7 18.2%
Hazmat waste 3.3 0.3 0.6 13.6%
Injuries 7.7 0.8 *1.5 10.4%
Major artery closed 36.9 5.0 6.0 14.9%
Radioactive waste 0.1 0.0 0.0 0.0%
Spillage 90.4 11.6 14.6 14.5%
Toxic inhalation 1.8 0.1 *0.2 5.6%
Vehicle left road/track 27.9 4.9 4.8 17.4%
Vehicle overturn 32.2 5.4 5.2 16.5%
Water/sewer damage 8.6 1.1 1.2 13.4%
* p<.05, ** p<.01

8
Media hypothesis tests
H1: Perceived risk. The hypothesis asserting that accidents characterized by perceived severity or
seriousness are more likely to receive more coverage was not supported. Among the serious accidents
in the DOT database that received scant news coverage were toxic inhalation, gas dispersion, fires,
explosions, water contamination, environmental damage, evacuations, closure of major arteries, and
spills that incurred over $100,000 in damage. Other impacts that received scant coverage included
fatalities, injuries, and hospitalizations. Specific hazardous releases that received no news coverage
included radioactive materials, mass explosion hazards, infectious substances, chemicals that are
spontaneously combustible and chemicals that are dangerous when wet. Hazardous releases that
received scant coverage included poisonous gases and materials, as well as flammable gases and
liquids.
Within stories that did appear, risks were frequently mentioned. Overall, the coverage framed citizens
at greater risk of exposure than workers. Stories mentioned a risk of hazardous exposure to residents in
46.8% of the stories vs. 37.1% for on-site workers. Specifically, 34.1% of the stories mentioned
moderate or serious risk for residents vs. only 7.9% for workers; 12.7% mentioned low risk for
residents vs. 29.2% for workers, and 10.5% framed the risk for residents as safe or non-existent vs.
7.9% of workers.
H2: Visuals. The hypothesis predicting that hazardous spills will be frequently covered because of
their visual appeal was not supported. A high percentage (77%) of the stories included no photo, map
or other graphic. Most of 23% of the stories that did have a visual element only provided one image.
Rail accidents were twice as likely as highway spills to receive any visual coverage and to include
more than one image.
H3: News values. The hypothesis asserting that spills characterized by traditional news values will
receive more news coverage was partially supported. In general, reporters choose stories based on
traditional news values (including timeliness, impact, prominence, conflict/controversy, unusualness
and proximity). The news values inherent in serious transportation spills include impact, conflict, and
unusualness. Evacuations, hazardous gas leaks, injuries, road closings, etc. affect many people
(impact). Various parties may assign blame for accidents (conflict, controversy). Although most high-
impact accidents were barely covered, attribution of responsibility (blame) appeared to drive much of
the news coverage. Assigning blame for spills was mentioned in only 15.7% of the stories.
Most people are familiar with petroleum products such as gas, oil and diesel but unfamiliar with the
other hazardous substances (unusualness). A high percentage (79%) of stories covered accidents
involving non-petroleum spills (lesser-known chemicals). The chemicals reported most frequently in
the stories included chlorine (14.8%), followed by propane (10.2%), ethanol (9.7%), diesel fuel
(6.7%), and ammonia (6.2%). By comparison, the top five chemicals across all accidents were gasoline
(14.7%), crude oil (8.2%), diesel (7.7%), hydrochloric acid (3.0%), and sodium hydroxide (also known
as lye or caustic soda, 2.9%). Only diesel spills were covered at a rate comparable to the rate across all
accidents. A few stories (4.2%) only used referred to what was spilled using vague language like
“chemical,” “chemical spill,” “acid,” “explosive,” “solvent,” “flammable liquid,” or “hazardous
material.”

9
While 55% of the covered accidents were derailments vs. 45% trucking accidents, across all accidents
there were five times more truck spills than train spills. Thus, the perceived unusualness of derailments
elevated the coverage of these spills.
In addition, the accidents that did receive coverage were not located in the cities or states where most
spills actually occurred. According to the news coverage, the top five states where spills occurred were
South Carolina, the site of the Graniteville chlorine disaster (16.5% of the coverage), followed by Utah
(7.9%), Connecticut (7.5%), California (6.0%), and Pennsylvania (6.0%). In comparison, the top five
states in the US-DOT database were all populous states: Texas (11.4% of the spills), followed by
California (5.3%), Florida (4.5%), Ohio (4.5%), and Pennsylvania (4.3%).
Four of the top five cities in the news coverage were small cities or rural towns: Graniteville, SC (pop.
2,600), followed by Bridgeport, CT (pop. 147,000); Lafayette, LA (pop. 124,276); New Brighton, PA
(pop. 5,961) and Columbus, OH (pop. 822,000). By contrast, all top-five cities in the accident database
had populations over 600,000: Memphis, TN (pop. 653,000); Houston, TX (pop. 2.2 million);
Columbus, OH (pop. 822,000); Tampa, FL (pop. 353,000); and Baltimore, MD (pop. 622,000).
Overall, newspapers were more likely to cover serious freight spills in smaller towns than in
metropolitan areas. Of the 74 cities that were covered, only 11% were major cities.
Table 4: Top 10 Locations of Serious Hazardous Freight Spills, 2001-2012 (USDOT data)
Rank Top 10 states % of cases Top 10 cities % of cases
1 Texas 11.5 Memphis, TN 1.2
2 California 5.4 Houston, TX 1.0
3 Florida 4.6 Columbus, OH 0.6
4 Ohio 4.5 Tampa, FL 0.6
5 Pennsylvania 4.3 Baltimore, MD 0.6
6 Louisiana 4.0 Dallas, TX 0.5
7 Illinois 3.6 Kansas City, MO 0.5
8 Tennessee 3.3 Woodstock, VA 0.5
9 North Carolina 3.1 High Springs, FL 0.4
10 New York 2.8 New Brighton, PA 0.4
H4: Access to official reports. The hypothesis asserting that spills will receive more coverage where
newsrooms have access to daily police, firefighter or EMS reports was not supported. Fire or EMS
reports were filed for 1,684 of the accidents (30% of all accidents), but less than 3% of these accidents
received any coverage. However, fire/EMS reports were filed for 19% of the spills that did receive
coverage. Similarly, police reports were filed for 1,966 (35%) of all accidents, but only 2.3% of these
accidents received any news coverage. Also, 17% of all covered accidents were documented in police
reports. These findings indicate that although media organizations have access to fire or police reports
for at least a third of the accidents that happen, the coverage was not driven by them. Few reporters
appear to utilize these reports.
H5: Access to officials. The hypothesis predicting that reporters will rely on officials more than
transportation company representatives was supported. Although fully attributed sourcing is standard
practice among American reporters, nearly a third (31%) of the spill stories used unnamed sources.
The most common named interview sources were law enforcement officials (39%), firefighters (25%)

10
federal agency officials (24%), environmental agency representatives (15%) elected officials (14%),
public health officials (4%), and military officials (0.4%). Unofficial sources included witnesses,
victims and other citizens (24%), freight company representatives (18%), technical experts (7%),
doctors and other health care workers (6%), shipping company representatives (5%), freight
drivers/operators (3%), local business owners (2%) and lawyers (2%).
Story characteristics. The number of stories per covered incident ranged from 1 to 12, with an
average of 4.8 stories per accident. A total of 328 stories covered 267 accidents, representing only
4.8% of the 5,555 serious accidents in the 11-year period. Most (53.9%) of the covered incidents
received three or fewer stories. Coverage frequency peaked in 2005 due to extensive coverage of the
deadly Graniteville, SC, chlorine tanker disaster but fell off sharply after 2007. This sharp drop also
may be tied to the 2008 economic crash that hurt many U.S. newspapers.
FIGURE 1: Frequency of freight spill stories over time
The average story length was 474 words. The stories contained at least 20 words and 1,683 words at
the most. Most stories were standard length: 3.7% were 50 words or less, 6.7% were 51-100 words,
48.3% were 101-500 words, 32.6% were 501-1,000 words, and 7.9% of the stories exceeded 1,000
words. Overall, nearly a third (31.1%) of all stories included some kind of image. Nearly a quarter
(23.2%) of the coverage included at least one photo, and the highest number was five. In addition,
7.9% of stories included between one and three maps or other graphics.
Transportation modes. Highway spill stories accounted for 121 (45.2%) of the articles, and these
covered spills represent 2.7% of all spills. Derailments and other train spills received 141 stories
(52.8% of the coverage), representing 16.4% of all train spills. Only 1.1% of the stories reported
aircraft spills, and no watercraft accidents were covered. In contrast, across all accidents, 81.3% were
highway spills, 15.4% were rail accidents, and 2.6% were aircraft accidents. Thus, while highway
accidents were five times more common than train spills, the newspapers covered six times more
railway spills than trucking spills.
Crisis response phases. Stories often mentioned at least one phase of crisis response in reporting
spills, particularly when a spill was covered beyond the first day. The coverage mentioned the
emergency response phase in 58.8% of the stories, followed by cleanup (40.4%), recovery (31.8%),
and preparedness (25.5%) phases. The frequent mentions of these activities may be partly linked to the
0
10
20
30
40
50
60
70
2OO1 2OO2 2OO3 2OO4 2OO5 2OO6 2OO7 2OO8 2OO9 2O1O 2O11 2O12

11
newsworthiness of the costs. According to the US-DOT data, across all accidents the average cost of
cleanup per spill was $57,237, and the average emergency response cost $24,071. The highest cost of
cleanup for a spill was $19.0 million, while the highest cost of emergency response was $19.8 million.
Impacts. All major spill impacts were reported disproportionately in the stories, as compared to the
rate of these impacts across the actual accidents. More than a third (35.5%) of stories reported a major
road closed, which is comparable to the 37.2% rate across all accidents. More than a third of the stories
(34.5%) reported a fire, a rate three times higher than the 10.1% fire incidence across all the accidents.
Similarly, 23.9% of the stories reported an explosion, while US-DOT reported an explosion rate of
only 3.4% across all accidents. These figures indicate that the newsworthiness and visual element of
fires and explosions attracted disproportionally more media attention than the actual rate of these
events. The less obvious impacts of spills were covered at about the same rate as those reported by US-
DOT: 8.9% of the stories reported environmental damage, while the actual rate was 13.6% across all
accidents. Similarly, 7.1% of the stories reported water contamination, while US-DOT reported that
8.6% of the spills caused water contamination. While 7.9% of the covered incidents reported a gas
leak, the government data indicates that 13.8% of the accidents involved a gas leak.
Evacuations. More than a quarter, 25.8% of the stories, mentioned evacuations, which was
comparable to the 19.4% rate across all accidents. Most stories estimated the number of evacuees as
1,000 or fewer. The average number of people evacuated, according to the news, was 699 people, a
rate 17 times higher than the US-DOT average (39.8 people per spill). Stories reported a maximum of
10,000 evacuated, the same maximum reported by US-DOT. According to the federal data, people
evacuated for up to 84 days (2.6 hours on average). While the number of actual evacuations did
increase over time, the number of covered evacuations fell off after 2007.
However, there was a significant correlation between the number of actual evacuations and the number
of covered evacuations over time. Although 41.4% of the stories reported an evacuation, only 6.5% of
all stories provided evacuation advice, including the evacuation radius from the accident site, alternate
routes to escape the site, what citizens should take with them and for how long, etc. Similarly, while
14.5% of the stories reported a gas leak, only a quarter of stories (3.6%) provided advice about how
citizens should shelter in place or get medical help.
Health impacts. The average number of injuries per covered accident was 10.3, up to 300 injuries per
story, and the average number of people hospitalized per covered accident was 18.4. Up to nine
fatalities were mentioned in stories, and the average number of deaths per fatality story was only 1.6.
Nearly a quarter (22.1%) of covered accidents had at least one injury, and the same number (22.1%)
had at least one hospitalization. Most (59.3%) of those stories reported four or fewer injuries. Only
3.4% of stories reported 20 or more injuries. Although the number of actual injuries and fatalities
increased over the decade, the number of covered injuries and fatalities sharply decreased after 2007.
However, there was no correlation between the number of actual injuries or fatalities and the number
of covered injuries or fatalities over time.
More than a third (38.9%) of stories mentioned specific actual or potential health problems associated
with exposure, aside from generic injuries or fatalities. In all, 16.1% mentioned burns, 10.5%
mentioned vehicular injuries, 9.7% mentioned skin irritation, 5.1% mentioned neurological issues, and
0.4% mentioned cancer.

12
Table 5 shows that coverage of rail accidents mentioned more specific health concerns than truck
accidents, even though there were five times more truck accidents. However, most of the health issues
mentioned in railway coverage appeared in the Graniteville chlorine leak coverage.
TABLE 5: Specific health problems by transportation mode, as reported in news stories
Health impacts Highway Rail Air TOTAL
Vehicular injuries 3 1 0 4
Neurological effects 1 1 0 2
Cancer 1 0 0 1
Burns 12 7 0 19
Skin irritation 1 10 0 11
TOTALS 18 19 0 37
Accident causes. An explanation of how the spill cause or problem was discovered appeared in 13.9%
of the stories. Coverage was more likely to attribute accidents to driver error than mechanical failure,
and human error appeared to drive the frequency of coverage. Overall, 34.5% of the covered accidents
attributed the spills to the freight driver’s actions, nearly five times the 7.4% rate of all spills attributed
to human error. In the stories, the driver collided with or reacted to a car (24.7% of stories), was
speeding or violated another traffic law (4.5%), driver was drowsy or distracted (2.6%), reacted to an
animal or debris (1.5%), had a collision with a sharp object (0.7%) or was inexperienced (0.4%). The
news coverage reported that 0.7% of the accidents were caused by collision with a sharp object, while
1.6% of all the accidents cited this cause. For all accidents, 28.1% of the spills involved a vehicle
leaving the roadway.
Mechanical issues accounted for a quarter (25.8%) of covered spills. While 9.7% of the stories cited a
defective or broken component, this was cited as the cause of 4.2% of all accidents. While 3.7% of
stories cited an open valve as the problem, only 0.9% of all accidents were caused by this issue. Within
the news coverage, 9.4% attributed accidents to overheating or mechanical fire, 1.5% to aged or
deteriorated equipment, 1.1% to inadequate equipment maintenance, and 0.4% to equipment
vandalism. The most common causes of fatal accidents were tanker/container breaches (34.1% of all
spills), malfunctions of valves, piping or fittings (11.4%), and problems caused by the hazardous
materials being transported (9.8%).
Blame. Stories rarely implied culpability on the part of the freight company, the shipping company, or
a third party, even though many of these serious spills did eventually prompt litigation. Only 1.9% of
the stories reported threatened litigation. Although conflict is a traditional news value that often sparks
coverage, assigning blame for spills was mentioned in only 15.7% of the stories. The most common
ways this blame was framed, when it did appear, was to blame the freight company for an
unintentional accident (18.7% of the stories) or to blame a third party for an unintentional accident
(12.7% of stories).
Other references to assigning responsibility included blaming the freight company for a preventable or
intentional accident (4.9%), conveying the freight company’s apology, compensation, or other
assistance to victims (4.5%), conveying that the freight company assumes minimal or low
responsibility for the accident (1.9%) or that the freight company assumes strong or high responsibility

13
for the accident (1.1%). Few stories stated that the shipping company (such as Exxon, etc.) assumed no
responsibility for the accident (6.7%), but in one story (0.4%) the shipping company did assume some
responsibility. Only one story blamed the shipping company for an unintentional accident (0.4%), and
only one story blamed the shipping company for a preventable or intentional accident (0.4%).
Stories assigning blame were twice as likely to use named sources than unnamed sources. Spill
investigations were mentioned in over a third (37.5%) of the stories, and stories that discussed a spill
investigation were significantly more likely to use named sources than unnamed sources.
Cost estimates. Only 17.6% of stories estimated the costs: 5.6% reported damage to the freight
company, 4.1% reported economic damage to the local community, and only 3.8% reported total
damages. Across all accidents, the average damage estimate was $150,639, and the worst accident
caused $27.5 million in damage. It appears that the estimated cost of response and cleanup did not
drive the coverage, and these figures usually did not appear in the stories. Across all covered accidents,
26.6% of the incidents involved damage exceeding $500,000, as compared with three times that rate
(79.9%) across all accidents. Of the covered accidents, 16.9% issued a police report, compared with
35.1% of all accidents. Similarly, for 18.7% of the covered accidents, a fire or EMS report had been
filed, compared with 30.1% filed for all accidents.
TABLE 6: Impacts by transportation mode, for covered spills vs. all spills (USDOT data)
Impacts
Covered Spills All Spills Percent of all spills that Received news coverage
Highway Rail Air All Highway Rail Air All Highway Rail Air All
Hazardous
inhalation
2 4 0 6
79 23 2 104
2.5 17.4 0 5.8
Fire 10 11 0 21 456 108 1 565 2.2 10.2 0 3.7
Explosion 7 8 0 15 170 21 0 191 4.1 38.1 0 7.9
Water contamination 3 3 0 6 407 69 0 476 0.7 4.3 0 1.3
Gas leak 17 4 0 21 570 186 14 770 3.0 2.2 0 2.7
Environmental
damage
6 3 0 9
662 98 0 760
0.9 3.1 0 1.2
Damage >$500K 33 38 0 71
3682 736 14 443
2 0.9 5.2 0 1.6
Major road closure 23 38 0 61
1737 323 19 207
9 1.3 11.8 0 2.9
Evacuation 18 36 0 54
665 298 11
5
107
8 2.7 12.1 0 5.0
Fire/EMS filed
report
19 31 0 50
1299 370 11 168
0 1.5 8.4 0 3.0
Police filed report 14 31 0 45
1627 327 7 196
1 0.9 9.5 0 2.3
Hazmat injuries 22 12 0 34 353 83 9 445 6.2 14.5 0 7.6
Hospitalizations 11 8 0 19 187 53 1 241 5.9 15.1 0 7.9
Fatalities 7 7 0 14 111 10 0 121 6.3 70.0 0 11.6

14
TABLE 7: Hazardous chemical spills that caused health impacts: Stories vs. all accidents
Hazardous Materials Spilled
Total spills / chem
Number of Hazardous Transportation Spills Involving:
Fatality incidents
Injury incidents
Evacuation incidents
Hwy closure incidents
Stories All Stories All Stories All Stories All
Ammonia 101 4 36 1 40 2 47
Butane 76 8 35 28
Bleach/chlorine 69 2 1 11 19 1 40
Crude oil products 248 2 2 20 2 61
Diesel fuel 260 1 13 3 1 1 15 2 72
Ethanol 115 1 3 3 61 3 81
Fireworks 2 2 2 2 1
Gasahol 300 22 19 35 78
Gasoline 124 6 61 6 6 11 20 11 79
Heating oil 87 3 1 5 1 38
Hydrochloric acid 45 8 19 77 19 69
Hydrogen peroxide 6 1 3 1 9
Jet/rocket fuel 69 1 2 1 9 1 33
Other fuels 4 13 20 1 2
Molten sulfur 57 2 4 1 7
Other
solvents/cleaners
410 1 42 2 130 1 143
Propane 156 7 9 7 42 7 82 7 104
Radioactive
materials
4 2 1
Refrigerants 74 4 3 8 12
Sodium cyanide 4 2 3
Sulfuric acid 70 1 14 9 1 26
Sulphur dioxide 4 2 24 2 3 1
Vinyl chloride 5 5
TOTALS
2285 14 126 34
24
7 48 565 54 874
15
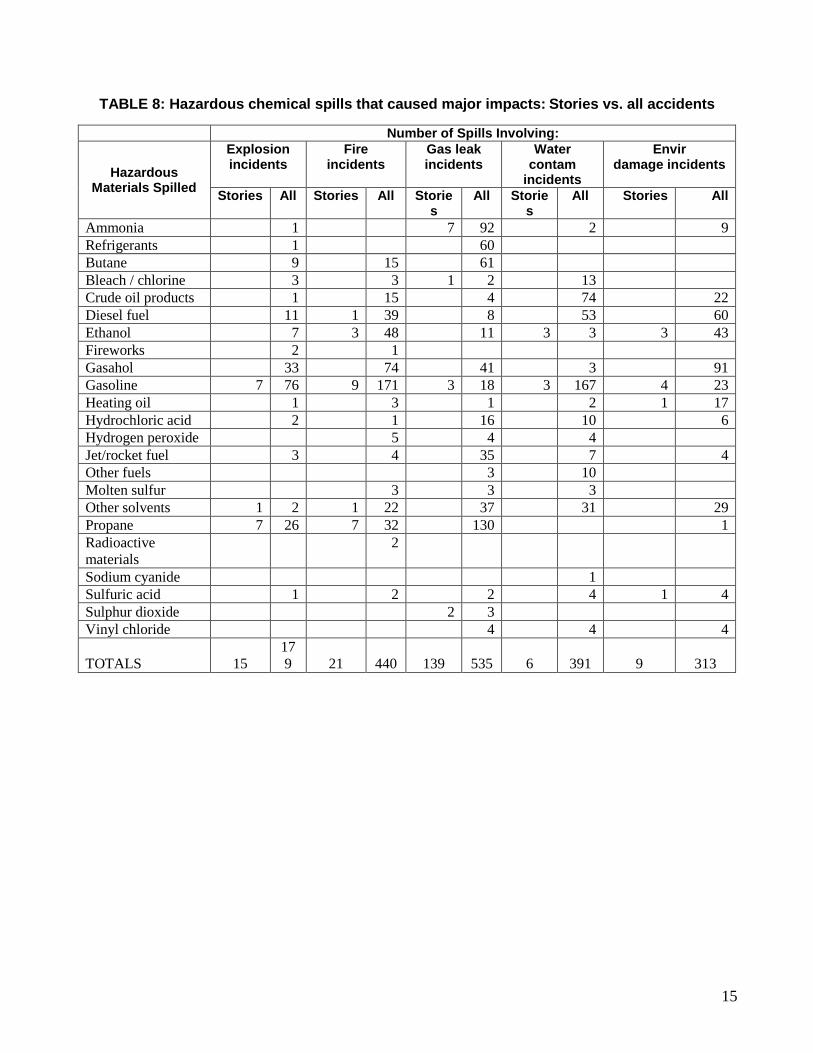
TABLE 8: Hazardous chemical spills that caused major impacts: Stories vs. all accidents
Number of Spills Involving:
Hazardous Materials Spilled
Explosion incidents
Fire incidents
Gas leak incidents
Water contam
incidents
Envir damage incidents
Stories All Stories All Stories
All Stories
All Stories All
Ammonia 1 7 92 2 9
Refrigerants 1 60
Butane 9 15 61
Bleach / chlorine 3 3 1 2 13
Crude oil products 1 15 4 74 22
Diesel fuel 11 1 39 8 53 60
Ethanol 7 3 48 11 3 3 3 43
Fireworks 2 1
Gasahol 33 74 41 3 91
Gasoline 7 76 9 171 3 18 3 167 4 23
Heating oil 1 3 1 2 1 17
Hydrochloric acid 2 1 16 10 6
Hydrogen peroxide 5 4 4
Jet/rocket fuel 3 4 35 7 4
Other fuels 3 10
Molten sulfur 3 3 3
Other solvents 1 2 1 22 37 31 29
Propane 7 26 7 32 130 1
Radioactive
materials
2
Sodium cyanide 1
Sulfuric acid 1 2 2 4 1 4
Sulphur dioxide 2 3
Vinyl chloride 4 4 4
TOTALS 15
17
9 21 440 139 535 6 391 9 313

16
DISCUSSION OF RESULTS
No freight companies communicated about any of the spills, and most of the companies had no social
media presence. Few communicated regularly about anything, through any social media channels.
Companies with fewer accidents were more likely to have social media accounts, while those with the
most accidents typically had no social media presence. No companies communicated about any of the
spills through social media sites.
Most companies had low brand strength because they lacked a social media presence. Few
communicated through social media, contradicting the conventional corporate PR practice of “getting
out in front” of a crisis. Companies with fewer accidents were more likely to have social media
accounts, while those with the most accidents typically had no social media presence. Companies with
the most accidents were the least likely to have any social media presence. Those that spilled high-
threat cargo – including radioactive materials, flammable gas, and mass explosion hazards – were more
likely to have no social media presence. Most companies defied the routine PR practice of “getting out
in front” of a crisis, rather than hide and allow news organizations to run with the story. Apparently,
this occurred because the news media covered very few of the accidents. The next phase will examine
this news coverage.
The news coverage was unexpectedly scant. The first sample searches yielded only 76 stories in 41
newspapers, covering only 29 accidents. We coded all the stories in this universe and found that
99.48% of the 5,555 most serious spills in a decade received no news coverage. The few accidents that
did receive any coverage only had 2.6 stories on average. If every accident had received that much
coverage, the universe would have consisted of 14,443 stories. The second search, which used more
generic search times and excluded chemical names and company names, yielded 191 new stories,
bringing the total number of stories in the sample to 267. This story sample constitutes coverage of
4.8% of the accidents in the spill sample.

17
CONCLUSIONS
The findings showed that public communication about serious transportation spills were nearly non-
existent over a decade.
Social media. Unlike many other kinds of companies in the U.S., freight companies do not engage in
public communications in a crisis. No freight companies communicated about any of the 5,555 spills
via social media. Few companies had any kind of social media or other online presence in the first
place. Most freight companies had low brand strength, including low or no social media presence.
Companies with stronger brand strength were more likely to communicate with the public about
accidents, regardless of severity, but only for dramatic incidents such as fatalities, derailments, or
explosions.
Freight companies with fewer accidents were more likely to use social media; those with the most
accidents often had no social media presence. Companies with low or no social media presence were
more likely to have mass explosion hazards or high-threat cargo spills (i.e., radioactive materials and
flammable gas). Companies with strongest social media presence were more likely to have spills
involving fatalities, gas dispersion, evacuations, fires, hazardous waste, and closure of major roads.
These patterns defy conventional corporate public relations practice. Routine public affairs practice is
to “get out in front” of a crisis, rather than hide and allow news organizations to run with the story. A
notable exception is British Petroleum, which was very slow in responding to the Gulf oil spill crisis.
Eventually, BP did regularly communicate about new developments across several social media
platforms.
The social media analysis applied Coombs’ Situational Crisis Communication Theory, which
anticipates how stakeholders react to a crisis, in terms of reputational threat. This framework
recommends that companies match strategic crisis responses to the level of responsibility and
reputational threat, by evaluating the crisis type, crisis history, and prior relationship reputation. Poor
or nonexistent communication can lead to damages beyond costs of the accident, including litigation,
loss of business, loss of confidence in the organization, and physical risks. Failure to directly transmit a
public messages when a crisis occurs can lead to social amplification of risk via news media, social
media, opinion leaders, and government agencies.
Companies with fewer accidents were more likely to have social media accounts, while those with the
most accidents typically had no social media presence. The companies with higher social media scores
had the most damaging and expensive accidents. Train companies typically had higher Klout scores,
while trucking companies typically had mid-range Klout scores. Companies with mass explosion
hazards or high-threat cargo spills – including radioactive materials and flammable gas – had a very
low or non-existent social media presence. Companies with the strongest social media presence were
significantly more likely to have accidents involving fatalities, gas dispersion, evacuations, fires,
hazardous waste, and closure of major roads.
Some transportation companies with dangerous track records did have social media accounts – but did
not use them to inform the public about spills. Companies with higher Klout scores were significantly

18
more likely to have accidents involving fatalities and injuries. Companies with higher TweetReach
scores were more likely to have accidents involving a fire, explosion, or hazmat fatality.
News conclusions. U.S. newspaper coverage of serious transportation spills was almost non-existent
over the 12-year period. Spills were more likely to be covered when journalists had more access to
authoritative sources, when the perceived risk to citizens was higher, when someone was blamed, or
when the spill involved an unusual chemical or situation. Factors that appeared to not drive coverage
including the visual element of spills, perceived risk/public outrage factors, the objective danger and
severity of the spills, and media access to official reports.
The vast majority of spills involving fatalities, injuries, toxic inhalation, gas dispersion, fires,
explosions, water contamination and environmental damage received no coverage. Spills involving
extremely dangerous substances including radioactive materials, poisonous gas and mass explosion
hazards received little or no attention. Spills that had a visual element such as derailment or objective
severity/threat were not more likely to receive attention than other spills. Reporter access to police, fire
or EMS reports also did not promote news coverage. High-impact events, such as spills causing
injuries, evacuations, toxic gas leaks, or road closings were not more likely to receive attention. Social
amplification of risk appeared to have little, if any, effect on news coverage.
The risk of hazardous transportation spills increases the challenges and potential costs of operating the
intermodal network of highways, rails, waterways, airports, and shipping terminals. Examining how
these accidents are presented to the public could help corporate leaders and policymakers more
effectively determine the levels of transportation-related risk that are acceptable and affordable.
Examining public risk messages about these incidents also may mitigate potential public outrage after
accidents and help transportation leaders identify priorities for response and preparedness.

19
RECOMMENDATIONS
The findings highlight news routines and reporting strategies used in coverage of serious transportation
incidents, as well as significant gaps in public communications about these spills. This project
highlights systemic opportunities for improving public communications about serious spills.
First responders, including police, fire department, and EMS responders, should transmit spill reports
to local media organizations as soon as they can contain the site. Representatives from these
departments, as well as non-local emergency and transportation officials, should provide comments or
written statements to media organizations if requested.
When officials blame a freight company for an unintentional or preventable accident, journalists
should attempt to get a statement from a company representative. Freight companies should train
officials to provide public responses about spills when they are requested. Freight company employees
with a better understanding of corporate crisis communication and reputation management could
minimize the economic and environmental impact of future hazardous spills in intermodal
transportation.
When a freight driver or other operator is blamed, he or she should be given an opportunity for
comment when possible. Freight companies should establish a social media presence and post tweets
or other brief statements when a major spill occurs. Public relations research suggests this transparency
and expressing concern about health and safety can improve the visibility and brand trustworthiness of
any type of company.
Journalists need training about how to find and responsibly cover transportation spills. Within spill
stories, explanatory content such as risk comparisons, relative risk assessments, explanation of
testing/cleanup processes, translation of relevant transportation or risk communication research, and
practical advice to audiences should be provided. This kind of explanatory content can mitigate
negative responses including litigation. Content that amplifies risk can include speculation, use of
unnamed sources, blaming, conflicting reports, vague advice for avoiding exposure to hazards, or false
alarms, and failure to acknowledge serious threats. Below is a model of the factors that can contribute
to higher and lower levels of public understanding about hazardous transportation spills (Figure 2).

20
Figure 2: Communication Factors in Public Understanding of Hazardous Spills
Improved public communication about the actual scope and long-term risks of hazardous spills is
needed to improve local preparedness and crisis response within communities, as well as within
individual freight companies. The findings also could help freight companies mitigate potential public
outrage or media sensationalism, and help transportation and emergency response officials identify
priorities for hazardous spills emergency response, cleanup and hazard mitigation. Transportation
curricula at UTC universities could include a module to train students how to work with the media and
directly communicate about different kinds of transportation accidents.
A follow-up study will explore key questions raised by the social media/news media findings through a
national survey of state DOT officials, freight operators, and news reporters. This data will be used to
contextualize unexpected findings and inform recommendations for both the transportation industry
and the media industry in communicating with the public about hazardous spills. The insights also will
inform a more effective strategy for evaluating social media and news media “blackouts” public
communication about serious transportation spills.
Additional follow-up research could examine how the dearth of public communication about freight
spills causes damages beyond the financial cost of the spills and how transportation companies could
weigh the risks of reputational harm against the societal benefits of improved communication about
spills. Future research also could identify new ways to improve preparedness and response strategies
for future hazmat transport accidents for freight companies, first responders, and journalists. These
improvements could reduce the high social and economic costs of such incidents.

21
ACRONYMS, ABBREVIATIONS, AND SYMBOLS
Chem. Chemical
DOT Department of Transportation
H Hypothesis
Hazmat Hazardous materials
% Percent
PR Public relations
U.S. United States
USDOT United States Department of Transportation

22
REFERENCES
Coombs, T. (2007). “Crisis Management and Communications,” Institute for Public Relations,
http://www.instituteforpr.org/topics/crisis-management-and-communications/
Cragin, D.W. & Swain, K.A. (2016). “Risk and Emergency Risk Communication,” in Health
Communication: Critical Tools and Strategies for Advancing Public Health, 2nd ed. (C. Parvana et al.,
eds.). Burlington, MA: Jones and Bartlett Learning.
Dube, S., Swain, K. A., Vastag, B., Brown, L., & McMahan, S. (1999). U.S. vs. International
Newspaper Coverage of Alternative Medicine, Southwest Mass Communication Journal 14 (2), 24-37.
Lez-Herrero, A.G. & Pratt, C.B. (1996). “An Integrated Symmetrical Model for Crisis-
Communications Management.” http://list.msu.edu/cgi-
bin/wa?A2=ind9601D&L=AEJMC&P=R16240
National Transportation Safety Board: Hazardous Materials Accident Reports,
http://www.ntsb.gov/investigations/reports_hazmat.html
Pipeline and Hazardous Materials Safety Administration (2013). Incident Statistics:
http://www.phmsa.dot.gov/hazmat/library/data-stats/incidents. U.S. Department of Transportation.
Swain, K.A. (2016), “Toxic Transportation Spills: Invisible or Ignored?” Presentation to the University
Transportation Center Conference for the Southeastern Region, Knoxville, Tennessee.
Swain, K.A. & Jordan, L.A. (2015). BP’s Reputation Repair Strategies during the Gulf Oil Spill.
Journal of Risk Analysis and Crisis Response 5 (1), p. 2-15).
Swain, K.A. (2015). “The Role of Practical Advice in Bioterrorism News Coverage,” Health Security,
13 (5), 327-338.
Swain, K.A. (2015). "News Blackout and Social Media Invisibility after Hazardous Transportation
Spills" National Public Health Information Coalition’s National Conference on Health
Communication, Marketing and Media, Atlanta.
Swain, KA (2016). "Toxic Transportation Spills: Invisible or Ignored?" U.S. Department of
Transportation Southeastern Region University Transportation Centers convention. Knoxville, TN.
Swain, KA (2016). “Media Coverage of Toxic Transportation Spills,” UM/UMCC Research Day,
University of Mississippi Medical Center, Jackson, MS.
Swain, KA (2015). “News Blackout and Social Media Invisibility after Toxic Transportation Spills,”
National Public Health Information Coalition annual National Conference on Health Communication,
Marketing and Media, Atlanta.

23
Swain, KA (2015). "Direct and Indirect Public Communication about Toxic Transportation Spills."
U.S. Department of Transportation Southeastern Region University Transportation Centers convention.
Birmingham.
Swain, KA (2015). “Perceived Risk vs. Risk Framing Preferences in News Coverage of Terrorism,”
Association for Politics and the Life Sciences annual convention, Atlanta.
Swain, KA (2014). “Social Media Presence and Reputational Threat of Companies Involved in Toxic
Spills.” Society for Risk Analysis annual international convention, Denver.
Swain, K. A. (2012). Explanation of Risk and Uncertainty in News Coverage of an Anthrax Attack.
Journal of Risk Analysis and Crisis Response 2 (2): 81 – 95.
Swain, K. A. (2012). Delivering the Scary News: Newspaper Sourcing in a Bioterrorism Crisis. Online
Journal of Communication and Media Technologies, 2 (2).
Swain, K.A. (2010). Moral Development Framing in Environmental Justice News Coverage. In
Communicating Science: New Agendas in Science Communication. NY: Routledge (L. Kahlor & P.A.
Stout, eds), p. 209-232.
Swain, K. A. (2007). Outrage Factors and Explanations in News Coverage of the Anthrax Attacks.
Journalism & Mass Communication Quarterly 84 (2), 335-352.
Swain, K. A. (2007). Sourcing Patterns in News Coverage of the Anthrax Attacks. International
Journal of Mass Emergencies and Disasters 25 (2), 57-96.
USDOT (2012). Emergency Response Guidebook: A Guidebook for First Responders During the
Initial Phase of a Dangerous Goods/Hazardous Materials Transportation Incident. U.S. Department of
Transportation. http://wwwapps.tc.gc.ca/saf-sec-sur/3/erg-gmu/erg/ergmenu.aspx