Embed Size (px)
Citation preview


UNIVERSITY OFILLINOIS L.tiRARY
AT URBANA-CHAiVlPAIGN
BOOKSTACKS

'
Digitized by the Internet Archive
in 2011 with funding from
University of Illinois Urbana-Champaign
http://www.archive.org/details/riskattitudesris1214fieg

_
S~T
BEBRFACULTY WORKINGPAPER NO. 1214
Risk-Attitudes and the Risk Return
Paradox: Prospect Theory Explanations
Avi Fiegenbaum
Howard Thomas
~o
College of Commerce and Business AdministrationBureau of Economic and Business ResearchUniversity of Illinois, Urbana-Champaign


BEBRFACULTY WORKING PAPER NO 1211
College of Commerce and Business Administration
University of Illinois at Ur
b
ana-Champ a 1 gn
Decembe r 198 5
Risk- Attitudes and the Risk Return ParadonProspect Theory Explanations
A vi Fiegenbaum, AssistantDepartment of Business Administration
Howard Thomas, ProfessorDepartment of Business Administration
Department of Business AdministrationUniversity of Illinois at Urbana-Champaign350 Commerce West, 1206 S Sixth StreetChampaign , I L 6 1920
Phone 2 l7 ' 333-424


Abstract
This paper attempts to explain and rationalize Bowman's (1980) risk-
return paradox in terms of the concept of risk attitudes and propositions
drawn from prospect theory (Kahneman and Tversky (1979)). Using an
extensive Compustat-based sample of U.S. firms, negative risk-return
association is consistently found for firms having returns below target
ROE levels whereas positive association is equally consistently found
for firms having returns above target ROE levels. It should be noted
that these results are supportive of the basic propositions of prospect
theory and are extremely robust, i.e., they hold both within and across
industries and for all time periods studied. This study also supports
Bowman's (1982) notion that troubled firms take larger risks. There-
fore, it is argued that future research should concentrate upon clearer
identification of factors influencing risk and the formation of risk
attitudes in different industry and environmental contexts.

INTRODUCTION
The relationship between risk and return has received considerable
attention from researchers in business administration, economics and
finance. Conventional economic wisdom (e.g., Brealey and Myers (1981))
suggests that risk and return are positively correlated. This is
based on the assumption that decision-makers are risk averse, and that
therefore, higher returns will be required for riskier investments.
Existing research studies (most of which are summarized in Table I
of this paper) have largely supported the positive risk-return asso-
ciation. However, Bowman (1980) discovered that within a majority of
industries risk and return were negatively correlated. He described
this research outcome as a "paradox" for strategic management, since
the findings ran counter to the conventional wisdom that argued for
positive association. In later papers (Bowman (1982), (1984)) sought
to explain this paradox and offered a series of managerial, accounting
and attitudinal explanations. For example, he proposed that sound
strategic management would enable firms to achieve both higher return
and lower variance through accounting income smoothing and the identi-
fication of the "right" strategy for the firm. Further, he argued
that firms' risk attitudes may influence risk-return profiles and that
more troubled firms may take greater risks.
This study attempts to explore the role of risk attitudes in the
management of strategic risk and provide a richer understanding of
Bowman's risk/return paradox in terms of the concept of attitudes
towards risk. Attitudes towards risk have been conceptualized in
theoretical terms by a series of well-known utility theorists in

-2-
business and economics (for example, Arrow (1965), Friedman and Savage
(1948), Markowitz (1959), Raiffa (1968), Libby and Fishburn (1977)).
More recently, Kahneman and Tversky (1979) and Tversky and Kahneman
(1981) have noted that individuals are risk seeking when faced with
loss situations or when they are below their target or aspiration
levels. Therefore, they proposed a theory of risky choice called
prospect theory which questions the assumption of global risk aversion
in utility theory.
According to prospect theory, risk preferences are a mixture of
risk seeking and risk averse behavior which is reflected in an appro-
priately defined value (or utility function). The concept of a target
or reference point serves to delineate the domain of the decision
maker's utility function into a region of gains and a region of losses.
The target point can be conceptualized as either a current wealth level
or an aspiration level that serves as a goal or target for the individ-
ual. The form of the utility function is consistent with a mixture
of risk seeking behavior below the target level and risk averse behav-
ior above the target level. This pattern of behavior has also been
confirmed in several empirical studies including those by Mao (1970),
Siegel (1957), Kahneman and Tversky (1979) and Laughhunn, Payne, and
Crum (1980).
From a research viewpoint, it is important to question whether the
experimental-individual research results on risk attitudes and risky
choice (such as those of Kahneman and Tversky (1979), or Laughunn,
Payne and Crum (1980)) can be translated into the world of corporate
organization behavior. Bowman (1982) noted that the literatures of
-3-
economics and political science both advance the proposition, in models
commonly described as rational-actor models (Allison (1971)), that the
organization (firm) may act as an individual. Indeed, his research
based upon content analyses of companies in three industries confirmed
the notion that companies may behave in a similar manner to individual
decision-makers. He found that troubled companies (like troubled
individuals) take larger risks— thus, supporting the adoption of the
experimental-individual research in the context of corporate decision-
making.
In this study, it is assumed that individual-level risky choice
' research can provide a framework for understanding firm-level, cor-
porate risk decisions. Therefore, a research methodology will be
developed to test the hypothesis that attitudes toward risk (concep-
tualized in terms of prospect theory's utility function) can explain
the relationship between risk and return both across firms and within
industries . It will be hypothesized that the risk/return relationship
has a U-shaped form meaning that negative association is expected
below the target (reference point) return level and positive associa-
tion above the target return level.
The paper begins with a literature review of previous risk-return
studies. Research hypotheses and methodologies are then formulated
and results presented and interpreted. Conclusions about appropriate
future strategic risk studies are then identified. It is argued that
industry-level risk-return studies should be the benchmark for further
understanding of corporate strategic risk.
-4-
THEORETICAL BACKGROUND AND LITERATURE REVIEW
Risk-Return Research
Some of the important studies which have examined risk return pat-
terns in different industry contexts are summarized in Table I, and
discussed in succeeding paragraphs.
INSERT TABLE I ABOUT HERE
Conrad and Plotkin (1968) investigated the relationship between
risk and return across U.S. industries for the 1950-1965 time period.
Their data included 783 firms representing 59 industries (SIC 2 digit).
Calculating the average risk and return for each industry, regression
analysis was used to estimate the impact of industry risk on industry
return. They found a significant positive relationship between
industry average risk and return.
Fisher and Hall (1969) investigated the impact of risk on return,
covering firms from 11 industries, for the 1950-1964 period. In one
test all the firms were pooled together and a significant positive
impact of firm risk on return was demonstrated. Fisher and Hall intro-
duced a dummy variable to account for the industry effect (i.e., dif-
ferences in industry characteristics) in their regression equations.
They again found significant positive risk-return association at the
industry level.
Cootner and Holland (1970) also examined the relationship between
risk and return, for both firm and industry levels. They used data
drawn from 315 firms in 39 industries for the 1946-1960 period. In the
-5-
industry-level investigation, they found a significant positive rela-
tionship between risk and return for the whole period. Performing the
industry-level regression analysis for each year separately they found
positive relationships which were statistically significant for about
half of the years under study. When they pooled all firms together to
test the overall relationship between risk, and return they again found
a significant positive relationship.
Hurdle (1974) used cross section data drawn from 228 United States
manufacturing firms, and a sample of 85 manufacturing industries to
examine both the firm and industry risk-return effect. In the firm-
level study, which covered the 1960-1969 time period, significant
positive correlations between firm risk and return were found. Hurdle
also researched the impact of risk on return at the industry level and
again found a significant positive association between risk and return,
Armour and Teece (1978) did not directly assess the nature of the
risk return relationship. In a study investigating the impact of
organizational structure on economic performance for a sample of 28
firms from the petroleum industry for the period 1955-1973, they
introduced a risk measure in their equation for two periods: 1955-196*
and 1969-1973. The estimated coefficients of risk were found to be
negative in sign, but they were not significantly different from zero
at the 90 percent confidence interval.
Neumann, Bobel, and Haid (1979) investigated the relationship be-
tween risk and return for a sample of 334 West German industrial firms
for the 1965-1973 time period. Two measures of risk were calculated:
first the variance of firm profit over time and second, the covariance
-6-
of firm profit with the market portfolio. When all firms were pooled
together in their regression equation, both measures of risk showed
significant positive association with return. When the firms were
divided into two groups according to their size, (small or large firms)
negative risk return relationships were identified. In the case of
large firms the covariance risk measure was negatively correlated with
return whereas for small firms the variance risk measure was nega-
tively correlated with return. However, the researchers downplayed
the negative impact findings arguing that "we found it unreasonable to
accept the implication that investors are risk lovers," (p. 229,
emphasis is added)
.
Bowman (1980) investigated the risk/return association at both the
firm and industry levels using Value Line data. Bowman's main research
results are summarized below.
The main sample consisted of 85 industries and 1572
companies for the nine-year period (1968-76). Of
this total set of 85 industries, 56 supported the
hypothesis of a negative correlation between risk
and return (statistically significant beyond 0.001),21 refuted it and eight were tied.
A smaller sample of 1 1 industries from Value Linewas also analyzed for the time period 1972-76. Ten
out of the 11 industries studied showed negativeassociation over the five-year time period (Bowman(1982:35)).
Bowman coined the term "paradox" for his findings since economic
theory and the results of the majority of previous empirical studies
had postulated the existence of positive correlation between risk and
return.

-7-
Treacy (1980) replicated Bovraian's results with the Standard & Poor
Compustat database. For a sample of 1,458 firms representing 54 two
digit SIC industries for the time period 1966-1975, he found that risk
and return were negatively correlated within and across industries.
Treacy also examined whether firm size would explain the negative risk-
return relationship but he did not find significant results.
In a later study, Bowman (1982) provided a preliminary test of the
hypothesis that the paradox may be explained by the firm's attitude
toward risk. Three content analysis studies involving firms in the
food processing, computer, and container industries supported the risk
attitude hypothesis. Bowman speculated that troubled firms may take
more risk than their more successful peers, which would be consistent
with the "paradox" findings.
The hypothesis that certain corporate diversification strategies
may influence risk-return performance has been tested by Bettis (1981),
Montgomery and Singh (1984) and others using Rumelt's (1974) categories
of diversification strategy. Bettis (1981), Bettis and Hall (1982),
and Bettis and Mahajan (1984) investigated the relationship between
risk and return for related and unrelated diversified firms for a
sample of eighty companies examined over the 1973-77 time period.
They showed that a negative relationship (high return, low risk or
vice-versa) is more likely to exist for related diversified than unre-
lated diversified organizations. Bettis and Mahajan (1984: 16) also
noted the importance of industry characteristics in determining
superior risk return performance. They therefore conclude that such
-8-
factors as diversification strategy and industry context may explain
the existence of the risk-return paradox.
Marsh and Swanson (1984) re-examined Bowman's risk-return results
using a different research methodology. They adjusted firm ROE in
order to eliminate autocorrelation among observations over time. In
addition, they adopted a transformation to eliminate the cross-
sectional interdependence between the ROEs for different firms in the
same year or quarter. For their research sample which included 135
firms for the time period 1958-1981 they found no significant negative
correlation between average ROEs and their variance.
Fiegenbaum and Thomas (1985a, 1985b) hypothesized that the risk-
return paradox may depend upon the time period studied. They,
therefore, examined the dynamic behavior of Bowman's risk/return
relationship and questioned whether the risk return paradox is stable
across time. They included more than 2000 firms representing 48 SIC
two digit industries for the time period 1960-1979. Separate analyses
were performed for the non-overlapping five year time periods 1960-64,
1965-69, 1970-74 and 1975-1979 using the Compustat® data base. They
found significant negative association for the two time periods in the
1970's while positive association (though only significant for 1965-69)
was found for the two time periods in the 60 's. They also showed that
the paradox disappears when market-based risk measures were used.
Therefore, to summarize the existing risk-return literature (shown
in Table I) a number of variables, including size, time, industry
environment and diversification strategy, have been used to explain
the characteristics of the risk/ return association. While most of

-9-
the studies found positive risk-return correlation, particularly
those studies involving data covering time periods in the late 1950's
and 1960's, negative association (the risk-return paradox) was more
commonly found with sample data drawn from time periods in the 1970 's.
Prospect Theory in Risk/Return Studies
Most of the literature dealing with risky choice behavior assumes
that decision makers are risk averse. This assumption is a basic pre-
mise of much research in business, finance, economics, and management
science. In terms of utility theory, the assumption implies that a
decision maker has an utility function which is uniformly concave.
Many researchers (e.g., Friedman and Savage (1948), Grayson
(1959), Yaari (1965), Swalm (1966)) have questioned the assumption of
global risk aversion on both theoretical and empirical grounds.
Indeed, Fishburn (1977) developed a set of models in which he showed
the existence of a U-shaped function which captured the relationship
between risk and return. Fishburn and Kochenberger (1979) empirically
assessed 30 utility functions for below target data and above target
data and concluded that the majority of below-target and above-target
functions are risk seeking and risk averse, respectively.
The majority of below target functions were riskseeking; the majority of above target functionswere risk averse; and the most common compositeshape was convex-concave, or risk seeking in
losses and risk averse in gains (Fishburn andKochenberger (1979), p. 503).
Kahneraan and Tversky (1979) proposed prospect theory in order to
counter the criticisms expressed about utility theory and the assump-
tion of global risk aversion. According to prospect theory, outcomes

-10-
are expressed as positive or negative deviations (gains or losses)
from a neutral reference outcome which is assigned a value of zero.
The value function is convex below the reference outcome and concave
above the reference outcome, which is consistent with the assumption
of risk aversion in choices involving gains and risk, seeking in
choices involving losses.
Following a series of laboratory experiments, they confirmed the
convex-concave form of the value function and other basic properties
of prospect theory. In a laboratory study, Laughunn, Payne, and Crum
(1980) also reported on the risk preferences for below target returns
of 224 managers from U.S., Canada, and Europe. They found that when
only non-ruinous losses were involved, 71% of the managers were risk
seeking for below target returns (p. 1238). These findings were also
confirmed when conditions such as managers' background, the size of
the below target outcome, and the context of personal risks versus
managerially based risks were considered (see also Crum, Laughhunn
,
and Payne (1980)).
In summary, prospect theory argues that decision makers are risk
seekers below a target level and risk averse above a target level.
Both laboratory experiments and real world situations have confirmed
this behavior. Following Bowman (1982) it is assumed that firms
behave as individuals in risky choice situations and that prospect
theory can explain Bowman's risk-return paradox. Therefore, in the
next section prospect theory explanations of firm and industry-level
risk-return associations are examined and tested.
-11-
RESEARCH HYPOTHESES AND METHODOLOGY
As noted earlier in this paper, prospect theory argues that the
risk/return relationship has a nonlinear functional form. Below the
target return or wealth level, decision-makers are risk seeking while
above the target level, decision-makers are risk averse. Therefore,
assuming individual decision-maker and firm risk preferences are in
one-to-one correspondence, the broad formal research hypotheses can be
stated as follows:
Hi: A negative association between risk and return existsfor firms below target return levels no matter what are
the underlying environmental conditions.
H2: A positive association between risk and return existsfor firms above target return levels no matter what are
the underlying environmental conditions.
More-f ocussed research hypotheses which propose that prospect
theory's findings should hold both within and across industries are
structured in the following manner:
Hla: A negative association between risk and return existsfor firms below target return levels within industries.
Hlb: A negative association between risk and return existsfor firms below target return levels across industries.
and
H2a: A positive association between risk and return existsfor firms above target return levels within industries.
H2b: A positive association between risk and return existsfor firms above target return levels across industries.
In order to operationalize these research hypotheses certain research
issues merit attention. They include the determination of an appro-
priate target level and the identification of an appropriate research

-12-
sample and research methodology. These issues are discussed in turn
in the following paragraphs.
Determining a Target Level
An important issue in operationalizing prospect theory is to iden-
tify a measure for the target return (wealth) level. There is no
general rule which defines the appropriate target for each situation,
although Tversky and Kahneman (1981) recognize the problem and suggest
a number of useful criteria for choosing an appropriate target. In
this study the traditional literature of financial statement analysis
provides a basis for setting an appropriate return target. Lev (1969:
290) suggests that firms adjust their performance to the industry
average. He emphasizes "the desirability of adjusting the firm's
financial ratios to predetermined targets which are usually based on
industry wide averages." Lev (1969) also performed an empirical study
on 900 major U.S. firms in which he confirmed the hypothesis that
financial ratios are periodically adjusted to their industry means.
Frecka and Lee (1983) used another data set for a study of financial
ratios and their results support Lev's (1969) hypothesis that finan-
cial ratios adjust in a dynamic fashion to targets which appear to be
industry wide averages of those ratios. Therefore, an average per-
formance (return) level may be used as an appropriate proxy for a
given firm's target level.
Since the purpose of this study is to test the nature of the asso-
ciation between risk and return, both within and across industries,
the following target return levels were assumed. First, for firms

-13-
within the same industry the industry median ROE (return on equity)
was used as the target measure. Second, the overall sample median
ROE was used as the target across industries.
Sample, Measures, and Time Period
The COMPUSTAT® data base was used to develop a research sample of
firms and industries for the 1960-1979 time period. This time period
was chosen since it represented a wide range of economic and environ-
mental conditions and also covered the range of time periods examined
in Bowman's (1980, 1982) studies. Separate analyses were then
performed for the nonoverlapping five year time periods 1960-64,
1965-69, 1970-74 and 1975-79, for the ten year periods 1960-69 and
1970-79 respectively, and finally, for the entire twenty year period
1960-1979. These different time periods were selected in order to
examine the possibility that the choice of different time periods may
influence risk-return results. For each time period, the average ROE
and variance of ROE were calculated as measures of firm return and
risk. The variance of a firm's return over time has been used as a
proxy for risk by many researchers such as Fisher and Hall (1969),
Armour and Teece (1978), Bettis (1981) and Bowman (1980). However,
while financial economics emphasizes the importance of systematic
risk, in this study accounting measures of risk will be used since
they can be more directly controlled and used by management. Further,
by using accounting measures, the research results can be compared
with previous studies that have used the same measures.

-14-
In order to examine hypotheses (Hla and H2a) about the nature of
the risk-return association within industries the following procedure
was adopted. For each time period, the average ROE and variance of
ROE were calculated for each firm in each SIC two digit industry.
Only industries with at least five firms in each category (below and
above the target level) were included in the research sample. Within
each industry a rank order of all firms based on average ROE for
the time period was constructed and then divided at the median. Firms
with ROE values below the industry median were considered as below
target and vice-versa. The total sample included 47 industries and
2322 firms for the 1975-79 period—the final period in the research
sample.
Hypotheses (Hlb and H2b) about risk-return patterns across indus-
tries were examined in a similar manner. As in the case of the
industry level research, the average ROE and variance of ROE were
calculated for each firm for each time period. A rank order of all
firms across all industries based on average ROE for the time period
was then constructed and divided at the median. Firms below the
median were considered as below target and vice-versa. Again the
sample involved 2322 firms for the 1975-79 period.
Statistical Tests for Investigating theRisk/Return Association
In testing the risk/return association, a choice had to be made
between using parametric or non-parametric statistical tests (Winkler
and Hays (1975)). Nonpararaetric tests were used for the following
reasons. First, when the risk-return data were graphed extreme
-15-
outliers were found which could bias the results found from parametric
tests. Second, since the research interest focussed upon the sign
rather than the size of the risk-return association, it was felt that
non-parametric tests might be more appropriate. Third, a number of
previous studies (for example, Bowman (1980), Treacy (1980), and
Fiegenbaum and Thomas (1985)) had justified the use of non-parametric
tests for similar problems.
Two basic non-parametric approaches were used in this study.
First, contingency table analysis was performed in the following
manner. For each category (below target return and above target re-
turn) a rank order of all firms for each characteristic, namely, ROE
and ROE variance was constructed and then divided at the median. Each
firm was then deemed to be high or low on each of the characteristics
leading to one of the four possibilities (or quadrants in a two by two
contingency table): High ROE, High variance (HH) , High ROE, Low
variance (HL) , Low ROE, High variance (LH) and Low ROE, Low variance
(LL). Negative association ratios (i.e., (HL + LH) divided by
(HH + LL)) were calculated for each category (below and above target),
for each SIC two digit industry, for each time period, as well as for
all firms pooled across industries.
Second, measures of risk-return association using Spearman rank
order correlation coefficients (Winkler and Hays (1975:867)) were
calculated from the risk-return rank order data derived from the
industry and firm risk-return analyses.
Thus, Spearman rank order correlations and negative association
ratios were calculated for each SIC 2 digit industry, as well as for

-16-
the entire sample. This procedure was repeated for each one of the
seven time periods: 1960-64, 1965-69, 1970-74, 1975-79, 1960-69,
1970-79, and 1960-79.
In summary, the research procedures in this section are designed
to test the hypothesis that negative association between risk and
return will be found for firms below target (ROE) levels and positive
association will be found for firms above target (ROE) levels both
within and across industries. It should be noted that two target ROE
levels were assumed, namely, the industry median ROE for studying the
risk return association within industries, and the overall firm median
ROE for studving risk return association across industries. Further,
in order to maintain consistency with previous risk-return research,
two non-parametric tests involving the use of contingencv tables and
Spearman rank order correlation analysis were used to analyze risk-
return associations for different time periods.
RESEARCH RESULTS
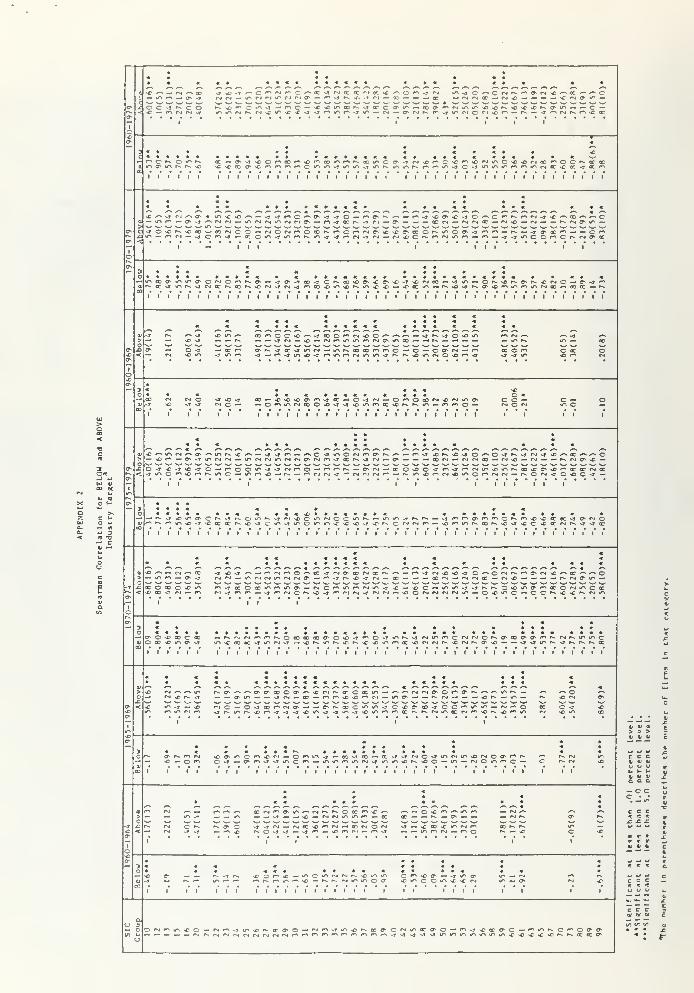
The detailed research results are reported in Appendices 1 and 2
of the paper. However, the main results are summarized in Tables 2
through 5 and are interpreted in the following discussion.
Below Target-Level Results
The results identifying risk-return patterns below target return
levels (essentially Hvpothesis 1) are first presented.
-17-
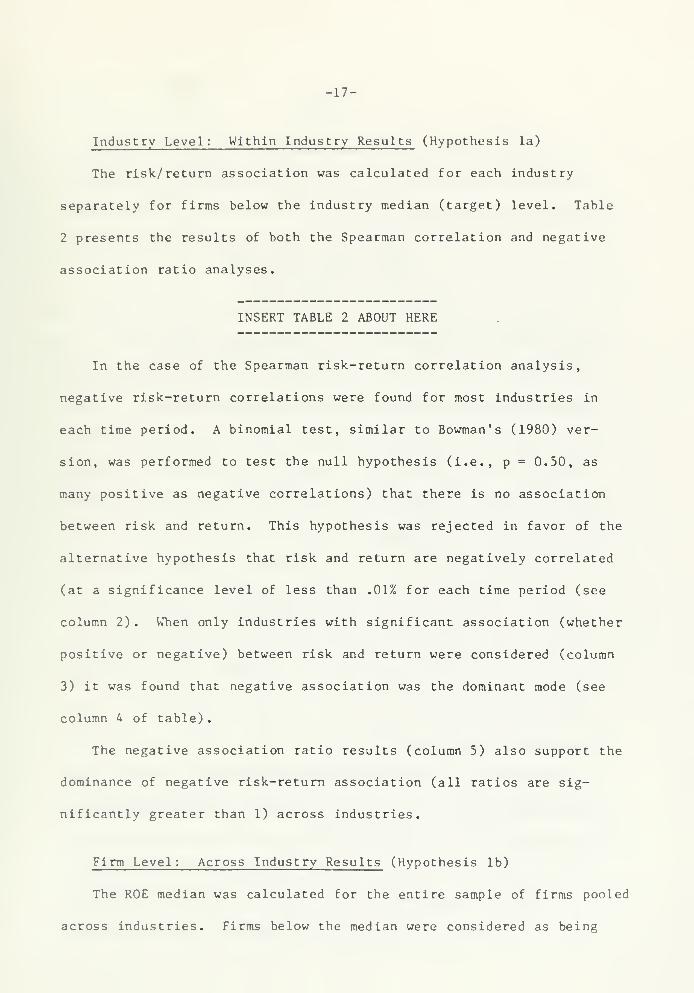
Industry Level: Within Industry Results (Hypothesis la)
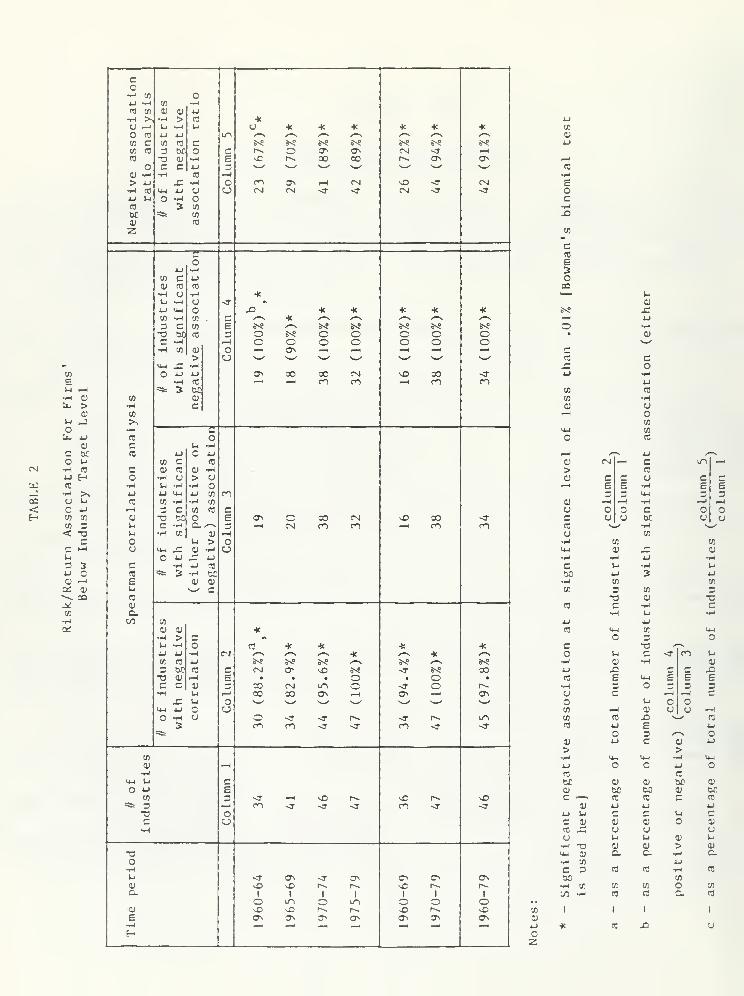
The risk/return association was calculated for each industry
separately for firms below the industry median (target) level. Table
2 presents the results of both the Spearman correlation and negative
association ratio analyses.
INSERT TABLE 2 ABOUT HERE
In the case of the Spearman risk-return correlation analysis,
negative risk-return correlations were found for most industries in
each time period. A binomial test, similar to Bowman's (1980) ver-
sion, was performed to test the null hypothesis (i.e., p = 0.50, as
many positive as negative correlations) that there is no association
between risk and return. This hypothesis was rejected in favor of the
alternative hypothesis that risk and return are negatively correlated
(at a significance level of less than .01% for each time period (see
column 2). When only industries with significant association (whether
positive or negative) between risk and return were considered (column
3) it was found that negative association was the dominant mode (see
column 4 of table)
.
The negative association ratio results (column 5) also support the
dominance of negative risk-return association (all ratios are sig-
nificantly greater than 1) across industries.
Firm Level: Across Industry Results (Hypothesis lb)
The ROE median was calculated for the entire sample of firms pooled
across industries. Firms below the median were considered as being

-18-
below the target level. The left-hand side of Table 3 presents the
values of both the Spearman correlation and the negative association
ratio for "below target" firms.
INSERT TABLE 3 ABOUT HERE
It should be noted that for every time period, the Spearman risk-
return correlation was found to be significantly negative at a signif-
icance level less than .01%. The results were also confirmed by the
negative association ratio analysis which shows that the values of
these ratios are consistently greater than 1 (meaning negative asso-
ciation) for all time periods. Therefore, Hypothesis lb is strongly
supported across a wide range of industries using the results shown in
column 5 of Table 2 and Table 3.
In summary, the results in Tables 2 and 3 support the hypothesis
(HI) that a negative association exists between risk and return for
firms with ROE's below the target level for all time periods. In
addition, this hypothesis is strongly confirmed both within (Hla) and
across (Hlb) industries.
Above Target-Level Results
The results examining risk-return patterns above target return
levels (essentially Hypothesis 2) are reported in the following sec-
tions.
-19-
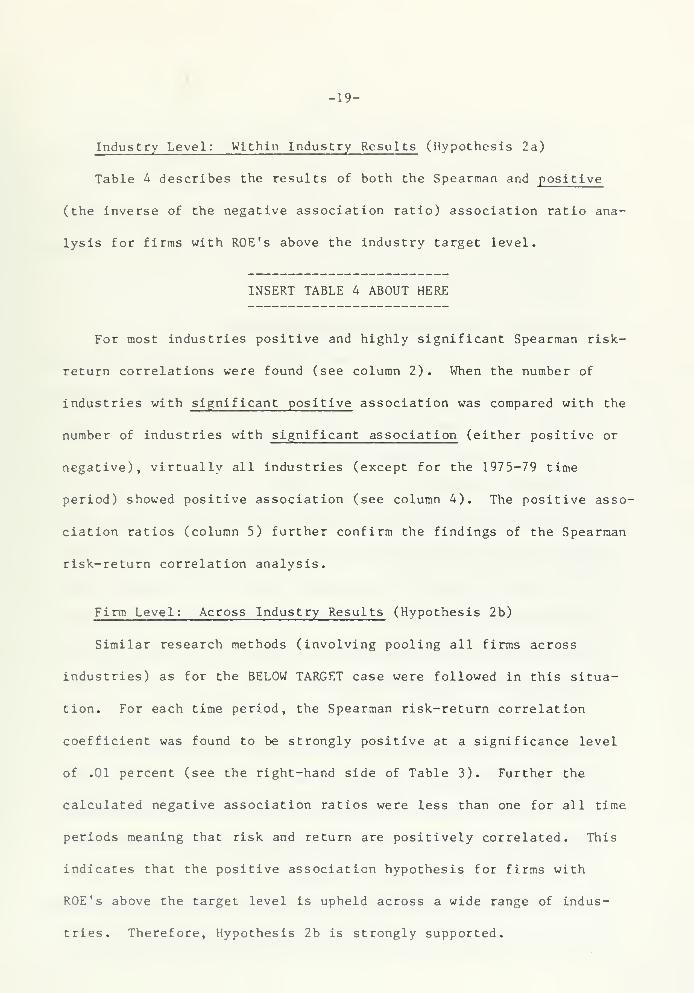
Industry Level: Within Industry Results (Hypothesis 2a)
Table 4 describes the results of both the Spearman and positive
(the inverse of the negative association ratio) association ratio ana-
lysis for firms with ROE's above the industry target level.
INSERT TABLE 4 ABOUT HERE
For most industries positive and highly significant Spearman risk-
return correlations were found (see column 2). When the number of
industries with significant positive association was compared with the
number of industries with significant association (either positive or
negative), virtually all industries (except for the 1975-79 time
period) showed positive association (see column 4). The positive asso-
ciation ratios (column 5) further confirm the findings of the Spearman
risk-return correlation analysis.
Firm Level: Across Industry Results (Hypothesis 2b)
Similar researcb methods (involving pooling all firms across
industries) as for the BELOW TARGET case were followed in this situa-
tion. For each time period, the Spearman risk-return correlation
coefficient was found to be strongly positive at a significance level
of .01 percent (see the right-hand side of Table 3). Further the
calculated negative association ratios were less than one for all time
periods meaning that risk and return are positively correlated. This
indicates that the positive association hypothesis for firms with
ROE's above the target level is upheld across a wide range of indus-
tries. Therefore, Hypothesis 2b is strongly supported.
-20-
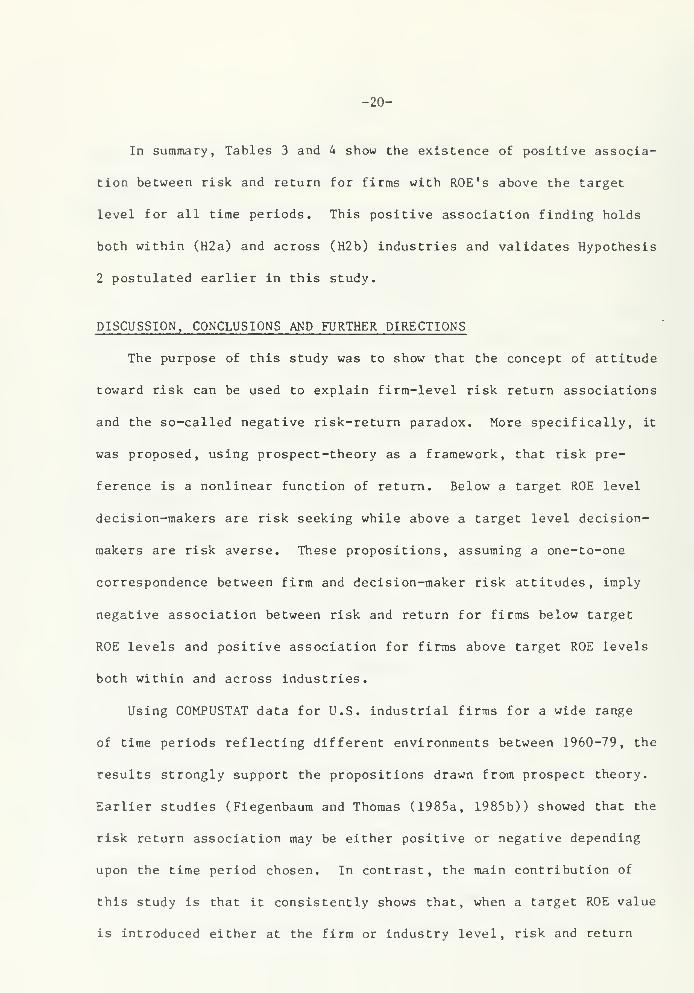
In summary, Tables 3 and 4 show the existence of positive associa-
tion between risk and return for firms with ROE's above the target
level for all time periods. This positive association finding holds
both within (H2a) and across (H2b) industries and validates Hypothesis
2 postulated earlier in this study.
DISCUSSION, CONCLUSIONS AND FURTHER DIRECTIONS
The purpose of this study was to show that the concept of attitude
toward risk can be used to explain firm-level risk return associations
and the so-called negative risk-return paradox. More specifically, it
was proposed, using prospect-theory as a framework, that risk pre-
ference is a nonlinear function of return. Below a target ROE level
decision-makers are risk seeking while above a target level decision-
makers are risk averse. These propositions, assuming a one-to-one
correspondence between firm and decision-maker risk attitudes, imply
negative association between risk and return for firms below target
ROE levels and positive association for firms above target ROE levels
both within and across industries.
Using COMPUSTAT data for U.S. industrial firms for a wide range
of time periods reflecting different environments between 1960-79, the
results strongly support the propositions drawn from prospect theory.
Earlier studies (Fiegenbaum and Thomas (1985a, 1985b)) showed that the
risk return association may be either positive or negative depending
upon the time period chosen. In contrast, the main contribution of
this study is that it consistently shows that, when a target ROE value
is introduced either at the firm or industry level, risk and return

-21-
are negatively correlated for below-target firms and positively
correlated for above target firms irrespective of the time period or
the underlying environmental conditions. This suggests, in line with
the behavioral assumptions of prospect theory, that the majority of
firms may be risk, seeking in loss situations or when they are below
target aspiration levels. Conversely, they will tend to be risk averse
following achievement of aspirations and targets.
The study's empirical results can be described graphically in
terms of Figure 1.
INSERT FIGURE 1 ABOUT HERE
In that figure, two hypothetical lines are drawn to describe the
association between risk and return. Line 1 represents a consistently
negative risk-return association whereas line 2 represents a consis-
tently positive risk-return association. However, the results derived
from this study suggest that the risk-return relationship in both
cases is probably non-linear and U-shaped as exemplified by Curves 3
and 4 respectively. Curves 3 and 4 may, therefore represent the
"true" relationship between risk and return.
If the U-shaped function is a realistic representation of the
risk-return association, it seems sensible to examine the risk return
association for firms close to the "target" level. Prospect theory
would suggest that there will be almost no measurable association
between risk and return when firms near the target level are con-
sidered. In order to test this hypothesis the sample of firms was
divided into tertiles, representing below target, target and above
-22-
target segments respectively. Spearman rank order correlations were
calculated at both the firm and industry levels. Table 5 presents the
results for only the middle or target segment.
INSERT TABLE 5 ABOUT HERE
It can be seen that most of the industries around the middle or
target segment tertile show no significant association between risk
and return (column 2). Spearman correlations calculated across firms
also show little evidence of significant association between risk and
return (column 3). These findings support the hypothesis of no
significant correlation around the target level.
While the U-shaped risk-return relationship proposed in the paper
appears to be an appropriate model to explain observed risk-return
relationships, further research must concentrate upon the nature of
risk return trade-offs for firms which are categorized as being either
below or above target level. It is probable that this research should
be carried out first at the industrv level in order to control for fac-
tors and characteristics explaining risk at the industry level (Baird
and Thomas (1985)). Within a given industry, some below target firms
may have exhibited such behavioral tendencies as escalating commitment
to particular courses of action (Staw (1981)) or organizational inertia
to changing circumstances (MacMillan and MacCaffery (1982)) which may,
in turn, lead to the possibility of high risks and low returns. However,
some firms of larger size may be able to trade-off risk and return to
achieve high returns and low risks and achieve above-target performance.
Yet, factors such as organizational rigidity or X-i nef f iciency

-23-
(Leibenstein (1966)) may impede other large firms from achieving high
return-low risk profiles. Therefore, further industry studies such as
d'Aveni's (1985) paper on risk-return strategy trade-offs in the forest
products industry should provide insights about the nature of risk-
return trade-offs within particular industries. In addition, other
managerial explanations—such as agency theory and diversification
strategy—can be tested more fully in 'rich' fine-grained (Harrigan
(1985)) studies of single industries. These 'rich' studies are also
fully consistent with Bowman's (1980:27) suggestion that industry-
specific characteristics, such as regulation or industry context
(service vs. manufacturing), may provide reasonable conjectures about
the causes of observed risk-return trade-offs and thus enrich our
understandings of the factors influencing negative risk-return
associations
.

-24-
Footnotes
The median (ROE) level was chosen since it represents the 'middle
point' of the return distribution and is unaffected by extreme
outliers. Thus, the median may better indicate managerial perceptions
of target performance than the mean.

-25-
REFERENCES
Allison, G. T. Essence of Decision , Boston, Mass.: Little, Brown,
1971.
Armour, 0. H. and D. J. Teece. "Organizational Structure and EconomicPerformance: A Test of the Multi-Divisional Hypothesis," BellJournal of Economics , 9, Spring 1978, pp. 106-122.
Arrow, K. J. Aspects of the theory of risk, bearing. Helsinki, FinlandYrjo Johnssonin, 1965.
Baird, I. S. and H. Thomas. "Toward A Contingency Theory of StrategicRisk-Taking," Academy of Management Review , 10, 2, April 1985, pp.230-244.
Bettis, R. A. "Performance Differences in Related and UnrelatedDiversified Firms," Strategic Management Journal , Vol. 2, 1981,379-393.
Bettis, R. A. and W. K. Hall. "Diversification Strategy, AccountingDetermined Risk and Accounting Determined Return," Academy of
Management Journal , 25, 2, 1982, 254-264.
Bettis, R. A. and V. Mahajan. "Risk/Return Performance of DiversifiedFirms," Management Science , 31, 7, July 1985, 785-800.
Bowman, E. H. "A Risk/Return Paradox for Strategic Management,"Sloan Management Review , Spring 1980, 17-31.
Bowman, E. H. "Risk Seeking by Troubled Firms," Sloan ManagementReview , Summer 1982, 33-42.
Bowman, E. H. "Content Analysis of Annual Reports for CorporateStrategy and Risk," Interfaces , 14, 1, 1984, 61-72.
Brealey, Richard and Stewart Myers. Principles of Corporate Finance,
New York: McGraw-Hill, 1981.
Conrad, G. R. and Plotkin, I. H. "Risk Return: U.S. Industry Pattern,'Harvard Business Review , March-April, 1968, pp. 90-99.
Cootner, P. H. and Holland, D. M. "Rate of Return and Business Risk,"The Bell Journal of Economics , Autumn 1970, pp. 211-26.
Crum, R. , Laughhunn, D. J. and Payne, J. W. "Risk Preference:Empirical Evidence and its Implications for Capital Budgeting," in
F. G. J. Derkindren and R. L. Crum (Eds.), Financing Issues in
Corporate Project Selection, Martinus Nyhoff, Boston, Mass., 1980.

-26-
d'Aveni, R. "Strategies to Trade-Off Risk, and Return in the ForestProducts Industry," Paper presented at Academy of ManagementMeetings, San Diego, 1985.
Fiegenbaura, A. and Thomas, H. "An Examination of the StructuralStability of Bowman's Risk-Return Paradox," Academy of ManagementProceedings , August 1985a, 7-10.
Fiegenbaum, A. and Thomas, H. "Dynamic and Risk Measurement Perspec-tives on Bowman's Risk-Return Paradox for Strategic Management:An Empirical Study," Strategic Management Journal , forthcoming1985b.
Fishburn, P. C. "Mean-Risk Analysis with Risk Associated with BelowTarget Returns," Amer. Econom. Review , March 1977, pp. 116-126.
Fishburn, P. C. and Kochenberger, G. A. "Two-Piece Von Neumann-Morgenstern Utility Functions," Decision Science , October, 1979,
pp. 503-518.
Fisher, I. N. and Hall, G. R. "Risk and Corporate Rates of Return,"Quarterly Journal of Economics , Feb. 1966, pp. 79-92.
Frecka, T. J. and Lee, C. F. "Generalized Financial Ratio AdjustmentProcesses and Their Implications," Journal of Accounting Research
,
Vol. 21, 1, 1983.
Friedman, M. and Savage, L. J. "The Utility Analysis of ChoicesInvolving Risk," J. Political Economy , August 1948, pp.
Grayson, C. J. "Decision Under Uncertainty: Drilling Decisions by
Oil and Gas Companies," Harvard Business School, Division of
Research, Boston, Mass., 1959.
Harrigan, K. R. "Research Methodologies for Contingency Approaches to
Business Strategy," Academy of Management Review , 1983, Vol. 8,
No. 3, 398-405.
Hertz, D. B. and Thomas, H. Risk Analysis and its Applications,
Chichester and New York: John Wiley, 1983.
Hurdle, G. J. "Leverage, Risk, Market Structure and Profitability,"Review of Economics and Statistics , Nov. 1974, 478-485.
Kahneraan, D. and Tversky, A. "Prospect Theory: An Analysis of Deci-sions Under Risk," Econometrica , March, 1979, pp. 262-291.
Laughhunn, D. J., Payne, J. W. and Crum, R. "Managerial Risk Pre-ferences for Below Target Returns," Management Science , 26, 1980,
pp. 1238-1249.

-27-
Leibenstein, H. "AllocaLive Efficiency vs. 'X-Ef f iciencv',
" AmericanEconomic Review , 56, June 1
Q 66, 392-415.
Lev, B. "Industry Averages as Targets for Financial Ratios," Journal
of Accounting Research , Autumn 1969, 290-229.
Lihby, R. and Fishburn, P. C. "Behavioral Models of risk taking in
business decisions: A survev and an evaluation," Journal of
Accounting Research , 1977, 15, 272-292.
MacMillan, I. C. and MacCaffrey, M. L. "Strategy for Low Entry BarrierMarkets," Journal of Business Strategy , 2(3) Spring 1982, pp.
115-119.
Markowitz, H. Portfolio Selection . New York: Wiley, 1959.
Marsh, T. A. and D. S. Swanson. "Risk-Return Trade-offs for StrategicManagement," Sloan Management Review , Spring 1984, pp. 35-49.
Mao, J. C. T. "Survey of Capital Budgeting: Theory and Practice," J.
of Finance , 25, 1970, pp. 349-360.
Montgomery, C. A. and Singh, H. "Diversification Strategv and System-atic Risk," SLiacegic Management Journal , 5, 1984, pp. 181-191.
Neumann, M. , Bobel, I. and Haid, A. "Profitability, Risk and MarketStructure in West German Industries," Journal of IndustrialEconomics , March 1979, pp. 227-241.
Raiffa, H. Decision Analysis . Reading, Mass.: Addison-Wesley , 1968.
Rumelt, R. P. Strategv, Structure and Economic Performance , Boston:Harvard Business School, 1974.
Siegel, S. "Level of Aspiration and Decision Making," PsychologicalReview , July 1957, 253-262.
Staw, B. M. "The Escalation of Commitment to a Course of Action,"Academy of Management Review , 1981, Vol. 6, No. 4, 577-587.
Swalm, R. 0. "Utility Theory-Insights into Risk Taking," HarvardBusiness Review , Nov. -Dec, 1966, 123-36.
Treacv, M. "Profitability Patterns and Firm Size," Working Paper,Sloan School of Management, MIT, 1980.
Tversky, A. and Kahneman, D. "The Framing of Decisions and thePsvchologv of Choice," Science , Vol. 211, 30, Jan. 1981, 453-458.
Yaari , M. E. "Convexity in the Theory of Choice Under Risk,"Quarterly Journal of Economics , May, 1965.
D/310
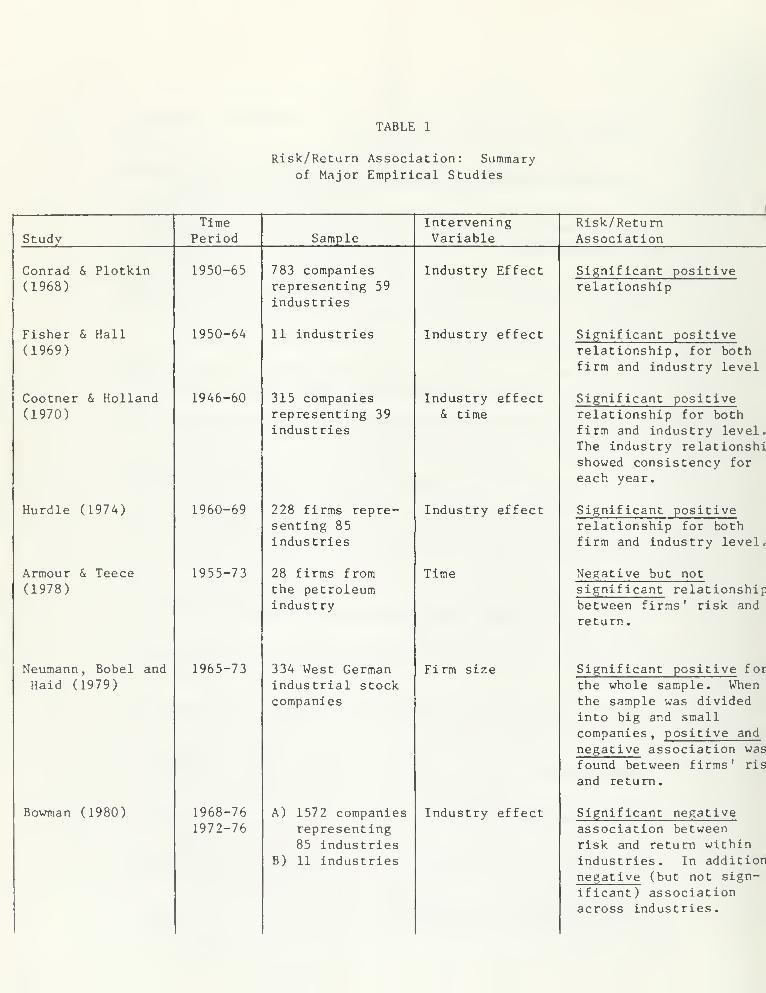
TABLE 1
Risk/Return Association: Summaryof Major Empirical Studies
Time Intervening Risk/ReturnStudy Period Sample Variable Association
Conrad & Plotkin 1950-65 783 companies Industry Effect Significant positive(1968) representing 59
industriesrelationship
Fisher & Hall 1950-64 11 industries Industry effect Significant positive(1969) relationship, for both
firm and industry level
Cootner & Holland 1946-60 315 companies Industry effect Significant positive(1970) representing 39
industries& time relationship for both
firm and industry level.The industry relationshishowed consistency for
each year.
Hurdle (1974) 1960-69 228 firms repre-senting 85industries
Industry effect Significant positiverelationship for bothfirm and industry level.
Armour & Teece 1955-73 28 firms from Time Negative but not
(1978) the petroleumindustry
significant relationshipbetween firms ' risk and
return.
Neumann , Bobel and 1965-73 334 West German Firm size Significant positive for
Haid (1979) industrial stockcompanies
the whole sample. When
the sample was dividedinto big and small
companies, positive and
negative association was
found between firms' ris
and return.
Bowman (1980) 1968-76 A) 1572 companies Industry effect Significant negative1972-76 representing
85 industriesB) 11 industries
association betweenrisk and return withinindustries. In additionnegative (but not sign-
ificant) associationacross industries.

TABLE 1 (cont'd.)
Risk/Return Association: Summaryof Major Empirical Studies
Time Intervening Risk/Return
dv Period Sample Variable Associ at ion
acy (1980) 1966-75 1458 companiesrepresenting54 industries
Firm size Significant negativeassociation betweenrisk and return withinand across industries.
nan (1982) 1979 food processing,computer, and
containerindustries
Troubled situations Significant negativeassociation betweenrisk and return withinindustries for troubledcompanies.
Lis (1981) 1973-77 80 companies Diversification Significant positivetis & Hall strategy and association between
82) industry risk and return for un-
tis & Mahaian characteristics related firms.
84) Significant negativeassociation for relatedfirms.No statistically signifi-cant association for
related linked.
sh & Swanson 1958-81 135 firms No statistical significance84) between risk and return.
eenbaun & 1960-79 ranges from 345 Time Significant positive asso-mas (1985a) to 700 com-
panies repre-senting 7
industries
ciation during the 70's.
Significant negative asso-ciation between 1965-1969.
eenbaum & 1960-79 ranges from Time and risk Significant negative for
mas (1985b) 1283 to 2394
companies repre-
senting 37 to
56 industriesrespectively
measurement accounting measures of risk
during the 70's.
Significant positive for
accounting measures of risk
during the 60's.
No statistical significance
for market risk measure.
CO
Eu ftfl 0)
tx- >0)
1- JoLb 4J
o>
c orO >-i
cm t-t co
u HCri CO
i H >*,
CC O I-"
< O 4J
H co a;
co 3< -ac
C H-l
u- 3jj Ccu -jOi aj"**•. 33-*09
coft OJ O4-1 t-l CO ftco to H Qj 4-1
ft >* ft > CO *CJ ft t-l fl t-l CJ -K * -K -K K KO co 4-> 4-1 u-. ^~N ^^ ^N ^^^ ^^ ^"N /—
^
CO C CO (0 c e*8 j*s 8*8 S^S S^S s-s 8*8
co cc 3 bC o c r-*. o C7\ CJ\ CM <r .—
i
CO -a at ft fi \C r**. 00 00 r^ ON O*o c c IJ fl
0J ft ft (0 —1> 4J x: i-i CO o> i—
1
CM ^43 -J CMfl eo U-l 4J O u CM CM <r <T CM <T <T4J U O ft oCO 3 co
bC -s= co
ai CO
z
co
u •—
CO c 4-1
O1 CO fl
ft CJ •H -KS-i ft CJ •3 •1
4-1 <4-l o -Q * * te -K -K
CO ft X g ^-N -X •—
s
/^\ y^N ^-\ y-^N
3 C 09 E e*s y^v 8*8 &>S Ss? 8*8 8*8
T3 SO CO 3 o 8*8 O o o O OC ft rH o o o o o O oft CO cu o — o*. —
H
-H —-t —i —*> CJ
y-t jr ftO 4-> 4-1 CTs 00 00 CM V43 00 <r
•H CO »-* —
H
en en -H en en% 3 Mco CUfl cco
>*.
cCO oc u fCO 4-1
co cc 4J
CO
c o> CO 0» •Ho ft CJ > o1-1 U ft ft4-1 4-1 U-l 4-1 CO enCO CO fi •r-l to1—
(
3 c CO CO ca; -o to o E t3\ o 00 CM sD 00 <ru C ft — /~-* w —H CM en en ^H en enu fl X CU flo Id > ou our 4-1
CJ
c ft 4J CO
CO ** 3 -H M6 0) CUUt *—
•
eCO
0)
ato CO
CU 0> *ft > c *Ul ft o CO * * * K4J 4-1 •H CM ^^ y^ y^ * /^V * *^™N
CO CO 4-1 8*8 8*8 e*8 .*-~\ B-S /-^ 8*8
3 bC CO c CM a* *0 8^8 <r 8*8 OO-o CU 1—1 E • • • O • O •
c c -J 3 20 CM m o <r O r*^
fl l-l 1—
1
00 00 o* ^H o> H o>.n >-i
U-l AJ C CJO ft cj o <r <r r^ <r r-~ LT*r
3 C~> en <r <r en < -3"
"*
CO
cu 1—
1
fiU-l t-i <=.
O -u Eco 3 <T —4 ^c t
—
vD r^ *o-»= 3 .—
1
en <r <r <r en <T -3"
TJC CJft
"Ooftid <r o*. <T 3> c^ o> ON0) *D >o r^ r~ VJ3 l~~ r-»c 1 1 1 1 1 1 1o lO O u-i o o OCU r> sD r^ r~^ x> r^ vDE o> ON 3^ o> o-- C3> CT<ft
H
t-l
CU
cCO cX o4-1 fl
4J
co CO
co •r^
CU o1—
1
oCO
U-l 09
o CO
fl ^N 4-1 X-*.
CU CM -^ c m —
<
> CO
CU C c CJ c gft E E fl E E
3 3 U-l 3 3CU i—
I
-H fl .—
1
i-M
CJ O c C Oc CJ CJ bit CJ CJ
X *-• ft v-x
CJ CO
ft CO COU-l CU JZ CU
fl •r^ 4-1 ftc (J •H 1-1
bO 4J 3 4-1
-J co CO
CO 3T3
CO
CU
3
CO CH
flu
c
4-1 4-1
CO U-l
OCO U-l
Oc -a -^•v
o l-i c <3 en t-i
fi O ft CU
4-1 J2 g c .aCO E U-l E E E
•r-t 3 O 3 3 3CJ C ^^ -H Co t-i O o09 ^-t 0J CJ o -Hco CO Si *—
'
CO
a u E 4-1
3 »"> oa) 4-J C CU 4-1
> >p4 U-l U-l am4 U-l
4-1 O C 4-1 OCO CO
bO 01 Ot bO o0) be bo CU bTc i—
'
CO CO c CO
V 4-1 4-1 4-1
4-J u c r- Id cr- <u OJ V o 01
CO X CJ CJ CJ
CJ i^ Id ai Id
fl T3 CJ CU > CUu_ CU a c H C-fl CO 4-1
c 3 (0 CO fl CO
be co
ft co CO CO o x-jo —
'
eo CO f\ (0
CO 1 I 1 1
01
«_l -K (0 -C CJ

co•r* to4-1 o>CO 1-1
1-1 Lcj 4->
o en
eft 3en -T/
< C
cu t£
3 CD
4J o<U Li
a: u<
r">
v̂. 4-1
tc i-i 0>
-J PES bCCC Li
< » <c
E-E
r-
M o>iH >u. o
(4 <o
14-1
cX to
ut4 3U oen ——
<
<u4-1 a:CO
c/:
oto >0) cH X> <'-">
=Sfc C TO 4-1
TO <u o CNI CNI O <r -a- CNi—
i q. i-a bo CTv c~> CN ^i CT< CNTOE L. ~3" 00 en <T V40 rn m4J O 3 TO
.—
i
—1 CNI CNI •—I CN CNO O c *->
H -iu-i tuO X>
to
0>
•H vO o r^- r-- ^^<^ C m ^o v£5 —M O ON vDO TO O -T ~^ CN oo ^H -ha i
—
ON -^ ~H —
H
-^=»= E
Ou
c4-1 o01 OJ -Hbe > 4J Ou i-i to t-i (^ CNI m ~H CN o ^^TO 4-1 "H 4-1 in <r vC sO m vD mt- TO U tC
bO O M• • • • • • •
01 m en
> Z tn
o TO
<L C
C 0) oTO "C i-l
E Li 4-1 -tc -K * * K •tt *L O TO CN LPl sO sO o o ONTO i—
'
<r LO ro CI m ~T <rty .*: o>
D. C Li
C/2 tC Li
Li OCJ
ED
01«--
u-i C u-i v£> ^C c^ r--. r^- -^
O TO o -T vC —-* o cr \CPL r~. ON .—
1
CNI 00 —
^
—
i
"* E .—
1
H ^H pHou
c4-1 o01 0) -pJ
b£ > 4-1 OLi T< (0 fJ <T o r^ o r^ inTO 4-1 i-< 4-) 00 r^ CNI tn c OC roH TO CJ TO
bC C Li —-» —-> CNI CN CN CN CN3 01 t/;
O 2 en^- TO
01
PQI- c
C 0) oTO "O i-l
E L 4-1 K * K •K K * *L C TO in CNI <T> ^ 00 m tJ»
tC —
1
<T -3- m vO <r ^o in<y ^ o> • • • • • • •
— C L 1 1 1 1 1 i 1
'-C CC LU C
u
-rc— <r c^ <r C7^ o CT> ol. sC vO r^- r-~ vC r-» r~~
01 I 1 1 1 1 1 1
pu C in O iTl Q O OvC X> r~- r* ^o r-» vO
01 cr> o*> O cr <y cr crEi—
i
H
C
cTO
X.
cbe
tn

Co •—
\
•^ to — OU —
1
CO H<TJ CO CD CD C 4-1
H >> 1-1 > CO CO * 4-1
CJ —i Id id x. >- CJ * -ic * * * -K CO
O A3 i-J U u m ^s ^^ •—
s
^^v ^"N /""N -^N <u
co c 00 H c ht Sn5 s< S^S 9«S B1^ s^s 4-1
to co 3 05 CO O g LTl o <r «o <r in roCO —
CO i-l E OO ON i~^ V40 ON r^ 00 —I
o c a. CD 4_i- CO
CD i-l •H f—< CC3 —
i
i-*
> i-J J^ i-l O ON r»» <r 1—
(
o- in oc Ei-i to 14-1 4J O CJ CJ CN ro CO e-i m ro en O4J u o i-( i-l o c•H 3 4-» co 1-1
co =s= CO CO -C
o U CO
Ou w CO
cCO
c1
CO 4.)
wi-l o
CD C 4J pqi-l CO CO * ^^ uU CJ •H •» CD
4-1 1-1 cj <r jO * •JC * * * Sn3 SICO 14-1 o ,*—
s
^n /—
V
K /»N ^-n /•» i—
i
4-1
3 "H CO c s< ^ &-! •-s S^S S^S s-s o 1-1
XI C CO E o O O 5^ o o o • CD
C bC CO 3 o O c 14-1 o o o N—
'
•H >H —i .—
1
.—1 H ON ^^ ^H ^^ cco CD o co c
_ 14-1 > CJ J= oCO o .e -h -H ON CNI r^- o r-i m 4-1 -J
E 4J 4-1 -^ CNI CN -^ CN CN CN 4-1
l-i f—
i
!»i «H -H CO CO
~d cu co 3 co CO 1-1
Du > 1-1
co
oc.
CD•—I
CJ
oId T >N
1—1 14-1
CO
CO^—
V
Cm uCD
co
cl-i CD
CD >O CO
c bC CO 4-1 JO >H i—
i
^N JJ ^No Id CO e 4-1 4J CD CN ^H c in "*
<t •-
J
CO c CD CO •H CO > CO
4-1 H o *H CJ CD M CD c c CJ e CoJ CO 1-1 i-i •H s_^ CD i—
1
e E H E E_: •rd ^ 4-1 4-1 U-l C r~ 3 3 lid 3 3CQ CJ u CO n •H C CD 1—
1
i-i •^ H ^d
< Q 4-1 ,_-
1
3 C O l-i c CJ o O c O ot-> co 09 CD -c bC -J o E ~^ on CNI 00 o r~» m C CJ a bC u CJ
co 3 l-l C •-H 4-1 3 ~^ CN CNI —
H
CN CN CN CO ^x •^ N^< T3 l-l •H CO CO CD —i CJ CO
C c 1-1 > O i-i co CO
£ H CJ ltd. SI O iH u U-l CD JO CD
Id O 4J O 4-1 tJ 1-1 4-1 -J
0) £ •H CO iH c Id id l-i
JJ > CO 3fe 3 co co bC 4-1 3 4-1
o E co Oa.
•i-i
co
CO
CO
CO
3
_*;
< CO
CD CO
T3c
CD -ac
co c •fd l-i id
i-j c/j CO4-1 4-1
a: CD CD
C CN* CO ltd
oCO ltd
oId -H o CO * * * •: c X '
—
^
4J 4-1 •l-l c ^~s ^N ^^ * S~*i ^~v o Id C <T r-) Id
CO ~r4 4_> E S-S 8^? 5v? * r-v S^5 s>s •1^ CD •i-i CD
3 CO CO 3 CN V40 rn ^\ e>s m ro 4-1 dO C c dO
"G O —i • • • 5^S o • • CO 6 u_i E E EC C- CD C in CNI —4 r^ o x> •—I •H 3 O 3 3 3iH l-i CJ oo on ON r^i ^d rv ON CJ C —I •—
'
cjr id O l-| C O
14-1 4-1 O CO ^^ CD CJ CJ 1—
'
O -rl U on X CNI LPl x> ^o CN CO co C -.• CO
3 CNI ("O <T m en ro <r CO 4-1 E 4-J
CD
>
o4-1 C
>
o4-1
co •H ltd U-i H ltd
CD p-(4J o O jU c
1-1 H fl
U-l U c co CD CD BC CD
o *-> E o bC bC 1' beCO <r —i V40 r^ v40 ri. vO C i—
i
CO CO c CO
=S= 3 —
1
CI <r <T <r m ^3" •-3- 0) u 4-1 4-1
T3 4-1 Id c c l-l ce CJ C CD CD CD CD
1-1 CO JOuid T3
CJ
Id
CD
CJ
Id
CD
CD
>
CJ
l-i
CD
T3 u-i CD a C M Co •-J CO -_l
1-1 c o CO CO H co
l-l <T as <r ON ON ON ON bC CO
CD dO vC r-~. r~^ sD r^ 1
—
•rH CO co co co
1oI 1
O1
in1 1 1o C/J -^ CO CO a CO
CD r> sC r^ r-^ vO r^ sO CO 1 1 1 1
E ON CjN O-s ON ON ON ON CD
—( 4-1 * (0 jC CJ
S-* oz

TABLE 5
Spearman Rank Order Analysis for Firms Around the
TARGET LEVEL (Middle Tertile) Within and Across Industries
Time Period 4 of industries Within industries
// of industrieswith significant
association(either positive
or negative)
Across firms
column 1 column 2 column 3
1960-64 34 1 (2.9%)3
-.03
1965-69 41 7 (17.0%) .16*
1970-74 46 4 (8.6%) -.03
1975-79 48 5 (10.4%) -.11*
1960-69 36 4 (11.1%) .06
1970-79 47 6 (12.7%) -.05
1960-79 46 6 (13.0%) .001
Notes: a - denotes the percentage of industries with significant
,column(2).association (—:
77") •
column (1)
* - denotes significantly different at less than .01% level

FIGURE 1
Risk/Return Relationships
Risk!
curve 4
line 2
curve 3
line 1
-1 1 r +TargetReturn
Return

j^-j-^-^i^Mr^O^X-IfKXMIj; co^^TCMvCm^TO oeMr-.enej*'-^ ic-,^X'^'^»-veM CM —•lPC Nl/^ (v,(NJ ^~• cn-3'r*»\0«3i eM — '—
'—
'—
•—
• 00 CM —" CM CM ^ — ^i^o—.— CM — ^OeMC^inr^ 1
^ W W — ' , 1 * W W 'CM * < W >—
'
' W ' ^-/ '' " N X W > N^ N^ ' X >^ *W ' ' W —
.
, 1 W —
.
>T vC ~3 '— C — OOc^sC^-^ineMeneMOOCO—• CJ* —• — n C v— tr >J «fi *J ^ C -*^v^C\CXNwQC^C>0^
CM n
3 cm cm \D r*. in o O C oO fn O-'XO (n oO^-JC nC en o r*. in r*. en oo ^ C O c^OOOOO^o^COf^ r^XinocMO^O-Te^x —• — en -3 cm X —• *3, o*>oe'^insO<rocMenooeMeninin\OOen s0inOin
— ^ (" JINN —• CM CM PI CM —
•
—' CM CM CM CM —I n CM N PI N -4 -h (M - {N CO sj CSJ - CM — —
»
m —
.
—
/^v »*. ^K -"> /". ^TT^-^ ^v /», ^K ^K -^ ^- :•«; ^TC ^ cn c/» i— ** -• co -^ *o rv vO /—\ /~\ *-\ n r* n n ^ so ^ 0000 rs ^ n -
,cjn —
.__
,_"COn-nJO^ON^-* cm —« —« r** cm *•-"* /—* ——' —-^_- —' —' —• >_" ^ w w w s_/ CM CM 00 —> v_< w w -—/ w ^ —. —' 0"v in w*Di^OOOOOCNn\ONl— O^ '*-' >*-' s—' r^^T^r^iocroQ >^ ^ in^^^sqooDNO--ir^o^OOOOinineji^J'Xr-^ice^^j-oCc'M
w w w —• a^ w •£>
o %o — >—' -^ OC -^
vO nO ~T C OC -J o
^Cr^sO —' -3" *3 en o '"^ O** -^
*** CM CM —' ^^ NN^MNa»-«C1in vO w O O Ott O C ^ N in n̂ \D 00 »fl -J O'
vO cm <r in vO
N CH BS — CM
sC M x >c f^ iP ff* O O en x O in o OOvOO X \0 en n c ^ >o r ovC0X0CX>£>c^X0OC-3'X~3inocn_« mxOC^o-TX^COincnycooe'^cccXinr-.c^OcnxOOin-sT CM —'MX-• en CM ~3 CM sO —'—• —«—'NincS^JCNlTlM^JN »TNcn>rM-HN-<N'}-'^J-JfN —
O ^CM —
7^-^TT=7^^<J-XOeneMvO©^sO-NrnninrNO^ ^i Ml O O m en cm —
.
— — ^C -3- —I —OininsOoenxcMX ^^ r^f^oi^inino^J"inr-^inmr^f-^cn-jeMOenininxf-.cMvO—• O -J
n <r -3 O o iP -J n c in O r~- en en <j oCr— — —
•-3- xr-^vOC^^Or^mOOOmoOOOCCen — cmcC in O cX e" ~3
—• CM CM vO CM CM CM en — — CM -3 X O U"1 —'—
'—'—'C*^
?*; ^ ^; ^*. —
.
7=r^=r"^ ^-^=c-^rT*rT*rT=r^=c-7*; ;=rT=r"7=r"^«rT=r"^r"?=; ;=T7»^"«r-7=; ,—, ,-^—
sC n ^ ^ ov inp^.^s — ~3-3en—.*-sG-3"incMCMenor*. —• cn»3"sor^\0>3>-N'"-*o<rr-~<r''-^-3*C'—^X'—*^*^^-/^(^NO,*«T'^NNin/^NNinNNC^N(*l^XN'JN-'^-'-'-'XN'-NC*^N^'-N-H^I^NCAvOOp> w r-• w x X —' r~ c *— —'OOninoOOXinxocMenx*—'CMOOenineninN— en o C r*» O — in o en r^ c: O '
—
rrt irr( ctsJ^c<xcc^cN(Ncnc^a3irocinisooiso>ccCN^C<r^^'cnNCcnin^in»j(NN\Dcfl MX^J>
—« CM —. <T CM —
N c O* O en o en moencCvOCMeno oOc^OCTn\OCM o --O cnoO^O'OwOinocnoOOcMOCMOc^sOcn^-t^-r^—tr^COXCMcninr^O^OCOino^OincMOOcnxinoO—' —-cmcm—•-3'cncncMCMcn—.cmcm—» CMCMCMCMCM—iCMCM —•—•CM m -^ ! ^ N --CM — CM—«-3-*£>—'-J'—"CM-T
sC — «-n '-> X—
•
^v r» N O *J— >n w — — —
*
r^ ^/ r~ ~~s — ~r- C ~T O X O
-^^^^-vy—»cncMcnc^X<TCMONXCMXr-^ —• co »j csi ^d in 'T /^ ccMr^mON>-^vOCMCM-^in—• N tTl N N 0> -'{*l*JNvO^TN--n-Hp4-HC0N-• N C ^^—•CMvO-^^-CM—•
>»^ v^ v^ »—» CM >-> -—' —'W —/>^-^^>»^-w'V^»-'^'X>—'^ —''—'>—-CMXv---.^^^>^^^ — »_/- -^ in sfl — e^mv£>0X00inr^xinin>3'^— cm O in >j- \C O —• '
—
—'inr^cnin — s_^-3-r^^Jp^>OOinr^r^incMinr^r*^Xr^i— ininocMOp^r^.—'^cr^OOCMinox—'C--
O C 00 ^D in< <r N »o M
-J — CM
X CMzc c & c: c:
in o^o sO oxocno^OCMOO r~i r~i ~ c> r-^ o>-^cncnc; ^ O OOXCCO-J — O vCC » -•cncnrnxcM^-xocncnm-a-ocMOOOOcnmcn^cc^OOOin-I en cm X — cm — —• en N N N N N -I --CMCM cen—•—'-^eM — vren-j- — —i—icm—-en — ^o
OCJ^ ineMr^xOXin-- /—\ ^n cm cm o^ o en cj* r^ ^*^ in r^. ~*cm -- y—\ —*enen\0^0eneM-*mej\-- —^r*»cs—<—h^^ ^v so —• in —
•
— CMw vO ^^ ^in C -3 sC
vO sC CM O ^D CMiC ^3" r^ in \D r^
en o O —C " vfl vO -I
^ in r*^ r^. \0\0 en ^3 in \0
OOO OOi~~ cm <r vOCM —'O O OCM^oencMCMOO >0Xininoi^i^inor^o—' O *t ^J O "-^oOOinOvOeji^cenp^-j-in-a-OcTiOen—-CM—.—.CM—• — CMCM—>CM —
— —• in -rX cm o*i o> in r^ o O en so— — —.—.<r—•—«^d—«eMCMin<r
•^ -w^ -~s Xcm o sD <T en en w^3 so r^ o en en
-^ ~^ N_- 0> >^ S-^
cm cm in —^j inCmeMinxo-"X<!
3 ^ CMen^- inOvOXXen oinen — oxin^ocMXOO en o O r~ O i-. o
— en —4 cm cm in — cm —• e^j cm en —
• cm —• —
«
- -— Cy; as
UO e^j pn n
U «l —
iq -D— C0) i-
« «« « « « * * «« * « * * « « • « « « « • « « « * * * « • « « 41
1 M P ^ an «* -i- -* ^ c r-t rsi r*N f" ^ cc » rsi a T r , cc
i
in ^ — 9 T rsi r , — M^ r 'r ^r- ri i~i cr " m -J r - sf. * r«* — 00 — — — cc —
'
CM -i CC " CM MO — — — — -f ^j o *n —9 C e *T ,
,
C C ^. c- ,-J-) II- T _ r-s r _ r j u" a r T i c IT „ n Cr r-> r , in iy
- X ,s. X x- X p* 9 in „ __ C —nO .-> rs n ir r> rsi u- sT sC >> <T f-N s/-s -T Id r>j cr r I m CI <—• 7 CM r* MP CC
<-»
t 1 1 t 1
-
T 41—~* * * « «
«* *
«*
41
* **« * • sC
« « « • * « « « * « « « « « « * * * « « « * * * * 4t * * 4t * * •< c- a l/s cc o> •^ i£ a n T « 00 IT. r-i a u- c rr J" c MT MP CM *r J" MP CI cr G r CC cc1 n a u~i C. MD sC J-- CO 9 sC CT CC r^a
1 1 1 1 1 1 1 1 1 1 1 i i 1 i 1 1 1 ' ' 1 i 1 1 1 t 1 1 1 1 1 1 1 ' 1 1 1 1 1 1 1 1 1 1 1
« « 41
* * « « * • « * « « *« * « * * « * * * « « * « * « * « « * • * * * « « 41
nc *s, vl n —
,
9* * «"» sC ifl ^ _ j *» ,— r J-* 9 •* *sT c „ n ON r*. 0^ „ n -s» ^r> 9> M- 4f c m, c r> is ,-s f~A MT MT ^ EC ^ '-> ci — in cr •—* rvi rsi in rg r>j *n «N r»i 1—
1
CM rj or CM CM r-» rj »n —>
9 c 7 ( 1 te -C a v CO r-i c rsi (.: f i c ) cr r- n c r-\ i-j CT sf -f a or m o 9 -7 -7 9 a c <-*
-r. in ci -a* C m * <7 o w- •T m r-i r*» u-i -s» •» r»i ri M| r-j CM m9 c i— rM m n •* MJ in c o CI ( CM cr arr «t" — 1 1 1 1 1 l 1 1 1
c<T- * *
.' « * « * * * • * «C * * * « « * « * * « * * * * « « * « « * * * « * * « * « * « * * * « * * 41
a cr m 9> O r-J a r^. C7~ 9* <T ao Nflf c; an sC <7 -X CT >J- MO rg a" <t in e i sT 9- MO CM <r 9- ^» ria or -9 ir •4 rsi cc or fsl -.7 r-j r-i l^S in MP >C <.r\ -» <? in cn m CMCQ
t 1 1 1 1 1 1 ( i 1 1 1 1 1 1 1 1 i 1 1 i I ' 1 1 1 1 1 1 1 1 I 1 1 1 1 1 1 1 l 1 1 1 1
* « * * « ** « * « * * « * * * * * *
« « * * * « * * * * « « « * * * « «*
1 ««» sC l^S CT G <r ^ -cr or o f»1 CM sT a Mf -» c sT. m o. CM MT> sT vT •* <N NO rj ri m ws n CM 9- m V, (Ti in 00
cr x> o- o -7 B <Ts -i cc 1 m rsj l^N cr. as G p G r^ or o f-N C OC < r-j \C in <? w> s» Hi -»» ./-> -c» r"i m m CM m vrs MT in CM O 4 m CM9—
OCc *""
c** * *
** « * * ^ « * *
* *<
**
M0e «
* fJ ci o ** sO -sT CC -r sT NO 9 r—
«
«» t G <r r-j O r-> o CT' rM. sT in 9 e cr r o
1
md
1 1
•sT rsj
1
c1 1
o1 1
in
I 1
B0
1
o1
sC
1 l 1
NO
1
W-4
1 1 1
sC
1 1 i 1 1 1 1
o1 1
r-j c CM
1 1
C1 1
* * * ** < * * * *
« * « « * « « * « * * * « * 41 * < *
4J mp -— m CM y-X 9> ^-v *n r^ sC ^, — « <4 m „ ,M, c -7 »n G rsi n 9 r*. ^x _ m •CT •C rv •O ~7 c~ y*S r Mf fx '7 CM MT >C ^s or ^. *"» cb— sO O^ MP —
9> c 7 x- »J tO -T O — rM c G m -» ^f fS| n o _- p« n p., _ OS rsi „ T G tfl c 7 fM Ml r-> rj in n in M» aa sT O- ^r• r* T or eg aca MO G MT —
91
1 1 1 1 1 1 1 1 1 1 1 i
9> * * *3 * « * * « * * «
* « * « « * * NO « * « « « « « * * 4t I « « * * * « « 41-^ MP tn CC c «-- -f O <t c c c a Ml u-» ITI <f *-, <V C f-> MO MP T as MT CC CI CJ
cr1 1
W1 mo
1 1
sC cc
1 1
cc
1
sO
I
>» c1 1 1 i 1 1
If)
1
s£*
I
nC
1 1
MT
1 '
c1
rM
1 1 1
MD
1 1
»T»
1
0L
I
MO
1
MT
1
MP
1
c1
MP
1
at
1
ci
1 ' |
MT CC
i 1
* 4t
4 * * * 41 * * * * < * * ** « * * « * * * * « * « « * * « « « * 4C * «
01 -c --s — CM ^ 00 •sj sC •^ ^ — t* <-. r^ o ^ cc -J N 9 cr rg cc ps, «-, — rn MT - J MO MO •* o 0* C CM ps p^ 9> rsi MO ^s or — a c~ ™ 9 <T fSJ N — L/' n r ' u-> rsi rsi ON — m •sff r% NO •3> rsi — CO — — — CO CM "* CM ^-1 CC — CJ * — -" — — '*• CM ec «n —<f as c. 03 c sr m m ^t DC a ae in n m a _ fM G r-N <j~\ n -j «- -* r _ c <r — in in •7 -7 r^ r^. C •£ in rr n rr O IS in C oc
CC
(
o
o CO
1
•** ST i—i
i
^ r-s ^ 1
1
NO •st r-i ri *J x> O N Csl CM O MO G c C sC MP
9 * ^ * * «y * * * * * * • * * * * * « « «o « * « * * « * * * * * * « * * * * « * « * * * * « * * « * « « 4t * • •t « 41
a* c r or C CO o rr 00 or 9- ' NO r^ C -T U-N -sT rM <J- C CM o rs. 9> ot CT cr
cc_ cc
1
M?
I
in
1
91
•Mr
i I 1
OL a.
1 i 1
CM
1 i
NO
1
r«.
1 1
nO
1 1
X-
1
NO
1
u-^ 0C 4)
1 1
CM
1 1
x1
CM
1 1
a
1
MO
1 1 1 1 1
in
1 1
MT
1 1 1
rs- CC
1 1
* * * «« « * « * * * * * * * • *
* * * * « « « * * • * * « * * * « * « *at * « «> mo rsi m 9 T 91 CO G t»» sT fM <T c~ or \T\ CM 9» O 9- G— rsl MO f"- •* r^ " nO NO ^ CI — m On — — r*" r-j — — — MD rs — m — * MP rsi 9
9 -* -c IT •7 _ r r-i C _ O -T r*s IN 9 ^ _. 9 r^ 00-- u^ ITl •7 c c 9 ao •* c m IT in. _ r-j r*s O or c MT MP
x u"
9—1 i 1
n
T * 41 «—» *
**
**
** *
«* ^ * « « * «
**
**
** «
**
**
*«
41
«c 9- IM sO 9 ./- c f-> sf> r j G -T 00 *T X CC MT <r rM c <f CM £ CM G 9- CJ m
re 1 1
ai 1
O »»
1
9' 1
<r
1
c1 1
iT «" r-s
1 1
CM
1 1
in */*> MD
'
r
l
-
1
in
1
CM
1
el
U-s
1 1 1 1 1 1
M0
« * «* • « « «
« « * * * * * « « ** 4i
OJ a 9 \n rM c or ri X r %r. CI iT- c» CM> nt*. *r> NO rsi r-j tr\ SO CO 9 r~-l a
-» X. cm c cr O -t • t r » OJ T S r< i, <~i C 1 CM -* MT B3 X w" -1 1
—
or in
9 < r-j mt «» ~~ r-i sO n c -» «» — •3 m — NO m r-i r-i •^ ~" ™* w ^* CM "* c-» o ^* ™" M0 C sC
-
9 « *—* J
*«
«* « * « « * «
* «*
««
41
* « J *«
r- cr J" vO u^ C s^> rsi *-j x- m ' MO a- T in 9 in
1 i . 1
kC
1 . 1 1 1 I
sO
1 1 1 1
r»*
1 1 1
a a MP
1 1
c O• 1
MP CI m*n
1
J nC
1
aj r— c ^ rM r md a — rsi \T\ T 9 O V? ITN NO *. or 9 s M ^ X 0* ". Mt £ ot n~ s n 3 D ^ cr*
S) k. CM c c cc-
u
> > >1 t V
c c cft tc «:
-c -c x
c c c —IT * ^<_l U U i_


HECKMANBINDERY INC
JUN95