Embed Size (px)
Citation preview

C S A S
Canadian Science Advisory Secretariat
S C C S
Secrétariat canadien de consultation scientifique
This series documents the scientific basis for the evaluation of aquatic resources and ecosystems in Canada. As such, it addresses the issues of the day in the time frames required and the documents it contains are not intended as definitive statements on the subjects addressed but rather as progress reports on ongoing investigations.
La présente série documente les fondements scientifiques des évaluations des ressources et des écosystèmes aquatiques du Canada. Elle traite des problèmes courants selon les échéanciers dictés. Les documents qu‟elle contient ne doivent pas être considérés comme des énoncés définitifs sur les sujets traités, mais plutôt comme des rapports d‟étape sur les études en cours.
Research documents are produced in the official language in which they are provided to the Secretariat.
This document is available on the Internet at
Les documents de recherche sont publiés dans la langue officielle utilisée dans le manuscrit envoyé au Secrétariat.
Ce document est disponible sur l‟Internet à www.dfo-mpo.gc.ca/csas-sccs/
ISSN 1499-3848 (Printed / Imprimé) ISSN 1919-5044 (Online / En ligne)
© Her Majesty the Queen in Right of Canada, 2013 © Sa Majesté la Reine du Chef du Canada, 2013
Research Document 2012/174 Document de recherche 2012/174
National Capital Region Région de la capitale nationale
Risk Assessment for Three Dreissenid
Mussels (Dreissena polymorpha,
Dreissena rostriformis bugensis, and
Mytilopsis leucophaeata) in Canadian
Freshwater Ecosystems
Évaluation des risques posés par trois
espèces de moules dreissénidées
(Dreissena polymorpha, Dreissena
rostriformis bugensis et Mytilopsis
leucophaeata) dans les écosystèmes
d'eau douce au Canada
Thomas W. Therriault1, Andrea M. Weise
2, Scott N. Higgins
3, Yinuo Guo
1*, and Johannie Duhaime
4
Fisheries & Oceans Canada
1Pacific Biological Station
3190 Hammond Bay Road, Nanaimo, BC V9T 6N7
2Institut Maurice-Lamontagne
850 route de la Mer, Mont-Joli, QC G5H 3Z48
3Freshwater Institute
501 University Drive, Winnipeg, MB R3T 2N6
4Great Lakes Laboratory for Fisheries and Aquatic Sciences
867 Lakeshore Road, PO Box 5050, Burlington, Ontario L7R 4A6
* YMCA Youth Intern
ii
TABLE OF CONTENTS
ABSTRACT ............................................................................................................................................................. IV
RÉSUMÉ ................................................................................................................................................................. V
INTRODUCTION ..................................................................................................................................................... 1
RISK ASSESSMENT ..................................................................................................................................................... 1
Rationale .............................................................................................................................................................. 1
Scope and Scale .................................................................................................................................................... 1
BIOLOGY .................................................................................................................................................................... 2
Taxonomy ............................................................................................................................................................. 2
Species Descriptions ............................................................................................................................................. 4
Habitat Preferences.............................................................................................................................................. 5
Life History ........................................................................................................................................................... 7
Population (Genetic) Structure ........................................................................................................................... 10
Ecological Impacts.............................................................................................................................................. 10
Potential Interactions with Species At Risk ........................................................................................................ 12
VECTORS ................................................................................................................................................................. 13
Primary Invasion................................................................................................................................................. 13
Secondary Invasion/Dispersal (Spread) .............................................................................................................. 13
DISTRIBUTION ......................................................................................................................................................... 14
Native Ranges .................................................................................................................................................... 14
Introduced Ranges ............................................................................................................................................. 14
METHODS AND MATERIALS ................................................................................................................................. 15
RISK ASSESSMENT METHODOLOGY ........................................................................................................................ 15
Determining the Probability of Survival (Habitat Suitability) ............................................................................. 15
Determining the Probability of Arrival ............................................................................................................... 16
Determining the Probability of Invasion ............................................................................................................ 17
Defining Impacts and Uncertainty ..................................................................................................................... 17
RISK ASSESSMENT FOR ZEBRA MUSSEL (DREISSENA POLYMORPHA) .................................................................... 17
STEP 1: DETERMINING THE PROBABILITY OF INVASION .......................................................................................... 17
Probability of Survival (Habitat Suitability) ........................................................................................................ 17
Probability of Arrival .......................................................................................................................................... 18
Probability of Invasion ........................................................................................................................................ 19
STEP 2: DETERMINING THE IMPACTS OF INVASION ................................................................................................ 19

iii
STEP 3: RISK TO ENVIRONMENT: COMBINING THE PROBABILITY OF INVASION WITH THE IMPACTS OF INVASION 20
RISK ASSESSMENT FOR QUAGGA MUSSEL (DREISSENA ROSTRIFORMIS BUGENSIS) ............................................. 21
STEP 1: DETERMINING PROBABILITY OF INVASION ................................................................................................. 21
Probability of Survival (Habitat Suitability) ........................................................................................................ 21
Probability of Arrival .......................................................................................................................................... 21
Probability of Invasion ........................................................................................................................................ 22
STEP 2: DETERMINING THE IMPACTS OF INVASION ................................................................................................ 22
STEP 3: RISK TO ENVIRONMENT: COMBINING THE PROBABILITY OF INVASION WITH THE IMPACTS OF INVASION 23
RISK ASSESSMENT FOR DARK FALSEMUSSEL (MYTILOPSIS LEUCOPHEATA) ......................................................... 23
STEP 1: DETERMINING THE PROBABILITY OF INVASION .......................................................................................... 23
STEP 2: DETERMINING THE IMPACTS OF INVASION ................................................................................................ 23
STEP 3: RISK TO ENVIRONMENT: COMBINING THE PROBABILITY OF INVASION WITH THE IMPACTS OF INVASION 23
SUMMARY ........................................................................................................................................................... 23
CONCLUSIONS ...................................................................................................................................................... 26
ACKNOWLEDGEMENTS ........................................................................................................................................ 27
REFERENCES ......................................................................................................................................................... 27
TABLES ................................................................................................................................................................. 36
FIGURES ............................................................................................................................................................... 62
APPENDICES ......................................................................................................................................................... 84

iv
Correct citation for this publication:
Therriault, T.W., Weise, A.M., Higgins S.N., Guo, S. and Duhaime, J. 2013. Risk Assessment
for Three Dreissenid Mussels (Dreissena polymorpha, Dreissena rostriformis bugensis, and Mytilopsis leucophaeata) in Canadian Freshwater Ecosystems. DFO Can. Sci. Advis. Sec. Res. Doc. 2012/174 v + 88 p.
ABSTRACT
An ecological risk assessment for three dreissenid mussel species: the Zebra Mussel (Dreissena polymorpha); the Quagga Mussel (D. rostriformis bugensis); and the Dark Falsemussel (Mytilopsis leucopheata) was conducted for freshwater ecosystems in the western Canadian provinces, Ontario, and Quebec. This risk assessment considered probabilities of survival (habitat suitability) and arrival to 108 Canadian sub-drainages and the ecological impacts associated with these species. The ecological risk associated with both Zebra Mussel and Quagga Mussel invasions across the western provinces and watersheds directly adjacent to the Laurentian Great Lakes and St. Lawrence River was considered high. In contrast, the risk was considered low for most of eastern Ontario and Quebec where calcium concentrations were deemed too low to support large (invasive) populations. Due to the high salinity requirements of Dark Falsemussel, the ecological risk associated with this species was considered low for all Canadian freshwater ecosystems. However, the scope of this risk assessment did not consider coastal estuarine habitats where the ecological risk could be substantially higher. The largest ecological impacts associated with Zebra Mussel and Quagga Mussel were negative impacts on biota that inhabit the pelagic (offshore) zones of lakes or rivers (e.g., losses in productivity for phytoplankton, zooplankton, and planktivorous fishes), and to unionid mussels (severe declines in abundance and biodiversity).

v
RÉSUMÉ
Une évaluation des risques écologiques posés par trois espèces de moules dreissénidées : la moule zébrée (Dreissena polymorpha), la moule quagga (D. rostriformis bugensis) et la moule d'Amérique (Mytilopsis leucopheata) a été menée pour les écosystèmes d'eau douce des provinces de l'Ouest canadien, de l'Ontario et du Québec. La présente évaluation des risques s'est penchée sur les probabilités de survie (habitats propices) et d'arrivée de ces espèces dans 108 sous-bassins versants canadiens ainsi que leurs impacts écologiques. D‟après l‟évaluation, les risques écologiques liés aux invasions de la moule zébrée et de la moule quagga dans les provinces et les bassins-versants de l'Ouest situés directement à côté des Grands Lacs laurentiens et du fleuve Saint-Laurent seraient élevés. En revanche, on a jugé que le risque était faible pour la majeure partie de l'Ontario et du Québec, où les concentrations de calcium ont été considérées comme trop faibles pour soutenir de grandes populations (envahissantes). En raison des exigences élevées de la moule d'Amérique en matière de salinité, on considère que le risque écologique lié à cette espèce est faible pour l'ensemble des écosystèmes d'eau douce au Canada. Toutefois, les habitats côtiers estuariennes, où le risque écologique pourrait être beaucoup plus élevé, ne faisaient pas l‟objet de la présente évaluation. Les impacts écologiques les plus importants de la moule zébrée et de la moule quagga sont les effets négatifs sur le biote vivant dans les zones pélagiques (extracôtières) des lacs et des rivières (p. ex., pertes de productivité du phytoplancton, du zooplancton et des poissons planctonophages) et sur les unionidés (déclins considérables de l'abondance et de la biodiversité).

1
INTRODUCTION
RISK ASSESSMENT
Rationale
Non-indigenous species (NIS) pose an enormous risk to native biodiversity and ecosystem function, especially biodiversity (e.g., Sala et al., 2000, Dextrase and Mandrak, 2006). The invasion cycle of arrival, survival, establishment, and spread of NIS will continue in Canada as it has elsewhere around the world. For example, the number of known introduced species continues to increase in the Great Lakes (e.g., Ricciardi et al., 2006) and along the coasts (e.g., Levings et al., 2002). However, not all NIS are equivalent in terms of their ecological impacts and it is expected that a handful of these species have had disproportionally high ecological and socio-economic impacts associated with their invasions. Having the ability to identify these highest risk invaders (ideally prior to arrival) and focus limited resources on these species is critical for resource managers.
The Canadian Council of Fisheries and Aquaculture Ministers Aquatic Invasive Species Task Group (2004) defined invasive alien species as “those harmful alien species whose introduction or spread threatens the environment, the economy or society, including human health”. To guide management actions, a risk assessment can be used to identify higher risk invaders, the important vectors for introduction and/or spread, and the potential impacts if introduced. Due to their proximity to freshwater ecosystems in western Canada, and their well described ecological and economic impacts on invaded ecosystems (e.g., Higgins et al., 2008), the western provinces of Canada (British Columbia, Alberta, Saskatchewan, and Manitoba) requested that Fisheries and Oceans Canada (DFO) conduct a formal risk assessment for Dreissena polymorpha (Zebra Mussel) and D. rostriformis bugensis (Quagga Mussel). Due to subsequent interest, the geographic scope was expanded to include freshwater ecosystems of Ontario and Quebec. During 2009, a closely related species known as the Dark Falsemussel (Mytilopsis leucopheata) was identified on a boat being trailered across western Canada, raising concerns that this species also could pose a risk to Canadian freshwater ecosystems, and so the risk of this species to Canadian freshwater systems also was evaluated.
This document summarizes the results of a risk assessment conducted to evaluate the ecological risk posed by these three non-indigenous dreissenid mussels to Canadian freshwaters and contains information for 108 Canadian sub-drainage basins within the Arctic Ocean, Atlantic Ocean, Gulf of Mexico, Hudson Bay, and Pacific Ocean freshwater drainages (Figure 1). The risk assessment is based upon the most current information available on the distribution, habitat suitability, and ecological impacts for the three dreissenid species evaluated.
Scope and Scale
There is little doubt that NIS have resulted in a wide variety of social and/or economic impacts and, in some cases, socio-economic risk assessments have been conducted (see Binimelis et al., 2007). The risk assessment presented here for the three dreissenid mussels focuses on the potential ecological risks posed by these invaders, and is consistent with the Canadian Science Advisory Secretariat (CSAS) guidelines for provision of scientific advice to clients (managers). In accordance with the CSAS guidelines socio-economic aspects are not considered in this risk assessment.
Predicting the geographic scale and extent of invasions is complex and includes considerable uncertainties. Given sufficient time (and propagule pressure) the likelihood of an invasion to an

2
point in the future is not useful for managers making decisions on much shorter timeframes. Thus, the temporal scale of this risk assessment is based on the potential arrival of the three dreissenid mussels to a specific sub-drainage basin (see below) within the next five to ten years. The geographic scope of the risk assessment was originally restricted to freshwater ecosystems in the western provinces of Canada (British Columbia, Alberta, Saskatchewan, and Manitoba) but later expanded to freshwaters of Ontario and Quebec based on subsequent interest from these provinces and their willingness to contribute necessary water quality data. Based on the original criteria, the risk assessment considers only freshwater ecosystems and does not consider coastal marine or estuarine habitats. Within this geographic scope, the risk assessment was conducted at the sub-drainage basin (i.e., secondary watershed) level as defined by the Water Survey of Canada (Atlas of Canada 1,000,000 National Frameworks Data, Hydrology – Drainage areas, version 6, as this allowed characterization of risk for a meaningful but manageable number of spatial units. In total, based on the availability of environmental data, the risk assessment evaluates the ecological risk to 108 of the 184 sub-drainage basins (identified by their 3-digit identifier) within the six provinces (Figure 1). Within each sub-drainage habitat suitability (based on calcium concentrations for Zebra Mussel and Quagga Mussel) can vary between individual freshwater ecosystems. While calcium values (75th percentile) were used to assess the habitat suitability for each sub-drainage, the proportion of sub-sub-drainages within each sub-drainage that fell within each habitat suitability category (very low, moderate, high, very high) was recorded as additional information for managers (Appendices A1 and A2).
BIOLOGY
Taxonomy
The taxonomic classification of the three dreissenid species considered in this risk assessment is provided below. Information is based on the following literature: Marelli and Gray (1983); Rosenberg and Ludyanskiy (1994); Therriault et al., (2004); Rosenberg and Huber (2011a); and Rosenberg and Huber (2011b).
Phylum Mollusca
Class Bivalvia
Subclass Heterodonta
Order Veneroida
Superfamily Dreissenoidea
Family Dreissenidae
Subfamily Dreisseninae
o Genus Congeria
o Genus Dreissena
Dreissena polymorpha (Pallas, 1771) (valid)
Synonyms
Mytilus polymorpha (Pallas, 1771)
Dreissena andrusovi (Andrusov, 1897)

3
Dreissena aralensis (Andrusov, 1897)
Dreissena arnouldi (Locard, 1893)
Dreissena bedoti (Locard, 1893)
Dreissena belgrandi (Locard, 1893)
Dreissena complanata (Locard, 1893)
Dreissena curta (Locard, 1893)
Dreissena eximia (Locard, 1893)
Dreissena küsteri (Dunker, 1855)
Dreissena locardi (Locard, 1893)
Dreissena lutetiana (Locard, 1893)
Dreissena magnifica (Locard, 1893)
Dreissena obtusecarinata (Andrusov, 1897)
Dreissena occidentalis (Locard, 1893)
Dreissena paradoxa (Locard, 1893)
Dreissena polymorpha var. lacustrina (Boettger, 1913)
Dreissena recta (Locard, 1893)
Dreissena servaini (Locard, 1893)
Dreissena sulcata (Locard, 1893)
Dreissena tumida (Locard, 1893)
Dreissena ventrosa (Locard, 1893)
Dreissena westerlundi (Locard, 1893)
Mytilus arca (Kickx, 1834)
Mytilus chemnitzii (Férussac, 1835)
Mytilus fluvis (Gray, 1825)
Mytilus hagenii (Baer, 1826)
Mytilus polymorphus fluviatilis (Pallas, 1771)
Mytilus volgensis (Gray, 1825)
Pinna fluviatilis (Sander, 1780)
Tichogonia chemnitzii (Rossmässler, 1835)
Subspecies:
Dreissena polymorpha polymorpha (Pallas, 1771)
Dreissena polymorpha gallandi (Locard, 1893)
Dreissena polymorpha anatolica (Locard, 1893)

4
Dreissena rostriformis bugensis (Andrusov, 1897) (valid)
Synonyms:
Dreissena bugensis (Andrusov, 1897)
Dreissena brardi (Eichwald, 1885)
Dreissena grimmi (Andrusov, 1897)
Dreissema distincta (Andrusov, 1897)
Dreissena rostriformis compressa (Logvinenko & Starobogatov, 1966)
Dreissena tschaudae var. pontocaspica (Andrusov, 1897)
Mytilus rostriformis (Deshayes, 1838)
o Genus Mytilopsis
Mytilopsis leucophaeata (Conrad, 1831) (valid)
Synonyms:
Congeria leucophaeta (Conrad, 1831)
Mytilus leucophaeatus (Conrad, 1831)
Mytilus cochleatus (Kickx, in Nyst 1835)
Dreissena cochleatus (Kickx, 1835)
Congeria cochleatus (Kickx, 1835)
Mytilina cochleata (Cantraine, 1837)
Dreissena cochleata (Nyst, 1843)
Tichogonia cochleata (Dunker, 1853)
Dreissena cumingiana (Dunker, 1855)
Mytilus americanus (Recluz, 1858)
Mytilus tenebrosus (Reeve, 1858)
Dreissena americana (Fischer, 1858)
Tichogonia americana (Kuster, 1889)
Congeria cochleata (Dall, 1898)
It is important to note that there are other Dreissena species in addition to those considered here. For example both Dreissena presbensis and Dreissena blanci have been confused with Dreissena polymorpha, especially in the Balkan region where these two species are endemic.
Species Descriptions
The Zebra Mussel, D. polymorpha, is a mytiliform bivalve about 25-35 mm in size and black with or without white banding (Figures 2 and 3; Ludyanskiy et al., 1993; Effler and Siegfried, 1994; Patterson et al., 2005). As shell patterns are highly variable for this species they should not be used as the definitive feature for identification (Pathy and Mackie, 1993). Viewed from the inside, the shell has a white lining and a large septum (a shelf-like growth close to the beak of the dressenid) to which the

5
anterior adductor and retractor muscles are attached (Verween et al., 2010). D. polymorpha have both inhalant and exhalant siphons that are used for feeding (Benson et al., 2012a). The umbo (or beak) of Zebra Mussel is pointed, the dorsal margins are rounded, contrasting with relatively flattened ventral margins (Pathy and Mackie, 1993; Dermott and Munawar, 1993; Claxton et al., 1998). The flat ventral side distinguishes the Zebra Mussel from other dreissenids.
Although morphologically similar, the Quagga Mussel (Dreissena rostriformis bugensis) differs most obviously from D. polymorpha in being larger, rounder, and wider (Figures 2 and 3; Lei and Miller, 1994 in Pelder, 1994). Further, this species has a convex, rather than flat, ventral surface that causes the Quagga Mussel to topple over if placed on this side. Viewed from the anterior, the Quagga Mussel displays asymmetry in valve shape and can be distinguished by the byssal groove that is located more ventrally and posteriorly than observed in Zebra Mussel. The color (black, cream or white) and band patterns of specimens are highly variable, with some having no bands at all (Marsden et al., 1996). Where bands are visible, they are concentric and tend to fade in color towards the hinge, which is characteristic of Quagga Mussel (Benson et al., 2012b). Additional morphological variability appears to arise due to two morphotypes of Quagga Mussel which are environmentally rather than genetically determined and apparently related to their life in either shallow or deep-water habitats (Peyer et al., 2010). The deep-water morphotypes appear to have “more flattened and dorsal-ventrally compressed” and “more ovular” profile, as well as a more pointed ventral surface (Dermott and Munawar, 1993; Roe and MacIsaac, 1997; Claxton et al., 1998; Peyer et al., 2010).
The Dark Falsemussel or Conrad‟s Falsemussel, Mytilopsis leucophaeata, has a mytiliform shell with byssal threads typical of dreissenids (Figure 4). According to Verween et al. (2010) the shells of the Dark Falsemussel display stripe or “zigzag” patterns as juveniles, much like the Zebra Mussel. Thus, it is extremely difficult (and potentially unreliable) to distinguish the two species at this stage based on shell color/pattern. As adults, the shell of the Dark Falsemussel is marked with concentric rings that may range from cream-like to dark brown making it easier to distinguish from the Zebra Mussel. As juveniles, the shell shape is “elongate and rectangular” but it generally becomes longer and wider in adults, with the ventral surface being more rounded compared to the dorsal side (Verween et al., 2010). In addition, Dark Falsemussel displays valve asymmetry with the right valve larger than the left (Marelli and Gray, 1983). A distinctive feature for this species is the presence of a small tooth (called an apophysis) located near the umbo (or beak) that serves as the origin of anterior retractor muscles. However, this key feature may be absent or underdeveloped in larval stages (Siddall, 1980; Kennedy, 2011). Relative to Dreissena spp., Mytilopsis spp. have byssal retractor muscles located more posteriorly. Generally, the shell sizes of North American M. leucophaeata range from 10-20 mm, depending on the environment but specimens from Florida examined by Siddall (1980) averaged 22 mm.
At the level of the spermatozoa, both Zebra Mussel and Quagga Mussel differ from the Dark Falsemussel in terms of being more tapered and thin at the head portion (Denson and Wang, 1998). Nichols and Black (1994) observed rounder appearance of the D-hinged stage in Quagga Mussel compared to Zebra Mussel. Under laboratory conditions, hybrids between the two species have been spawned but only reared to the D-hinged stage (Nichols and Black, 1994). Although natural hybrids have been suggested they have not been confirmed (but see Voroshilova et al., 2010).
Habitat Preferences
D. polymorpha primarily inhabit freshwater ecosystems but have been reported from lower salinity, brackish environments as well. Since they have some capacity for osmoregulation they have been found over a wide range of salinities: 0 to 8-12 ppt for adults and 0 to 6 ppt for embryos (Orlova et al., 2005). This species typically is found in lakes, rivers, canals, and estuaries attached to a wide variety

6
of substrates such as rocks, shellfish, aquatic plants (Pollux et al., 2010 and references therein). When in an aggregate state, mud and sand grains as fine as 0.06-0.5 mm can become bound substrates that serve as suitable settlement substrate for Zebra Mussel, as has been observed in some United States lakes (Beekey et al., 2004). Zebra Mussel generally settle at moderate water depths (4-7 m), but colonization is possible at either shallower or deeper depths (Bially and MacIsaac, 2000; Wacker and Von Elert, 2003). This species tends to be very rare in the profundal zone (>50 m), potentially because this zone is generally characterized by finer sediments and colder (~4°C) temperatures (Dermott and Munawar, 1993; Mills et al., 1993). Kobak (2001) reported Zebra Mussel preferred dimmer habitats, being negatively phototactic. Although Zebra Mussel populations generally are not sustained in low oxygen or hypoxic conditions, some populations have been observed in hypolimnetic and epilimnetic zones with oxygen concentrations of 0.1-11.2 mg/L and 4.2-14.4 mg/L, respectively, while the lower oxygen threshold appears to be 32-40 Torr at 25°C (Benson et al., 2012a). The range of pH tolerance spans 7.4-9.4 with the optimum around 8.5 (Sprung, 1987; Hincks and Mackie, 1997). Although aquatic, dreissenid mussels, like other mussel species, can tolerate some time out of the water. The only information on desiccation tolerance comes from vector transport studies, where Zebra Mussel persisted for 3-10 days on a boat trailer (Ricciardi et al., 1995) and for 13-18 days under higher humidity conditions (McMahon, 2002). As with other bivalves, a significant quantity of calcium is required for shell development and calcium concentrations are considered a major factor in the potential for establishment and development of large populations (Mackie and Claudi, 2010). The calcium thresholds for Zebra Mussel are reported in Table 1. Thresholds for several environmental variables (e.g., temperature, pH, dissolved oxygen, calcium) suggested to limit Zebra Mussel populations is provided in Mackie and Claudi (2010).
Compared to Zebra Mussel, the Quagga Mussel is more energy-efficient and can live and spawn in cooler, more oligotrophic conditions (Roe and MacIsaac, 1997; Baldwin et al., 2002). While widely dispersed in deepwater habitats of the Laurentian Great Lakes, recent studies have indicated Quagga Mussel largely have displaced Zebra Mussel in shallow depths where the latter had previously dominated (Mills et al., 1996; Patterson et al. 2005; Imo et al., 2010). The ability of Quagga Mussel to use a broad range of substrates has been proposed to be a potential fitness advantage over Zebra Mussel in terms of habitat colonization (Peyer et al., 2011). Due to their euryhalinity, Quagga Mussel can be found in both freshwater and brackish water (Orlova et al., 2005) and can occupy both profundal and littoral zones of lakes and rivers (Mills et al., 1996; Baldwin et al., 2002; Stoeckmann, 2003). Quagga Mussel salinity tolerance ranges from 0-6 ppt: 0-4 ppt is supportive of embryonic development and 6 ppt is an upper lethal limit (Rosenberg and Ludyanskiy, 1994; Spidle et al., 1995; Orlova et al., 2005). In Lakes Erie and Ontario, D. rostriformis bugensis have been found at depths of up to 60 m and in other Great Lakes up to 130 m (Mills et al., 1993; Mills et al., 1996; Claxton and Mackie, 1998). However, at very shallow depths within the littoral zone of the Great Lakes dreissenids may be exposed to fatal winter conditions (primarily due to high winds, ice scour) especially if attached to mud substrates (Dermott et al., 2003 in Orlova et al., 2005). While Zebra Mussel regularly attach to submerged aquatic vegetation, Quagga Mussel generally do not (Diggins et al., 2004); instead preferentially colonizing cobble and gravel (Dermott et al., 2004 in Orlova et al., 2005) or sedimentary surfaces (Mills et al., 1993). The different preferences for attachment on submerged plants (e.g., macrophytes), which can become entangled on recreational boats and boat trailers, may offer one explanation why Zebra Mussel dispersal across the United States has occurred much more rapidly than dispersal of Quagga Mussel (Benson et al., 2012a; Benson et al., 2012b). Further, the tendency for Zebra Mussel to attach to macrophytes offers a clear management tool to limit the dispersal of Zebra Mussel overland. In some states in the United States the transport of macrophytes on boats or trailers is a ticketable offence (e.g., Wisconsin). As with Zebra Mussel, the most widely used environmental criteria to assess the potential for establishment and reproduction of this species is calcium (Table 1). Thresholds for several environmental variables (e.g., temperature, pH, dissolved

7
oxygen, calcium) suggested to limit Quagga Mussel populations is provided in Mackie and Claudi (2010).
The Dark Falsemussel is the most euryhaline and eurythermal of the three dreissenid mussel species considered here. Typically characterized as an estuarine species, the Dark Falsemussel is especially adapted to living in environments with high sediment loading potentially due to its long incurrent siphon and its ability to close its valves around the byssus (Marelli and Gray, 1983). This species typically is found in oligo- to mesohaline conditions (e.g., 0.5-5 ppt to 6-18 ppt) within their native North American range (Siddall, 1980). However, some studies suggest this species can survive conditions along the entire estuarine gradient (from 0 to 32 ppt) but neither extreme of this gradient appears to support reproduction (Verween et al., 2010). The wide range of salinity tolerances noted in the literature may be correlated with a high efficiency in hyperosmotic regulation (Verween et al., 2010). This presumably would allow Dark Falsemussel to survive in environments that temporarily become unsuitable. This species also appears to have broad temperature tolerances as the climatic ranges reported include temperate, tropical or sub-tropical (Marelli and Gray, 1983). Findings on the species‟ ability to handle short-term fluctuations in salinity and/or temperature are inconclusive (Wolff, 1969; Kennedy, 2011). Mackie and Claudi (2010) provide thresholds for several environmental variables (e.g., temperature, pH, dissolved oxygen, calcium) suggested to limit Dark Falsemussel populations. There are many suitable substrates for attachment for M. leucophaeata including the shells of Eastern Oysters Crassostrea virginica (Conrad 1831), between aggregations of the Hooked Mussel Ischadium recurvum (Hinkley, 1907), on firm substrates such as pier pilings, sticks, stones, or bottles (Wolff, 1969). In Chesapeake Bay, Dark Falsemussel form successive layers of shell clusters whereby each cohort of the species is being colonized by the next cohort (Kennedy, 2011). The presence of an apophysis in addition to the byssal retractor position in the Dark Falsemussel presumably renders its byssal attachment to substrates superior to that of Dreissena spp. when placed in an environment prone to disturbance such as fast water flow or tidal influences (Moore et al., 1991). However, this is inconsistent with attachment experiments performed on the three mussel species (size ~10 mm, distributed in North America), with Dark Falsemussel exhibiting relatively low attachment strength (see references in Table 1 in Kennedy, 2011).
Life History
Zebra Mussel (Dreissena polymorpha)
Zebra Mussel are r-strategists with a short maturation time (1-2 years), high fecundity (>1 million eggs per female for each spawning event), a large ability for dispersal aided by a planktonic veliger stage, and the ability for juveniles and adults to attach to a variety of hard surfaces (e.g., boats, trailers, hard shelled animals) that often are transported to different ecosystems (Ludyanskiy et al., 1993). Zebra Mussel are dioecious with external fertilization in the water column. Fertilized eggs develop into veligers within 3-5 days and are free-swimming for up to one month (Pennak, 1989; Mackie and Schloesser, 1996) thereby enhancing natural dispersal capabilities. Maximum larval abundances (unimodal or bimodal) can be measured between April and September (Pollux et al., 2010). Environmental conditions supporting larval development include temperatures between 12-24°C, pH between 7.4-9.4, and calcium concentrations > 12-25 mg/L (Pollux et al., 2010). During the free-living stage, there can be significant long-distance dispersal of mussel veligers downstream (up to 300 km) (Bially and MacIsaac, 2000). Veligers will develop to postveligers before reaching the juvenile stage that is capable of settling, crawling with a foot and attaching to substrates via byssal threads (Pennak, 1989; Benson et al., 2012a). The flat ventral surface of D. polymorpha could aid in securing attachment (Claxton et al., 1998) but massive mortality (90-99%) can occur if substrate colonization is unsuccessful/unsuitable, and/or if temperature and oxygen requirements are not met (Stanczykowska, 1977; Mackie and Schloesser, 1996). Further mortalities arise during the veliger stage as dreissenid

8
veligers are common prey during May–September, the principle growth season (Hecky et al., 2004). Water velocities exceeding 2 m/s may be enough to dislodge mussels (Richman et al., 2011), while other limiting factors include food limitation (Sprung, 1989), and predation by fish larvae, copepods and rotifers (Sprung, 1993). After settling as juveniles, mussels take a few months to reach sexual maturity (Jantz and Neumann, 1998), which coincides with a shell length of approximately 8-10 mm (Benson et al., 2012a). Females typically reproduce during their second year following oogenesis the previous fall, with egg development and release during the spring (Pennak, 1989), which is synchronous with spermatozoa release (Bacchetta et al., 2010). Despite this seasonal cycle, reproduction may continue throughout the year if supported by environmental conditions such as areas of thermal pollution (Pennak, 1989; Mackie and Schloesser, 1996). Several researchers established that 12°C is the lower threshold for spawning (Sprung, 1989; Ram et al., 1996; McMahon, 1996), although Mantecca et al. (2003) reported a spawning population at 10°C. Like other invasive species, D. polymorpha is highly fecund and can produce up to 1.6*10
6 eggs/female/year (Pennak, 1989; Mackie and Schloesser, 1996;
Pollux et al., 2010) with mature eggs 30-96 µm in diameter (Pollux et al., 2010). Shell growth occurs at 6–8°C, reaching 1.5–2.0 cm/year during maturation (Benson et al., 2012a). Although actual growth rates are temperature-determined like other bivalves, it appears higher temperatures promote increased growth rates in Zebra Mussel more than in Quagga Mussel (Baldwin et al., 2002).
Zebra Mussel feed like other bivalves using their inhalant siphons and can ingest small particles (0.07–1.0 µm in diameter), but prefer larger ones (Sprung and Rose, 1988). Common prey includes planktonic algae and zooplankton such as tintinnids, rotifers, copepods, and cladocerans (Mackie and Schloesser, 1996; Thorp and Casper, 2003). Bacteria sometimes comprise a significant portion of their diet (Cotner et al., 1995; Silverman et al., 1996). Dreissena polymorpha larvae ingest smaller planktonic species (Sprung, 1989) and at times mussel veligers (MacIsaac et al., 1995). Due to their grazing on small zooplankton and phytoplankton, adult Zebra Mussel compete with larger zooplankton, collectively depressing microzooplankton populations and impacting ecosystem structure and function (Wong et al., 2003). One consequence has been a decline in phytoplankton that in turn has allowed diatoms to proliferate (Ackerman et al., 2001). An arguably greater impact stemming from highly efficient filter feeding by dreissenid invaders in North America, a subject of several investigations, has been a shift in aquatic food chain from a predominantly pelagic to benthic one (elaborated in “Impacts” section) (Berg et al., 1996; Zhu et al., 2006). The specific filtration rates of dreissenids may be influenced by several factors, such as: size, concentration and temperature of suspended particles; size and types of algal and bacterial cells; and mussel size (Mackie and Schloesser, 1996; Benson et al., 2012a). In their study of Zebra Mussel and Quagga Mussel food clearance rates, Baldwin et al. (2002) found an increase in clearance rates with doubled food concentrations, but a decrease in the presence of inorganic (clay) particles suggesting they are selective filter feeders. Baldwin et al. (2002) summarized the optimal temperatures for feeding at 10–20°C, and at 24°C, 100mL of water could be filtered hourly by a 20 mm adult mussel (Bunt et al., 1993).
D. polymorpha can survive up to 6–9 years (generally 3–4 years) with potential lifespan linked to ambient temperatures where they tend to live shorter lives in warmer lakes (Stanczykowska, 1977; Benson et al., 2012a). Also, multiple cohorts coexist within a population. Dreissenids can reach very high densities (exceeding 1,000,000 individuals m
-2) in localized areas when conditions are favorable
(Ludyanskiy et al., 1993; Effler and Siegfried, 1994; Patterson et al., 2005). This is comparable to populations measured in Holland (summarized by Bij de Vaat, 1991). In North America, aggregate populations may contain around 700,000 individuals m
-2 (Pollux et al., 2010; Benson et al., 2012a).
Quagga Mussel (Dreissena rostriformis bugensis)
The life history characteristics of the Quagga Mussel are quite similar to those of the Zebra Mussel (see above) and only deviations will be highlighted here. The strategies employed by D. rostriformis

9
bugensis for energy-efficiency include lowering its respiration rate at different temperatures such that its metabolic rate is lowered and surplus energy can be invested in physical growth (Stoeckmann, 2003). Although best adapted to utilize phytoplankton as a food source; detritus, bacteria, and a variety of zooplankton species can comprise a portion of their diet (Cotner et al., 1995; Frischer et al., 2000; Roditi et al., 2000; Higgins and Vander Zanden, 2010). As Zebra Mussel and Quagga Mussel have similar diets (Garton et al., 2005), the larger size of Quagga Mussel may confer a competitive advantage over co-occurring Zebra Mussel (Martel et al., 2001 in Garton et al., 2005). However, this advantage may be offset by the more fragile shells of Quagga Mussel that render it more vulnerable to fish predation (Diggins et al., 2004). As noted previously, the Quagga Mussel appears to have a much wider tolerance for cooler temperatures and softer substrates, allowing for the colonization of profundal sediments in the hypolimnia of lakes. At the ecosystem scale, the development of large populations of Quagga Mussel on softer substrates and below the thermocline may allow them to outcompete Zebra Mussel due to a larger pool of free-swimming larvae that can colonize both hard and soft substrates in littoral waters. While at smaller spatial scales Quagga Mussel densities appear similar to Zebra Mussel densities, at the whole ecosystem scale Quagga Mussel densities have the potential to be much larger (due to their ability to colonize soft sediments in both littoral and profundal waters).
Dark Falsemussel (Mytilopsis leucopheata)
The reproductive period of M. leucophaeata in North America generally commences in late spring (Menzie, 1980) and in Holland has been observed to span from summer (May/June) to fall (October/November) (Rajagopal et al., 2005; Verween et al., 2005). Optimal spawning conditions include temperatures greater than 12°C (Verween et al., 2005; Kennedy, 2011) and relatively low salinities, but not freshwater (Kennedy, 2011). Egg sizes of the Dark Falsemussel generally are smaller compared to the other dressenid species but as with the other dreissenids fertilization occurs externally, producing larvae within 24 hours (Verween et al., 2010). Similar to other dreissenids, M. leucophaeata develops through several stages; first becoming a trochophore (ciliated larva), then a soft-shelled, bilaterally symmetrical veliger (with ciliated velum), a D- or straight-hinged veliger (not ornamented), a veliconcha (ornamented), followed by organogenesis, foot development, and byssal formation that enable the “setting” or benthic stage called pediveliger (Verween et al., 2010). A combination of foot crawling and byssal attachment allows the Dark Falsemussel to find appropriate substrate (Koch, 1989). The final metamorphosis into a juvenile can be accomplished within nine days (see Table 3 in Kennedy, 2011). As larvae, M. leucophaeata may be preyed upon by suspension-feeding bivalves, barnacles, jellyfish, and ctenophores; as adults, they are vulnerable to predation by a diversity of estuarine animals like fish, crabs, and waterfowl (Kennedy, 2011 and references therein). Biocide experiments in an effort to control Dark Falsemussel infestations in Europe have found individuals during the breeding season to be more vulnerable to chlorine treatments (Rajagopal et al., 2002).
Dark Falsemussel are filter feeders of phytoplankton (primarily) and zooplankton (Verween et al., 2010). Stomach content analysis of some Florida specimens also has revealed significant portions of inorganic particles (36%) and plant detritus (31%) (Odum and Heald, 1972). In a study by Rajagopal et al. (2005), smaller mussels held at 20°C and 5.6-5.8 ppt exhibited the greatest foot activity. To our knowledge, no study has investigated the filtration rate of M. leucophaeata but it is believed to be similar to that of D. polymorpha (Verween et al., 2010). Gradual growth occurs throughout the lifetime of this species (Verween et al., 2006 in Verween et al., 2010). Growth rates for Dark Falsemussel have been found to be positively correlated with temperature; negatively correlated with shell size; and not correlated with chlorophyll a concentrations (Verween et al., 2006 in Kennedy, 2011). For example, juveniles found in Amsterdam Harbour averaging 4 mm at the beginning of the summer gradually increased to 24 mm by the fall (Kennedy, 2011 citing (Vorstman, 1933; Schutz, 1969). The average

10
age of this cohort was only a year and a few months (in Kennedy, 2011), although 2-4 years has been cited as the average lifespan of the Dark Falsemussel (see Verween et al., 2010).
Population (Genetic) Structure
Zebra Mussel began expanding their range throughout Europe over 200 years ago, substantially earlier than their establishment in the Laurentian Great Lakes of North America (Table 2). This led many to speculate that it was these „newly‟ invaded populations in Europe that were the source of individuals transported to the Great Lakes (e.g., Benson et al., 2012a). However, based on genetic similarities, Ricciardi and MacIsaac (2000) suggested the Baltic Sea was a probable origin for Great Lakes Zebra Mussel populations. Several genetic studies have demonstrated similar genetic heterogeneities among invasive and native populations of D. polymorpha, suggesting populations were founded and/or maintained from native populations, large size of the founder populations, or frequent genetic mixing as possible mechanisms (Marsden et al., 1995; Brown and Stepien, 2010). Soroka et al. (1997) assessed the genetic structure of a Zebra Mussel population in Poland and found many loci deviating from Hardy-Weinberg equilibrium. It appears that the D. polymorpha populations in North America at that time exhibited contrasting results in terms of agreement with Hardy-Weinberg equilibrium (see Soroka et al., 1997). Polish Zebra Mussel populations also seemed to exhibit higher genetic variability than their North American counterparts, presumably due to differential invasion histories, selection pressures, etc. (Soroka et al., 1997). Even though no hybrid populations of Quagga Mussel and Zebra Mussel have been found in the wild, their co-occurrence and overlapping reproductive period in some ecosystems may create conditions that would enhance hybridization potential. Work by Voroshilova et al. (2010) suggests a putative natural hybrid was detected in Rybinsk Reservoir, Russia, using molecular markers.
Ricciardi and MacIsaac (2000) suggested Quagga Mussel populations invasive in North America originated from native populations found in the estuaries of the Southern Bug and Dnieper Rivers from the Black Sea basin. In a microsatellite marker survey of native and invaded ranges of D. rostriformis bugensis, Therriault et al. (2005) found no difference in genetic diversity. This finding was consistent with a previous study by Wilson et al. (1999), lending support to the notion that the high genetic diversity of these mussels constituted a factor for their successful invasion histories. Further these researchers also did not find evidence of isolation-by-distance, thereby inferring that jump dispersal may be responsible for secondary transport, especially in North America where transport by recreational boats was inferred. Lastly, Therriault et al. (2005) attribute the lack of genetic differentiation to significant gene flow owing to one or a combination of mechanisms operating in the invasive range: (a) a large inoculum size; (b) rapid population growth; and/or (c) multiple introductions.
Population densities of Dark Falsemussel in newly invaded European habitats generally greatly exceed population densities in their native North American range, a pattern that is perhaps characteristic of newly invaded versus native habitats (Kennedy, 2011). Similarly, Laine et al. (2006) observed up to 28,000 individuals m
-2 near a power plant cooling water system in Finland. In contrast, the Hudson
River has reported density ranges from 1-25 (at 0-3 ppt), 100-200 (5-9 ppt) to 1,000-2,000 (2-6 ppt) individuals m
-2 (Walton, 1996). There have been no investigations into the genetic diversity of native
versus invasive populations of M. leucophaeata.
Ecological Impacts
The impacts of Zebra Mussel and Quagga Mussel on water quality (i.e., environmental impacts) and flora and fauna (i.e., biological impacts) of invaded habitats are well described in the scientific literature. A recent meta-analysis (Higgins and VanderZanden 2010; Higgins in press) of the scientific literature and long-term monitoring datasets quantified the mean, variance, and overall structure of

11
these impacts for lake and river ecosystems across their invaded range (North America and Europe); the general results of this analysis are described below and in Table 3.
It is important to recognize that considerable variation exists in the impacts of Zebra Mussel and Quagga Mussel invasions on water quality and biota of lake and river ecosystems. Despite this variation, consistent patterns in the direction and magnitude of impacts are evident. First, these dreissenid mussels can induce significant and ecologically relevant impacts on water quality and all major trophic levels from sediment bacteria to apex predators (e.g., piscivorous fishes). Rather than being unique, impacts to multiple trophic levels appear a common consequence of dreissenid invasions. Second, evidence from a temporal analysis of dreissenid impacts on several important ecological indictors (e.g., secchi depth, chlorophyll a concentration, total phosphorus concentration) indicated that the magnitude of impacts were pervasive, with no evidence of declining within 20 years post-establishment of these species (Higgins et al. 2011; Higgins in press). Third, the direction of impact (i.e., increase, neutral, decrease) at each trophic level largely was dependant on the energy pathway to which the organism belonged. Organisms that were associated with the pelagic-profundal energy pathway (e.g., phytoplankton, zooplankton, profundal zoobenthos, see Figure 5) most often showed declines in biomass or abundance following dreissenid invasions. In contrast, organisms that were associated with the benthic-littoral pathway (e.g., benthic algae, macrophytes, littoral zoobenthos) generally displayed increases in biomass or abundance following dreissenid invasions. Notable exceptions to this general rule were unionid and sphaerrid mussels, which compete for space and/or food with dreissenids. In particular, unionid mussel populations demonstrated large population declines and loss of species following dreissenid invasions (e.g., Gillis and Mackie, 1994; Ricciardi et al., 1997). This response is particularly troublesome since unionid mussels, already imperiled by habitat degradation and over harvesting, are among the most imperiled faunal groups in North America (Ricciardi et al., 1998). Forth, the magnitude of impact on biota within the pelagic-profundal pathway is related to the filtration capacity of the mussel population, which is a function of population density, the size of the ecosystem, and a variety of factors that affect individual filtration rates (e.g., temperature, water velocity, turbidity) and access to the water-column (e.g., depth, vertical and horizontal mixing). Dreissenid densities can vary by several orders of magnitude over space (within and among lakes or rivers) and time (e.g., years), and whole-ecosystem densities largely are unknown. However, impacts appear to scale with ecosystem size with smaller ecosystems showing the largest impacts. For example, mean declines in phytoplankton were highest in rivers (-78% of pre-dreissenid values), followed by small non-stratified lakes (-58% of pre-dreissenid conditions), and deeper stratified lakes (-38% of pre-dreissenid conditions) (Higgins and Vander Zanden, 2010). A similar pattern was found for zooplankton biomass, with mean declines of 76%, 56%, and 40% for rivers, small non-stratified lakes, and stratified lakes, respectively. While the magnitude of impacts tended to increase with decreases in ecosystem size, this does not indicate that large ecosystems are immune from significant impacts. For example, there are widespread reports of significant impacts to water quality and biota within Lakes Erie, Michigan, and Ontario, which are among the largest freshwater ecosystems on the planet. This appears particularly important when key ecosystem components are affected. For example, in Lake Huron, the arrival and spread of Quagga Mussel to deepwater habitats is thought to have caused the collapse of a key diet item (diporeia) for important forage fishes (Lake Whitefish, Alewife), leading to a collapse of these fish species and the multi-million dollar Pacific salmon fishery. Nonetheless, smaller ecosystems such as rivers, shallow non-stratified lakes, and embayments of larger ecosystems (e.g., Bay of Quinte in Lake Ontario) tend to have larger impacts relative to large stratified lakes.
As with lower trophic levels, the impacts of Zebra Mussel and Quagga Mussel invasions on fish health, population status, and community structure appear related to the energetic pathway from which they obtain their food. However, as most fish species are capable of obtaining food from either resource pathway, the largest negative impacts to fish populations likely will occur for species that are obligate planktivores or deepwater benthivores that are unable to efficiently utilize benthic resources in littoral

12
zones (Mills et al., 2003; Pothoven and Madenjian, 2008; Rennie et al., 2009). The collapse in planktivore and predator communities in Lake Huron (described above) is an example of the response of fish species to dressenids that were unable to efficiently utilize littoral resources after pelagic and profundal resources (e.g., zooplankton, diporeia) declined. In contrast, species that can efficiently utilize benthic-littoral resources would be expected to benefit from Zebra Mussel and Quagga Mussel invasions. In a well documented case study on fish communities in the Hudson River (Strayer et al., 2004), the abundance of pelagic fish species declined by 28%, and the abundance of littoral fish species increased by 97%. There are 14 fish species in North America, and several species of waterfowl, now known to directly use Zebra Mussel or Quagga Mussel as a prey items (Molloy et al., 1997). Some studies have reported that inclusion of dreissenids in fish diets resulted in declines in fish growth or condition (French and Bur, 1996, Hoyle et al., 2008) and it appears that dreissenid shells offer sufficient protection that they often are considered a food source of last resort for most fish species.
As the filter feeding activities of Zebra Mussel and Quagga Mussel remove phytoplankton and other suspended particulate matter from the water column, water clarity often increases substantially following an invasion. Water clarity is a contributing factor to the penetration of solar energy into lakes, affecting the thermocline depth and heat budgets of lakes, and the growth of algae and plants on the lake bottom. Increasing thermocline depths reduces the volume of the hypolimnion, which could increase deepwater anoxia in some lakes and reduce cold water habitat for some fish species. In some systems, such as the lower Laurentian Great Lakes (Lakes Ontario, Erie, and Michigan), dreissenid invasions led to dramatic increases in nuisance blooms of the benthic alga Cladophora glomerata (Higgins et al., 2008). These blooms significantly modified benthic habitats; fouled recreational beaches, municipal and industrial water intakes; were associated with increased abundance of indicator bacteria (e.g., E. coli) and pathogenic bacteria (e.g., Salmonella, Shigella, Campylobacter); were thought to contribute to avian botulism; and were thought to cause localized anoxia to sediments and sediment biota within depositional areas (Higgins et al., 2008). In some locations of the Laurentian Great Lakes (e.g., Saginaw Bay in western Lake Erie) and inland lakes in Michigan, dreissenid invasions led to an increase in toxin producing phytoplankton species, and their toxin (microcystin), even as total phytoplankton biomass declined (Raikow et al., 2004; Knoll et al., 2008). This hepatotoxin is known to affect liver function, and is a concern both for native biota and humans.
Differences in the magnitude of impacts between Zebra Mussel and Quagga Mussel are not well reported in the scientific literature, presumably because Quagga Mussel are more geographically restricted within North America where the majority of studies have been conducted. However, it is reasonable to expect that the magnitude of impacts associated with Quagga Mussel invasions would be higher than that for Zebra Mussel due to their ability to colonize a wider range of habitats and achieve higher population densities at the ecosystem scale. Thus, there is the potential for increased magnitude of impacts of Quagga Mussel invasions, even in habitats already colonized by Zebra Mussel. General descriptions of the direction, magnitude, and probability of Zebra Mussel and Quagga Mussel impacts to various ecosystem parameters are described in the risk assessment methodology section of this document (see below, and Table 3).
Potential Interactions with Species At Risk
Schloesser et al. (1998) highlight the impact dreissenid mussels have had on native unionid mussels in the Great Lakes following their introduction, including significant declines in abundance and species diversity at local scales. Where spatial overlap between introduced driessenid mussels and native mollusc species at risk is high then the impact also should be expected to be high. As of November 2011 a number of molluscs have been assigned status by the Committee on the Status of Endangered

13
Wildlife in Canada (COSEWIC) with 19 being identified as Endangered, three Threatened and six of Special Concern. Of these, several species have the potential to interact with dreissenid mussels (Table 4; COSEWIC, 2011). In Ontario, where Zebra Mussel and/or Quagga Mussel distributions have overlapped distributions of native mussels identified as Species at Risk, the presence of the invasive dreissenid has been identified as a factor limiting recovery. For example, the Eastern Pondmussel (Ligumia nasuta) which had a significant distribution overlap with Zebra Mussel saw a reduction of up to 90% following invasion (COSEWIC, 2007). More recently, in British Columbia the threat of Zebra Mussel contributed to the Endangered status assigned to Rocky Mountain Ridged Mussel (Gonidea angulata).
Should dreissenid mussels establish high-density populations in freshwater systems beyond their current range in eastern North America, they could potentially affect the fitness of a number of COSEWIC-listed fish species (COSEWIC, 2011; Table 5), depending on the tendency of each species to prey on these mussels or owing to potential changes in productivity associated with trophic changes attributed to invasions in Europe and North America, notably molluscavores and planktivores (see impacts below).
VECTORS
Primary Invasion
Of the many potential primary invasion vectors available to aquatic non-indigenous species both D. polymorpha and D. rostriformis bugensis were introduced to the Laurentian Great Lakes of North America via ballast water (e.g., Hebert et al., 1989; Pathy and Mackie, 1993; Therriault et al., 2004). Arrival as a hull fouling species is less probable for the Zebra Mussel and Quagga Mussel due to relatively long transit times and oceanic environments that exceed salinity tolerances. Pollux et al. (2010) showed that D. polymorpha larvae easily can survive ballast water transport for 11-15 days at 12-24°C, which could be extended if optimal conditions were met. In contrast, the salinity tolerant M. leucopheata was introduced to the Hudson River and Europe either in ballast water or as a fouling species on ship hulls or other niche areas (Kennedy, 2011).
Secondary Invasion/Dispersal (Spread)
Many potential vectors of secondary introduction/spread have been identified for dreissenid mussels. Perhaps the most studied is recreational boating (attached to watercraft/trailers or entrained in live-well/bilge/lines) (e.g., Johnson and Padilla, 1996; Orlova et al. 2004; Pollux et al., 2010). Through a program of mandatory boater inspections in the United States as part 100
th Meridian Initiative to slow
the spread of Zebra Mussel and Quagga Mussel it has become apparent that commercial hauling of recreational boats represent only a small fraction of overland boat transports but represent approximately one-half of fouled boats that were intercepted (www.agri.idaho.gov/Categories/Environment/InvasiveSpeciesCouncil/Inspection_Stations_ALL.php). Through the same program, in 2011 25 driessenid infested boats were identified with five boats of these boats destined for British Columbia (L.-M. Herborg, B.C. Ministry of the Environment, pers. comm.) and by April 2012 11 infested watercraft were detected. Hence, commercial transport of boats appears a particularly important pathway for long-distance dispersal. Also, boat washing stations appear to have successfully prevented dreissenid invasions in some Ontario lakes that were otherwise suitable and in close proximity to invaded lakes (G. Mackie, Univ. of Guelph, pers. comm.).
Dreissenid mussels also can spread via natural dispersal (e.g., drift, attachment to wildlife) or other human-mediated activities (e.g., intra-basin ballast water discharge, canal creation, waterway operations, scientific expeditions) (e.g., Johnson and Carlton, 1996; Stoeckel et al., 1997; Jantz and

14
Neumann, 1998; Schneider et al., 2003; Orlova et al. 2005; Ricciardi 2006). Natural dispersal is especially important for drainages where there is a large lake or reservoir that can act as a source of propagules for downstream locations (e.g., Therriault et al., 2004). Following the arrival of Zebra Mussel to the Great Lakes this species rapidly reached downstream locations along the Mississippi River hundreds of kilometers away (Figure 6) likely enhanced by natural dispersal and a combination of natural and human-mediated dispersal events then allowed this species to inhabit additional river segments (Benson et al., 2012a).
DISTRIBUTION
Native Ranges
Both Zebra Mussel and Quagga Mussel are native to the Ponto-Caspian Region of Eastern Europe. The Zebra Mussel is considered native to the Black Sea basin, including the Sea of Azov (Mills et al., 1996) while the Quagga Mussel is native to the Dnieper and Bug Limans of the Black Sea basin (Van der Velde et al., 2010; Therriault and Orlova, 2010 (referencing Andrusov, 1897; Kharchenko, 1995)). The Dark Falsemussel is native to the Gulf of Mexico and Atlantic coast of the United States (Marelli and Gray, 1983) but is generally rare in its native range (Kennedy, 2011).
Introduced Ranges
The Zebra Mussel has an extensive freshwater introduced range as a result of an invasion history that dates back to the late 18
th century in Russia (see Table 1). Initially spreading north through the
Dnieper and Volga River tributaries (Stanczykowska, 1977) this species continues to spread in European waters with only Norway and Iceland escaping Zebra Mussel introductions thus far. This species arrived in the Laurentian Great Lakes of North America in the mid-1980s and has spread extensively around the Great Lakes basin and along the Mississippi River and its tributaries since that time (Figure 6). Although this species has established populations west of the continental divide in the United States, populations have not been reported yet in western Canada (Manitoba, Saskatchewan, Alberta, or British Columbia).
The Quagga Mussel also has invaded parts of Europe and North America. In Europe, this species invaded waterways in the Caspian basin, most notably the Volga River system (Orlova et al., 2004; Therriault et al., 2004) but also Ukraine (Zhulidov et al., 2005), Hungary (van der Velde and Platvoet, 2007), Germany, Netherlands, and Romania (ISSG, 2012). While the Zebra Mussel rapidly expanded through the eastern United States, the Quagga Mussel has largely remained restricted to the Great Lakes basin. More recently, long range overland transport of Quagga Mussel to several western states has occurred (Figure 7). However, similar to Zebra Mussel, Quagga Mussel populations have not been reported from western Canada.
Dark Falsemussel has invaded brackish waters of the North Sea including coastal waters in France, Belgium, Germany, the Netherlands and more recently England, Finland, the Black Sea, and Spain (Table 6). This species has been reported outside its native range in the United States, but not within Canadian waters (Table 6).

15
METHODS AND MATERIALS
RISK ASSESSMENT METHODOLOGY
Figure 8 presents the flow diagram of the risk assessment process used here for dreissenid mussels. The risk to the environment (ecological risk ONLY as socio-economic risk was not assessed here) posed by a NIS is a combination of the probability of invasion and the impacts to the environment due to that invasion within the risk assessment area. The probability of invasion (Step 1, Figure 8) is determined by the probability of arrival and probability of survival of the NIS. The probability of survival represents the overlap between the physiological requirements/tolerances of a potential invader and environmental conditions in the risk assessment area and is determined here by considering calcium requirements combined with potential temperature limitations. Specifically, we employ calcium concentration thresholds linked to the potential for dreissenid mussels to survive, reproduce, and reach population densities that would be considered invasive within each of the 108 sub-drainages where we had sufficient data. In addition to suitable habitat required for survival, potential invaders must have a mechanism to reach the risk assessment area – the potential for arrival. Here we consider the probability of arrival to be a function of propagule pressure, primarily human-mediated activities determined using a Human Footprint Index (described in the following sections), and the proximity to potential source populations of dreissenid mussels. Spread of a NIS following initial establishment is a function of additional suitable habitat and secondary dispersal vectors and pathways within the risk assessment area. Given the spatial scale of this assessment (i.e., sub-drainages) and limited site-specific data, we did not determine explicitly the probability of secondary spread within each sub-drainage. The rapid expansion of these species across North America and Europe indicates that human-mediated activities are highly likely to re-distribute dreissenids within sub-drainages after their initial arrival. Further, by employing the 75
th percentile in available calcium concentrations per sub-
drainage (see below) this approach suggests within sub-drainages multiple locations of suitable habitats exist for secondary survival. The impacts to the environment are determined in Step 2 and may include, but are not limited to, impacts on biodiversity, trophic disruption, and habitat alteration or destruction. In Step 3, the probability of invasion is combined with the impacts to the environment to obtain the risk to the environment using a heat matrix (Figure 9). Detailed methodology for each of these steps is described in the following sections.
Determining the Probability of Survival (Habitat Suitability)
We used reported calcium thresholds to characterize the probability of survival (habitat suitability). Although several environmental variables (e.g., temperature, pH, dissolved oxygen, calcium) may limit successful mollusc invasions (e.g., Mackie and Claudi 2010), Whittier et al. (2008) and Neary and Leach (1992) also used calcium concentration as the primary factor determining Zebra Mussel and Quagga Mussel risk. For Zebra Mussel we defined four probability categories ranging from very low to very high (no “low” category) based on species biology while for the less studied Quagga Mussel we defined three categories (no “low” or “moderate” categories) (Table 1). Only when calcium concentrations are very low (< 12 mg/L) do dreissenid mussels fail to establish. Water quality data were provided by the provinces of British Colombia, Alberta, Manitoba, Saskatchewan, Ontario, and Quebec (Table 7). We extracted calcium data for each sampling station or for Ontario we converted alkalinity to calcium following Mackie and Claudi (2010). Data were selected to represent the most recent sampling year. We calculated the 75
th percentile calcium value (sensu Whittier et al., 2008) for
each of the 108 sub-drainages within the six provinces. Using the 75th percentile ensures the sub-
drainage value is determined by the majority of sites within the sub-drainage and is less influenced by a few, divergent locations that might be less representative of the sub-drainage. For sub-drainages with <5 sampling sites, uncertainty is higher and this uncertainty decreases with increased sampling.

16
In addition to calcium requirements, published literature suggests that water temperature could be limiting for Zebra Mussel populations. Thus, in order to determine the probability of survival we applied a temperature based correction factor to the calcium concentration scores for Zebra Mussel. Following the relationship identified by Strayer et al. (1991) between water temperature and air temperature in the warmest quarter and data from Mackie and Claudi (2010), available air temperature data from Bioclim 10 (http://www.worldclim.org/) were used to lower the probability of survival in watersheds that have suitable calcium concentrations but are considered too cold to support large Zebra Mussel populations. Thus, the correction for temperature employed here was as follows:
Limiting: air temperature in the warmest quarter <10oC
Probability of survival reduced by 1 category
Potentially or Not Limiting: air temperature in the warmest quarter ≥10oC
Probability of survival not changed
Information on the temperature tolerances of Quagga Mussel suggests they are capable of reproduction in cold hypolimnetic waters of the Laurentian Great Lakes. While it is probable that the development of large populations of Quagga Mussel is reduced below some temperature threshold, we did not have sufficient information to include this factor in our analysis and the northern limits of this species in Canada are therefore unknown. For these reasons the probability of survival (habitat suitability) for Quagga Mussel was not corrected for temperature.
The probability of survival (habitat suitability) was based on calcium requirements tempered by temperature requirements (for Zebra Mussel but not Quagga Mussel) and model outputs fell within five probability categories ranging from very low to very high.
Determining the Probability of Arrival
The probability of arrival was defined here as a function of propagule pressure and proximity to an invaded habitat (Figure 8). The inclusion of propagule pressure incorporates the understanding that the transport of Zebra Mussel and Quagga Mussel between habitats is associated with human activities (e.g., trailering of recreational boats). We employed the Human Footprint Index (Sanderson et al., 2002; Appendix A3) as a proxy for propagule pressure. This index is a composite factor of human influence corrected by biome type (http://sedac.ciesin.columbia.edu/wildareas/) that integrates data of land use, urbanization, population density, transportation networks and other human activities that are known to facilitate species invasions (Ficetola et al., 2007; Liu et al., 2011). In order to estimate propagule pressure per sub-drainage, mean scores of the Human Footprint Index were binned according to their natural (Jenks) data breaks into five categories ranging from very low to very high (Table 8).
The probability of arrival was considered to be influenced by the proximity to an invaded habitat, similar to studies that utilize a gravity modelling approach (e.g., Leung et al., 2004). We used information on the current distribution of Zebra Mussel and Quagga Mussel invasions across Canada and the United States (Benson et al., 2012a; 2012b) to calculate a proximity correction factor that adjusted propagule pressure scores (Table 8). Watersheds containing an invaded lake or river, or watersheds either directly adjacent to or within two watersheds of those with an invaded site, were considered to have a very high risk of invasion, and propagule pressure scores were increased by 1 category in the calculation of the probability of arrival (Table 8). Since Zebra Mussel dispersal via natural downstream drift can be substantial (see timing of dispersal along the Mississippi River in Figure 6; Benson et al.,

17
2012a), propagule pressure scores also were increased by 1 category for sub-drainages downstream of known dreissenid infestations along major rivers. With increasing distance away from invaded habitats, the relative risk of arrival should decrease such that propagule pressure scores were not adjusted (Table 8).
Determining the Probability of Invasion
The probability of invasion was considered to be a function of the probability of survival (habitat suitability) and the probability of arrival (Figure 8). In this analysis the two components were considered to be equally weighted, and thus were averaged to obtain the probability of invasion for each of the 108 sub-drainages unless calcium was below the required threshold. Since a minimum level of calcium must be available to allow dreissenid mussels to develop their shells (survive and reproduce), should this minimum threshold not be attained then the probability of survival and successful population establishment will be very low. Thus, if the probability of survival was scored as “very low”, then the probability of invasion also was scored as “very low”.
Defining Impacts and Uncertainty
To ensure consistency when determining expected impacts on specific ecological endpoints we define five categories for each impact, ranging from very high to very low (Table 9). Similarly, to ensure uncertainty is characterized in a standardized way, we provide an explicit definition of each category also ranging from very high to very low, based on the quality of information available (Table 9).
RISK ASSESSMENT FOR ZEBRA MUSSEL
(DREISSENA POLYMORPHA)
STEP 1: DETERMINING THE PROBABILITY OF INVASION
Probability of Survival (Habitat Suitability)
Calcium Suitability
Most sub-drainages in Manitoba, Saskatchewan, Alberta, eastern British Columbia, and the Great Lakes basin have calcium concentrations that could easily support Zebra Mussel populations at high to very high levels (Figure 10). In contrast, most sub-drainages on the Canadian Shield through central and northwestern Ontario and Quebec have very low calcium concentrations as do sub-drainages along the west coast of British Columbia and in parts of northern Saskatchewan (Figure 10). In fact, these calcium concentrations are considered below the threshold required for Zebra Mussel to survive in these sub-drainages. However, localized calcium concentrations (not assessed here) could be more (or less) favorable for survival. Further, at the scale of the risk assessment conducted here there can be considerable intra-sub-drainage variability as evidenced by the range of actual calcium concentration values. To provide a measure of uncertainty in available calcium data, the percentage of data points that fall into each of the calcium tolerance bins is provided (Table 10). This variability is the greatest source of uncertainty when projecting calcium habitat suitability to the sub-drainage spatial scale used in this risk assessment.
Temperature Tolerance
A few sub-drainages in northwestern British Columbia and northern Quebec have temperatures that would be considered limiting to Zebra Mussel (Figure 11). Much of British Columbia, Alberta,
18
Saskatchewan, Manitoba, Ontario, and Quebec have temperatures that are not limiting for Zebra Mussel (Figure 11).
Probability of Survival (Habitat suitability)
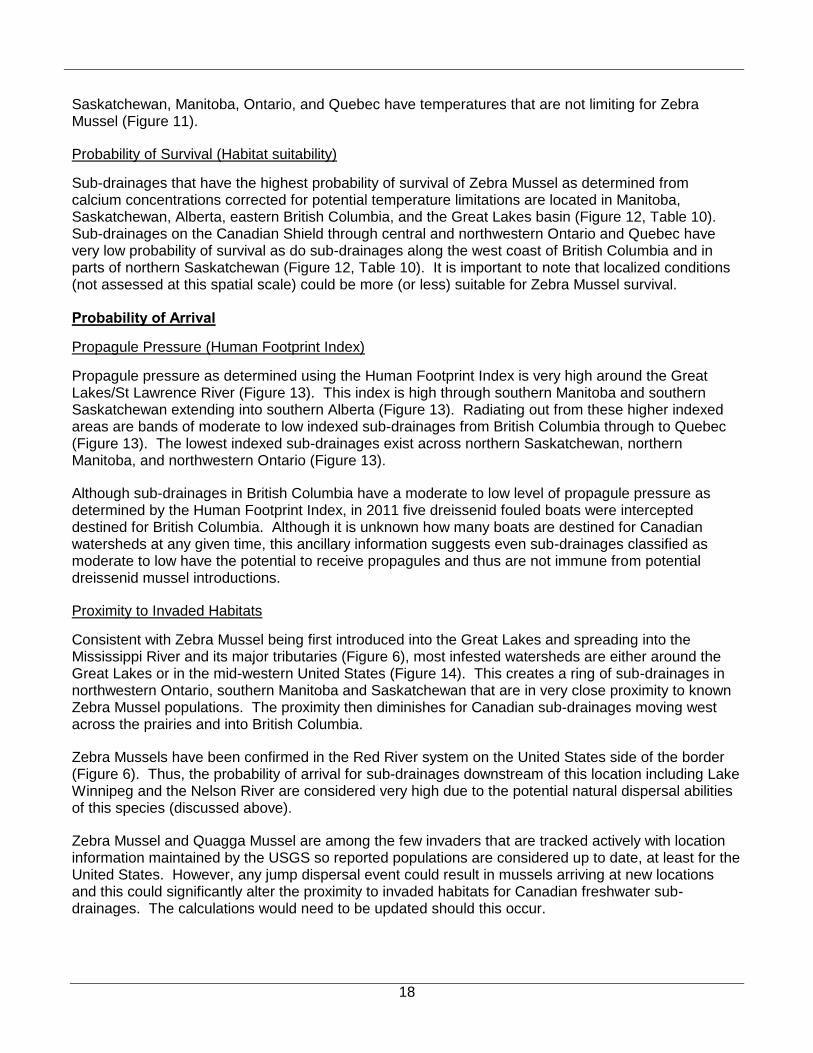
Sub-drainages that have the highest probability of survival of Zebra Mussel as determined from calcium concentrations corrected for potential temperature limitations are located in Manitoba, Saskatchewan, Alberta, eastern British Columbia, and the Great Lakes basin (Figure 12, Table 10). Sub-drainages on the Canadian Shield through central and northwestern Ontario and Quebec have very low probability of survival as do sub-drainages along the west coast of British Columbia and in parts of northern Saskatchewan (Figure 12, Table 10). It is important to note that localized conditions (not assessed at this spatial scale) could be more (or less) suitable for Zebra Mussel survival.
Probability of Arrival
Propagule Pressure (Human Footprint Index)
Propagule pressure as determined using the Human Footprint Index is very high around the Great Lakes/St Lawrence River (Figure 13). This index is high through southern Manitoba and southern Saskatchewan extending into southern Alberta (Figure 13). Radiating out from these higher indexed areas are bands of moderate to low indexed sub-drainages from British Columbia through to Quebec (Figure 13). The lowest indexed sub-drainages exist across northern Saskatchewan, northern Manitoba, and northwestern Ontario (Figure 13).
Although sub-drainages in British Columbia have a moderate to low level of propagule pressure as determined by the Human Footprint Index, in 2011 five dreissenid fouled boats were intercepted destined for British Columbia. Although it is unknown how many boats are destined for Canadian watersheds at any given time, this ancillary information suggests even sub-drainages classified as moderate to low have the potential to receive propagules and thus are not immune from potential dreissenid mussel introductions.
Proximity to Invaded Habitats
Consistent with Zebra Mussel being first introduced into the Great Lakes and spreading into the Mississippi River and its major tributaries (Figure 6), most infested watersheds are either around the Great Lakes or in the mid-western United States (Figure 14). This creates a ring of sub-drainages in northwestern Ontario, southern Manitoba and Saskatchewan that are in very close proximity to known Zebra Mussel populations. The proximity then diminishes for Canadian sub-drainages moving west across the prairies and into British Columbia.
Zebra Mussels have been confirmed in the Red River system on the United States side of the border (Figure 6). Thus, the probability of arrival for sub-drainages downstream of this location including Lake Winnipeg and the Nelson River are considered very high due to the potential natural dispersal abilities of this species (discussed above).
Zebra Mussel and Quagga Mussel are among the few invaders that are tracked actively with location information maintained by the USGS so reported populations are considered up to date, at least for the United States. However, any jump dispersal event could result in mussels arriving at new locations and this could significantly alter the proximity to invaded habitats for Canadian freshwater sub-drainages. The calculations would need to be updated should this occur.

19
Probability of Arrival
The probability of Zebra Mussel arrival was high to very high in southern Manitoba and southern Saskatchewan extending into southern Alberta and in south-central Ontario and southern Quebec around the Great Lakes/St. Lawrence watershed (Figure 15, Table 11). The probability of arrival was moderate for central Quebec and Alberta, and southern British Columbia along the border with the United States (Figure 15, Table 11). The probability of Zebra Mussel arrival in the northern part of the Prairie Provinces and northwestern Ontario was low to very low (Figure 15, Table 11).
Probability of Invasion
Probability of invasion was calculated by combining the probability of survival and the probability of arrival. Sub-drainages in southern Manitoba (including Lake Winnipeg and the Nelson River), southern Saskatchewan, southern Alberta, and southern Ontario had a very high probability of Zebra Mussel invasion (Figure 16, Table 11). The probability of invasion was moderate to high for most of British Columbia, Alberta, and Ontario not on the Canadian Shield (Figure 16, Table 11). Sub-drainages on the Canadian Shield in northwestern and central Ontario, Quebec, and coastal British Columbia have a very low probability of Zebra Mussel invasion determined primarily by a lack of calcium (Figure 16, Table 11).
STEP 2: DETERMINING THE IMPACTS OF INVASION
Information on documented and potential impacts on various ecological parameters endpoints was used to determine the final impact score(s) and level of uncertainty (Table 3). This included consideration of published information on impacts of Zebra Mussel and Quagga Mussel invasions throughout Europe and North America (e.g., Higgins and VanderZanden, 2010). Zebra Mussel and Quagga Mussel densities are highly variable in space and time (e.g., can vary by >1 order of magnitude between years and between invaded ecosystems), and in some circumstances local populations can reach extremely high densities – >10,000 individuals per square meter (Ludyanskiy et al., 1993; Effler and Siegfried, 1994; Patterson et al., 2005). Further, evidence from the scientific literature suggests that the magnitude of impacts largely is determined by density, or a combination of density and ecosystem size. Unfortunately, with the exception of calcium, which at low levels may limit dreissenid mussel densities due to their requirement for building shell material, the drivers of mussel density remain poorly understood (e.g., relationship with trophic status) or unknown at a landscape level (e.g., availability of hard substrate). Nonetheless, a recent meta-analysis of Zebra Mussel and Quagga Mussel impacts (Higgins and VanderZanden, 2010) indicates that mean effect sizes for many ecosystem parameters are significant across invaded ecosystems. Thus, while the magnitude of impacts is likely low in ecosystems with minimal calcium concentrations, at concentrations above these lower limits, significant ecosystem impacts are probable. Potential impacts on invertebrate and fish populations, water quality, animal and human health, and biodiversity (including unioid mussels and other species at risk) were considered.
Negative impacts on fish populations were considered moderate to high, with relatively low uncertainty (Table 3). The scientific literature suggests that the direction of the impact (i.e., positive or negative) on fishes is dependant on the resource pathway where fish obtain their prey. For fish species that capitalize on zoobenthos in littoral areas of lakes or rivers, fish abundance will generally increase due to an increased availability of food resources. For fish species that utilize zooplankton or deepwater zoobenthos, and are unable to efficiently switch to littoral zoobenthos, populations generally will decline. The magnitude of impacts appears to be largely dependant on the filtration capacity of the dreissenid mussel population, which is largely a function of dreissenid density and ecosystem size. Also, in general, ecosystem size is a general predictor of the magnitude of impacts with smaller

20
ecosystems such as rivers having larger impacts than larger ecosystems. However, in some cases where dreissenids negatively impact key dietary items such as Diporeia sp. (a deep water amphipod/scud), dramatic impacts on fish populations can occur even in large ecosystems such as the Laurentian Great Lakes. While Zebra Mussel, and to lesser extent Quagga Mussel, have dispersed widely through eastern North America, reports of fish populations crashing are rare. In contrast, reports indicate that littoral zone fishes such as Smallmouth Bass or Yellow Perch have benefited from dreissenid invasions, with increases in population size.
Based on literature accounts of dreissenid invasions elsewhere, impacts on the physio-chemical environment range from low to high with a very low level of uncertainty for most endpoints (Table 3). A large body of literature describes the physical fouling of hard surfaces including water intakes, propellers and ship hulls, docks and piers. This has implications both for the potential ecosystem extent of dreissenid populations but also serves as a reminder about potential secondary dispersal vectors. The physical fouling of industrial intakes and other surfaces has been widely reported in the peer-review literature. Further, in some locations dreissenid invasions have been associated with large blooms of filamentous algae that have clogged water intake screens of nuclear power facilities, requiring costly multi-day shutdowns. Anecdotal reports also have associated recent spates of avian botulism in the Laurentian Great Lakes with dreissenid mussels via toxin bioaccumulation from phytoplankton. Reports of this impact were widespread in the lower Great Lakes, but otherwise geographically restricted and limited temporally (i.e., did not occur in every year).
Since Zebra Mussel impacts were moderate to very high (Table 3) for several ecological endpoints, the impact to the environment was considered to be very high negative in all cases where invasion occurs. This risk category indicates that impacts associated with Zebra Mussel invasion are significant, with a widespread disruption to the factor in question that persists over time or is likely not reversible. The reversibility of Zebra Mussel impacts is not well understood within invaded habitats, however recent literature reports suggest that impacts do not subside within 10-20 years of invasion and potentially much longer (Higgins et al., 2011; Higgins in press). The uncertainty of the environmental impacts was considered to be very low (Table 3) given extensive peer reviewed information in the scientific literature (Table 9) on the impacts of this species.
STEP 3: RISK TO ENVIRONMENT: COMBINING THE PROBABILITY OF INVASION WITH THE
IMPACTS OF INVASION
To determine the potential risk to the environment, the probability of invasion was crossed with the impacts to the environment associated with an invasion using the heat matrix (Figure 9). For most of western Canada and Ontario, the risk posed by Zebra Mussel was determined to be high (Figure 17, Table 11). In contrast, very low calcium suitability in sub-drainages in northwestern and central Ontario, Quebec, and coastal British Columbia resulted in a low risk posed by Zebra Mussel in these sub-drainages (Figure 17, Table 11).

21
RISK ASSESSMENT FOR QUAGGA MUSSEL
(DREISSENA ROSTRIFORMIS BUGENSIS)
STEP 1: DETERMINING PROBABILITY OF INVASION
Probability of Survival (Habitat Suitability)
Calcium Suitability
Most sub-drainages in Manitoba, Saskatchewan, Alberta, eastern British Columbia, northern Ontario, and the Great Lakes basin have calcium concentrations that could easily support Quagga Mussel populations at high to very high levels (Figure 18). In contrast, most sub-drainages on the Canadian Shield through central and northwestern Ontario and Quebec have very low calcium concentrations as do sub-drainages along the west coast of British Columbia and in parts of northern Saskatchewan (Figure 18). In fact, these are considered below the threshold required for Quagga Mussel to survive in these sub-drainages but recall that localized conditions (not assessed here) could be more (or less) favorable. At the scale of the risk assessment conducted here there can be considerable intra-sub-drainage variability. To provide a measure of uncertainty in available calcium data, the percentage of data points that fall into each of the calcium tolerance bins is provided (Table 12). This variability is the greatest source of uncertainty when projecting calcium habitat suitability to the sub-drainage spatial scale used in this risk assessment.
Since Quagga Mussel are often found in deeper, colder waterbodies and thus a temperature correction was deemed unnecessary to determine the probability of survival (habitat suitability). Thus, the calcium concentrations represent the probability of survival in this risk assessment for Quagga Mussel.
Probability of Arrival
Propagule Pressure (Human Footprint Index)
Propagule pressure as determined using the Human Footprint Index is very high around the Great Lakes/St Lawrence River (Figure 13). This index is high through southern Manitoba and southern Saskatchewan extending into southern Alberta (Figure 13). Radiating out from these higher indexed areas are bands of sub-drainages with moderate to low Human Footprint Index values from British Columbia through to Quebec (Figure 13). The sub-drainages with the lowest Human Footprint Index values exist across northern Saskatchewan, northern Manitoba, and northwestern Ontario (Figure 13).
Although sub-drainages in British Columbia have a moderate to low level of propagule pressure as determined by the Human Footprint Index, in 2011 five dreissenid fouled boats were intercepted destined for British Columbia. Although it is unknown how many boats are destined for Canadian watersheds at any given time, this ancillary information suggests even sub-drainages classified as moderate to low have the potential to receive propagules and are potentially at risk.
Proximity to Invaded Habitats
Consistent with Quagga Mussel also being first introduced into the Great Lakes and spreading into adjacent watersheds (Figure 7) most infested watersheds are either around the Great Lakes or due to several long distance jump-dispersal events, located in the southwestern United States (Figure 19). This creates one ring of sub-drainages in northwestern Ontario and southern Manitoba that are in very close proximity to known Quagga Mussel populations and a second ring emanating from the

22
southwestern United States extending towards Canadian sub-drainages. Thus proximity is greatest along the Canada-United States border and diminishes for Canadian sub-drainages moving north.
Zebra Mussel and Quagga Mussel are among the few invaders that actively are tracked with location information maintained by the USGS so reported populations are considered up to date, at least for the United States. However, any jump dispersal event could result in mussels arriving at new locations and this could significantly alter the proximity to invaded habitats for Canadian freshwater sub-drainages. Should this occur the calculations would need to be updated.
Probability of Arrival
The probability of Quagga Mussel arrival was very high in southern Manitoba and the Great Lakes into southern Quebec (Figure 20). The probability of arrival of Quagga Mussel to the southern prairies and central Ontario and Quebec was high while the probability of arrival was moderate to low for most of the remaining sub-drainages with the exception of more northern locations where this probability was very low (Figure 20).
Probability of Invasion
Probability of invasion was calculated by combining the probability of survival and the probability of arrival. For Quagga Mussel, sub-drainages in the Great Lakes basin, southern Manitoba, southern Saskatchewan and extending into southern Alberta had a very high probability of invasion (Figure 21). Sub-drainages in eastern British Columbia, central and northwestern Alberta, central Saskatchewan and Manitoba, and parts of Ontario had a high probability of Quagga Mussel invasion (Figure 21). Northwestern British Columbia, northeastern Alberta, northern Manitoba and Ontario had sub-drainages with a moderate probability of invasion. Sub-drainages on the Canadian Shield in northwestern and central Ontario, Quebec, and coastal British Columbia have a very low probability of Quagga Mussel invasion determined primarily by a lack of calcium (Figure 21, Table 12).
STEP 2: DETERMINING THE IMPACTS OF INVASION
The scientific literature on Quagga Mussel indicates that direction (i.e., positive or negative) of ecological impacts is identical to those of the Zebra Mussel. Further, the magnitude of ecological impacts for Quagga Mussel is at least equal to and potentially higher than those of the Zebra Mussel. These higher impacts appear related to increased densities associated with the colonization of softer substrates and deeper depths. Since Zebra Mussel impacts were considered very highly negative whenever present, Quagga Mussel impacts were considered at the same level – very highly negative (Table 3) in all cases where population establishment occurs. This risk category indicates that impacts associated with Quagga Mussel invasion are significant, with a widespread disruption to the factor in question that persists over time or is likely not reversible. The reversibility of Quagga Mussel impacts is not well understood within invaded habitats, however, recent literature suggests that impacts do not subside within 10-20 years of invasion and potentially much longer (Higgins et al., 2011; Higgins in press). The uncertainty of the ecological impacts was considered to be very low (Table 3). This level of uncertainty indicates that there is extensive peer reviewed information in the scientific literature (Table 9) on the impacts of this species.

23
STEP 3: RISK TO ENVIRONMENT: COMBINING THE PROBABILITY OF INVASION WITH THE
IMPACTS OF INVASION
To determine the potential risk, the probability of invasion was crossed with the impacts to the environment using the heat matrix (Figure 9). For most of western Canada and Ontario the ecological risk posed by Quagga Mussel was determined to be high (Figure 22, Table 13). In contrast, very low calcium suitability in sub-drainages in northwestern and central Ontario, Quebec, and coastal British Columbia resulted in a low ecological risk posed by Quagga Mussel (Figure 22, Table 13).
RISK ASSESSMENT FOR DARK FALSEMUSSEL
(MYTILOPSIS LEUCOPHEATA)
STEP 1: DETERMINING THE PROBABILITY OF INVASION
Based on the salinity requirements of Dark Falsemussel (see Habitat Preferences above) the probability of invasion would be considered very low for each of the assessed freshwater sub-drainages. Thus, given the scope of this risk assessment – freshwater Canadian ecosystems – even if calcium and temperature requirements were met, conditions for reproduction and hence establishment, would not be met due to low salinity in most freshwater ecosystems. Verween et al. (2010) and Kennedy (2011) both suggest reproduction is not possible for M. leucopheata in freshwater. Thus, the probability of arrival was not explicitly calculated for each of the sub-drainages assessed. Similarly, potential spread of M. leucopheata was not determined due to a lack of suitable habitats within sub-drainages that could support establishment of Dark Falsemussel populations. It is important to note that this species likely could encounter suitable habitats in Canadian estuarine systems but this was beyond the scope of the risk assessment presented here.
STEP 2: DETERMINING THE IMPACTS OF INVASION
For Dark Falsemussel, as for other mollusc invaders, the potential impacts of an invasion are a function of population size. Again, based on salinity tolerances, it is unlikely that this species would reach invasion densities in any Canadian freshwater ecosystem. Hence, the impacts of a Dark Falsemussel invasion are low.
STEP 3: RISK TO ENVIRONMENT: COMBINING THE PROBABILITY OF INVASION WITH THE
IMPACTS OF INVASION
The ecological risk posed by a Dark Falsemussel invasion in any of the Canadian freshwater ecosystems considered here was determined using the heat matrix (Figure 9). Thus, the ecological risk posed by Dark Falsemussel on Canadian freshwater ecosystems is low. However, the risk posed to Canadian estuarine or marine systems could be substantially higher and an additional risk assessment for these waters would be required to determine the actual risk posed.
SUMMARY
The ecological risk posed to Canadian freshwater ecosystems by Zebra Mussel and Quagga Mussel was high for most watersheds assessed (Figures 17 and 22). Ecological risk was high for most watersheds across the western Canadian provinces and watersheds of Southern Ontario and Quebec

24
that are adjacent to the lower Great Lakes (Lakes Huron, Erie, and Ontario) or the St. Lawrence River. The remaining watersheds in Ontario and Quebec were generally considered at low risk from Zebra Mussel or Quagga Mussel due to unsuitable calcium concentrations. Similarly, watersheds along the southern coast of British Columbia, including Vancouver Island, were considered at low risk from both species again due to unsuitable calcium concentrations. The ecological risk posed by the Dark Falsemussel to freshwater drainages in Canada was considered low due to the high salinity requirements for reproduction of this species. However, it is important to note that the scope of this risk assessment did not include coastal estuarine ecosystems that have higher salinity levels and are potentially suitable for this species. A separate risk assessment on the susceptibility of estuarine habitats to the Dark Falsemussel, and associated ecological endpoints, would be required to evaluate the risk to these Canadian ecosystems.
The potential ecological impacts associated with Zebra Mussel and Quagga Mussel invasions, and their uncertainty, was assessed for a large number of ecological endpoints; including physical and chemical attributes of freshwater ecosystems, and biota within all major trophic levels. The level of ecological risk, and uncertainty, posed by Zebra Mussel or Quagga Mussel to these endpoints was not homogenous. At a broad level, the invasion of Zebra Mussel and Quagga Mussel is associated with a broad restructuring of energy flow through freshwater ecosystems, with often dramatic declines in the abundance (or biomass) of species associated with the pelagic energy pathway (e.g., phytoplankton, zooplankton, planktivorous fishes; Table 3), and a general increase in the abundance or biomass of organisms associated with benthic-littoral energy pathways (e.g., benthic algae, zoobenthos and fishes in shallow littoral areas). While increases in energy flow through benthic pathways may appear advantageous in that it may offset losses to energy flow through the pelagic energy pathway and provide food resources to fish capable of utilizing energy from either pathway, in some cases the increased energy flow though the benthic pathway has large negative consequences to numerous ecological endpoints. For example, in the lower Laurentian Great Lakes Zebra Mussel and Quagga Mussel increased benthic algal growth to severe nuisance levels, which subsequently increased bacterial counts (of indicator and pathogenic bacteria), and anoxia in nearshore waters. Second, we specifically note a significant risk to Canadian unionid mussels, several of which have been identified as Endangered by COSEWIC (Table 4). As a general rule, the establishment of dreissenids was associated with a 90% decline in unionid mussel abundance within 10 years, with concomitant losses of mussel diversity (e.g., COSEWIC, 2007). Further, the recovery plans for several of these species have identified the continued threat of Zebra/Quagga Mussel as a contributing factor limiting recovery.
Due to the large spatial scales associated with this risk assessment, we used Canadian sub-drainages (i.e., secondary watersheds), rather than individual lakes or rivers. Variability in habitat suitability within sub-drainages was expected, such that the suitability of each watershed to Zebra Mussel or Quagga Mussel invasion was determined using the 75
th percentile of calcium concentration data within the sub-
drainage. This approach was deemed acceptable since calcium concentrations within lakes and rivers are generally determined by surface geology that is generally consistent at the watershed scale. However, in some cases there was high variability in calcium concentrations between individual lakes or rivers within sub-drainages. Site-specific information for each watershed (e.g., Tables 10 and 12) is provided and could be used in conjunction with local knowledge to better understand the potential risk to individual lakes or rivers within a sub-drainage, particularly where calcium concentrations are variable but suitable, to inform potential management decisions.
While calcium concentrations in lakes and rivers generally are considered to be a prime determinant of habitat suitability for Zebra Mussel and Quagga Mussel; other environmental variables such as alkalinity, carbonate, chlorophyll a, conductivity/TDS, dissolved oxygen, nitrogen, pH, phosphorous, salinity, secchi depth, temperature, total hardness, and turbidity, also have been useful for improving predictions (see Mackie and Claudi, 2010). While such information likely has been collected for

25
freshwater systems across Canada by various agencies, it is not currently available and accessible at the large spatial scales used in this assessment. An accessible national water quality database, with geo-referenced data, would be useful for future risk assessments for dreissenids and other NIS. Site-specific or region-specific data for these additional variables would improve the accuracy of regional or local risk assessments and should be included where possible (see Mackie and Claudi, 2010). Also, given the documented propensity of dreissenid mussels to rapidly disperse naturally to downstream locations via their veliger stage and understanding of connectivity within sub-drainages would aid understanding potential invasion dynamics. Should large lakes or reservoirs become infested; the continued rain of propagules to downstream locations will pose an ongoing invasion risk.
In addition to data limitations related to environmental variables there are similar data limitations with respect to distributional information on NIS in Canada. Although Zebra Mussel and Quagga Mussel would be considered a high profile species around the Great Lakes where it has had an invasion presence for about 25 years and has been the focus of repeated outreach and education efforts in Canada and the United States, these mussels would have a lower profile in areas not yet invaded and could be overlooked upon initial arrival to novel locations. There is some monitoring and reporting for NIS in Canada. For example, in Ontario where a broad scale plan to survey freshwater lakes on a rotational basis for a variety of NIS exist (J. Brinsmead, ON Ministry of Natural Resources, pers. comm.) and Manitoba where targeted sampling occurs for priority NIS, vectors, and high risk habitats (J. Shead, Manitoba Conservation, pers. comm.). However, in general, NIS monitoring and reporting across Canada lacks standardization. A national approach including standardized monitoring and reporting would provide greater accessibility to NIS information for both researchers and managers and substantially increase our understanding of actual NIS distributions. This information would be invaluable for future risk assessments as it would provide not only positive findings for infested locations that could be updated on a routine basis it also would provide information where NIS have failed to reach (potentially providing clues to why habitats expected to be invaded are not, such as unsuitable calcium concentrations as noted above). In addition to monitoring for NIS, these programs could contribute to environmental data collection needs identified above.
The most important vector for the potential introduction of Zebra Mussel and/or Quagga Mussel to western Canada is the overland transport of recreational and commercial boats originating from invaded habitats in the United States or Ontario. For example, a commercial vessel originating from Lake Mead, Nevada destined for Saskatchewan (April 2012) and fouled with Quagga Mussels recently was intercepted (L. Dalton, Utah AIS Coordinator, pers. comm.). Surveillance programs in the United States identified the vessel and aquatic invasive species coordinators (or representatives) from each state and from Saskatchewan were alerted to the potential threat. The vessel was then quarantined and professionally decontaminated in Utah. Such rapid response powers, access to decontamination units, and inter-jurisdictional cooperation were highly useful in reducing, or in this case mitigating, the risk to Canadian freshwaters highlighting the need for early detection and rapid response plans (see Locke et al., 2011). Information on such incidents and on boater movements in general, would decrease the uncertainty associated with the „arrival‟ aspects identified in this risk assessment and could be used in future risk assessments. Also, this information could be used to focus limited resources to high risk vectors and/or locations. Unfortunately this situation is not unique as infested boats have been intercepted over multiple years in British Columbia (L.-M. Herborg, B.C. Ministry of the Environment, pers. comm.) and Manitoba (J. Shead, Manitoba Conservation, pers. comm.) and likely happens much more frequently than is observed. Thus, there is a need to increase rapid response capabilities; including access to decontamination units as such capabilities would assist in reducing the risk of initial invasion. These efforts could be supplemented with „slow the spread‟ campaigns if these species invaded western Canada to raise awareness among stakeholders and the public to help mitigate potential spread.

26
Commercial shipping was identified as the primary invasion vector responsible for delivering Zebra Mussel and Quagga Mussel to the Great Lakes (Hebert et al., 1989) and for delivering Dark Falsemussel to Europe (Kennedy, 2011). Although the scope of this risk assessment was on Canadian freshwater ecosystems with an emphasis on western Canada, the role of this vector should be assessed separately. Given the salinity tolerances of Zebra Mussel and Quagga Mussel they could be introduced to coastal locations outside the Great Lakes by this vector. Further, should Zebra Mussel or Quagga Mussel be introduced to coastal systems, especially along the west coast of North America, they easily could be transported to Canadian waters either in ballast tanks (similar to arrival to Great Lakes) or attached to the hull (ability to close valves in undesirable conditions). As noted with respect to proximity to invaded locations, a coastal introduction would provide a direct link to several sub-drainages in British Columbia, including those associated with the Port of Vancouver and the Fraser River. Further, Dark Falsemussel may have a greater propensity to utilize the commercial shipping vector over Zebra Mussel or Quagga Mussel since this vector was used to invade Europe (Kennedy, 2011).
CONCLUSIONS
1. The ecological risk posed by Zebra Mussel and Quagga Mussel was high for most of western Canada and sub-drainages around the Great Lakes/St Lawrence River; and low across most of eastern Ontario and Quebec due to low calcium concentrations on the Canadian Shield.
2. The ecological risk posed by Dark Falsemussel to all freshwater sub-drainages considered was low due to higher salinity requirements for reproduction by this species. A risk assessment for Mytilopsis leucopheata that includes coastal waters is required to fully address the potential risk posed by this species to Canadian ecosystems. As a brackish water species, the Dark Falsemussel is most likely to arrive and find suitable conditions in Canadian estuarine waters that were not assessed here.
3. The potential ecological impacts of a Zebra Mussel or Quagga Mussel invasion were evaluated for numerous endpoints (socio-economic indicators not considered here). At highest risk were species associated with pelagic zones of lakes or rivers (e.g., expected declines in productivity of phytoplankton, zooplankton, and planktivorous fishes), and for unionid mussels (severe losses to abundance and biodiversity expected).
4. The habitat suitability for Zebra Mussel and Quagga Mussel was determined at the sub-drainage (i.e., secondary watershed) scale based on calcium concentration (75
th percentile). It
is important to recognize that calcium concentrations of individual lakes or rivers within each watershed could make these specific systems more (or less) suitable than the 75
th percentile,
especially for sub-drainages where calcium concentrations are highly variable or where uncertainty was high due to a lower number of data points (e.g., sub-drainages with < 5 samples).
5. Natural dispersal by dreissenid mussels within connected waterways can not be ignored. If these mussels invade large lakes or reservoirs within sub-drainages, the potential risk to all connected downstream locations increases substantially. Further, should the distribution of Zebra Mussel or Quagga Mussel change, the risk assessment will need to be updated to reflect the change in proximity to invaded locations.
6. A Human Footprint Index was used as a proxy for propagule pressure. Since the overland transport of recreational boats has been identified as a critical arrival/dispersal vector for

27
dreissenid mussels, a better understanding of this vector specifically would lower uncertainty and provide information on the human-mediated connectedness of sub-drainages within Canada. Also, education and outreach (e.g., postings at boat launches, cleaning stations) and appropriate rapid response capabilities would further reduce the risk associated with this important vector.
7. A national database of geo-referenced water quality data for Canadian aquatic ecosystems (marine, estuarine, and freshwater) is much needed. Although there is published literature on the tolerances of dreissenid mussels to a variety of water quality parameters (e.g., temperature, turbidity, total phosphorus, chlorophyll a), there were insufficient data available and accessible for these variables at the spatial scales needed for modeling (i.e., at a national scale). Such a database would prove invaluable for determining the potential distribution of aquatic invasive species in Canada under current conditions and under future climate scenarios.
ACKNOWLEDGEMENTS
The authors wish to thank provincial contacts for providing much needed environmental data for British Columbia, Alberta, Saskatchewan, Manitoba, Ontario and Quebec. Dr. Leif-Matthias Herborg, Serge Proulx, and Gilles Fortin provided helpful guidance on ArcGIS and modeling methods. The workshop participants were an essential component of ensuring high quality scientific advice on these potential high risk invaders. DFO‟s Aquatic Invasive Species program and its Centre of Expertise for Aquatic Risk Assessment provided travel funds.
REFERENCES
Ackerman, J.D., Loewen, M.R., and Hamblin, P.F. 2001. Benthic-pelagic coupling over a Zebra Mussel
reef in western Lake Erie. Limnol. Oceanogr. 46:892-904.
Bacchetta, R., Mantecca, P. and Vailati, G. 2010. Reproductive behaviour of Zebra Mussels living in shallow and deep water in the South Alps lakes. In: Van der Velde, G., Rajagopal, S., Bij de Vaate, A. (eds) The Zebra Mussel in Europe, Backhuys Publishers, Leiden/Margraf Publishers, Weikersheim. pp. 161-168.
Baldwin B.S., Mayer M.S., Dayton J., Pau N., Mendilla J., Sullivan M., Moore A., Ma A., and Mills E.L. 2002. Comparative growth and feeding in Zebra and Quagga Mussels (Dreissena polymorpha and Dreissena bugensis): implications for North American lakes. Can. J. Fish. Aquat. Sci.
59:680-694.
Beekey, M.A., McCabe, D.J., and Marsden, J.E. 2004. Zebra Mussel colonisation of soft sediments
facilitates invertebrate communities. Freshw. Biol. 49:535-545.
Benson, A.J., Raikow, D., Larson, J., and Fusaro, A. 2012a. Dreissena polymorpha. USGS Nonindigenous Aquatic Species Database, Gainesville, FL. http://nas.er.usgs.gov/queries/FactSheet.aspx?speciesID=5 Revision Date: 2/15/2012 [Accessed January 15, 2012]
Benson, A.J., Richerson, M.M., Maynard, E., Larson, J., and Fusaro, A. 2012b. Dreissena bugensis. USGS Nonindigenous Aquatic Species Database, Gainesville, FL. http://nas.er.usgs.gov/queries/FactSheet.aspx?speciesID=95 Revision Date: 2/14/2012 [accessed January 15
th 2012]

28
Berg, D.J., Fisher, S.W., and Landrum, P.F. 1996. Clearance and processing of algal particles by
Zebra Mussels (Dreissena polymorpha). J. Great Lakes Res. 22:779-788.
Bially, A., and MacIsaac, H.J. 2000. Fouling mussels (Dreissena spp.) colonize soft sediments in Lake
Erie and facilitate benthic invertebrates. Freshw. Biol. 43:85-97.
Bij de Vaate, A. 1991. Distribution and aspects of population dynamics of the Zebra Mussel, Dreissena
polymorpha (Pallas, 1771), in the Lake Usselmeer area (The Netherlands). Oecologia 86:40-50.
Binimelis, R., Born, W., Monterroso, I., and Rodríguez-Labajos, B. 2007. Socio-economic impact and assessment of biological invasions. In: Nentwig W (ed) Biological Invasions. Ecological Studies 193. Springer-Verlag, Berlin, pp. 331-347.
Brown, J.E., and Stepien, C.A. 2010. Population genetic history of the dreissenid mussel invasions:
expansion patterns across North America. Biol. Invasions 12:3687-3710.
Bunt, C.M., MacIssac, H.J., and Sprules, W.G. 1993. Pumping rates and projected filtering impacts of juvenile Zebra Mussels (Dreissena polymorpha) in western Lake Erie. Can. J. Fish Aquat. Sci.
50:1017-1022.
Canadian Council of Fisheries and Aquaculture Ministers Aquatic Invasive Task Group. 2004. A Canadian Action Plan to Address the Threat of Aquatic Invasive Species. September, 2004. [www.dfo-mpo.gc.ca/Science/enviro/ais-eae/plan/plan-eng.pdf]
Claxton, W.T., and Mackie, G.L. 1998. Seasonal and depth variations in gametogenesis and spawning
of Dreissena polymorpha and Dreissena bugensis in eastern Lake Erie. Can. J. Zool. 76:2010-2019.
Claxton, W.T., Wilson, A.B., Mackie, G.L., and Boulding, E.G. 1998. A genetic and morphological comparison of shallow- and deep-water populations of introduced dreissenid bivalve Dreissena
bugensis. Can. J. Zool. 76:1269-1276.
Cohen, A.N. 2007. Potential Distribution of Zebra Mussels (Dreissena polymorpha) and Quagga Mussels (Dreissena bugensis) in California Phase 1 Report. A Report for the California Department of Fish and Game, 29 pp.
Cohen, A.N., and Weinstein, A. 2001. Zebra Mussel‟s Calcium Threshold and Implications for its Potential Distribution in North America. Richmond, CA: San Francisco Estuary Institute. http://www.sfei.org/sites/default/files/2001-Zebramusselcalcium356.pdf [Accessed January 13, 2012].
Conrad, T.A. 1831. Description of fifteen new species of Recent, and three of fossil shells, chiefly from
the coast of the United States. J. Acad. Nat. Sci. Philad. 6:256-268.
COSEWIC. 2007. COSEWIC assessment and status report on the Eastern Pondmussel Ligumia nasuta in Canada. Committee on the Status of Endangered Wildlife in Canada. Ottawa. vi+34 pp.
COSEWIC. 2011. Canadian Wildlife Species at Risk. Committee on the Status of Endangered Wildlife in Canada.
Cotner, J.B, Gardner, W.S., Johnson, J.R., Sada, R.H., Cavaletto, J.F., and Heath, R.T. 1995. Effects of Zebra Mussels (Dreissena polymorpha) on bacterioplankton: evidence for both size-selective
consumption and growth stimulation. J. Great Lakes Res. 21:517-528.
Denson, D.R., and Wang, S.Y. 1998. Distinguishing the dark false mussel, Mytilopsis leucophaeata (Conrad, 1831), from the non-indigenous Zebra and Quagga Mussels, Dreissena spp., using
spermatozoan external morphology. Veliger 41:205-207.

29
Dermott, R.M., and Munawar, M. 1993. Invasion of Lake Erie offshore sediments by Dreissena, and its
ecological implications. Can. J. Fish Aquat. Sci. 50:2298-2304.
Dermott, R., Bonnell, R., Carou, S., Dow, J. and Jarvis, P. 2003. Spatial distribution and population structure of the mussels Dreissena polymorpha and Dreissena bugensis in the Bay of Quinte
Lake Ontario, 1998 and 2000. Can. Tech. Rep. Fish. Aquat. Sci. 2479:58 pp.
Dextrase, A., and Mandrak, N.E. 2006. Impacts of invasive alien species on freshwater fauna at risk in
Canada. Biol Invasions 8: 13-24.
Diggins, T.P., Weimer, M., Stewart, K.M., Baier, R.E., Meyer, A.E., Forsberg, R.F., and Goehle, M.A. 2004. Epiphytic refugium: are two species of invading freshwater bivalves partitioning spatial
resources? Biol. Invasions 6:83-88.
Drake, J.M, and, Bossenboek, J.M. 2004. The potential distribution of Zebra Mussels in the United
States. BioScience 54:931-941.
Effler, S.W., and Siegfried., C. 1994. Zebra Mussel (Dreissena polymorpha) populations in the Seneca
River, New York: impact on oxygen resources. Environ. Sci. Tech. 28:2216-2221.
Ficetola, G.F., Thuiller, W., and Miaud, C. 2007. Prediction and validation of the potential global distribution of a problematic alien invasive species-the American bullfrog. Diversity Distrib.
13:476-485.
French, J.R.P., and Bur, M.T. 1996. The effect of Zebra Mussel consumption on growth of freshwater
drum in Lake Erie. J. Freshwat. Ecol. 11:283-289.
Frischer, M.E., Nierzwicki-Bauer, S.A., Parsons, R.H., Vathanodorn, K., and Waitkus, K.R. 2000. Interactions between Zebra Mussels (Dreissena polymorpha) and microbial communities. Can. J.
Fish. Aquat. Sci. 57:591-599.
Garton, D.W., Payne, C.D., and Montoya, J.P. 2005. Flexible diet and trophic position of dreissenid mussels as inferred from stable isotopes of carbon and nitrogen. Can. J. Fish. Aquat. Sci.
62:1119-1129.
Gillis, P.L., and Mackie, G.L. 1994. Impact of the Zebra Mussel, Dreissna polymorpha, on populations
of Unionidae (Bivalvia) in Lake St. Clair. Can. J. Zoo. 72:1260-1271.
Hebert, P.D., Muncaster, B.W., and Mackie, G.L. 1989. Ecological and genetic studies on Dreissena
polymorpha (Pallas): a new mollusc in the Great Lakes. Can. J. Fish. Aquat. Sci. 46:1587-1591.
Hecky, R.E., Smith, R.E.H., Barton, D.R., Guildford, S.J., Taylor, W.D., Charlton, M.N., and Howell, T. 2004. The nearshore phosphorus shunt: a consequence of ecosystem engineering by
dreissenids in the Laurentian Great Lakes. Can. J. Fish. Aquat. Sci. 61:1285-1293.
Higgins, S.N., and VanderZander, M.J. 2010. What a difference a species makes: a meta analysis of
dreissenid mussel impacts on freshwater ecosystems. Ecol. Monogr. 80:179-196.
Hincks, S.S., and Mackie, G.L. 1997. Effects of pH, calcium, alkalinity, hardness, and chlorophyll on the survival, growth, and reproductive success of Zebra Mussel (Dreissena polymorpha) in
Ontario lakes. Can. J. Fish Aquat. Sci. 54:2049-2057.
Hinkley, A.A. 1907. Shells collected in northeastern Mexico. Nautilus 21:68-72.
Hoyle, J.A., Bowlby, J.N., and Morrison, B.J. 2008. Lake whitefish and walleye population responses to
dreissenid mussel invasion in eastern Lake Ontario. Aquat. Ecosyst. Health Manage. 11:403-411.
Imo, M., Seitz, A., and Johannesen, J. 2010. Distribution and invasion genetics of the Quagga Mussel
(Dreissena rostriformis bugensis) in German rivers. Aquat. Ecol. 44:731-740.

30
ISSG. 2012a. Dreissena polymorpha (mollusk): Distribution. Global Invasive Species Database. Website: http://www.issg.org/database/species/distribution.asp?si=50&fr=1&sts=sss&lang=EN [Accessed January 16, 2012]
ISSG. 2012b. Dreissena bugensis (mollusk): Distribution. Global Invasive Species Database. Website: http://www.issg.org/database/species/distribution.asp?si=918&fr=1&sts=&lang=EN [Accessed January 16, 2012]
ISSG. 2012c. Mytilopsis Leucophaeata (mollusk): Distribution. Global Invasive Species Database. Website: http://www.issg.org/database/species/distribution.asp?si=707&fr=1&sts=&lang=EN [Accessed January 16, 2012]
Jantz, D. and Neumann, D. 1998. Growth and reproductive cycle of the Zebra Mussel in the River
Rhine as studied in a river bypass. Oecologia 114:213-225.
Johnson, L.E. and Carlton, J.T. 1996. Post-establishment spread in largescale invasions: Dispersal
mechanisms of the Zebra Mussel Dreissena polymorpha. Ecology 77:1686-1690.
Johnson, L.E. and Padilla, D.K. 1996. Geographic spread of exotic species: ecological lessons and
opportunities from the invasion of the Zebra Mussel Dreissena polymorpha. Biol. Conserv. 78:23-33.
Kennedy, V.S. 2011a. The invasive Dark Falsemussel Mytilopsis leucophaeata (Bivalvia:
Dreissenidae): a literature review. Aquat. Ecol. 45:163-183.
Kennedy, V.S. 2011b. Biology of the uncommon dreissenid bivalve Mytilopsis leucophaeata (Conrad,
1831) in central Chesapeake Bay. J. Mollus. Stud. 77:154-164.
Knoll, L.B., Sarnelle, O., Hamilton, S.K., Kissman, C.E.H., Wilson, A.E., Rose, J.B., and Morgan, M.R. 2008. Invasive zebra mussels (Dreissna polymorpha) increase cyanobacterial toxin
concentrations in low-nutrient lakes. Can. J. Fish. Aquat. Sci. 65: 448-455.
Kobak, J. 2001. Light, gravity and conspecifics as cues to site selection and attachment behaviour of
juvenile and adult Dreissena polymorpha Pallas, 1771. J. Molluscan Stud. 67:183-189.
Koch, L.M. 1989. Mytilopsis leucophaeta (Conrad, 1831) from the upper Mississippi River (Bivalvia:
Dreissenidae). Malacol. Data Net. 2:153-154.
Laine, A.O., Mattila, J., and Lehikoinen, A. 2006. First record of the brackish water dreissenid bivalve
Mytilopsis leucophaeta in the northern Baltic Sea. Aquat. Invasions 1:38-41.
Leung, B., Drake, J.M., and Lodge, D.M. 2004. Predicting invasions: propagule pressure and the
gravity of allee effects. Ecology 85:1651-1660.
Levings, C., Kieser, D. Jamieson, G.S., and Dudas, S. 2002. Marine and estuarine alien species in the Strait of Georgia, British Columbia. Alien invaders in Canada‟s waters, wetlands, and forests. Natural Resources Canada, pp. 111-131.
Liu, X., Guo, Z., Wang, S., and Li, Y. 2011. Increasing potential risk of a global aquatic invader in
Europe in contrast to other continents under future climate change. PLoS ONE 6:1-11.
Locke, A., Mandrak, N.E., and Therriault, T.W. 2011. A Canadian Rapid Response Framework for Aquatic Invasive Species. DFO Can. Sci. Advis. Sec. Res. Doc. 2010/114. vi + 30 p.
Ludyanskiy, M.L., McDonald, D., and Macneill, D. 1993. Impact of the Zebra Mussel, a bivalve invader - Dreissena polymorpha is rapidly colonizing hard surfaces throughout waterways of the United
States and Canada. BioScience 43:533-544.

31
MacIsaac, H.J. Lonnee, C.J. and Leach, J.H. 1995. Suppression of microzooplankton by Zebra
Mussels: importance of mussel size. Freshw. Biol. 34:379-387.
Mackie, G.L., and Claudi, R. 2010. Monitoring and control of macrofouling molluscs in fresh water systems. 2
nd Ed. CRC Press, New York. 508 p.
Mackie, G.L., and Schlosser, D.W. 1996. Comparative biology of Zebra Mussels in Europe and North
America: an overview, Am. Zool. 36:244-258.
Mantecca, P., Vailati, G., Garibaldi, L., and Bacchetta, R. 2003. Depth effects on Zebra Mussels
reproduction. Malacologia 45:109-120.
Marelli, D.C., and Gray, S. 1983. Conchological redescription of Mytilopsis sallei and Mytilopsis
leucophaeta of the brackish Western Atlantic (Bivalvia: Dreissenidae). Veliger 25:185-193.
Marsden, J.E., Spidle, A.P., and May, B. 1995. Genetic similarity among Zebra Mussel populations
within North America and Europe. Can. J. Fish. Aquat. Sci. 52:836-847.
Marsden, J.E., Spidle, A.P., and May, B. 1996. Review of genetic studies of Dreissena spp. Am. Zool.
36:259-270.
Martel, A.L., Baldwin, B.S., Dermott, R.M., and Lutz, R.A. 2001. Species and epilimnion/hypolimnion-related differences in size at larval settlement and metamorphosis in Dreissena (Bivalvia). Limnol.
Oceangr. 46:707-713.
McMahon, R.F. 1996. The physiological ecology of the Zebra Mussel, Dreissena polymorpha, in North
America and Europe. Am. Zool. 36:339-363.
McMahon, R.F. 2002. Evolutionary and physiological adaptations of aquatic invasive animals: r-
selection versus resistance. Can. J. Fish. Aquat. Sci. 59:1235 -1244.
Menzie, C.A. 1980. The chironomid (Insecta: Diptera) and other fauna of a Myriophyllum spicatum L.
plant bed in the lower Hudson River. Estuaries 3:38-54.
Mills, E., Casselman, J.M., Dermott, R. Fitzsimmons, J.D., Gal, T., Holeck, K.T., Hoyle, J.A., Johannssson, O.E., Lantry, B.F., Makarewicz, J.C., Millard, E.S., Munawar, I.F., Munawar, M., O‟Gorman,R., Owens, R.W., Rudstam, L.G., Schaner, T., and Stewart, T.J. 2003. Lake Ontario:
food web dynamics in a changing ecosystem (1970-2000). Can. J. Fish. Aquat. Sci. 60:471-490.
Mills, E.L., Dermott, R.M., Roseman, E.F., Dustin, D., Mellina, E., Conn, D.B., and Spidle, A.P. 1993. Colonization, ecology, and population structure of the “Quagga” mussel, (Bivalvia:Dreissenidae)
in the lower Great Lakes. Can. J. Fish. Aquat. Sci. 50:2305-2314.
Mills, E.L., Rosenberg, G., Spidle, A.P., Ludyanskiy, M. Pligin, Y., and May, B. 1996. A review of the biology and ecology of the Quagga Mussel (Dreissena bugensis), a second species of freshwater
Dreissenid introduced to North America. Am. Zool. 36:271-286.
Molloy, D.P., A.Y. Karataev, L.E. Burlakova, D.P. Kurandina, and F. Laruelle. 1997. Natural enemies
of Zebra Mussels: predators, parasidtes, and ecological competitors. Rev. Fish. Sci. 5:27-97.
Moore, S.G., O‟Neill, C.R. Jr., and MacNeill, D.B. 1991. Ecological perspectives on functional morphologies of Dreissena polymorpha and Mytilopsis leucophaeta. Dreissena polymorpha. Info.
Rev. 2:2-3.
Nichols, S.J., and Black, M.G. 1994. Identification of larvae: the Zebra Mussel (Dreissena polymorpha), Quagga Mussel (Dreissena rosteriformis bugensis), and Asian clam (Corbicula fluminea). Can. J.
Zool. 72:406-417.

32
Odum, W.E., and Heald, E.J. 1972. Trophic analyses of an estuarine mangrove community. Bull. Mar.
Sci. 22:671-738.
Orlova, M., S. Golubkov, L. Kalinina, and N. Ignatieva. 2004. Dreissena polymorpha (Bivalvia: Dreissenidae) in the Neva Estuary (eastern Gulf of Finland, Baltic Sea): Is it a biofilter or source
for pollution? Mar. Pollut. Bull. 49:196-205.
Orlova, M.I., Therriault, T.W., Antonov, P.I. and Shcherbina, G.K. 2005. Invasion ecology of Quagga Mussels (Dreissena rostriformis bugensis): a review of evolutionary and phylogenetic impacts.
Aquat. Ecol. 39:401-418.
Pathy, D.A., and Mackie, G.L. 1993. Comparitive shell morphology of Dreissena polymosrpha, Mytilopsis leucophaeata, and the „Quagga‟ mussel (Bivalvia:Dressenidae) in North America. Can.
J. Zool. 71:1012-1023.
Patterson, M.W.R., Ciborowski, J.J.H., and Barton, D.R. 2005. The distribution and abundance of
Dreissena species (Dreissenidae) in Lake Erie, 2002. J. Great Lakes Res. 31:223-237.
Pelder, D. 1994. Distinguishing the Zebra Mussel, Quagga Mussel, and Conrad‟s False Mussel Based on Shell Morphology. Technical Note ZMR-1-24. US Army Engineers Waterways Experiment Station.
Peyer, S.M., Hermanson, J.C. and Lee, C.E. 2010. Developmental plasticity of shell morphology in Quagga Mussels from shallow and deep-water habitats in the Great Lakes. J. Exp. Biol.
213:2602-2609.
Peyer, S.M., Hermanson, J.C. and Lee, C.E. 2011. Effects of shell morphology on mechanics of Zebra
and Quagga Mussel locomotion. J. Exp. Biol. 214:2226-2236.
Pollux, B.J.A., Van der Velde and G., Bij de Vaate, A. 2010. A perspective on global spread of Dreissena polymorpha: a review on possibilities and limitations. In: Van der Velde, G., Rajagopal, S., Bij de Vaate, A. (eds). The Zebra Mussel in Europe. Backhuys Publishers, Leiden/Margraf Publishers, Weikersheim, pp: 45 - 58
Pothoven, S.A., and Madenjian, C.P. 2008. Changes in consumption by alewives and lake whitefish
after dreissenid mussel invasions in Lakes Michigan and Huron. NA J. Fish. Manag. 28:308-320.
Raikow, D.F., Sarnelle, O., Wilson, A.E., and Hamilton, S.K. 2004. Dominance of the noxious cyanobacterium Microcystis aeruginosa in low-nutrient lakes is associated with exotic zebra
mussels. Limnol. Oceanogr. 49:482-487.
Rajagopal, S., Van der Gaag, M., Van der Velde, G., and Jenner, H.A. 2002. Control of brackish water fouling mussel, Mytilopsis leucophaeta (Conrad), with sodium hypochlorite. Arch. Environ.
Contam. Toxicol. 43:296-300.
Rajagopal, S., Van der Gaag, M., Van der Velde, G., and Jenner, H.A. 2005. Upper temperature tolerances of exotic brackishwater mussel, Mytilopsis leucophaeta (Conrad): an experimental
study. Mar. Envir. Res. 60:512-530.
Ram, J.L., Fong, P.P., and Garton, D.W. 1996. Physiological aspects of Zebra Mussel reproduction:
Maturation, spawning and fertilization. Am. Zool. 36:326-338.
Rennie, M.D., Sprules, W.G., and Johnson, T.B. 2009. Resource switching in fish following a major
food web disruption. Oecologia 159:789-802.
Ribi, G. 1986. Within-lake dispersal of the prosobranch snails, Viviparus ater and Potamopyrgus
jenkinsi. Oecologia 69:60-63.

33
Ricciardi, A. 2006. Patterns of invasion in the Laurentian great lakes in relation to changes in vector
activity. Divers. Distrib. 12:425-433.
Ricciardi, A. and MacIssac, H.J. 2000. Recent mass invasions of the North American Great Lakes by
Ponto-Caspian species. TREE 15:62-65.
Ricciardi, A., Serrouya, R., and Whoriskey, F.G. 1995. Aerial exposure tolerance of Zebra and Quagga Mussels (Bivalvia, Dreissenidae) -- implications for overland dispersal. Can. J. Fish. Aquat. Sci.
52:470-477.
Ricciardi, A., F.G. Whoriskey, and J.B. Rasmussen. 1997. The role of the Zebra Mussel (Dreissena polymorpha) in structuring macroinvertebrate communities on hard substrata. Can. J. Fish.
Aquat. Sci. 54: 2596-2608.
Roditi, H.A., Caraco, N.F., Cole, J.J. and Strayer, D.L. 2000. Uptake of dissolved organic carbon and
trace elements by Zebra Mussels. Nature 407:78-80.
Roe, S.L. and MacIssac, H.J. 1997. Deepwater population structure and reproductive state of Quagga
Mussels (Dreissena bugensis) in Lake Erie. Can. J. Fish. Aquat. Sci. 54:2428-2433.
Rosenberg, G., and Huber, M. 2011a. Dreissena bugensis Andrusov, 1897. Accessed through: World Register of Marine Species at: http://www.marinespecies.org/aphia.php?p=taxdetails&id=505319 [Accessed March 6, 2012]
Rosenberg, G., and Huber, M. 2011b. Dreissena polymorpha (Pallas, 1771). Accessed through: World Register of Marine Species at: http://www.marinespecies.org/aphia.php?p=taxdetails&id=181566 [Accessed March 6, 2012]
Rosenberg, G., and Ludyankskiy, M.L. 1994. A nomenclature review of Dreissena (Bivalvia: Dreissenidae) with Identification of the Quagga Mussel as Dreissena bugensis. Can. J. Fish
Aquat. Sci. 51:1474-1484.
Sala, O.E. Chapin, F.S., Armesto, J.J., Berlow, E., Bloomfield, J., Dirzo, R. Huber-Sanwald, E., Huenneke, L.F., Jackson, R.B., Kinzig, A., Leemans, R. Lodge, D.M., Mooney, H.A., Oesterheld, M., Poff, N.L., Sykes, M.T., Walker, B.H., Walker, M., and Wall, D.H. 2000. Biodiversity - Global
biodiversity scenarios for the year 2100. Science 287:1770-1774.
Sanderson, E.W., Jaiteh, M., Levy, M.A., Redford, K.H., Wannebo, A.V., and Woolmer, G. 2002. The
Human Footprint and the Last of the Wild. BioScience 52:891-904.
Schloesser, D.W., Kovalak, W.P., Longton, G.D., Ohnesorg, K.L., and Smithee, R.D. 1998. Impact of Zebra and Quagga Mussels (Dreissena spp.) on freshwater unionids (Bivalvia: Unionidae) in the
Detriot River of the Great Lakes. Am. Midl. Nat. 140:299-313.
Schneider, D.W., Stoeckel, J.A., Rehmann, C.R., Blodgett, K.D., Sparks, R.E., and Padilla, D.K. 2003. A developmental bottleneck in dispersing larvae: implications for spatial population dynamics.
Ecol. Lett. 6:352-360.
Siddall, S.E. 1980. Early development of Mytilopsis leucophaeta (Bivalvia: Dreissenacea). Veliger
22:378-379.
Silverman, H., Lynn, J.W., Archberger, E.C., Dietz, T.H. 1996. Gill structure in Zebra Mussels:
Bacterial-sized particle filtration. Am. Zool. 36:364-372.
Spidle, A.P., Mills, E.L., and May, B. 1995. Limits to tolerance of temperature and salinity in the Quagga Mussel (Dreissena bugensis) and the Zebra Mussel (Dreissena polymorpha). Can. J.
Fish. Aquat. Sci. 52:2108-2119.

34
Sprung, M. 1987. Ecological requirements of developing Dreissena polymorpha eggs. Arch. Hydrobiol.
Suppl. 79:69-86.
Sprung, M. 1989. Field and laboratory observations of Dreissena polymorpha larvae: abundance,
growth, mortality, and food demands. Arch. Hydrobiol. 115:537-561.
Sprung, M. 1993. The other life: an account of present knowledge of the larval phase of Dreissena polymorpha. In: Nalepa, T.F., Scholesser, D.W. (eds) Zebra Mussels: Biology, impacts, and control. Lewis Publishers, CRC Press, Boca Raton, FLA, pp. 39-53.
Sprung, M., and Rose, U. 1988, Influence of food size and food quality on the feeding of the mussel
Dreissena polymorpha. Oecologia 77:526-532.
Stańczykowska, A. 1977. Ecology of Dreissena polymorpha (Pall) (Bivalvia) in lakes. Pol. Arch.
Hydrobiol. 24:461-530.
Stoeckel, J.A., Schneider, D.W., Soeken, L.A., Blodgett, K.D and Sparks, R.E. 1997. Larval dynamics of a riverine metapopulation: implications for Zebra Mussel recruitment, dispersal, and control in
a large-river system. J. NA Benthol. Soc. 16:586-601.
Stoeckmann, A. 2003. Physiological energetics of Lake Erie dreissenid mussels: a basis for the
displacement of Dreissena polymorpha by Dreissena bugensis. Can. J. Fish. Aquat. Sci. 60:126-134.
Strayer, D.L., Hattala, K.A., and Kahnle, A.W. 2004. Effects of an invasive bivalve (Dreissena
polymorpha) on fish in the Hudson River estuary. Can. J. Fish. Aquat. Sci. 61:924-941.
Therriault, T.W., Docker, M.F., Orlova, M.I., Heath, D.D, and MacIsaac, H.J. 2004. Molecular resolution of the family Dreissenidae (Mollusca: Bivalvia) with emphasis on Ponto-Caspian species, including first report of Mytilopsis leucophaeata in the Black Sea basin. Mol. Phylogen. Evol.
30:479-489.
Therriault, T.W., Orlova, M.I., Docker, M.F., MacIsaac, H.J., and Heath, D.D. 2005. Invasion genetics of a freshwater mussel (Dreissena rostriformis bugensis) in Eastern Europe: high gene flow and
multiple introductions. Heredity 95:16-23.
Therriault, T. W., and Herborg, L-M. 2008. A qualitative biological risk assessment for vase tunicate
Ciona intestinalis in Canadian waters: using expert knowledge. ICES J. Mar. Sci. 65:781-787.
Therriault, T.W., and Orlova, M.I. 2010. Invasion success within the family Dreissenidae: prerequisites, mechanisms, and perspectives. In: Van der Velde, G., Rajagopal, S., Bij de Vaate, A. 2010. (eds). The Zebra Mussel in Europe. Backhuys Publishers, Leiden/Margraf Publishers, Weikersheim. pp. 59-68.
Thorp, J.H., and Casper, A.F. 2003. Importance of biotic interactions in large rivers: An experiment with planktivorous fish, dreissenid mussels and zooplankton in the St. Lawrence River. Riv. Res. Appl.
19:265-279.
Van der Velde, G., and Platvoet, D. 2007. Quagga Mussels Dreissena rostriformis bugensis (Andrusov,
1897) in the Main River (Germany). Aquat. Invasions 2:261-264.
Van der Velde, G., Rajagopal and S., Bij de Vaate, A. 2010. (eds). The Zebra Mussel in Europe. Backhuys Publishers, Leiden/Margraf Publishers, Weikersheim.
Verween, A., Vincx, M., Mees, J., and Degraer, S. 2005. Seasonal variability of Mytilopsis leucophaeta larvae in the harbour of Antwerp: implications for ecologically and economically sound biofouling
control. Belg. J. Zool. 135:91-93.

35
Verween, A., Vincx, M., and Degraer, S. 2010. Mytilopsis leucophaeata: The brackish water equivalent of Dreissena polymorpha? A review. In: Van der Velde, G., Rajagopal, S., Bij de Vaate, A. (eds). The Zebra Mussel in Europe. Backhuys Publishers, Leiden/Margraf Publishers, Weikersheim. pp. 29-44.
Voroshilova, I.S., Artamonova, V.S., Makhrov, A.A., and Slyn‟ko, Y.V. 2010. Natural Hybridization of Two Mussel Species Dreissena polymorpha (Pallas, 1771) and Dreissena bugensis (Andrusov,
1897). Biol. Bull. 37:542–547.
Wacker, A., and Von Elert, E. 2003. Settlement pattern of the Zebra Mussel, Dreissena polymorpha, as
a function of depth in Lake Constance. Arch. Hydrobiol. 158:289-301.
Walton, W.C. 1996. Occurrence of Zebra Mussel (Dreissena polymorpha) in the oligohaline Hudson
River, New York. Estuaries 19:612-618.
Whittier, T.R., Ringold, R.L., Herlihy, A.T., and Pierson, S.M. 2008. A calcium-based invasion risk
assessment for Zebra and Quagga Mussels (Dreissena spp). Front. Ecol. Environ. 6:180-184.
Wilson, A.B., Boulding, E.G., and Naish, K.A. 1999. Characterization of tri- and tetranucleotide
microsatellite loci in the invasive mollusc Dreissena bugensis. Mol. Ecol. 8:692-693.
Wolff, W.J. 1969. The mollusca of the estuarine region of the rivers Rhine, Meuse and Scheldt in
relation to the hydrography of the area. II. The Dreissenidae. Basteria 33:93–103
Wong, W.H., Levinton, J.S., Twining, B.S., and Fisher, N.S. 2003. Assimilation of micro-and mesozooplankton by Zebra Mussels: A demonstration of the food web link between zooplankton
and benthic suspension feeders. Limnol. Oceanogr. 48:308-312.
Zhu, B., Fitzgerald, D.G., Mayer, C.M., Rudstam, L.G., and Mills, E.L. 2006. Alteration of ecosystem function by Zebra Mussels in Oneida Lake: impacts on submerged macrophytes. Ecosystems
9:1017-1028.

36
TABLES
Table 1. Calcium suitability for Zebra Mussel (Dreissena polymorpha) and Quagga Mussel (Dreissena rostriformis bugensis) based on literature accounts (Cohen and Weinstein, 2001; Cohen et al., 2001; Cohen, 2007; Mackie and Claudi, 2010; Whittier et al., 2008; Benson et al., 2012a; 2012b).
Category Definition Zebra Mussel
Ca (mg/L)
Quagga Mussel
Ca (mg/L)
Very Low No adult survival < 12 < 12
Moderate Evidence that both adult survival AND reproduction are supported at a minimum level
12 -19 N/A
High Evidence that good sized populations are supported in terms of both survival and reproduction
20 - 25 12 – 32
Very High Very close to or at optimal range for all stages of the mussel life history; usually supports high to very high level of infestation
> 25 > 32
Table 2. Location and earliest known date of world-wide introductions, in chronological order, of the Zebra Mussel, Dreissena polymorpha.
Location Date Established Reference Russia 1769 Y Ludyanskiy et al. 1993 Caspian Sea 1771 Y Ludyanskiy et al. 1993 Hungary 1794 Y Minchin et al. 2002 Lithuania 1803 Y Lithuanian Invasive Species Database 2005 England (London) 1824 Y Kerney and Morton 1970 Netherlands 1826 Y Kerney and Morton 1970 Germany 1830 Y Kerney and Morton 1970 Scotland (Edinburgh) 1834 Y Kerney and Morton 1970 Belgium 1835 Y Belgian Biodiversity Platform 2005 France 1835 Y Kinzelbach 1992 Denmark 1840 Y Kerney and Morton 1970 Estonia 1840 Y Minchin et al. 2002 Switzerland 1860s Y Jantz and Schöll 1998 Sweden 1924 Y Danish Forest and Nature Agency 2005 Scandinavia 1940s Y Ludyanskiy et al. 1993 Italy 1969 Y Annoni et al. 1978 Yugoslavia 1970s Y Ludyanskiy et al. 1993 Baltic Sea 1980s Y Orlova et al. 2000 Canada (ON) 1986 Y Carlton 2008 United States 1986 Y Carlton 2008 Latvia 1996 Y Minchin et al. 2002 Ireland 1997 Y McCarthy et al. 1997 Spain 2001 Y Araujo and Álvarez Halcón 2001

37
Table 3. Ecological impacts associated with Zebra Mussel and Quagga Mussel invasions as reported in the scientific literature (modified from Higgins and VanderZanden, 2010).
Element Survey/Literature Results
Direction Magnitude Uncertainty
Physical habitat Water clarity Increase High Very Low Thermocline depth Increase Low High Littoral zone depth Increase Moderate Low Hard substrate fouling Increase High Very Low Soft substrate fouling Increase Moderate Very Low Deepwater anoxia Increase Low Very High Sediment anoxia Increase Moderate High
Chemical habitat Particulate nutrients Decrease Moderate Very Low Soluble nutrients (Lakes) Increase Low Very Low Soluble nutrients (Rivers) Increase High Very Low Suspended sediments Decrease High Very Low
Biota Sediment bacteria Increase High Very Low Phytoplankton (total) Decrease High Very Low Phytoplankton (toxin producing cyanobacteria)
Increase Moderate Very Low
Periphyton Increase High Very Low Macrophyte cover Increase Moderate Very Low Zooplankton Decrease Moderate Very Low Zoobenthos (littoral) Increase High Very Low Zoobenthos (profundal) Decrease Moderate Very Low Unionid mussel (abundance) Decrease Very high Very Low Fish (planktivore) Decrease Moderate Moderate Fish (benthivore-littoral) Increase Moderate Very Low Fish (deepwater benthivore) Decrease High Moderate Fish (piscivore) Decrease Moderate Moderate Avian botulism Increase Moderate High
Biodiversity Unionid mussel Decrease Very High Very Low Sphaeriid mussel Decrease Very High Low Species at Risk Decrease Low to High Very High
Impact Uncertainty
Impact to Environment Very High Negative Very Low

38
Table 4. Canadian freshwater molluscs designated by COSEWIC.
Scientific Name Common Name COSEWIC
Designation
Range Note
Villosa fabalis Rayed Bean Endangered ON Villosa iris Rainbow Mussel Endangered ON Lampsilis fasciola Wavy-rayed
Lampmussel Endangered ON Reduced to Special Concern;
Potential overlap with dreissenids
Simpsonais ambigua Mudpuppy Mussel Endangered ON Epioblasma torulosa rangiana
Northern Riffleshell Endangered ON
Epioblasma triquetra Snuffbox Endangered ON Truncilla donaciformis Fawnsfoot Endangered ON Obovaria olivaria Hickorynut Endangered ON,
QC
Obovaria subrotunda Round Hickorynut Endangered ON Ptychobranchus fasciolaris
Kidneyshell Endangered ON
Quadrula quadrula Mapleleaf Mussel Endangered MB Gonidea angulata Rocky Mountain
Ridged Mussel Endangered BC Potential threat from dreissenids
Pleurobema sintoxia Round Pigtoe Endangered ON Potential overlap with dreissenids
Ligumia nasuta Eastern Pondmussel Endangered Potential overlap with dreissenids
Physella johnsoni Banff Springs Snail Endangered AB Quadrula quadrula Mapleleaf Mussel Threatened ON Potential overlap with
dreissenids Alasmidonta varicosa Brook Floater Special
Concern NB, NS
Lampsilis cariosa Yellow Lampmussel Special Concern
NB, NS Potential overlap with dreissenids
Acroloxus coloradensis Rocky Mountain Capshell
Data Deficient
ON, QC
Lyrogyrus granum Squat Duskysnail Data Deficient
NB, NS
Physella parkeri latchfordi
Gatineau Tadpole Snail
Data Deficient
QC

39
Table 5. Canadian freshwater fishes designated Extirpated, Endangered, Threatened, or Special Concern by COSEWIC that could potentially be affected by dreissenid mussels.
Scientific Name Common Name COSEWIC
Designation
Range
Polyodon spathula Paddlefish Extirpated ON Coregonus sp. Spring cisco Endangered QC Moxostoma hubbsi Copper redhorse Endangered QC Acipenser fulvescens Lake sturgeon (various
populations) Endangered ON, MB, SK, AB,
Lampetra richardsoni Western brook lamprey Endangered BC Hybognathus argyritis Western silvery minnow Endangered AB Gasterosteus aculeatus Enos Lake benthic
threespine stickleback Endangered BC
Coregonus huntsmani Atlantic Whitefish Endangered NS Coregonus zenithicus Shortjaw cisco Threatened NT, AB, SK, MB, ON Moxostoma duquesnei Black redhorse Threatened ON Rhinichthys Umatilla Umatilla dace Threatened BC Lampetra macrostoma Vancouver lamprey Threatened BC Cottus aleuticus Coastrange sculpin Threatened BC Osmerus mordax Rainbow smelt (small-
bodied) Threatened NB
Catostomus platyrhynchus Mountain sucker Threatened AB, SK Acipenser fulvescens Lake Sturgeon Threatened ON, QC Ichthyomyzon fossor Northern brook lamprey Special Concern ON, QC Ichthyomyzon unicuspis Silver lamprey Special Concern ON, QC Moxostoma carinatum River redhorse Special Concern ON, QC Myoxocephalus thompsonii Deepwater sculpin Special Concern ON, QC Minytrema melanops Spotted sucker Special Concern ON Lepomis gulosus Warmouth Special Concern ON Ictiobus cyprinellus Bigmouth buffalo Special Concern ON Cottus hubbsi Columbia sculpin Special Concern BC Cottus confuses Shorthead sculpin Special Concern BC Acipenser brevirostrum Shortnose sturgeon Special Concern NB Acipenser fulvescens Lake sturgeon (various
populations) Special Concern ON, MB, QC
Catostomus platyrhynchus Mountain sucker Special Concern BC

40
Table 6. Introduced populations of Mytilopsis leucopheata with reported date and indication of population establishment.
Location Date Reported Established Reference
North Sea 2004 n/a Therriault et al., 2004
Black Sea 2001 by 2004 invaded Dniester Liman yes
Therriault et al., 2004; NOBANIS 2011
Baltic Sea 2000 n/a NOBANIS, 2011
Caspian Sea, Russia 2004 n/a Therriault et al., 2004
Sea of Azov 2004 n/a Therriault et al., 2004
Belgium 1835 yes NOBANIS, 2011; Laine, et al., 2000
Brazil 2010 n/a Kennedy, 2010
Central Gulf of Finland 2003 yes Laine et al., 2006
France 1898 n/a Rajagopal et al., 2005b
Germany 1932 1928 sighting in the Kiel Canal n/a
Rajagopal et al., 2005b; Boettger, 1933 in Verween et al., 2010
Netherlands 2002 by 1969 invaded Rhine River n/a
Wolff, 1969; Rajagopal et al., 2002b
United Kingdom 2004 n/a Therriault et al., 2004
Wales, UK 1996 n/a NOBANIS, 2011
Spain 2003 n/a Escot et al. 2003, in Verween et al., 2010
United States
Upper Mississippi River 1988 n/a Koch, 1989; Therriault et al., 2004
Housatonic River, Connecticut 2010 yes Kennedy, 2010
Charles River, Massachusetts 2010 yes Kennedy, 2010
Chesapeake Bay 1934 n/a Johnson, 1934
Chesapeake Bay 2006 yes Verween et al., 2006; NOBANIS, 2011
Several locations in Florida 2010 yes Kennedy, 2010
Several sites in Hudson River 1992 yes Walton, 1996; Verween et al., 2010
New England 1996 n/a Smith and Boss, 1996

41
Table 7. List of main data sources used to calculate 75th percentile calcium concentrations for sub-drainages used
in the risk assessment.
Province Number
of sites
Year Source Contact
British Columbia 3545 1969-2011 Government of British Columbia L.-M. Herborg
Alberta 478 1981-2009 Alberta Environment M. Raven
Manitoba 1145 1973-2011 Manitoba Water Stewardship J. Shead
Ontario* 8882 1970s-2009
1970s Lake Inventory Database, Ontario Ministry of Natural Resources; Hincks and Mackie 1997; Beeton et al. 1967; STAR database; Cohen and Weinstein 2001 (pers. comm. therein)
G. Mackie,
K. Minns
Quebec 3137 1999-2000 Ministère des Ressources naturelles et de la Faune
A. Paquet,
A. Simard
Saskatchewan 119 1976-2010 Government of Saskatchewan T. Johnston
*Calcium concentrations were derived from alkalinity using the following relationship: Calcium (mg/L) = Alkalinity (mg CaCO3/L)/3.49 (Mackie and Claudi, 2010).

42
Table 8. Thresholds for propagule pressure and proximity to invaded habitats for Zebra Mussel (Dreissena polymorpha) and Quagga Mussel (Dreissena rostriformis bugensis).
Probability of Arrival Propagule Pressure Correction for Proximity
Category Human footprint
index
Vector Pressure
Proximity to Invaded Habitats
Proximity correction
factor
Very Low 0 – 3 1 > 2 watersheds from infestation
0
Low 4 – 8 2 Invaded, adjacent or 2 sub-drainages away
+1
Moderate 9 – 19 3 High 20 – 31 4
Very High 32 – 52 5
Table 9. Definition of level of impact and categories for the dreissenid mussel risk assessment (modified from Therriault and Herborg, 2008).
Impacts
Category Definition
Very Low Negative No measurable impact; consequences can be absorbed without additional management action.
Low Negative A measurable limited impact; disruption to the factor in question but reversible or limited in time, space or severity.
Moderate Negative A measurable widespread impact; widespread disruption to the factor in question but reversible or of limited severity or duration.
High Negative A significant impact; widespread disruption to the factor in question that persists over time or is likely not reversible.
Very High Negative A critical impact; extensive disruption to the factor in question that is irreversible.
Uncertainty
Category Definition
Very High Little or no information; opinion based on general species knowledge.
High Limited information; third party observational evidence or based on circumstantial evidence.
Moderate Moderate level of information; first hand knowledge and/or unsystematic observations.
Low Substantial scientific information; non peer-reviewed information. Very Low Extensive scientific information; peer-reviewed information.

43
Table 10. Percentage of sites falling into each calcium category for “n” sites and scores for the probability of survival (habitat suitability) for Zebra Mussel per sub-drainage based on calcium concentrations (mg/L; 75
th percentile) and corrected for temperature. Sub-drainages were ranked
on their suitability for Zebra Mussel survival based on literature accounts (see Table 1).
Prov. ID Sub-drainage n < 12 12-19 20-25 ≥ 26 Probability
of Survival
AB 05F Battle 15 20% 27% 7% 47% Very high
AB 06A Beaver (Alta.-Sask.) 47 6% 13% 19% 62% Very high
AB 05B Bow 21 10% 0% 0% 90% Very high
AB 07C Central Athabasca – Lower 19 21% 32% 11% 37% Very high
AB 07B Central Athabasca – Upper 47 11% 17% 21% 51% Very high
AB 05E Central North Saskatchewan 45 11% 16% 24% 49% Very high
AB 07J Central Peace – Lower 28 36% 18% 18% 29% Very high
AB 07H Central Peace – Upper 21 10% 19% 14% 57% Very high
AB 08N Columbia - U.S.A. 747 19% 17% 14% 50% Very high
AB 10C Fort Nelson 7 29% 0% 0% 71% Very high
AB 07Q Great Slave Lake - East Arm South Shore
2 100% 0% 0% 0% Very low
AB 07O Hay 13 23% 15% 15% 46% Very high
AB 71 Lake Athabasca 2 50% 0% 0% 50% High
AB 07M Lake Athabasca – Shores 6 100% 0% 0% 0% Very low
AB 07D Lower Athabasca 37 41% 35% 11% 14% Moderate
AB 05G Lower North Saskatchewan 5 40% 20% 20% 20% High
AB 07K Lower Peace 15 87% 7% 0% 7% Very low
AB 05H Lower South Saskatchewan 42 0% 0% 0% 100% Very high
AB 11A Missouri 3 0% 33% 0% 67% Very high
AB 05C Red Deer 35 14% 11% 3% 71% Very high
AB 07N Slave 10 100% 0% 0% 0% Very low
AB 07G Smoky 33 3% 18% 27% 52% Very high
AB 07P Southern Great Slave Lake 17 53% 35% 6% 6% Moderate
AB 07A Upper Athabasca 9 0% 33% 0% 67% Very high
AB 06B Upper Churchill (Man.) 1 0% 0% 0% 100% Very high
AB 08K Upper Fraser 198 21% 22% 12% 45% Very high
AB 05D Upper North Saskatchewan 12 8% 8% 17% 67% Very high
AB 07F Upper Peace 157 3% 11% 10% 76% Very high
AB 05A Upper South Saskatchewan 52 0% 6% 8% 87% Very high
BC 08A Alsek 5 0% 0% 60% 40% High
BC 05B Bow 21 10% 0% 0% 90% Very high
BC 08F Central Coastal Waters of B.C. 88 90% 6% 0% 5% Very low
BC 10B Central Liard 14 43% 21% 0% 36% Very high
BC 08N Columbia - U.S.A. 747 19% 17% 14% 50% Very high
BC 10C Fort Nelson 7 29% 0% 0% 71% Very high
BC 07O Hay 13 23% 15% 15% 46% Very high
BC 09A Headwaters Yukon 38 61% 26% 5% 8% Very low
BC 08M Lower Fraser 299 34% 26% 14% 25% High
BC 08D Nass – Coast 64 55% 27% 13% 6% Moderate
BC 08J Nechako 204 48% 33% 8% 11% Moderate
BC 08B Northern Coastal Waters of B.C. 27 19% 37% 26% 19% Moderate
BC 08O Queen Charlotte Islands 30 90% 7% 0% 3% Very low
BC 08E Skeena – Coast 309 57% 25% 6% 12% Moderate
BC 07G Smoky 33 3% 18% 27% 52% Very high

44
Prov. ID Sub-drainage n < 12 12-19 20-25 ≥ 26 Probability
of Survival
BC 08G Southern Coastal Waters of B.C. 92 80% 11% 2% 7% Very low
BC 08C Stikine – Coast 62 40% 18% 19% 23% Moderate
BC 08L Thompson 520 20% 21% 10% 49% Very high
BC 07A Upper Athabasca 9 0% 33% 0% 67% Very high
BC 08K Upper Fraser 198 21% 22% 12% 45% Very high
BC 10A Upper Liard 23 30% 17% 9% 43% High
BC 05D Upper North Saskatchewan 12 8% 8% 17% 67% Very high
BC 07F Upper Peace 157 3% 11% 10% 76% Very high
BC 05A Upper South Saskatchewan 52 0% 6% 8% 87% Very high
BC 08H Vancouver Island 562 82% 10% 2% 5% Very low
BC 07E Williston Lake 68 19% 38% 10% 32% Very high
MB 05M Assiniboine 135 0% 3% 4% 93% Very high
MB 06E Central Churchill (Man.) – Lower 68 50% 16% 1% 32% Very high
MB 05R Eastern Lake Winnipeg 130 86% 9% 1% 4% Very low
MB 05T Grass and Burntwood 76 8% 68% 9% 14% Moderate
MB 04A Hayes (Man.) 17 12% 53% 18% 18% High
MB 50 Lake Winnipeg 99 5% 9% 14% 72% Very high
MB 05L Lake Winnipegosis and Lake Manitoba
105 0% 1% 1% 98% Very high
MB 06F Lower Churchill (Man.) 16 0% 38% 50% 13% High
MB 05U Nelson 39 0% 10% 23% 67% Very high
MB 05J Qu'Appelle 40 0% 0% 0% 100% Very high
MB 05O Red 150 0% 2% 1% 97% Very high
MB 06D Reindeer 1 100% 0% 0% 0% Very low
MB 05K Saskatchewan 156 0% 13% 9% 78% Very high
MB 04C Severn 77 43% 49% 8% 0% Moderate
MB 05N Souris 35 0% 0% 3% 97% Very high
MB 05S Western Lake Winnipeg 65 2% 5% 3% 91% Very high
MB 05P Winnipeg 955 81% 11% 4% 4% Very low
NL 03L Caniapiscau 10 100% 0% 0% 0% Very low
NL 03O Churchill (Nfld.) 1 100% 0% 0% 0% Very low
NL 03M Eastern Ungava Bay 78 100% 0% 0% 0% Very low
NL 02W Gulf of St. Lawrence – Natashquan 42 93% 2% 0% 5% Very low
NL 02V Gulf of St. Lawrence – Romaine 39 100% 0% 0% 0% Very low
NL 02U Moisie and St. Lawrence Estuary 61 100% 0% 0% 0% Very low
NL 02X Petit Mécatina and Strait of Belle Isle
5 100% 0% 0% 0% Very low
NT 10B Central Liard 14 43% 21% 0% 36% Very high
NT 07L Fond-du-Lac 1 100% 0% 0% 0% Very low
NT 07Q Great Slave Lake - East Arm South Shore
2 100% 0% 0% 0% Very low
NT 07O Hay 13 23% 15% 15% 46% Very high
NT 07N Slave 10 100% 0% 0% 0% Very low
NT 07P Southern Great Slave Lake 17 53% 35% 6% 6% Moderate
NT 10A Upper Liard 23 30% 17% 9% 43% High
ON 04M Abitibi 388 44% 28% 10% 18% High
ON 04F Attawapiskat – Coast 46 57% 33% 2% 9% Moderate
ON 02K Central Ottawa 1098 70% 11% 5% 13% Moderate
ON 02E Eastern Georgian Bay 752 91% 2% 1% 6% Very low
ON 02F Eastern Lake Huron 186 5% 3% 3% 88% Very high

45
Prov. ID Sub-drainage n < 12 12-19 20-25 ≥ 26 Probability
of Survival
ON 05R Eastern Lake Winnipeg 130 86% 9% 1% 4% Very low
ON 04E Ekwan – Coast 10 0% 60% 20% 20% High
ON 05Q English 765 86% 12% 2% 1% Very low
ON 20 Great Lakes and St. Lawrence 39 38% 18% 8% 36% Very high
ON 04N Harricanaw – Coast 77 91% 6% 0% 3% Very low
ON 04A Hayes (Man.) 17 12% 53% 18% 18% High
ON 04J Kenogami 314 13% 25% 21% 41% Very high
ON 02H Lake Ontario and Niagara Peninsula
539 55% 12% 7% 25% High
ON 04H Lower Albany – Coast 3 100% 0% 0% 0% Very low
ON 02L Lower Ottawa 503 82% 9% 3% 7% Very low
ON 04L Missinaibi-Mattagami 646 51% 25% 11% 13% Moderate
ON 04K Moose (Ont.) 16 50% 44% 0% 6% Moderate
ON 02B Northeastern Lake Superior 649 70% 18% 6% 6% Moderate
ON 02G Northern Lake Erie 95 2% 3% 4% 91% Very high
ON 02C Northern Lake Huron 850 96% 2% 0% 1% Very low
ON 02A Northwestern Lake Superior 347 64% 23% 7% 6% Moderate
ON 04C Severn 77 43% 49% 8% 0% Moderate
ON 04G Upper Albany 229 72% 21% 5% 3% Moderate
ON 02J Upper Ottawa 854 89% 7% 2% 3% Very low
ON 02M Upper St. Lawrence 89 25% 21% 17% 37% Very high
ON 02D Wanipitai and French (Ont.) 374 94% 4% 1% 0% Very low
ON 04D Winisk – Coast 45 42% 42% 11% 4% Moderate
ON 05P Winnipeg 955 81% 11% 4% 4% Very low
QC 04M Abitibi 388 44% 28% 10% 18% High
QC 02S Betsiamites – Coast 105 100% 0% 0% 0% Very low
QC 03B Broadback and Rupert 92 90% 7% 0% 3% Very low
QC 03L Caniapiscau 10 100% 0% 0% 0% Very low
QC 02K Central Ottawa 1098 70% 11% 5% 13% Moderate
QC 02O Central St. Lawrence 251 61% 21% 5% 14% Moderate
QC 03O Churchill (Nfld.) 1 100% 0% 0% 0% Very low
QC 03M Eastern Ungava Bay 78 100% 0% 0% 0% Very low
QC 03C Eastmain 6 100% 0% 0% 0% Very low
QC 20 Great Lakes and St. Lawrence 39 38% 18% 8% 36% Very high
QC 02W Gulf of St. Lawrence – Natashquan 42 93% 2% 0% 5% Very low
QC 02V Gulf of St. Lawrence – Romaine 39 100% 0% 0% 0% Very low
QC 01B Gulf of St. Lawrence and Northern Bay of Fundy (N.B.)
37 19% 19% 19% 43% Very high
QC 04N Harricanaw – Coast 77 91% 6% 0% 3% Very low
QC 03D La Grande – Coast 1 100% 0% 0% 0% Very low
QC 02L Lower Ottawa 503 82% 9% 3% 7% Very low
QC 02P Lower St. Lawrence 385 95% 3% 1% 1% Very low
QC 02T Manicouagan and aux Outardes 92 100% 0% 0% 0% Very low
QC 02U Moisie and St. Lawrence Estuary 61 100% 0% 0% 0% Very low
QC 02Q Northern Gaspé Peninsula 41 20% 27% 22% 32% Very high
QC 03A Nottaway – Coast 209 97% 3% 0% 0% Very low
QC 02X Petit Mécatina and Strait of Belle Isle
5 100% 0% 0% 0% Very low
QC 02R Saguenay 343 99% 0% 0% 0% Very low
QC 01A Saint John and Southern Bay of 35 34% 34% 17% 14% High

46
Prov. ID Sub-drainage n < 12 12-19 20-25 ≥ 26 Probability
of Survival
Fundy (N.B.)
QC 02N Saint-Maurice 313 100% 0% 0% 0% Very low
QC 02J Upper Ottawa 854 89% 7% 2% 3% Very low
QC 02M Upper St. Lawrence 89 25% 21% 17% 37% Very high
SK 05M Assiniboine 135 0% 3% 4% 93% Very high
SK 05F Battle 15 20% 27% 7% 47% Very high
SK 06A Beaver (Alta.-Sask.) 47 6% 13% 19% 62% Very high
SK 07C Central Athabasca – Lower 19 21% 32% 11% 37% Very high
SK 06E Central Churchill (Man.) – Lower 68 50% 16% 1% 32% Very high
SK 06C Central Churchill (Man.) – Upper 1 0% 100% 0% 0% Moderate
SK 05E Central North Saskatchewan 45 11% 16% 24% 49% Very high
SK 07L Fond-du-Lac 1 100% 0% 0% 0% Very low
SK 07Q Great Slave Lake - East Arm South Shore
2 100% 0% 0% 0% Very low
SK 71 Lake Athabasca 2 50% 0% 0% 50% High
SK 07M Lake Athabasca – Shores 6 100% 0% 0% 0% Very low
SK 05L Lake Winnipegosis and Lake Manitoba
105 0% 1% 1% 98% Very high
SK 07D Lower Athabasca 37 41% 35% 11% 14% Moderate
SK 05G Lower North Saskatchewan 5 40% 20% 20% 20% High
SK 05H Lower South Saskatchewan 42 0% 0% 0% 100% Very high
SK 11A Missouri 3 0% 33% 0% 67% Very high
SK 05J Qu'Appelle 40 0% 0% 0% 100% Very high
SK 05C Red Deer 35 14% 11% 3% 71% Very high
SK 06D Reindeer 1 100% 0% 0% 0% Very low
SK 05K Saskatchewan 156 0% 13% 9% 78% Very high
SK 05N Souris 35 0% 0% 3% 97% Very high
SK 06B Upper Churchill (Man.) 1 0% 0% 0% 100% Very high
SK 05A Upper South Saskatchewan 52 0% 6% 8% 87% Very high
YT 08A Alsek 5 0% 0% 60% 40% High
YT 10B Central Liard 14 43% 21% 0% 36% Very high
YT 09A Headwaters Yukon 38 61% 26% 5% 8% Very low
YT 10A Upper Liard 23 30% 17% 9% 43% High

47
Table 11. Probability of Zebra Mussel arrival, survival, and invasion per sub-drainage. The probability of invasion is based on the probability of survival (calcium suitability corrected for temperature) and probability of arrival (propagule pressure corrected for proximity to an invaded watershed). The risk to the environment is based on the probability of invasion and impacts to the environment.
Prov. ID Sub-drainage
Calcium
Suitability
Temp
corr.
Probability
of Survival
Propagule
Pressure
Prox
corr.
Probability
of Arrival
Probability
of Invasion
Risk to
Environment
AB 05F Battle Very high 0 Very high High 0 High Very high High
AB 06A Beaver (Alta.-Sask.) Very high 0 Very high Moderate 0 Moderate High High
AB 05B Bow Very high 0 Very high High 0 High Very high High
AB 07C Central Athabasca - Lower Very high 0 Very high Low 0 Low High High
AB 07B Central Athabasca - Upper Very high 0 Very high Moderate 0 Moderate High High
AB 05E Central North Saskatchewan Very high 0 Very high High 0 High Very high High
AB 07J Central Peace - Lower Very high 0 Very high Low 0 Low High High
AB 07H Central Peace - Upper Very high 0 Very high Low 0 Low High High
AB 08N Columbia - U.S.A. Very high 0 Very high Moderate 0 Moderate High High
AB 10C Fort Nelson Very high 0 Very high Low 0 Low High High
AB 07Q Great Slave Lake - East Arm South Shore Very low 0 Very low Very low 0 Very low Very low Low
AB 07O Hay Very high 0 Very high Low 0 Low High High
AB 71 Lake Athabasca High 0 High Very low 0 Very low Moderate High
AB 07M Lake Athabasca - Shores Very low 0 Very low Very low 0 Very low Very low Low
AB 07D Lower Athabasca Moderate 0 Moderate Very low 0 Very low Low Moderate
AB 05G Lower North Saskatchewan High 0 High High 0 High High High
AB 07K Lower Peace Very low 0 Very low Very low 0 Very low Very low Low
AB 05H Lower South Saskatchewan Very high 0 Very high High 0 High Very high High
AB 11A Missouri Very high 0 Very high Moderate 1 High Very high High
AB 05C Red Deer Very high 0 Very high High 0 High Very high High
AB 07N Slave Very low 0 Very low Low 0 Low Very low Low
AB 07G Smoky Very high 0 Very high Moderate 0 Moderate High High
AB 07P Southern Great Slave Lake Moderate 0 Moderate Very low 0 Very low Low Moderate
AB 07A Upper Athabasca Very high 0 Very high Moderate 0 Moderate High High
AB 06B Upper Churchill (Man.) Very high 0 Very high Very low 0 Very low Moderate High
AB 08K Upper Fraser Very high 0 Very high Low 0 Low High High
AB 05D Upper North Saskatchewan Very high 0 Very high Moderate 0 Moderate High High
AB 07F Upper Peace Very high 0 Very high Moderate 0 Moderate High High
AB 05A Upper South Saskatchewan Very high 0 Very high Moderate 0 Moderate High High
BC 08A Alsek Very high -1 High Low 0 Low Moderate High

48
Prov. ID Sub-drainage
Calcium
Suitability
Temp
corr.
Probability
of Survival
Propagule
Pressure
Prox
corr.
Probability
of Arrival
Probability
of Invasion
Risk to
Environment
BC 05B Bow Very high 0 Very high High 0 High Very high High
BC 08F Central Coastal Waters of B.C. Very low 0 Very low Low 0 Low Very low Low
BC 10B Central Liard Very high 0 Very high Very low 0 Very low Moderate High
BC 08N Columbia - U.S.A. Very high 0 Very high Moderate 0 Moderate High High
BC 10C Fort Nelson Very high 0 Very high Low 0 Low High High
BC 07O Hay Very high 0 Very high Low 0 Low High High
BC 09A Headwaters Yukon Moderate -1 Low Low 0 Low Low Low
BC 08M Lower Fraser High 0 High Moderate 0 Moderate High High
BC 08D Nass - Coast Moderate 0 Moderate Low 0 Low Moderate High
BC 08J Nechako Moderate 0 Moderate Low 0 Low Moderate High
BC 08B Northern Coastal Waters of B.C. High -1 Moderate Low 0 Low Moderate High
BC 08O Queen Charlotte Islands Very low 0 Very low Moderate 0 Moderate Very low Low
BC 08E Skeena - Coast Moderate 0 Moderate Low 0 Low Moderate High
BC 07G Smoky Very high 0 Very high Moderate 0 Moderate High High
BC 08G Southern Coastal Waters of B.C. Very low 0 Very low Low 0 Low Very low Low
BC 08C Stikine - Coast High -1 Moderate Low 0 Low Moderate High
BC 08L Thompson Very high 0 Very high Moderate 0 Moderate High High
BC 07A Upper Athabasca Very high 0 Very high Moderate 0 Moderate High High
BC 08K Upper Fraser Very high 0 Very high Low 0 Low High High
BC 10A Upper Liard Very high -1 High Low 0 Low Moderate High
BC 05D Upper North Saskatchewan Very high 0 Very high Moderate 0 Moderate High High
BC 07F Upper Peace Very high 0 Very high Moderate 0 Moderate High High
BC 05A Upper South Saskatchewan Very high 0 Very high Moderate 0 Moderate High High
BC 08H Vancouver Island Very low 0 Very low Moderate 0 Moderate Very low Low
BC 07E Williston Lake Very high 0 Very high Low 0 Low High High
MB 05M Assiniboine Very high 0 Very high High 1 Very high Very high High
MB 06E Central Churchill (Man.) - Lower Very high 0 Very high Very low 0 Very low Moderate High
MB 05R Eastern Lake Winnipeg Very low 0 Very low Very low 1 Low Very low Low
MB 05T Grass and Burntwood Moderate 0 Moderate Low 0 Low Moderate High
MB 04A Hayes (Man.) High 0 High Very low 0 Very low Moderate High
MB 50 Lake Winnipeg Very high 0 Very high Low 1 Very high Very high High
MB 05L Lake Winnipegosis and Lake Very high 0 Very high Moderate 1 High Very high High

49
Prov. ID Sub-drainage
Calcium
Suitability
Temp
corr.
Probability
of Survival
Propagule
Pressure
Prox
corr.
Probability
of Arrival
Probability
of Invasion
Risk to
Environment
Manitoba
MB 06F Lower Churchill (Man.) High 0 High Very low 0 Very low Moderate High
MB 05U Nelson Very high 0 Very high Very low 1 Very high Very high High
MB 05J Qu'Appelle Very high 0 Very high High 1 Very high Very high High
MB 05O Red Very high 0 Very high High 1 Very high Very high High
MB 06D Reindeer Very low 0 Very low Very low 0 Very low Very low Low
MB 05K Saskatchewan Very high 0 Very high Moderate 1 High Very high High
MB 04C Severn Moderate 0 Moderate Very low 0 Very low Low Moderate
MB 05N Souris Very high 0 Very high High 1 Very high Very high High
MB 05S Western Lake Winnipeg Very high 0 Very high Moderate 1 High Very high High
MB 05P Winnipeg Very low 0 Very low Moderate 1 High Very low Low
NL 03L Caniapiscau Very low -1 Very low Very low 1 Low Very low Low
NL 03O Churchill (Nfld.) Very low 0 Very low Low 1 Moderate Very low Low
NL 03M Eastern Ungava Bay Very low -1 Very low Low 0 Low Very low Low
NL 02W Gulf of St. Lawrence - Natashquan Very low 0 Very low Low 1 Moderate Very low Low
NL 02V Gulf of St. Lawrence - Romaine Very low 0 Very low Very low 1 Low Very low Low
NL 02U Moisie and St. Lawrence Estuary Very low 0 Very low Low 1 Moderate Very low Low
NL 02X Petit Mécatina and Strait of Belle Isle Very low 0 Very low Low 1 Moderate Very low Low
NT 10B Central Liard Very high 0 Very high Very low 0 Very low Moderate High
NT 07L Fond-du-Lac Very low 0 Very low Very low 0 Very low Very low Low
NT 07Q Great Slave Lake - East Arm South Shore Very low 0 Very low Very low 0 Very low Very low Low
NT 07O Hay Very high 0 Very high Low 0 Low High High
NT 07N Slave Very low 0 Very low Low 0 Low Very low Low
NT 07P Southern Great Slave Lake Moderate 0 Moderate Very low 0 Very low Low Moderate
NT 10A Upper Liard Very high -1 High Low 0 Low Moderate High
ON 04M Abitibi High 0 High Moderate 1 High High High
ON 04F Attawapiskat - Coast Moderate 0 Moderate Very low 1 Low Moderate High
ON 02K Central Ottawa Moderate 0 Moderate Moderate 1 High High High
ON 02E Eastern Georgian Bay Very low 0 Very low High 1 Very high Very low Low
ON 02F Eastern Lake Huron Very high 0 Very high Very high 1 Very high Very high High
ON 05R Eastern Lake Winnipeg Very low 0 Very low Very low 1 Low Very low Low

50
Prov. ID Sub-drainage
Calcium
Suitability
Temp
corr.
Probability
of Survival
Propagule
Pressure
Prox
corr.
Probability
of Arrival
Probability
of Invasion
Risk to
Environment
ON 04E Ekwan - Coast High 0 High Very low 0 Very low Moderate High
ON 05Q English Very low 0 Very low Low 1 Moderate Very low Low
ON 20 Great Lakes and St. Lawrence Very high 0 Very high Very high 1 Very high Very high High
ON 04N Harricanaw - Coast Very low 0 Very low Low 1 Moderate Very low Low
ON 04A Hayes (Man.) High 0 High Very low 0 Very low Moderate High
ON 04J Kenogami Very high 0 Very high Low 1 Moderate High High
ON 02H Lake Ontario and Niagara Peninsula High 0 High Very high 1 Very high Very high High
ON 04H Lower Albany - Coast Very low 0 Very low Very low 1 Low Very low Low
ON 02L Lower Ottawa Very low 0 Very low High 1 Very high Very low Low
ON 04L Missinaibi-Mattagami Moderate 0 Moderate Moderate 1 High High High
ON 04K Moose (Ont.) Moderate 0 Moderate Very low 1 Low Moderate High
ON 02B Northeastern Lake Superior Moderate 0 Moderate Low 1 Moderate Moderate High
ON 02G Northern Lake Erie Very high 0 Very high Very high 1 Very high Very high High
ON 02C Northern Lake Huron Very low 0 Very low Moderate 1 High Very low Low
ON 02A Northwestern Lake Superior Moderate 0 Moderate Moderate 1 High High High
ON 04C Severn Moderate 0 Moderate Very low 0 Very low Low Moderate
ON 04G Upper Albany Moderate 0 Moderate Very low 1 Low Moderate High
ON 02J Upper Ottawa Very low 0 Very low Moderate 1 High Very low Low
ON 02M Upper St. Lawrence Very high 0 Very high High 1 Very high Very high High
ON 02D Wanipitai and French (Ont.) Very low 0 Very low Moderate 1 High Very low Low
ON 04D Winisk - Coast Moderate 0 Moderate Very low 1 Low Moderate High
ON 05P Winnipeg Very low 0 Very low Moderate 1 High Very low Low
QC 04M Abitibi High 0 High Moderate 1 High High High
QC 02S Betsiamites - Coast Very low 0 Very low Low 1 Moderate Very low Low
QC 03B Broadback and Rupert Very low 0 Very low Low 1 Moderate Very low Low
QC 03L Caniapiscau Very low -1 Very low Very low 1 Low Very low Low
QC 02K Central Ottawa Moderate 0 Moderate Moderate 1 High High High
QC 02O Central St. Lawrence Moderate 0 Moderate Very high 1 Very high High High
QC 03O Churchill (Nfld.) Very low 0 Very low Low 1 Moderate Very low Low
QC 03M Eastern Ungava Bay Very low -1 Very low Low 0 Low Very low Low
QC 03C Eastmain Very low 0 Very low Low 1 Moderate Very low Low
QC 20 Great Lakes and St. Lawrence Very high 0 Very high Very high 1 Very high Very high High
QC 02W Gulf of St. Lawrence - Natashquan Very low 0 Very low Low 1 Moderate Very low Low

51
Prov. ID Sub-drainage
Calcium
Suitability
Temp
corr.
Probability
of Survival
Propagule
Pressure
Prox
corr.
Probability
of Arrival
Probability
of Invasion
Risk to
Environment
QC 02V Gulf of St. Lawrence - Romaine Very low 0 Very low Very low 1 Low Very low Low
QC 01B Gulf of St. Lawrence and Northern Bay of Fundy (N.B.) Very high 0 Very high High 1 Very high Very high High
QC 04N Harricanaw - Coast Very low 0 Very low Low 1 Moderate Very low Low
QC 03D La Grande - Coast Very low 0 Very low Low 1 Moderate Very low Low
QC 02L Lower Ottawa Very low 0 Very low High 1 Very high Very low Low
QC 02P Lower St. Lawrence Very low 0 Very low High 1 Very high Very low Low
QC 02T Manicouagan and aux Outardes Very low 0 Very low Low 1 Moderate Very low Low
QC 02U Moisie and St. Lawrence Estuary Very low 0 Very low Low 1 Moderate Very low Low
QC 02Q Northern Gaspé Peninsula Very high 0 Very high High 1 Very high Very high High
QC 03A Nottaway - Coast Very low 0 Very low Low 1 Moderate Very low Low
QC 02X Petit Mécatina and Strait of Belle Isle Very low 0 Very low Low 1 Moderate Very low Low
QC 02R Saguenay Very low 0 Very low Moderate 1 High Very low Low
QC 01A Saint John and Southern Bay of Fundy (N.B.) High 0 High High 1 Very high Very high High
QC 02N Saint-Maurice Very low 0 Very low Moderate 1 High Very low Low
QC 02J Upper Ottawa Very low 0 Very low Moderate 1 High Very low Low
QC 02M Upper St. Lawrence Very high 0 Very high High 1 Very high Very high High
SK 05M Assiniboine Very high 0 Very high High 1 Very high Very high High
SK 05F Battle Very high 0 Very high High 0 High Very high High
SK 06A Beaver (Alta.-Sask.) Very high 0 Very high Moderate 0 Moderate High High
SK 07C Central Athabasca - Lower Very high 0 Very high Low 0 Low High High
SK 06E Central Churchill (Man.) - Lower Very high 0 Very high Very low 0 Very low Moderate High
SK 06C Central Churchill (Man.) - Upper Moderate 0 Moderate Low 0 Low Moderate High
SK 05E Central North Saskatchewan Very high 0 Very high High 0 High Very high High
SK 07L Fond-du-Lac Very low 0 Very low Very low 0 Very low Very low Low
SK 07Q Great Slave Lake - East Arm South Shore Very low 0 Very low Very low 0 Very low Very low Low
SK 71 Lake Athabasca High 0 High Very low 0 Very low Moderate High
SK 07M Lake Athabasca - Shores Very low 0 Very low Very low 0 Very low Very low Low

52
Prov. ID Sub-drainage
Calcium
Suitability
Temp
corr.
Probability
of Survival
Propagule
Pressure
Prox
corr.
Probability
of Arrival
Probability
of Invasion
Risk to
Environment
SK 05L Lake Winnipegosis and Lake Manitoba Very high 0 Very high Moderate 1 High Very high High
SK 07D Lower Athabasca Moderate 0 Moderate Very low 0 Very low Low Moderate
SK 05G Lower North Saskatchewan High 0 High High 0 High High High
SK 05H Lower South Saskatchewan Very high 0 Very high High 0 High Very high High
SK 11A Missouri Very high 0 Very high Moderate 1 High Very high High
SK 05J Qu'Appelle Very high 0 Very high High 1 Very high Very high High
SK 05C Red Deer Very high 0 Very high High 0 High Very high High
SK 06D Reindeer Very low 0 Very low Very low 0 Very low Very low Low
SK 05K Saskatchewan Very high 0 Very high Moderate 1 High Very high High
SK 05N Souris Very high 0 Very high High 1 Very high Very high High
SK 06B Upper Churchill (Man.) Very high 0 Very high Very low 0 Very low Moderate High
SK 05A Upper South Saskatchewan Very high 0 Very high Moderate 0 Moderate High High
YT 08A Alsek Very high -1 High Low 0 Low Moderate High
YT 10B Central Liard Very high 0 Very high Very low 0 Very low Moderate High
YT 09A Headwaters Yukon Moderate -1 Low Low 0 Low Low Low
YT 10A Upper Liard Very high -1 High Low 0 Low Moderate High

53
Table 12. Percentage of sites falling into each calcium category for “n” sites and scores for probability of survival (habitat suitability) for Quagga Mussel per sub-drainage based on calcium concentrations (mg/L; 75
th percentile). Sub-drainages were ranked on their suitability for Quagga
Mussel survival based on literature accounts (see Table 1).
Prov. ID Sub-drainage n < 12 12-32 >32 Probability
of Survival
AB 05F Battle 15 20% 53% 27% High
AB 06A Beaver (Alta.-Sask.) 47 6% 74% 19% High
AB 05B Bow 21 10% 24% 67% Very high
AB 07C Central Athabasca - Lower 19 21% 63% 16% High
AB 07B Central Athabasca - Upper 47 11% 70% 19% High
AB 05E Central North Saskatchewan 45 11% 62% 27% Very high
AB 07J Central Peace - Lower 28 36% 46% 18% High
AB 07H Central Peace - Upper 21 10% 57% 33% Very high
AB 08N Columbia - U.S.A. 747 19% 45% 36% Very high
AB 10C Fort Nelson 7 29% 14% 57% Very high
AB 07Q Great Slave Lake - East Arm South Shore
2 100% 0% 0% Very low
AB 07O Hay 13 23% 46% 31% Very high
AB 71 Lake Athabasca 2 50% 50% 0% High
AB 07M Lake Athabasca - Shores 6 100% 0% 0% Very low
AB 07D Lower Athabasca 37 41% 51% 8% High
AB 05G Lower North Saskatchewan 5 40% 40% 20% High
AB 07K Lower Peace 15 87% 7% 7% Very low
AB 05H Lower South Saskatchewan 42 0% 0% 100% Very high
AB 11A Missouri 3 0% 67% 33% Very high
AB 05C Red Deer 35 14% 37% 49% Very high
AB 07N Slave 10 100% 0% 0% Very low
AB 07G Smoky 33 3% 52% 45% Very high
AB 07P Southern Great Slave Lake 17 53% 47% 0% High
AB 07A Upper Athabasca 9 0% 44% 56% Very high
AB 06B Upper Churchill (Man.) 1 0% 100% 0% High
AB 08K Upper Fraser 198 21% 44% 35% Very high
AB 05D Upper North Saskatchewan 12 8% 75% 17% High
AB 07F Upper Peace 157 3% 36% 61% Very high
AB 05A Upper South Saskatchewan 52 0% 42% 58% Very high
BC 08A Alsek 5 0% 60% 40% Very high
BC 05B Bow 21 10% 24% 67% Very high
BC 08F Central Coastal Waters of B.C. 88 90% 8% 2% Very low
BC 10B Central Liard 14 43% 36% 21% High
BC 08N Columbia - U.S.A. 747 19% 45% 36% Very high
BC 10C Fort Nelson 7 29% 14% 57% Very high
BC 07O Hay 13 23% 46% 31% Very high
BC 09A Headwaters Yukon 38 61% 37% 3% High
BC 08M Lower Fraser 299 34% 52% 13% High
BC 08D Nass - Coast 64 55% 44% 2% High
BC 08J Nechako 204 48% 43% 9% High
BC 08B Northern Coastal Waters of B.C. 27 19% 70% 11% High
BC 08O Queen Charlotte Islands 30 90% 7% 3% Very low
BC 08E Skeena - Coast 309 57% 35% 8% High
BC 07G Smoky 33 3% 52% 45% Very high

54
Prov. ID Sub-drainage n < 12 12-32 >32 Probability
of Survival
BC 08G Southern Coastal Waters of B.C. 92 80% 13% 7% Very low
BC 08C Stikine - Coast 62 40% 40% 19% High
BC 08L Thompson 520 20% 40% 40% Very high
BC 07A Upper Athabasca 9 0% 44% 56% Very high
BC 08K Upper Fraser 198 21% 44% 35% Very high
BC 10A Upper Liard 23 30% 48% 22% High
BC 05D Upper North Saskatchewan 12 8% 75% 17% High
BC 07F Upper Peace 157 3% 36% 61% Very high
BC 05A Upper South Saskatchewan 52 0% 42% 58% Very high
BC 08H Vancouver Island 562 82% 15% 2% Very low
BC 07E Williston Lake 68 19% 60% 21% High
MB 05M Assiniboine 135 0% 18% 82% Very high
MB 06E Central Churchill (Man.) - Lower 68 50% 19% 31% Very high
MB 05R Eastern Lake Winnipeg 130 86% 11% 3% Very low
MB 05T Grass and Burntwood 76 8% 82% 11% High
MB 04A Hayes (Man.) 17 12% 82% 6% High
MB 50 Lake Winnipeg 99 5% 66% 29% Very high
MB 05L Lake Winnipegosis and Lake Manitoba
105 0% 7% 93% Very high
MB 06F Lower Churchill (Man.) 16 0% 94% 6% High
MB 05U Nelson 39 0% 67% 33% Very high
MB 05J Qu'Appelle 40 0% 3% 98% Very high
MB 05O Red 150 0% 5% 95% Very high
MB 06D Reindeer 1 100% 0% 0% Very low
MB 05K Saskatchewan 156 0% 48% 52% Very high
MB 04C Severn 77 43% 57% 0% High
MB 05N Souris 35 0% 9% 91% Very high
MB 05S Western Lake Winnipeg 65 2% 22% 77% Very high
MB 05P Winnipeg 955 81% 17% 2% Very low
NL 03L Caniapiscau 10 100% 0% 0% Very low
NL 03O Churchill (Nfld.) 1 100% 0% 0% Very low
NL 03M Eastern Ungava Bay 78 100% 0% 0% Very low
NL 02W Gulf of St. Lawrence - Natashquan 42 93% 2% 5% Very low
NL 02V Gulf of St. Lawrence - Romaine 39 100% 0% 0% Very low
NL 02U Moisie and St. Lawrence Estuary 61 100% 0% 0% Very low
NL 02X Petit Mécatina and Strait of Belle Isle
5 100% 0% 0% Very low
NT 10B Central Liard 14 43% 36% 21% High
NT 07L Fond-du-Lac 1 100% 0% 0% Very low
NT 07Q Great Slave Lake - East Arm South Shore
2 100% 0% 0% Very low
NT 07O Hay 13 23% 46% 31% Very high
NT 07N Slave 10 100% 0% 0% Very low
NT 07P Southern Great Slave Lake 17 53% 47% 0% High
NT 10A Upper Liard 23 30% 48% 22% High
ON 04M Abitibi 388 44% 47% 9% High
ON 04F Attawapiskat - Coast 46 57% 41% 2% High
ON 02K Central Ottawa 1098 70% 22% 8% High
ON 02E Eastern Georgian Bay 752 91% 4% 5% Very low
ON 02F Eastern Lake Huron 186 5% 12% 82% Very high

55
Prov. ID Sub-drainage n < 12 12-32 >32 Probability
of Survival
ON 05R Eastern Lake Winnipeg 130 86% 11% 3% Very low
ON 04E Ekwan - Coast 10 0% 90% 10% High
ON 05Q English 765 86% 14% 0% Very low
ON 20 Great Lakes and St. Lawrence 39 38% 33% 28% Very high
ON 04N Harricanaw - Coast 77 91% 8% 1% Very low
ON 04A Hayes (Man.) 17 12% 82% 6% High
ON 04J Kenogami 314 13% 65% 22% High
ON 02H Lake Ontario and Niagara Peninsula
539 55% 27% 18% High
ON 04H Lower Albany - Coast 3 100% 0% 0% Very low
ON 02L Lower Ottawa 503 82% 14% 4% Very low
ON 04L Missinaibi-Mattagami 646 51% 43% 6% High
ON 04K Moose (Ont.) 16 50% 50% 0% High
ON 02B Northeastern Lake Superior 649 70% 28% 2% High
ON 02G Northern Lake Erie 95 2% 20% 78% Very high
ON 02C Northern Lake Huron 850 96% 4% 0% Very low
ON 02A Northwestern Lake Superior 347 64% 32% 4% High
ON 04C Severn 77 43% 57% 0% High
ON 04G Upper Albany 229 72% 27% 1% High
ON 02J Upper Ottawa 854 89% 10% 1% Very low
ON 02M Upper St. Lawrence 89 25% 51% 25% High
ON 02D Wanipitai and French (Ont.) 374 94% 5% 0% Very low
ON 04D Winisk - Coast 45 42% 56% 2% High
ON 05P Winnipeg 955 81% 17% 2% Very low
QC 04M Abitibi 388 44% 47% 9% High
QC 02S Betsiamites - Coast 105 100% 0% 0% Very low
QC 03B Broadback and Rupert 92 90% 10% 0% Very low
QC 03L Caniapiscau 10 100% 0% 0% Very low
QC 02K Central Ottawa 1098 70% 22% 8% High
QC 02O Central St. Lawrence 251 61% 31% 8% High
QC 03O Churchill (Nfld.) 1 100% 0% 0% Very low
QC 03M Eastern Ungava Bay 78 100% 0% 0% Very low
QC 03C Eastmain 6 100% 0% 0% Very low
QC 20 Great Lakes and St. Lawrence 39 38% 33% 28% Very high
QC 02W Gulf of St. Lawrence - Natashquan 42 93% 2% 5% Very low
QC 02V Gulf of St. Lawrence - Romaine 39 100% 0% 0% Very low
QC 01B Gulf of St. Lawrence and Northern Bay of Fundy (N.B.)
37 19% 59% 22% High
QC 04N Harricanaw - Coast 77 91% 8% 1% Very low
QC 03D La Grande - Coast 1 100% 0% 0% Very low
QC 02L Lower Ottawa 503 82% 14% 4% Very low
QC 02P Lower St. Lawrence 385 95% 5% 1% Very low
QC 02T Manicouagan and aux Outardes 92 100% 0% 0% Very low
QC 02U Moisie and St. Lawrence Estuary 61 100% 0% 0% Very low
QC 02Q Northern Gaspé Peninsula 41 20% 66% 15% High
QC 03A Nottaway - Coast 209 97% 3% 0% Very low
QC 02X Petit Mécatina and Strait of Belle Isle
5 100% 0% 0% Very low
QC 02R Saguenay 343 99% 1% 0% Very low
QC 01A Saint John and Southern Bay of 35 34% 57% 9% High

56
Prov. ID Sub-drainage n < 12 12-32 >32 Probability
of Survival
Fundy (N.B.)
QC 02N Saint-Maurice 313 100% 0% 0% Very low
QC 02J Upper Ottawa 854 89% 10% 1% Very low
QC 02M Upper St. Lawrence 89 25% 51% 25% High
SK 05M Assiniboine 135 0% 18% 82% Very high
SK 05F Battle 15 20% 53% 27% High
SK 06A Beaver (Alta.-Sask.) 47 6% 74% 19% High
SK 07C Central Athabasca - Lower 19 21% 63% 16% High
SK 06E Central Churchill (Man.) - Lower 68 50% 19% 31% Very high
SK 06C Central Churchill (Man.) - Upper 1 0% 100% 0% High
SK 05E Central North Saskatchewan 45 11% 62% 27% Very high
SK 07L Fond-du-Lac 1 100% 0% 0% Very low
SK 07Q Great Slave Lake - East Arm South Shore
2 100% 0% 0% Very low
SK 71 Lake Athabasca 2 50% 50% 0% High
SK 07M Lake Athabasca - Shores 6 100% 0% 0% Very low
SK 05L Lake Winnipegosis and Lake Manitoba
105 0% 7% 93% Very high
SK 07D Lower Athabasca 37 41% 51% 8% High
SK 05G Lower North Saskatchewan 5 40% 40% 20% High
SK 05H Lower South Saskatchewan 42 0% 0% 100% Very high
SK 11A Missouri 3 0% 67% 33% Very high
SK 05J Qu'Appelle 40 0% 3% 98% Very high
SK 05C Red Deer 35 14% 37% 49% Very high
SK 06D Reindeer 1 100% 0% 0% Very low
SK 05K Saskatchewan 156 0% 48% 52% Very high
SK 05N Souris 35 0% 9% 91% Very high
SK 06B Upper Churchill (Man.) 1 0% 100% 0% High
SK 05A Upper South Saskatchewan 52 0% 42% 58% Very high
YT 08A Alsek 5 0% 60% 40% Very high
YT 10B Central Liard 14 43% 36% 21% High
YT 09A Headwaters Yukon 38 61% 37% 3% High
YT 10A Upper Liard 23 30% 48% 22% High

57
Table 13. Probability of Quagga Mussel arrival, survival, and invasion per sub-drainage. The probability of invasion is based on the probability of survival (calcium suitability) and probability of arrival (propagule pressure corrected for proximity to an invaded watershed). The risk to the environment is based on the probability of invasion and impacts to the environment.
Prov. ID Sub-drainage
Probability
of Survival
Propagule
Pressure
Prox
corr.
Probability
of Arrival
Probability of
Invasion
Risk to
Environment
AB 05F Battle High High 0 High High High
AB 06A Beaver (Alta.-Sask.) High Moderate 0 Moderate High High
AB 05B Bow Very high High 0 High Very high High
AB 07C Central Athabasca - Lower High Low 0 Low Moderate High
AB 07B Central Athabasca - Upper High Moderate 0 Moderate High High
AB 05E Central North Saskatchewan Very high High 0 High Very high High
AB 07J Central Peace - Lower High Low 0 Low Moderate High
AB 07H Central Peace - Upper Very high Low 0 Low High High
AB 08N Columbia - U.S.A. Very high Moderate 0 Moderate High High
AB 10C Fort Nelson Very high Low 0 Low High High
AB 07Q Great Slave Lake - East Arm South Shore Very low Very low 0 Very low Very low Low
AB 07O Hay Very high Low 0 Low High High
AB 71 Lake Athabasca High Very low 0 Very low Moderate High
AB 07M Lake Athabasca - Shores Very low Very low 0 Very low Very low Low
AB 07D Lower Athabasca High Very low 0 Very low Moderate High
AB 05G Lower North Saskatchewan High High 0 High High High
AB 07K Lower Peace Very low Very low 0 Very low Very low Low
AB 05H Lower South Saskatchewan Very high High 0 High Very high High
AB 11A Missouri Very high Moderate 0 Moderate High High
AB 05C Red Deer Very high High 0 High Very high High
AB 07N Slave Very low Low 0 Low Very low Low
AB 07G Smoky Very high Moderate 0 Moderate High High
AB 07P Southern Great Slave Lake High Very low 0 Very low Moderate High
AB 07A Upper Athabasca Very high Moderate 0 Moderate High High
AB 06B Upper Churchill (Man.) High Very low 0 Very low Moderate High
AB 08K Upper Fraser Very high Low 0 Low High High
AB 05D Upper North Saskatchewan High Moderate 0 Moderate High High
AB 07F Upper Peace Very high Moderate 0 Moderate High High
AB 05A Upper South Saskatchewan Very high Moderate 0 Moderate High High
BC 08A Alsek Very high Low 0 Low High High
BC 05B Bow Very high High 0 High Very high High

58
Prov. ID Sub-drainage
Probability
of Survival
Propagule
Pressure
Prox
corr.
Probability
of Arrival
Probability of
Invasion
Risk to
Environment
BC 08F Central Coastal Waters of B.C. Very low Low 0 Low Very low Low
BC 10B Central Liard High Very low 0 Very low Moderate High
BC 08N Columbia - U.S.A. Very high Moderate 0 Moderate High High
BC 10C Fort Nelson Very high Low 0 Low High High
BC 07O Hay Very high Low 0 Low High High
BC 09A Headwaters Yukon High Low 0 Low Moderate High
BC 08M Lower Fraser High Moderate 0 Moderate High High
BC 08D Nass - Coast High Low 0 Low Moderate High
BC 08J Nechako High Low 0 Low Moderate High
BC 08B Northern Coastal Waters of B.C. High Low 0 Low Moderate High
BC 08O Queen Charlotte Islands Very low Moderate 0 Moderate Very low Low
BC 08E Skeena - Coast High Low 0 Low Moderate High
BC 07G Smoky Very high Moderate 0 Moderate High High
BC 08G Southern Coastal Waters of B.C. Very low Low 0 Low Very low Low
BC 08C Stikine - Coast High Low 0 Low Moderate High
BC 08L Thompson Very high Moderate 0 Moderate High High
BC 07A Upper Athabasca Very high Moderate 0 Moderate High High
BC 08K Upper Fraser Very high Low 0 Low High High
BC 10A Upper Liard High Low 0 Low Moderate High
BC 05D Upper North Saskatchewan High Moderate 0 Moderate High High
BC 07F Upper Peace Very high Moderate 0 Moderate High High
BC 05A Upper South Saskatchewan Very high Moderate 0 Moderate High High
BC 08H Vancouver Island Very low Moderate 0 Moderate Very low Low
BC 07E Williston Lake High Low 0 Low Moderate High
MB 05M Assiniboine Very high High 0 High Very high High
MB 06E Central Churchill (Man.) - Lower Very high Very low 0 Very low Moderate High
MB 05R Eastern Lake Winnipeg Very low Very low 1 Low Very low Low
MB 05T Grass and Burntwood High Low 0 Low Moderate High
MB 04A Hayes (Man.) High Very low 0 Very low Moderate High
MB 50 Lake Winnipeg Very high Low 0 Low High High
MB 05L Lake Winnipegosis and Lake Manitoba Very high Moderate 0 Moderate High High
MB 06F Lower Churchill (Man.) High Very low 0 Very low Moderate High
MB 05U Nelson Very high Very low 0 Very low Moderate High
MB 05J Qu'Appelle Very high High 0 High Very high High
MB 05O Red Very high High 1 Very high Very high High

59
Prov. ID Sub-drainage
Probability
of Survival
Propagule
Pressure
Prox
corr.
Probability
of Arrival
Probability of
Invasion
Risk to
Environment
MB 06D Reindeer Very low Very low 0 Very low Very low Low
MB 05K Saskatchewan Very high Moderate 0 Moderate High High
MB 04C Severn High Very low 0 Very low Moderate High
MB 05N Souris Very high High 0 High Very high High
MB 05S Western Lake Winnipeg Very high Moderate 1 High Very high High
MB 05P Winnipeg Very low Moderate 1 High Very low Low
NL 03L Caniapiscau Very low Very low 1 Low Very low Low
NL 03O Churchill (Nfld.) Very low Low 1 Moderate Very low Low
NL 03M Eastern Ungava Bay Very low Low 0 Low Very low Low
NL 02W Gulf of St. Lawrence - Natashquan Very low Low 1 Moderate Very low Low
NL 02V Gulf of St. Lawrence - Romaine Very low Very low 1 Low Very low Low
NL 02U Moisie and St. Lawrence Estuary Very low Low 1 Moderate Very low Low
NL 02X Petit Mécatina and Strait of Belle Isle Very low Low 0 Low Very low Low
NT 10B Central Liard High Very low 0 Very low Moderate High
NT 07L Fond-du-Lac Very low Very low 0 Very low Very low Low
NT 07Q Great Slave Lake - East Arm South Shore Very low Very low 0 Very low Very low Low
NT 07O Hay Very high Low 0 Low High High
NT 07N Slave Very low Low 0 Low Very low Low
NT 07P Southern Great Slave Lake High Very low 0 Very low Moderate High
NT 10A Upper Liard High Low 0 Low Moderate High
ON 04M Abitibi High Moderate 1 High High High
ON 04F Attawapiskat - Coast High Very low 0 Very low Moderate High
ON 02K Central Ottawa High Moderate 1 High High High
ON 02E Eastern Georgian Bay Very low High 1 Very high Very low Low
ON 02F Eastern Lake Huron Very high Very high 1 Very high Very high High
ON 05R Eastern Lake Winnipeg Very low Very low 1 Low Very low Low
ON 04E Ekwan - Coast High Very low 0 Very low Moderate High
ON 05Q English Very low Low 1 Moderate Very low Low
ON 20 Great Lakes and St. Lawrence Very high Very high 1 Very high Very high High
ON 04N Harricanaw - Coast Very low Low 1 Moderate Very low Low
ON 04A Hayes (Man.) High Very low 0 Very low Moderate High
ON 04J Kenogami High Low 1 Moderate High High
ON 02H Lake Ontario and Niagara Peninsula High Very high 1 Very high Very high High
ON 04H Lower Albany - Coast Very low Very low 0 Very low Very low Low
ON 02L Lower Ottawa Very low High 1 Very high Very low Low

60
Prov. ID Sub-drainage
Probability
of Survival
Propagule
Pressure
Prox
corr.
Probability
of Arrival
Probability of
Invasion
Risk to
Environment
ON 04L Missinaibi-Mattagami High Moderate 1 High High High
ON 04K Moose (Ont.) High Very low 1 Low Moderate High
ON 02B Northeastern Lake Superior High Low 1 Moderate High High
ON 02G Northern Lake Erie Very high Very high 1 Very high Very high High
ON 02C Northern Lake Huron Very low Moderate 1 High Very low Low
ON 02A Northwestern Lake Superior High Moderate 1 High High High
ON 04C Severn High Very low 0 Very low Moderate High
ON 04G Upper Albany High Very low 1 Low Moderate High
ON 02J Upper Ottawa Very low Moderate 1 High Very low Low
ON 02M Upper St. Lawrence High High 1 Very high Very high High
ON 02D Wanipitai and French (Ont.) Very low Moderate 1 High Very low Low
ON 04D Winisk - Coast High Very low 0 Very low Moderate High
ON 05P Winnipeg Very low Moderate 1 High Very low Low
QC 04M Abitibi High Moderate 1 High High High
QC 02S Betsiamites - Coast Very low Low 1 Moderate Very low Low
QC 03B Broadback and Rupert Very low Low 1 Moderate Very low Low
QC 03L Caniapiscau Very low Very low 1 Low Very low Low
QC 02K Central Ottawa High Moderate 1 High High High
QC 02O Central St. Lawrence High Very high 1 Very high Very high High
QC 03O Churchill (Nfld.) Very low Low 1 Moderate Very low Low
QC 03M Eastern Ungava Bay Very low Low 0 Low Very low Low
QC 03C Eastmain Very low Low 1 Moderate Very low Low
QC 20 Great Lakes and St. Lawrence Very high Very high 1 Very high Very high High
QC 02W Gulf of St. Lawrence - Natashquan Very low Low 1 Moderate Very low Low
QC 02V Gulf of St. Lawrence - Romaine Very low Very low 1 Low Very low Low
QC 01B Gulf of St. Lawrence and Northern Bay of Fundy (N.B.) High High 1 Very high Very high High
QC 04N Harricanaw - Coast Very low Low 1 Moderate Very low Low
QC 03D La Grande - Coast Very low Low 1 Moderate Very low Low
QC 02L Lower Ottawa Very low High 1 Very high Very low Low
QC 02P Lower St. Lawrence Very low High 1 Very high Very low Low
QC 02T Manicouagan and aux Outardes Very low Low 1 Moderate Very low Low
QC 02U Moisie and St. Lawrence Estuary Very low Low 1 Moderate Very low Low
QC 02Q Northern Gaspé Peninsula High High 1 Very high Very high High
QC 03A Nottaway - Coast Very low Low 1 Moderate Very low Low
QC 02X Petit Mécatina and Strait of Belle Isle Very low Low 0 Low Very low Low

61
Prov. ID Sub-drainage
Probability
of Survival
Propagule
Pressure
Prox
corr.
Probability
of Arrival
Probability of
Invasion
Risk to
Environment
QC 02R Saguenay Very low Moderate 1 High Very low Low
QC 01A Saint John and Southern Bay of Fundy (N.B.) High High 1 Very high Very high High
QC 02N Saint-Maurice Very low Moderate 1 High Very low Low
QC 02J Upper Ottawa Very low Moderate 1 High Very low Low
QC 02M Upper St. Lawrence High High 1 Very high Very high High
SK 05M Assiniboine Very high High 0 High Very high High
SK 05F Battle High High 0 High High High
SK 06A Beaver (Alta.-Sask.) High Moderate 0 Moderate High High
SK 07C Central Athabasca - Lower High Low 0 Low Moderate High
SK 06E Central Churchill (Man.) - Lower Very high Very low 0 Very low Moderate High
SK 06C Central Churchill (Man.) - Upper High Low 0 Low Moderate High
SK 05E Central North Saskatchewan Very high High 0 High Very high High
SK 07L Fond-du-Lac Very low Very low 0 Very low Very low Low
SK 07Q Great Slave Lake - East Arm South Shore Very low Very low 0 Very low Very low Low
SK 71 Lake Athabasca High Very low 0 Very low Moderate High
SK 07M Lake Athabasca - Shores Very low Very low 0 Very low Very low Low
SK 05L Lake Winnipegosis and Lake Manitoba Very high Moderate 0 Moderate High High
SK 07D Lower Athabasca High Very low 0 Very low Moderate High
SK 05G Lower North Saskatchewan High High 0 High High High
SK 05H Lower South Saskatchewan Very high High 0 High Very high High
SK 11A Missouri Very high Moderate 0 Moderate High High
SK 05J Qu'Appelle Very high High 0 High Very high High
SK 05C Red Deer Very high High 0 High Very high High
SK 06D Reindeer Very low Very low 0 Very low Very low Low
SK 05K Saskatchewan Very high Moderate 0 Moderate High High
SK 05N Souris Very high High 0 High Very high High
SK 06B Upper Churchill (Man.) High Very low 0 Very low Moderate High
SK 05A Upper South Saskatchewan Very high Moderate 0 Moderate High High
YT 08A Alsek Very high Low 0 Low High High
YT 10B Central Liard High Very low 0 Very low Moderate High
YT 09A Headwaters Yukon High Low 0 Low Moderate High
YT 10A Upper Liard High Low 0 Low Moderate High

62
FIGURES
Figure 1. Freshwater drainages used in the risk assessment of three dreissenid mussels. Sub-drainages are identified by three-digit identifiers and hatched watersheds were excluded. See Appendices A4 and A5 for close-ups of provinces. Source: Natural Resources Canada.

63
Figure 2. Quagga Mussels (Dreissena rostriformis bugensis) (1-6) and Zebra Mussels (Dreissena polymorpha) (7-9) collected from the River Main (Germany). From: Van der Velde, G. and Platvoet, D. 2007

64
Figure 3. Comparison of shell structures of the Zebra Mussel (Dreissena polymporha) and the Quagga Mussel (D. rostriformis bugensis). Source: United States Geological Survey
.

65
Figure 4. Comparison of Zebra Mussel (upper) and Dark Falsemussel (lower) shells. From: Verween, A., Vincx, M. and Degraer, S. 2010.

66
Figure 5. Framework for the restructuring of food webs by Zebra Mussel and Quagga Mussel. Arrows represent the direction of energy flow. Bold lines and plus symbols (+) represent increased fluxes, while minus symbols (-) represent decreased fluxes. Modified from Higgins (in press).
Planktivorous & Benthivorous
fish
Piscivorous fish
Zebra and Quagga Mussels
Nutrients
Phytoplankton
Zooplankton & Profundal
zoobenethos
Littoral zoobenthos
Periphyton & Macrophytes
+
-
+
+
+
+
+
+
+
+
-
-
-
Pelagic-Profundal
Pathway
Benthic-Littoral
Pathway
Energy & Nutrient Flux
Water-column & Profundal
bacteria
Littoral-sediment bacteria
+
+
-
-
+ -

67
Figure 6. Reported sightings of adult Zebra Mussels between 1986 and 2011 in North America. Data obtained from the US Geological Society (Benson et al., 2012a).

68
Figure 7. Reported sightings of adult Quagga Mussels between 1986 and 2011 in North America. Data obtained from the US Geological Society (Benson et al., 2012b).

69
Figure 8. Flow diagram of risk assessment process for Zebra Mussel and Quagga Mussel invasion into Canadian Freshwaters.
Step 3
Step 2
Step 1
Calcium
Suitability
Temperature
Tolerance
(correction factor)
Proximity to
Invaded Habitats
(correction factor)
Propagule
Pressure
Probability of
Survival
Probability of
Arrival
Risk to
Environment
Probability of
Invasion
Impact to
Environment

70
Imp
act
to E
nv
iro
nm
en
t
Very High
High
Moderate
Low
Very Low
Very Low Low Moderate High Very High
Probability of Invasion
Figure 9. Heat (risk) matrix used to determine the ecological risk posed by three dreissenid species for six Canadian provinces (BC, AB, SK, MB, ON, QC). The risk to the environment is calculated by combining the probability of invasion determined in Step 1 with the impacts of invasion determined in Step 2. In the matrix risk to the environment is: Green = Low Risk, Yellow = Moderate Risk, and Red = High Risk.

71
Figure 10. Calcium concentrations (mg/L, 75th percentile) per sub-drainage. Sub-drainages were ranked on their suitability for Zebra Mussel
survival based on calcium concentrations required to develop their shells: (< 12 mg/L = very low (pale green); 12-19 mg/L = moderate (yellow); 20-25 mg/L = high (orange); > 25 mg/L = very high (red)). See Annex A1 for calcium concentrations per sub-sub-drainage. Hatched watersheds had less than 5 sampling sites.

72
Figure 11. Temperature correction factor based on mean air temperature of the warmest quarter per sub-drainage where red colored sub-drainages had calcium suitability reduced by one category. Data obtained from Worldclim (http://www.worldclim.org/).

73
Figure 12. Probability of survival (habitat suitability) for Zebra Mussel per sub-drainage based on calcium concentrations (mg/L, 75th percentile) and
corrected for temperature. Hatched watersheds had less than 5 sampling sites.

74
Figure 13. Propagule pressure derived from the Human Footprint Index per Canadian sub-drainage (modified from Sanderson et al. 2002). The index is a composite factor of human influence corrected by biome type that integrates data of land use, urbanization, population density, transportation networks and other human activities that are known to facilitate species invasions. Values are color coded from low (light green) to very high (red). See Annex A3 for original data.

75
Figure 14. Proximity to invaded Zebra Mussel sub-drainages.

76
Figure 15. Probability of Zebra Mussel arrival per assessed sub-drainage based on propagule pressure and proximity to invaded sub-drainages. The probability of arrival is scored as very low (pale green) to very high (red).

77
Figure 16. Probability of Zebra Mussel invasion based on probability of survival and arrival. Hatched watersheds had less than 5 sampling sites.

78
Figure 17. Zebra Mussel ecological risk per sub-drainage, ranging from low to high. Risk is based on probability of invasion and impacts on the environment. Hatched watersheds had less than 5 sampling sites.
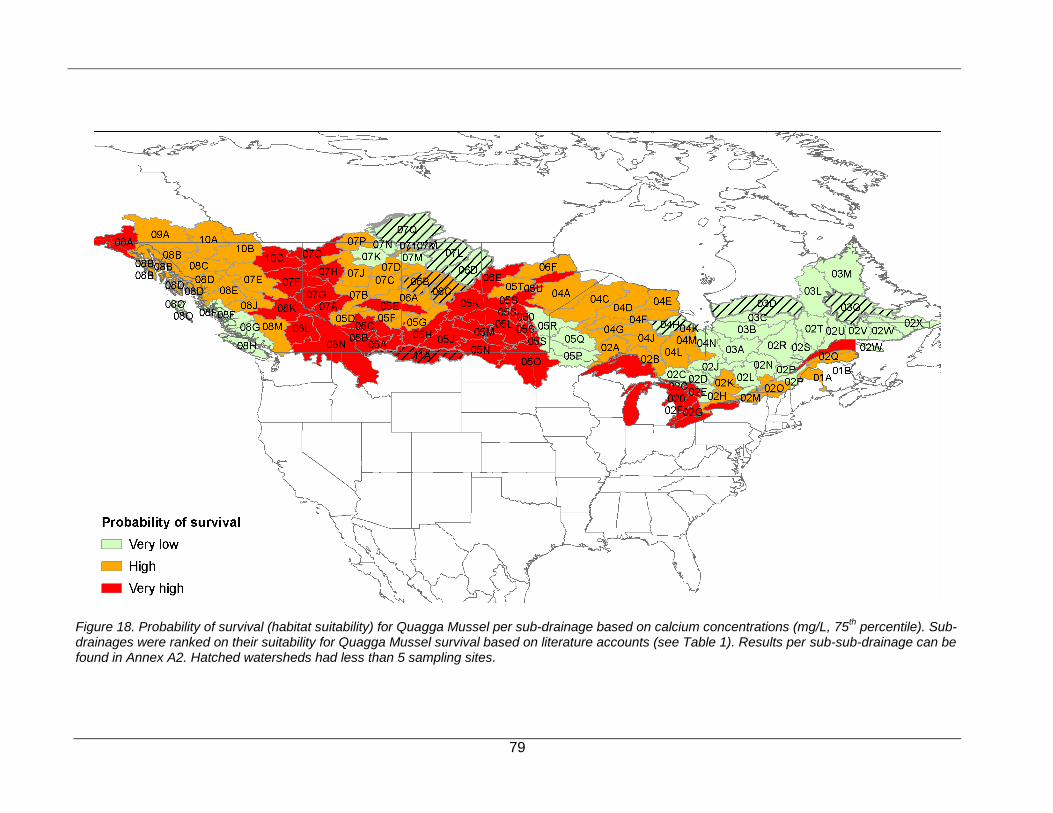
79
Figure 18. Probability of survival (habitat suitability) for Quagga Mussel per sub-drainage based on calcium concentrations (mg/L, 75th percentile). Sub-
drainages were ranked on their suitability for Quagga Mussel survival based on literature accounts (see Table 1). Results per sub-sub-drainage can be found in Annex A2. Hatched watersheds had less than 5 sampling sites.

80
Figure 19. Affected and adjoining Canadian sub-drainages where Quagga Mussel sightings have been reported in North America.
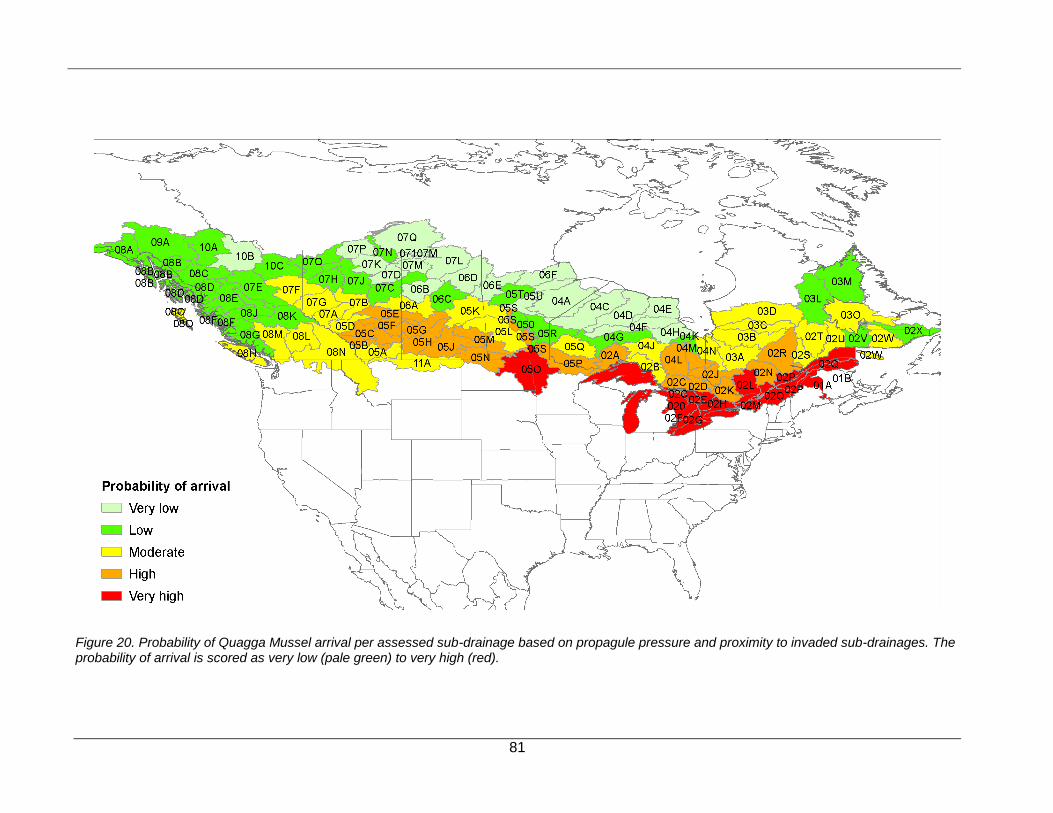
81
Figure 20. Probability of Quagga Mussel arrival per assessed sub-drainage based on propagule pressure and proximity to invaded sub-drainages. The probability of arrival is scored as very low (pale green) to very high (red).

82
Figure 21. Probability of Quagga Mussel invasion based on probability of survival and arrival. Hatched watersheds had less than 5 sampling sites.

83
Figure 22. Quagga Mussel ecological risk per sub-drainage, ranging from low to high. Risk is based on probability of invasion and impacts on the environment. Hatched watersheds had less than 5 sampling sites.

84
APPENDICES
Figure A1. Calcium concentrations (mg/L, 75th percentile) per sub-sub-drainage. Sub-sub-drainages were ranked on their suitability for Zebra Mussel
survival based on literature accounts: (< 12 mg/L = very low (pale green); 12-19 mg/L = moderate (orange); 20-25 mg/L = high (orange); > 25 mg/L = very high (red)). Hatched sub-drainages had less than 5 sampling sites.

85
Figure A2. Calcium concentrations (mg/L, 75th percentile) per sub-sub-drainage. Sub-sub-drainages were ranked on their suitability for Quagga
Mussel survival based on literature accounts: (< 12 mg/L = very low (pale green); 12-32 mg/L = high (orange); > 32 mg/L = very high (red)). Hatched watersheds had less than 5 sampling sites.

86
Figure A3. The Human Footprint Index (Sanderson et al. 2002; see http://sedac.ciesin.columbia.edu/wildareas/), is a composite factor of human influence corrected by biome type that integrates data of land use, urbanization, population density, transportation networks and other human activities that are known to facilitate species invasions.

87
Figure A4. Freshwater sub-drainages in British-Columbia, Alberta, and Saskatchewan. Sub-drainages are identified by three-digit identifiers. Source: Natural Resources Canada.

88
Figure A5. Freshwater sub-drainages in Manitoba, Ontario, and Quebec. Sub-drainages are identified by three-digit identifiers. Source: Natural Resources Canada.


![Early detection of dreissenid species: Zebra/Quagga ... · The adult zebra mussel [Dreissena poly-morpha (Pallas, 1771)] has a definite angle, or carina, between the ventral and dorsal](https://img.dokumen.tips/doc/110x75/5ede0616ad6a402d666949c7/early-detection-of-dreissenid-species-zebraquagga-the-adult-zebra-mussel-dreissena.jpg)