Embed Size (px)
Citation preview

1
Risk and uncertainty in the foreign exchange market
Saskia ter Ellen1
Erasmus School of Economics
Erasmus University Rotterdam
Willem F.C. Verschoor
Erasmus School of Economics
Erasmus University Rotterdam
Remco C.J. Zwinkels
Erasmus School of Economics
Erasmus University Rotterdam
August 2012
Abstract
In this paper we investigate how volatility and uncertainty affect the foreign exchange
market. First we present a theoretical framework to show how volatility and uncertainty
affect risk and risk premia in the foreign exchange market. Based on this framework, we use
different measures of risk and risk premia to empirically examine the relation between risk,
expected volatility and uncertainty of foreign exchange returns. We find that expected
volatility and uncertainty have a significant positive effect on implied volatility, the volatility
risk premium and the expected return risk premium. We find that volatility of and uncertainty
about short term interest rates are the main drivers of this relationship, as well as
disagreement on several other exchange-related fundamentals. In light of the ongoing
discussion whether or not to treat the foreign exchange market as an asset market, our
findings indicate that the foreign exchange market has some properties in common with other
asset markets, but that macro-economic fundamentals also matter.
Keywords:
[foreign exchange market risk, disagreement, expectations, forward premium puzzle, survey
data]
JEL classification codes: G12, G15
1 Corresponding author: S. ter Ellen, Erasmus School of Economics, Erasmus University Rotterdam, P.O. Box
1738 3000 DR Rotterdam, The Netherlands. T: +31 10 408 12 85, E: [email protected].
2
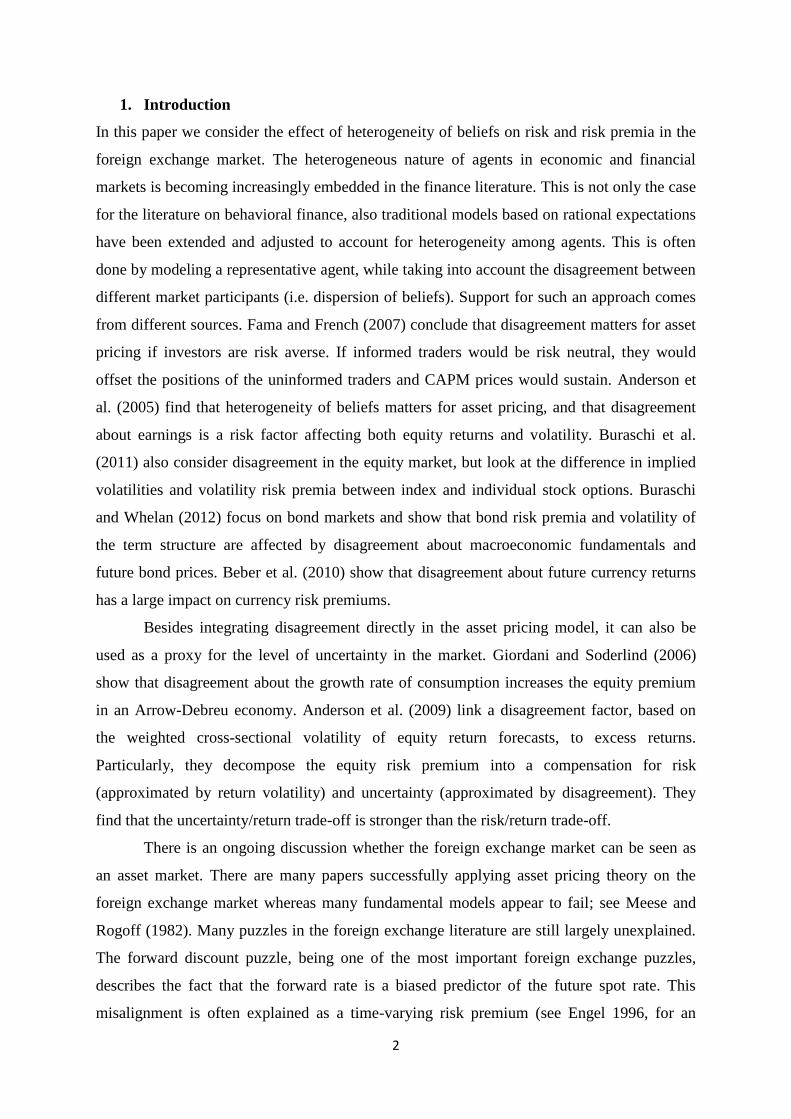
1. Introduction
In this paper we consider the effect of heterogeneity of beliefs on risk and risk premia in the
foreign exchange market. The heterogeneous nature of agents in economic and financial
markets is becoming increasingly embedded in the finance literature. This is not only the case
for the literature on behavioral finance, also traditional models based on rational expectations
have been extended and adjusted to account for heterogeneity among agents. This is often
done by modeling a representative agent, while taking into account the disagreement between
different market participants (i.e. dispersion of beliefs). Support for such an approach comes
from different sources. Fama and French (2007) conclude that disagreement matters for asset
pricing if investors are risk averse. If informed traders would be risk neutral, they would
offset the positions of the uninformed traders and CAPM prices would sustain. Anderson et
al. (2005) find that heterogeneity of beliefs matters for asset pricing, and that disagreement
about earnings is a risk factor affecting both equity returns and volatility. Buraschi et al.
(2011) also consider disagreement in the equity market, but look at the difference in implied
volatilities and volatility risk premia between index and individual stock options. Buraschi
and Whelan (2012) focus on bond markets and show that bond risk premia and volatility of
the term structure are affected by disagreement about macroeconomic fundamentals and
future bond prices. Beber et al. (2010) show that disagreement about future currency returns
has a large impact on currency risk premiums.
Besides integrating disagreement directly in the asset pricing model, it can also be
used as a proxy for the level of uncertainty in the market. Giordani and Soderlind (2006)
show that disagreement about the growth rate of consumption increases the equity premium
in an Arrow-Debreu economy. Anderson et al. (2009) link a disagreement factor, based on
the weighted cross-sectional volatility of equity return forecasts, to excess returns.
Particularly, they decompose the equity risk premium into a compensation for risk
(approximated by return volatility) and uncertainty (approximated by disagreement). They
find that the uncertainty/return trade-off is stronger than the risk/return trade-off.
There is an ongoing discussion whether the foreign exchange market can be seen as
an asset market. There are many papers successfully applying asset pricing theory on the
foreign exchange market whereas many fundamental models appear to fail; see Meese and
Rogoff (1982). Many puzzles in the foreign exchange literature are still largely unexplained.
The forward discount puzzle, being one of the most important foreign exchange puzzles,
describes the fact that the forward rate is a biased predictor of the future spot rate. This
misalignment is often explained as a time-varying risk premium (see Engel 1996, for an

3
overview of the related literature). Whether we can indeed regard this misalignment as a risk
premium or should blame investors’ irrational beliefs is ambiguous. Based on forecasts
obtained from a survey, Froot and Frankel (1989) conclude that the bias is almost entirely
explained by the biased beliefs of investors. However, Cavaglia et al. (1994) find, with a
different dataset and methodology, that the forward discount puzzle is a result of both biased
beliefs and the occurrence of time-varying risk premia.
Several authors have linked dispersion in believes to the foreign exchange puzzles.
Fisher (2006) proposes a model where the foreign exchange forward premium depends on the
diversity of prior beliefs about a country’s inflation process. Gourinchas and Tornell (2004)
propose a solution for both the forward premium puzzle and the delayed overshooting puzzle
based on investor’s distorted beliefs about interest rates. Besides risk, uncertainty, and time-
varying net risk aversion there are other factors affecting and/or explaining the foreign
exchange risk premium. Various authors have shown that carry trade, or the sign of the yield
differential, is driving the premium (Brunnermeier et al., 2008; Sarno et al., 2012; Lustig et
al., 2012). According to, among others, Lustig and Verdelhan (2007) the state of the U.S.
economy and U.S. consumption growth are main determinants. A more microstructure
approach is offered in a number of papers (Tien, 2002; Klitgaard and Weir, 2004; Wang,
2004) where they consider the risk premium as an insurance premium. Hedgers participate in
the currency futures market to reduce risk of currency movements, whereas speculators
participate to gain from currency movements. Therefore, hedgers are willing to pay
speculators a risk premium to share their currency exposure risk. Finally, Engel and West
(2005) argue that fundamentals matter as an explanation for currency risk prima.
In this paper, we combine literature on exchange rates, equity returns and uncertainty
to see how risk and risk premia in the foreign exchange market are related to (expected)
volatility and uncertainty. Expected volatility is measured by rolling historical volatility with
matching window, and uncertainty is measured as disagreement among investors. We relate
these variables to the expected return risk premium - defined as the expected return in excess
of the forward premium, implied volatility, and the volatility risk premium - which is a
measure of risk aversion. In this way we investigate both the risk premium itself and its
components – risk and risk aversion. We find that all three measures are positively related to
volatility and uncertainty, and that uncertainty is more important for the risk aversion of
investors than volatility. After investigating the sources of this relation, we discover that risk
in foreign exchange markets is correlated with volatility and uncertainty of future interest
rates. Moreover, uncertainty about certain macro fundamentals such as the future current

4
account balance and GDP are also very important in explaining risk in the foreign exchange
market. This is supportive evidence for the literature trying to link exchange rate movements
with fundamentals.
This paper contributes to the current literature in various ways. First of all, we adopt a
framework from the literature on equity returns and inflation expectations and apply it to the
foreign exchange market. Our results show that this asset market approach for the foreign
exchange market is successful. Moreover, we demonstrate that even though the FX market
has certain features in common with other asset markets, trade-related fundamentals also
matter for the foreign exchange risk premium. In addition we have a direct and
straightforward way for measuring the expected return risk premium, using survey forecasts
proxying for investors’ expected return. This enables us to investigate the expected return risk
premium without making strict assumptions about investors’ rationality.
The remaining of the paper is set up as follows. Section 2 describes the model that links
risk premia in the foreign exchange market to expected volatility and uncertainty. It also
discusses the method of estimation and our datasets. Section 3 covers the results from
estimating the model from section 2. Based on these findings, we estimate the model using
volatility and uncertainty of fundamentals and present the results in the remainder of Section
3. Section 4 summarizes the results and discusses implications for current and future
research.
2. Model and Methodology
2.1 Expected return risk premium
Let us consider an investor borrowing in a country where interest rates are low and investing
in a country where interest rates are high. The log returns of such an investor can be
decomposed in returns from the interest differential and returns on the exchange rate
movement2:
(1)
2 At the end of the period, the investor needs to pay his loan back in the low yielding currency and therefore
benefits from an appreciation of the high yielding currency.
5
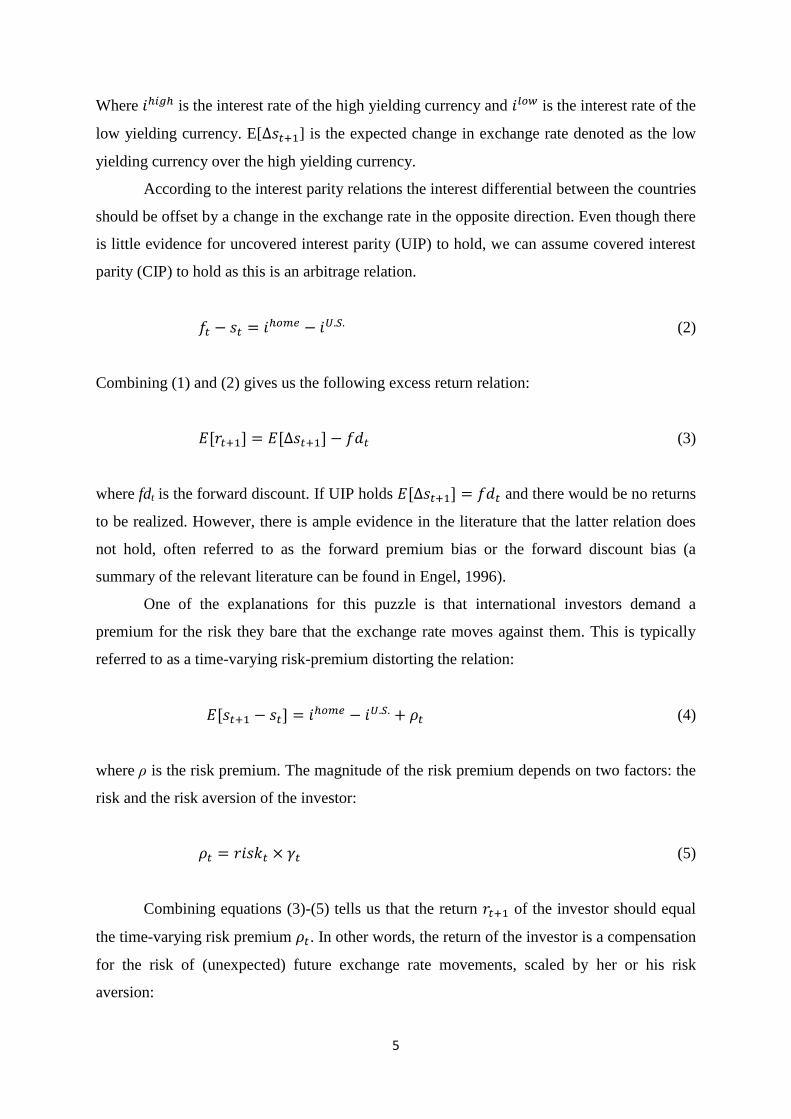
Where is the interest rate of the high yielding currency and is the interest rate of the
low yielding currency. E[ ] is the expected change in exchange rate denoted as the low
yielding currency over the high yielding currency.
According to the interest parity relations the interest differential between the countries
should be offset by a change in the exchange rate in the opposite direction. Even though there
is little evidence for uncovered interest parity (UIP) to hold, we can assume covered interest
parity (CIP) to hold as this is an arbitrage relation.
(2)
Combining (1) and (2) gives us the following excess return relation:
(3)
where fdt is the forward discount. If UIP holds and there would be no returns
to be realized. However, there is ample evidence in the literature that the latter relation does
not hold, often referred to as the forward premium bias or the forward discount bias (a
summary of the relevant literature can be found in Engel, 1996).
One of the explanations for this puzzle is that international investors demand a
premium for the risk they bare that the exchange rate moves against them. This is typically
referred to as a time-varying risk-premium distorting the relation:
(4)
where ρ is the risk premium. The magnitude of the risk premium depends on two factors: the
risk and the risk aversion of the investor:
(5)
Combining equations (3)-(5) tells us that the return of the investor should equal
the time-varying risk premium . In other words, the return of the investor is a compensation
for the risk of (unexpected) future exchange rate movements, scaled by her or his risk
aversion:
6
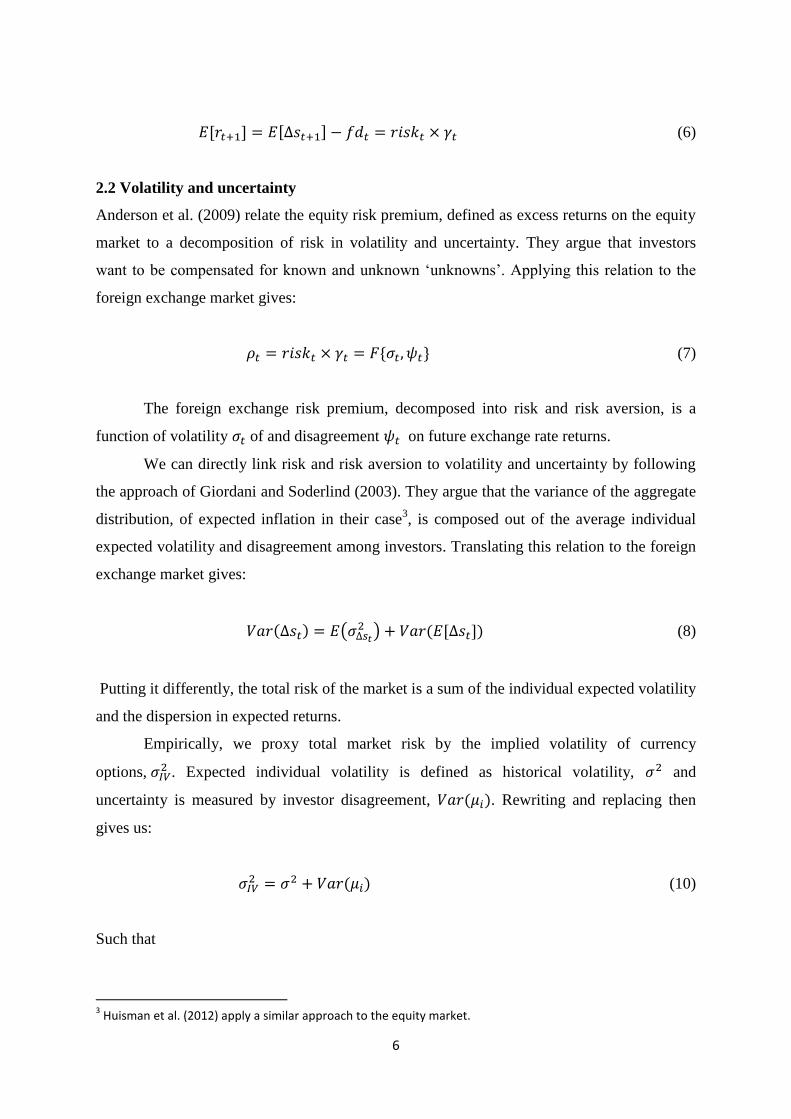
(6)
2.2 Volatility and uncertainty
Anderson et al. (2009) relate the equity risk premium, defined as excess returns on the equity
market to a decomposition of risk in volatility and uncertainty. They argue that investors
want to be compensated for known and unknown ‘unknowns’. Applying this relation to the
foreign exchange market gives:
(7)
The foreign exchange risk premium, decomposed into risk and risk aversion, is a
function of volatility of and disagreement on future exchange rate returns.
We can directly link risk and risk aversion to volatility and uncertainty by following
the approach of Giordani and Soderlind (2003). They argue that the variance of the aggregate
distribution, of expected inflation in their case3, is composed out of the average individual
expected volatility and disagreement among investors. Translating this relation to the foreign
exchange market gives:
(8)
Putting it differently, the total risk of the market is a sum of the individual expected volatility
and the dispersion in expected returns.
Empirically, we proxy total market risk by the implied volatility of currency
options, . Expected individual volatility is defined as historical volatility, and
uncertainty is measured by investor disagreement, . Rewriting and replacing then
gives us:
(10)
Such that
3 Huisman et al. (2012) apply a similar approach to the equity market.

7
(11)
where is generally considered to be the volatility risk premium (Bollerslev et al.,
2011).
In the remainder of the paper, we study the relations given by (7) to (11) empirically
in order to determine the relative importance of volatility and uncertainty for different risk
measures in the foreign exchange market. To be more specific, we estimate the following
three regressions. First the relation between implied volatility and total risk, given by (10):
(12a)
Second, we study the expected return risk premium, based on survey data of exchange
rate expectations. That is,
(12b)
Third, we examine the volatility risk premium
(12c)
3. Data & Method
3.1 Expectations and uncertainty
For a long time, expected returns were proxied by ex-post realized returns based on the
rational expectations framework, as actual expectations were not observable. This partly
changed in and after the eighties when companies like Money Market Services International
(MMSI) and Consensus Economics started to gather investors’ expectations of future asset
prices by means of surveys. Dominguez (1986) and many others after her found based on the
survey results that investor expectations and realized outcomes are seriously misaligned, both
on individual and aggregated level. When considering expected return risk premia, we
therefore choose to work with survey forecasts as a close proxy for expectations instead of
using realized returns in combination with a number of strict assumptions.
Furthermore, Giordani and Soderlind (2003) found that individuals underestimate
total risk (i.e. have too narrow confidence intervals around their point forecasts), which is

8
confirmed by Huisman et al. (2010), who find that investors only take their own risk into
account, while the total market risk is larger because of differences in point forecasts.
Therefore Giordani and Soderlind (2003) consider disagreement to be a better proxy for
market uncertainty. Although Bomberger (1996) claims that disagreement is smaller than
individual uncertainty rather than larger, he finds that the relation is linear and stable, and
therefore concludes disagreement is still a good proxy for uncertainty. When using
disagreement as a measure of uncertainty, we assume that the forecasters only disagree on the
point forecasts, and not on higher moments.
3.2 Data
For the first part of this paper, we use a dataset with monthly forecasts from financial analysts
and investors gathered by Consensus Economics®. Consensus Economics is the world’s
leading international economic survey organization and their datasets are unique in terms of
their long time span, large number of respondents, level of responding institutions, and the
disaggregate level of forecasts. Forecasts are given every month for the future value of the
dollar against the Euro and the Japanese yen 1, 3 and 12 months ahead. Our sample runs from
January 1999 to December 2009. Besides the survey data we use implied volatilities, and spot
and forward exchange rates from Thomson Reuters (obtained through Datastream).
3.3 Descriptive statistics
< Insert tables 1.1-1.4 about here >
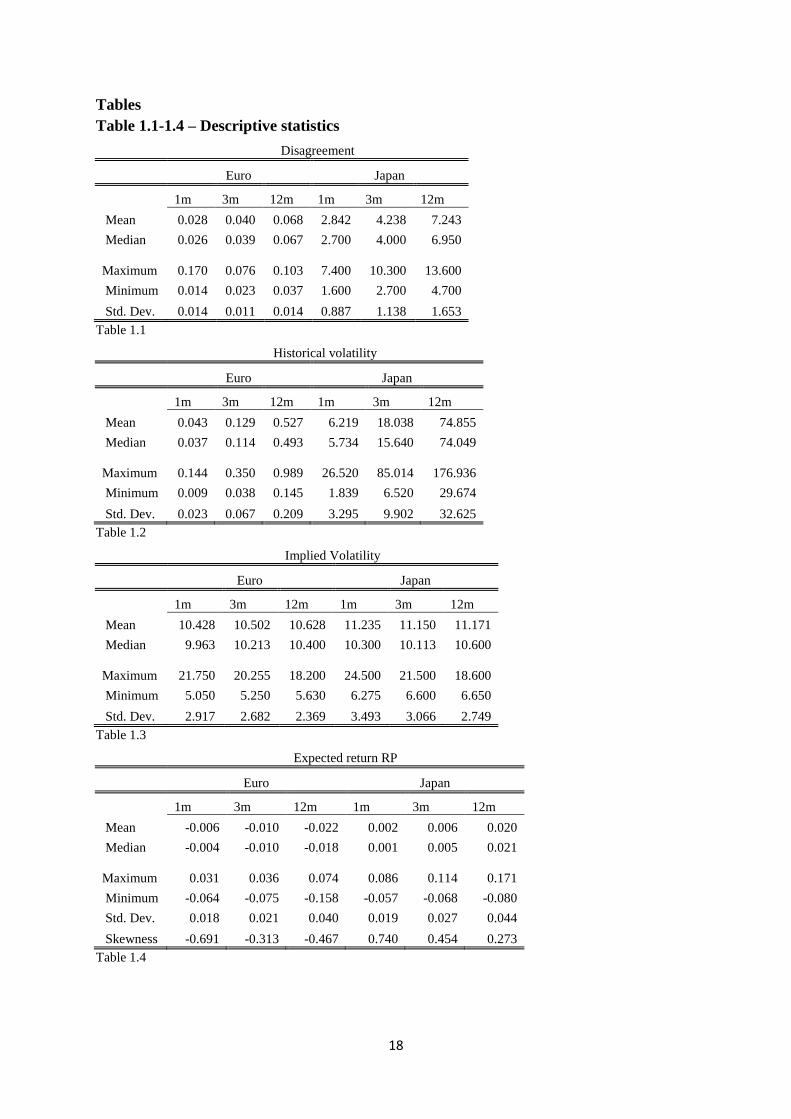
Descriptive statistics for the variables of interest are shown in Tables 1.1-1.4. We can see that
the longer the horizon, the larger the disagreement is on future values of the exchange rates.
The same goes for annualized historical volatility. The expected (log) return risk premium is
on average negative for the Euro and positive for the Japanese yen.
4. Results
4.1 FX Market
In this section we discuss the empirical analysis as a result of the theoretical implications
from previous sections. Our empirical analysis consists of linear regressions to estimate the
9
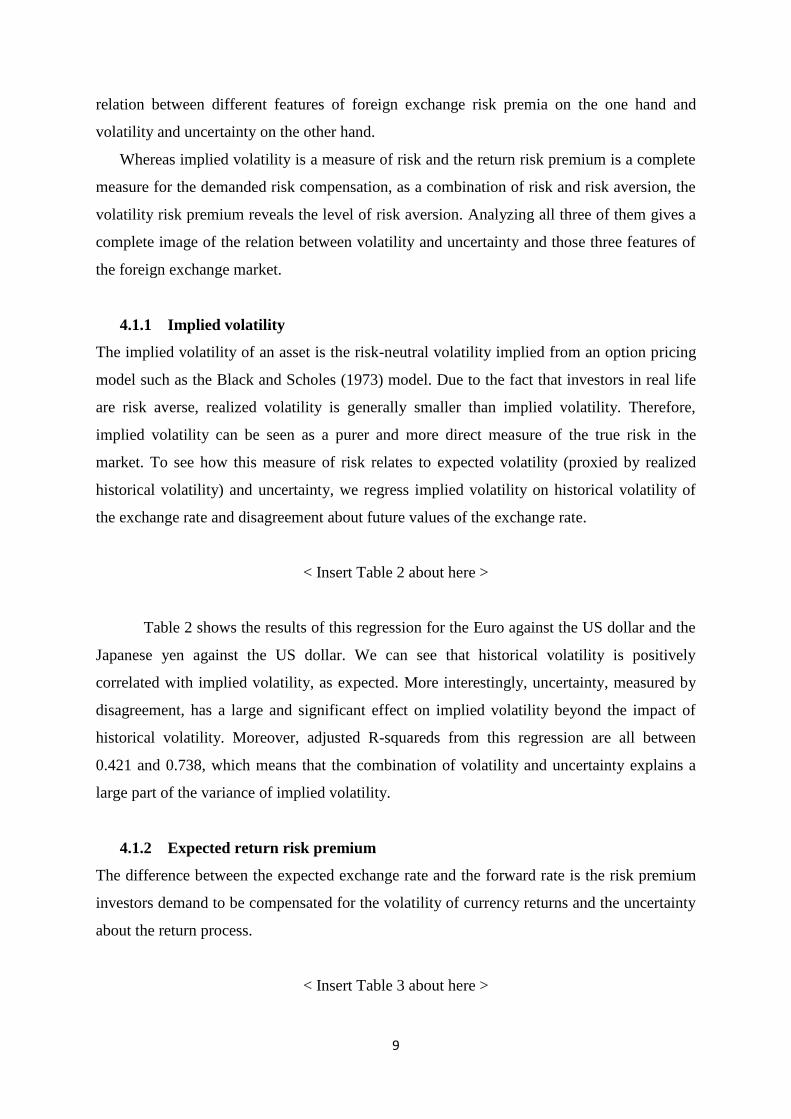
relation between different features of foreign exchange risk premia on the one hand and
volatility and uncertainty on the other hand.
Whereas implied volatility is a measure of risk and the return risk premium is a complete
measure for the demanded risk compensation, as a combination of risk and risk aversion, the
volatility risk premium reveals the level of risk aversion. Analyzing all three of them gives a
complete image of the relation between volatility and uncertainty and those three features of
the foreign exchange market.
4.1.1 Implied volatility
The implied volatility of an asset is the risk-neutral volatility implied from an option pricing
model such as the Black and Scholes (1973) model. Due to the fact that investors in real life
are risk averse, realized volatility is generally smaller than implied volatility. Therefore,
implied volatility can be seen as a purer and more direct measure of the true risk in the
market. To see how this measure of risk relates to expected volatility (proxied by realized
historical volatility) and uncertainty, we regress implied volatility on historical volatility of
the exchange rate and disagreement about future values of the exchange rate.
< Insert Table 2 about here >
Table 2 shows the results of this regression for the Euro against the US dollar and the
Japanese yen against the US dollar. We can see that historical volatility is positively
correlated with implied volatility, as expected. More interestingly, uncertainty, measured by
disagreement, has a large and significant effect on implied volatility beyond the impact of
historical volatility. Moreover, adjusted R-squareds from this regression are all between
0.421 and 0.738, which means that the combination of volatility and uncertainty explains a
large part of the variance of implied volatility.
4.1.2 Expected return risk premium
The difference between the expected exchange rate and the forward rate is the risk premium
investors demand to be compensated for the volatility of currency returns and the uncertainty
about the return process.
< Insert Table 3 about here >

10
Looking at the results in Table 3 we can see that it is mainly uncertainty that investors
want to be compensated for. For both currencies and all horizons our disagreement variable
has a statistically significant effect (on 1% or 5%) on the expected return risk premium. The
impact of volatility on expected return risk premia is ambiguous. For the Euro it only has a
significant impact for the 12 months horizon, and this effect is negative, implying that when
Euro returns are more volatile, investors demand a lower return risk premium. Volatility has a
statistically significant positive effect on the expected risk premium for the Japanese yen for
the 1 month and 12 month horizon, but this effect is very small. With the exception of the 1
month horizon for the Euro, adjusted R-squares are around 0.15 to 0.35.
4.1.3 Volatility risk premium
Besides facing the risk of volatile and uncertain returns, investors also face the risk of volatile
volatility. The compensation for this is measured by the volatility risk premium, which is the
difference between the implied volatility of a currency and its realized volatility. Because
risk-averse investors accept lower returns if volatility is lower, risk-neutral implied volatility
is higher than realized volatility if investors are indeed risk averse. Therefore, the volatility
risk premium is also a measure of risk aversion.
< Insert Table 4 about here >
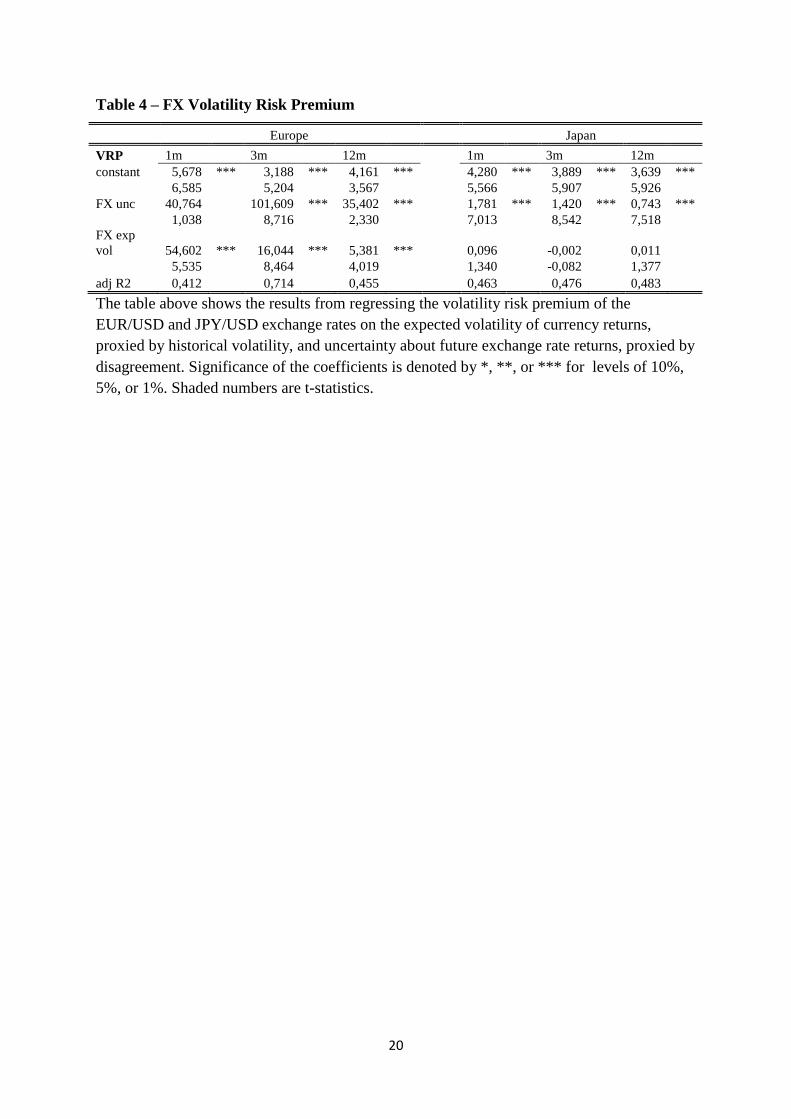
Table 4 displays the results of regressing the volatility risk premium on volatility and
uncertainty. The volatility risk premium of the Euro is affected by both volatility and
uncertainty, whereas the volatility risk premium of the Japanese yen is only affected by
uncertainty. Except for the 1 month horizon of the Euro these results are all statistically
significant at the 1% level. These results imply that risk aversion is mainly affected by
uncertainty about future currency returns.
4.2 Sources of risk and uncertainty: interest rates and fundamentals
Now we know that risk and risk premia are affected by volatility of and uncertainty about
future currency returns, it is interesting to see what the source of this relation is. There are
two related ongoing debates that should be considered here. The first one is the debate about
whether the foreign exchange market should be considered as an asset market, responding
mainly to financial and monetary fundamentals such as interest rates, or as a market that is
mainly influenced by trade flows and therefore responds to real and nominal fundamentals

11
such as GDP, inflation and current account balance. In the second debate it is questioned
whether currency returns are related to fundamentals at all.
Looking at the underlying sources of currency risk and returns, the risk investors in the
foreign exchange market face (and want to be compensated for) can be decomposed in three
parts:
1. The volatility of the underlying fundamentals
2. The uncertainty in the market about the movement of the underlying fundamentals
3. The uncertainty about the impact of the underlying fundamental model on the
exchange rate
(13)
The uncertainty about the impact of the underlying fundamental model on exchange rate
movement is assumed to be time-invariant ( ). Therefore, the time-variation in the currency
risk comes from the time-varying volatility of the fundamental ( ) and the market
uncertainty about future movements of the fundamental ( ).
For this second part of the paper we use a different dataset with survey forecasts for
macro fundamentals. The forecasts we use to construct a measure for uncertainty are budget
balance, current account, GDP, investments, industrial production, 3 month interest rates and
10 year government yields. The survey also contains consensus forecasts for the dollar
against the Australian dollar, Japanese yen and New Zealand dollar. The exchange rate
forecasts and interest rate forecasts are given monthly for horizons of 3 and 12 months.
Forecasts on the other fundamentals are for realizations of those fundamentals for the current
year. Therefore we cannot directly compare it to the analysis for the Euro and Japanese yen
from the previous section. This also means that our uncertainty measure is only based on
disagreement on future Australian, Japanese and New Zealand interest rates, and excludes
disagreement on future U.S. interest rates.
4.2.1 Interest rates
Using the uncovered interest parity from equation (5) as underlying model, the relevant
fundamental factor investors are concerned about is the interest rate differential (
). Lustig et al. (2008) also stress the importance of interest rates for risk premia in the
foreign exchange market. They show that currency risk premia are mainly determined by a

12
global risk factor measured by interest rate differentials. We therefore consider the effect of
interest rate volatility and uncertainty on risk and risk premia, to see whether we find similar
effects as in the previous section.
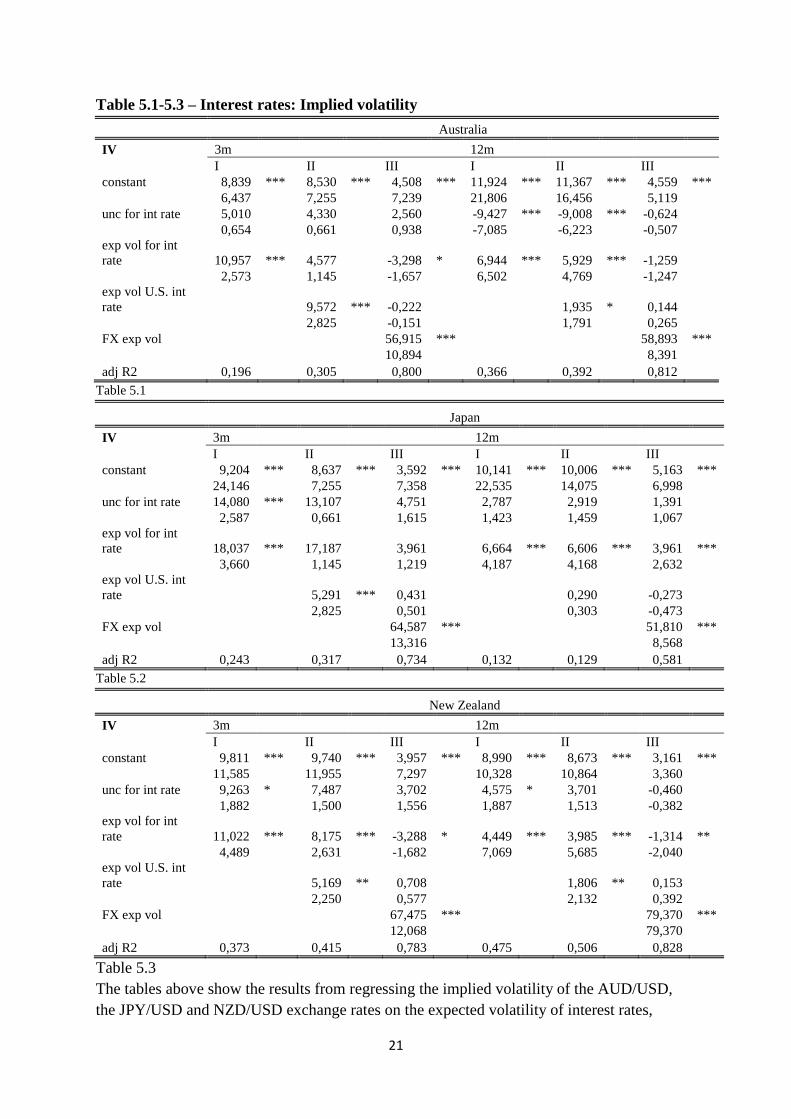
Implied volatility
< Insert tables 5.1-5.3 about here >
The results of regressing implied volatility of exchange rates on uncertainty and volatility of
the foreign (Australian, Japanese, or New Zealand) interest rates are presented in tables 5.5-
5.3. At first sight it seems as if uncertainty and volatility of foreign interest rates have a
significant impact on implied volatility. However, after controlling for U.S. interest rate
volatility and the volatility of the exchange rate itself, most of these effects disappear.
Therefore the results may be driven by correlation with these variables. Unfortunately we do
not have matching data on uncertainty of the exchange rates for this sample.
Expected return risk premium
< Insert tables 6.1-6.3 about here >
As we can see from the results in tables 6.1-6.3 the expected return risk premium cannot be
explained by volatility of and uncertainty on interest rates. This is in line with previous
research, where a stable and linear relation between (excess) returns and interest rates seems
to be absent (e.g. Meese and Rogoff, 1988; Bacchetta and Van Wincoop, 2009; Sarno and
Valente, 2008).
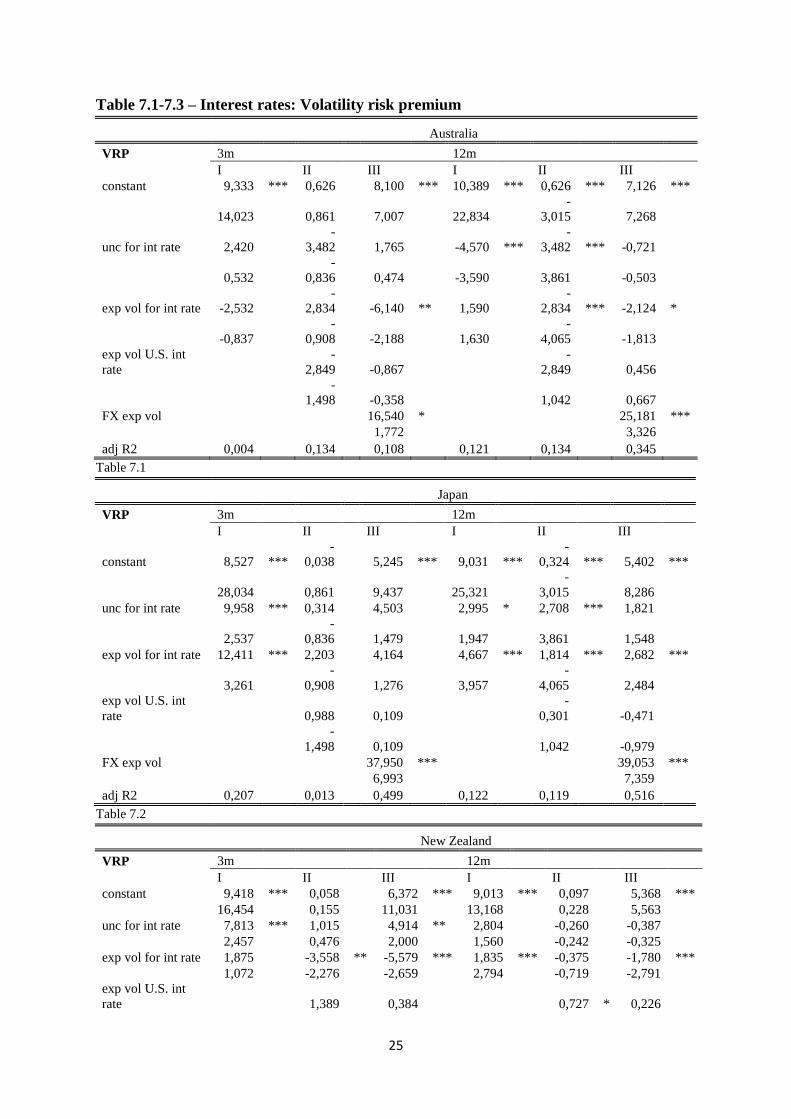
Volatility risk premium
< Insert table 7.1-7.3 about here >
Tables 7.1-7.3 present the results of regressing the volatility risk premium on uncertainty and
volatility of the foreign interest rates. Volatility and uncertainty both seem to be related to the
volatility risk premium. However, when we control for the volatility of the U.S. interest rate
and the volatility of the exchange rate, only the effect of the interest rate volatility seems to

13
persist. This implies that risk aversion in the foreign exchange market is related to the
volatility of interest rates.
4.2.2 Fundamentals
Many attempts have been made to connect exchange rate movements to (macro)fundamentals
(the first and most famous example being Meese and Rogoff, 1983), and many have failed.
Exchange rate movements, especially for horizon of a year or less, do not seem to be related
to movements of (macro)fundamentals. In this section we will investigate whether this is
different for aspects of risk. We therefore relate implied volatility, expected return risk
premium, and volatility risk premium to uncertainty on a number of fundamentals, such as
current account balance and GDP.
Implied volatility
< Insert table 8.1-8.3 about here >
Uncertainty about the current account balance is statistically significant and positively related
to currency risk. Uncertainty about the real economy matters as well, GDP is an important
measure for Australia and New Zealand, whereas industrial production matters for Japan. The
implied volatility of the NZ dollar is also affected by uncertainty about New Zealand’s
budget balance. Uncertainty about interest rates affects the riskiness of all three currencies.
Uncertainty about investments is not related to exchange rate risk.
Expected return risk premium
< Insert table 9.1-9.3 about here >
In tables 9.1-9.3 we can see that uncertainty about trade and the real economy take over the
significance from interest rate uncertainty. This indicated that for the expected risk premium,
real factors seem to be more important than monetary or financial factors.
14
Volatility risk premium
< Insert table 10.1-10.3 about here >
As seen from Tables 10.1-10.3, the volatility risk premium is related to uncertainty on the
current account for Australia and New Zealand, and this effect is not subsumed by the
significant effect of interest rate uncertainty. For the volatility risk premium of the New
Zealand dollar, budget balance uncertainty is also a driving factor. Interest rate uncertainty is
persistently important for the Japanese yen, as well as uncertainty concerning industrial
production.
In general we find that risk in the foreign exchange market is related to certain trade-
related fundamentals through uncertainty about these fundamentals.
5. Conclusion
In this paper we have investigated the relation between foreign exchange market risk and
volatility and uncertainty of exchange rates and fundamentals. Different features of foreign
exchange market risk have been considered – return risk premium, risk and volatility risk
premium (also a poxy for risk aversion). Return risk premium was measured as the difference
between the expected return of the currency and the forward premium, risk was proxied by
implied volatility and the volatility risk premium was calculated as the difference between
implied and realized volatility. We have found that volatility and uncertainty are both related
to foreign exchange risk, but that investors mainly want to be compensated for uncertainty.
Results of further investigating the sources of this relationship indicate that uncertainty on
exchange-related fundamentals explain a large part in the variation of foreign exchange risk
and risk premia. Volatility of and uncertainty on interest rates seem to have an effect on
exchange rate risk, but this effect largely disappears after controlling for exchange rate
volatility. It turns out that uncertainty on certain real factors, such as current account balance
and GDP are more important. This is supportive evidence for the literature trying to link
exchange rate movements with fundamentals.
This paper contributes to the current literature in various ways. First of all, we adopt a
framework from the literature on equity returns and inflation expectations and apply it to the
foreign exchange market. Our results show that this asset market approach for the foreign
exchange market is successful. Moreover, we demonstrate that even though the FX market

15
has certain features in common with other asset markets, trade-related fundamentals also
matter for the foreign exchange risk premium. In addition we have a very direct and
straightforward way for measuring the expected return risk premium, viz using survey
forecasts proxying for investors’ expected return. This enables us to investigate the expected
return risk premium without making strict assumptions about investors’ rationality.
Future research is necessary to further investigate the relation between risk and
uncertainty of fundamentals and risk of foreign exchange movements, to isolate the
fundamentals that are most important and identify which fundamentals drive what currency
returns and why.
16
References
Anderson, E.W., E. Ghysels, J.L. Juergens (2005), Do Heterogeneous Beliefs Matter for
Asset Pricing?, Review of Financial Studies.
Anderson, E.W., E. Ghysels, J.L. Juergens (2009), The Impact of Risk and Uncertainty on
Expected Returns, Journal of Financial Economics 94, pp. 233-263.
Bacchetta, P., E. van Wincoop (2009), On the Unstable Relationship between Exchange
Rates and Macroeconomic Fundamentals, NBER Working Paper No. 15008.
Beber, A., F. Breedon, A. Buraschi (2010), Differences in beliefs and currency risk
premiums, Journal of Financial Economics 98, pp. 415-438.
Bollerslev, T., M. Gibson, H. Zhou (2011), Dynamic estimation of volatility risk premia and
investor risk aversion from option-implied and realized volatilities, Journal of
Econometrics 160, pp. 235–245.
Bomberger, W.A. (1996), Disagreement as a measure of uncertainty, Journal of Money,
Credit and Banking Vol 28 No. 3, pp. 381-392.
Brunnermeier, M.K., S. Nagel, L.S. Pedersen (2008), Carry trades and currency crashes,
NBER working paper series 14473, http://www.nber.org/papers/w14473.
Buraschi, A., F. Trojani, A. Vedolin (2011), When uncertainty blows in the orchard:
comovement and equilibrium bolatility risk premia, Working paper Imperical College
London.
Buraschi, A., P. Whelan (2012), Term structure models with differences in beliefs, working
paper.
Cavaglia, Verschoor, Wolff (1994), On the biasedness of forward foreign exchange rates:
irrationality or risk premia?, The Journal of Business Vol. 67 No. 3, pp. 321-343.
Dominguez, K. (1986), Are foreign exchange forecasts rational?, International Finance
Discussion Papers, number 281.
Engel, C. (1996), The forward discount anomaly and the risk premium: A survey of recent
evidence, Journal of Empirical Finance 3, pp. 123-192.
Engel, C., K.D. West (2005), Exchange rates and fundamentals, NBER working paper series
10723, http://www.nber.org/papers/w10723.
Fama E.F., K.R. French (2007), Disagreement, tastes and prices, Journal of Financial
Economics 83, pp.667-689.
Fisher, E. (2006), The forward premium in a model with heterogeneous prior beliefs, Journal
of International Money and Finance 25, pp. 48-70.
17
Froot, K., J. Frankel (1989), Forward discount bias: is it an exchange rate risk premium?, The
Quarterly Journal of Economics, Vol. 104, No. 1, pp. 139-161.
Giordani, P., P. Soderlind (2003), Inflation forecast uncertainty, European Economics Review
47, pp. 1037-1059.
Giordani P., P. Soderlind (2006), Is there evidence of pessimism and doubt in subjective
distributions? Implications for the equity premium puzzle, Journal of Economic
Dynamics & Control 30, pp. 1027-1043.
Gourinchas, P., A. Tornell (2004), Exchange rate puzzles and distorted beliefs, Journal of
International Economics 64, pp. 303-333.
Huisman, R., N. van der Sar, R. Zwinkels (2010), Volatility, investor uncertainty and
disagreement, working paper.
Klitgaard, T., L. Weir (2004), Exchange rate changes and net positions of speculators in the
futures market, Federal Reserve Bank of New York Economic Policy Review.
Lustig, H., A. Verdelhan (2007), The cross-section of foreign currency risk premia and
consumption growth risk, American Economic Review 97, pp. 89-117.
Lustig, H., N. Roussanov, A. Verdelhan (2008), Common Risk Factors in Currency Markets,
Review of Financial Studies.
Lustig, H., N. Roussanov, A. Verdelhan (2012), Countercyclical currency risk premia, NBER
Working Paper No. 16427.
Meese, R.A., K. Rogoff (1983), Empirical exchange rate models of the seventies: do they fit
out of sample?, Journal of International Economics, Vol. 14, pp. 3-24.
Meese, R.A., K. Rogoff (1988), Was it real? The exchange-rate interest differential relation
over the modern floating-rate period, Journal of Finance Vol XLIII.
Sarno, L., G. Valente (2008), Exchange rates and fundamentals: footloose or evolving
relationship?, CEPR Discussion Paper No. 6638.
Sarno, L., P. Schneider, C. Wagner (2012), Properties of foreign exchange risk premiums,
Journal of Financial Economics, forthcoming.
Tien, D. (2002), Hedging demand and foreign exchange risk premia, Proceedings of the
Third Joint Central Bank Research Conference.
Wang, C. (2004), Futures trading activity and predictable foreign exchange market
movements, Journal of Banking & Finance 28, pp. 1023-1041.
18
Tables
Table 1.1-1.4 – Descriptive statistics
Disagreement
Euro Japan
1m 3m 12m 1m 3m 12m
Mean 0.028 0.040 0.068 2.842 4.238 7.243
Median 0.026 0.039 0.067 2.700 4.000 6.950
Maximum 0.170 0.076 0.103 7.400 10.300 13.600
Minimum 0.014 0.023 0.037 1.600 2.700 4.700
Std. Dev. 0.014 0.011 0.014 0.887 1.138 1.653
Table 1.1
Historical volatility
Euro Japan
1m 3m 12m 1m 3m 12m
Mean 0.043 0.129 0.527 6.219 18.038 74.855
Median 0.037 0.114 0.493 5.734 15.640 74.049
Maximum 0.144 0.350 0.989 26.520 85.014 176.936
Minimum 0.009 0.038 0.145 1.839 6.520 29.674
Std. Dev. 0.023 0.067 0.209 3.295 9.902 32.625
Table 1.2
Implied Volatility
Euro Japan
1m 3m 12m 1m 3m 12m
Mean 10.428 10.502 10.628 11.235 11.150 11.171
Median 9.963 10.213 10.400 10.300 10.113 10.600
Maximum 21.750 20.255 18.200 24.500 21.500 18.600
Minimum 5.050 5.250 5.630 6.275 6.600 6.650
Std. Dev. 2.917 2.682 2.369 3.493 3.066 2.749
Table 1.3
Expected return RP
Euro Japan
1m 3m 12m 1m 3m 12m
Mean -0.006 -0.010 -0.022 0.002 0.006 0.020
Median -0.004 -0.010 -0.018 0.001 0.005 0.021
Maximum 0.031 0.036 0.074 0.086 0.114 0.171
Minimum -0.064 -0.075 -0.158 -0.057 -0.068 -0.080
Std. Dev. 0.018 0.021 0.040 0.019 0.027 0.044
Skewness -0.691 -0.313 -0.467 0.740 0.454 0.273
Table 1.4

19
Table 2 - FX Implied volatility
Europe Japan
IV 1m 3m 12m
1m 3m 12m
constant 5,576 *** 2,314 *** 3,485 ***
2,670 *** 2,624 *** 2,985 ***
4,465
2,678
2,449
3,604
3,465
4,695
FX unc 56,686
135,550 *** 55,534 ***
2,526 *** 1,865 *** 0,918 ***
1,044
7,894
2,924
9,229
10,252
7,713
FX exp
vol 70,572 *** 20,407 *** 6,092 ***
0,223 *** 0,035
0,020 **
5,453
8,845
3,782
3,557
1,303
2,297
adj R2 0,421 0,738 0,491 0,617 0,586 0,547
The table above shows the results from regressing the implied volatility of the EUR/USD and
JPY/USD exchange rates on the expected volatility of currency returns, proxied by historical
volatility, and uncertainty about future exchange rate returns, proxied by disagreement.
Significance of the coefficients is denoted by *, **, or *** for levels of 10%, 5%, or 1%.
Shaded numbers are t-statistics.
Table 3 – FX Expected return risk premium
The table above shows the results from regressing the expected return risk premium of the
EUR/USD and JPY/USD exchange rates on the expected volatility of currency returns,
proxied by historical volatility, and uncertainty about future exchange rate returns, proxied by
disagreement. Significance of the coefficients is denoted by *, **, or *** for levels of 10%,
5%, or 1%. Shaded numbers are t-statistics.
Europe Japan
Exp return
RP 1m 3m 12m
1m 3m 12m
constant -0,012 *** -0,031 *** -0,040 *
-0,024 *** -0,054 *** -0,071 ***
-2,339
-4,678
-1,840
-4,459
-5,887
-3,992
FX unc 0,155 ** 0,787 *** 0,894 ***
0,005 *** 0,014 *** 0,008 ***
2,019
5,181
2,797
2,405
5,461
2,648
FX exp vol 0,057
-0,080 *** -0,080 ***
0,002 *** 0,000
0,000 ***
0,695
-2,656
-3,009
3,134
0,419
3,036
adjR2 0,010 0,148 0,199 0,237 0,351 0,328
20
Table 4 – FX Volatility Risk Premium
The table above shows the results from regressing the volatility risk premium of the
EUR/USD and JPY/USD exchange rates on the expected volatility of currency returns,
proxied by historical volatility, and uncertainty about future exchange rate returns, proxied by
disagreement. Significance of the coefficients is denoted by *, **, or *** for levels of 10%,
5%, or 1%. Shaded numbers are t-statistics.
Europe Japan
VRP 1m 3m 12m
1m 3m 12m
constant 5,678 *** 3,188 *** 4,161 ***
4,280 *** 3,889 *** 3,639 ***
6,585
5,204
3,567
5,566
5,907
5,926
FX unc 40,764
101,609 *** 35,402 ***
1,781 *** 1,420 *** 0,743 ***
1,038
8,716
2,330
7,013
8,542
7,518
FX exp
vol 54,602 *** 16,044 *** 5,381 ***
0,096
-0,002
0,011
5,535
8,464
4,019
1,340
-0,082
1,377
adj R2 0,412 0,714 0,455 0,463 0,476 0,483
21
Table 5.1-5.3 – Interest rates: Implied volatility
Australia
IV 3m 12m
I
II
III
I
II
III
constant 8,839 *** 8,530 *** 4,508 *** 11,924 *** 11,367 *** 4,559 ***
6,437
7,255
7,239
21,806
16,456
5,119
unc for int rate 5,010
4,330
2,560
-9,427 *** -9,008 *** -0,624
0,654
0,661
0,938
-7,085
-6,223
-0,507
exp vol for int
rate 10,957 *** 4,577
-3,298 * 6,944 *** 5,929 *** -1,259
2,573
1,145
-1,657
6,502
4,769
-1,247
exp vol U.S. int
rate
9,572 *** -0,222
1,935 * 0,144
2,825
-0,151
1,791
0,265
FX exp vol
56,915 ***
58,893 ***
10,894
8,391
adj R2 0,196 0,305 0,800 0,366 0,392 0,812
Table 5.1
Japan
IV 3m 12m
I
II
III
I
II
III
constant 9,204 *** 8,637 *** 3,592 *** 10,141 *** 10,006 *** 5,163 ***
24,146
7,255
7,358
22,535
14,075
6,998
unc for int rate 14,080 *** 13,107
4,751
2,787
2,919
1,391
2,587
0,661
1,615
1,423
1,459
1,067
exp vol for int
rate 18,037 *** 17,187
3,961
6,664 *** 6,606 *** 3,961 ***
3,660
1,145
1,219
4,187
4,168
2,632
exp vol U.S. int
rate
5,291 *** 0,431
0,290
-0,273
2,825
0,501
0,303
-0,473
FX exp vol
64,587 ***
51,810 ***
13,316
8,568
adj R2 0,243 0,317 0,734 0,132 0,129 0,581
Table 5.2
New Zealand
IV 3m 12m
I
II
III
I
II
III
constant 9,811 *** 9,740 *** 3,957 *** 8,990 *** 8,673 *** 3,161 ***
11,585
11,955
7,297
10,328
10,864
3,360
unc for int rate 9,263 * 7,487
3,702
4,575 * 3,701
-0,460
1,882
1,500
1,556
1,887
1,513
-0,382
exp vol for int
rate 11,022 *** 8,175 *** -3,288 * 4,449 *** 3,985 *** -1,314 **
4,489
2,631
-1,682
7,069
5,685
-2,040
exp vol U.S. int
rate
5,169 ** 0,708
1,806 ** 0,153
2,250
0,577
2,132
0,392
FX exp vol
67,475 ***
79,370 ***
12,068
79,370
adj R2 0,373 0,415 0,783 0,475 0,506 0,828
Table 5.3
The tables above show the results from regressing the implied volatility of the AUD/USD,
the JPY/USD and NZD/USD exchange rates on the expected volatility of interest rates,

22
proxied by historical volatility, and uncertainty about future foreign interest rates, proxied by
disagreement. Model III controls for the historical volatility of the exchange rate.
Significance of the coefficients is denoted by *, **, or *** for levels of 10%, 5%, or 1%.
Shaded numbers are t-statistics.

23
Table 6.1-6.3 – Interest rates: Expected return risk premium
Australia
Exp return RP 3m 12m
I
II
III
I
II
III
constant
-
0,016 ***
-
0,017 ***
-
0,023 ***
-
0,040 ***
-
0,035 ***
-
0,041 *
-
2,989
-
3,127
-
3,133
-
2,893
-
2,440
-
1,774
unc for int rate 0,025
0,023
0,029
0,011
0,008
0,015
1,107
1,029
1,194
0,466
0,340
0,451
exp vol for int rate 0,022
0,014
0,010
0,004
0,012
0,009
1,015
0,787
0,618
0,287
0,774
0,468
exp vol U.S. int
rate
0,015
0,005
-
0,018
-
0,019
0,916
0,255
-
0,724
-
0,764
FX exp vol
0,061
0,047
1,131
0,484
adj R2 0,024 0,026 0,036
-
0,001 0,006 0,004
Table 6.1
Japan
Exp return RP 3m 12m
I
II
III
I
II
III
constant 0,004
0,003
-0,021 ** 0,019 * 0,014
-0,049 ***
0,653
0,572
-2,300
1,772
0,966
-2,870
unc for int rate 0,037
0,036
0,014
0,038
0,040
0,024
0,914
0,894
0,359
0,698
0,736
0,423
exp vol for int rate 0,012
0,012
0,008
0,013
0,010
0,016
0,385
0,367
0,351
0,473
0,355
0,591
exp vol U.S. int
rate
0,003
-0,014
0,011
0,009
0,243
-1,069
0,739
0,627
FX exp vol
0,277 ***
0,618 ***
3,487
5,705
adj R2 0,006 0,002 0,113 0,015 0,016 0,222
Table 6.2
New Zealand
Exp return RP 3m 12m
I
II
III
I
II
III
constant -0,004
-0,003
-0,014
-0,035
-0,030
-0,072 ***
-0,612
-0,384
-1,414
-1,500
-1,261
-2,382
unc for int rate -0,042 ** -0,045 ** -0,034
0,012
0,011
0,045
-2,111
-2,016
-1,513
0,359
0,315
1,150
exp vol for int rate 0,055 *** 0,058 *** 0,048
0,001
0,002
-0,012
3,555
3,144
2,561
0,058
0,134
-0,703
exp vol U.S. int
rate
-0,009
-0,023
-0,011
-0,031
-0,420
-0,860
-0,397
-1,072
FX exp vol
0,099
0,360 **
1,078
2,129
adj R2 0,055 0,052 0,064 -0,009 -0,011 0,026
Table 6.3
24
The tables above show the results from regressing the expected return risk premium of the
AUD/USD, the JPY/USD and NZD/USD exchange rates on the expected volatility of interest
rates, proxied by historical volatility, and uncertainty about future foreign interest rates,
proxied by disagreement. Model III controls for the historical volatility of the exchange rate.
Significance of the coefficients is denoted by *, **, or *** for levels of 10%, 5%, or 1%.
Shaded numbers are t-statistics.
25
Table 7.1-7.3 – Interest rates: Volatility risk premium
Australia
VRP 3m 12m
I
II
III
I
II
III
constant 9,333 *** 0,626
8,100 *** 10,389 *** 0,626 *** 7,126 ***
14,023
0,861
7,007
22,834
-
3,015
7,268
unc for int rate 2,420
-
3,482
1,765
-4,570 ***
-
3,482 *** -0,721
0,532
-
0,836
0,474
-3,590
3,861
-0,503
exp vol for int rate -2,532
-
2,834
-6,140 ** 1,590
-
2,834 *** -2,124 *
-0,837
-
0,908
-2,188
1,630
-
4,065
-1,813
exp vol U.S. int
rate
-
2,849
-0,867
-
2,849
0,456
-
1,498
-0,358
1,042
0,667
FX exp vol
16,540 *
25,181 ***
1,772
3,326
adj R2 0,004 0,134 0,108 0,121 0,134 0,345
Table 7.1
Japan
VRP 3m 12m
I
II
III
I
II
III
constant 8,527 ***
-
0,038
5,245 *** 9,031 ***
-
0,324 *** 5,402 ***
28,034
0,861
9,437
25,321
-
3,015
8,286
unc for int rate 9,958 *** 0,314
4,503
2,995 * 2,708 *** 1,821
2,537
-
0,836
1,479
1,947
3,861
1,548
exp vol for int rate 12,411 *** 2,203
4,164
4,667 *** 1,814 *** 2,682 ***
3,261
-
0,908
1,276
3,957
-
4,065
2,484
exp vol U.S. int
rate
0,988
0,109
-
0,301
-0,471
-
1,498
0,109
1,042
-0,979
FX exp vol
37,950 ***
39,053 ***
6,993
7,359
adj R2 0,207 0,013 0,499 0,122 0,119 0,516
Table 7.2
New Zealand
VRP 3m 12m
I
II
III
I
II
III
constant 9,418 *** 0,058
6,372 *** 9,013 *** 0,097
5,368 ***
16,454
0,155
11,031
13,168
0,228
5,563
unc for int rate 7,813 *** 1,015
4,914 ** 2,804
-0,260
-0,387
2,457
0,476
2,000
1,560
-0,242
-0,325
exp vol for int rate 1,875
-3,558 ** -5,579 *** 1,835 *** -0,375
-1,780 ***
1,072
-2,276
-2,659
2,794
-0,719
-2,791
exp vol U.S. int
rate
1,389
0,384
0,727 * 0,226

26
1,162
0,273
1,931
0,553
FX exp vol
35,103 ***
49,309 ***
6,029
5,870
adj R2 0,127 0,047 0,400 0,217 0,021 0,556
Table 7.3
The tables above show the results from regressing the volatility risk premium of the
AUD/USD, the JPY/USD and NZD/USD exchange rates on the expected volatility of interest
rates, proxied by historical volatility, and uncertainty about future foreign interest rates,
proxied by disagreement. Model III controls for the historical volatility of the exchange rate.
Significance of the coefficients is denoted by *, **, or *** for levels of 10%, 5%, or 1%.
Shaded numbers are t-statistics.

27
Table 8.1-8.3 – Fundamentals: Implied volatility
Australia
IV 3m 12m
I
II
I
II
constant 10,615 *** 9,259 *** 10,663 *** 10,176 ***
9,779
8,019
11,572
10,973
BB unc -0,049
-0,025
0,028
0,037
-0,344
-0,183
0,184
0,247
CA unc 0,791 *** 0,723 *** 0,737 *** 0,754 ***
5,622
6,362
7,421
7,779
GDP unc -6,540 *** -6,590 *** -5,635 *** -5,260 ***
-2,369
-2,740
-3,024
-2,776
Inv unc 0,078
0,011
-0,149
-0,182
0,231
0,034
-0,593
-0,787
IP unc -0,518
-0,230
-0,618
-0,697
-0,869
-0,478
-1,192
-1,371
unc for int rate
11,822 *
-3,066 **
1,751
-2,061
unc for gtv yield
-3,153
4,126
-0,910
1,632
adj R2 0,473 0,507 0,551 0,561
Table 8.1
Japan
IV 3m 12m
I
II
I
II
constant 9,352 *** 6,186 *** 9,168 *** 7,043 ***
7,677
4,191
9,609
5,257
BB unc 0,075
0,121
0,137
0,158
0,488
0,885
1,205
1,443
CA unc 0,119
0,082
0,140 * 0,046
1,265
1,017
1,800
0,648
GDP unc 1,922
-2,473
2,611
-0,790
0,824
-1,045
1,258
-0,350
Inv unc -0,513
-0,016
-0,695
-0,248
-0,963
-0,035
-1,452
-0,492
IP unc 1,004 *** 1,327 *** 0,827 ** 1,335 ***
2,685
3,590
2,098
3,619
unc for int rate
15,879 ***
5,301 **
2,733
2,105
unc for gtv yield
11,672 ***
4,490
2,667
1,408
adj R2 0,102 0,263 0,130 0,194
Table 8.2

28
New Zealand
IV 3m 12m
I
II
I
II
constant 8,866 *** 6,389 *** 8,560 *** 6,767 ***
7,948
4,762
9,501
4,928
BB unc 3,169 *** 3,077 *** 2,658 *** 2,391 ***
4,274
4,626
4,933
5,032
CA unc 0,569 ** 0,500
0,954 *** 0,985 ***
2,043
1,328
4,267
4,541
GDP unc 2,260
0,579
0,638
-0,715
1,048
0,270
0,380
-0,397
Inv unc 0,420
0,123
0,493
0,353
1,145
0,305
1,581
1,406
IP unc -0,758
-0,488
-0,311
-0,296
-1,353
-1,180
-0,631
-0,599
unc for int rate
13,867 ***
0,692
2,626
0,316
unc for gtv yield
3,458
7,567 **
1,121
2,120
adj R2 0,368 0,481 0,484 0,532
Table 8.3
The tables above show the results from regressing the implied volatility of the AUD/USD,
the JPY/USD and NZD/USD exchange rates on the uncertainty about fundamentals, proxied
by disagreement. Model I includes uncertainty about a number of real fundamentals (budget
balance, current account, GDP, investments, industrial production), whereas model II also
includes monetary fundamentals (3 months interest rates, 10 year government yields).
Significance of the coefficients is denoted by *, **, or *** for levels of 10%, 5%, or 1%.
Shaded numbers are t-statistics.

29
Table 9.1-9.3 – Fundamentals: Expected return risk premium
Australia
Exp return RP 3m 12m
I
II
I
II
constant -0,023 *** -0,035 *** -0,058 *** -0,062 ***
-2,960
-3,620
-3,281
-2,622
BB unc 0,001 *** 0,002 *** 0,005 *** 0,006 ***
2,333
2,566
4,203
4,299
CA unc 0,002 *** 0,002 *** 0,001
0,001
2,373
2,557
0,792
0,724
GDP unc -0,008
-0,010
0,031
0,021
-0,389
-0,449
0,770
0,526
Inv unc 0,001
0,001
-0,004
-0,005
0,439
0,322
-0,697
-0,779
IP unc 0,003
0,003
0,005
0,006
0,548
0,703
0,474
0,575
unc for int rate
0,014
0,055 *
0,570
1,809
unc for gtv yield
0,036
-0,037
1,421
-0,818
adj R2 0,132 0,137 0,141 0,158
Table 9.1
Japan
Exp return RP 3m 12m
I
II
I
II
constant
-
0,001
-
0,022 ** 0,013
-
0,017
-
0,088
-
2,168
0,955
-
0,894
BB unc 0,000
0,000
0,000
0,000
0,168
0,407
0,087
0,318
CA unc 0,001 *** 0,001 ** 0,005 *** 0,004 ***
2,465
2,231
3,057
2,497
GDP unc 0,020
-
0,012
-
0,005
-
0,043
1,266
-
0,671
-
0,141
-
1,186
Inv unc
-
0,001
0,001
-
0,003
0,001
-
0,275
0,219
-
0,371
0,143
IP unc
-
0,001
0,004
0,008
0,015 **
-
0,340
0,880
1,102
2,108
unc for int rate
0,059
0,064
1,146
1,442
unc for gtv yield
0,109 ***
0,064
3,582
1,249
adj R2 0,037 0,118 0,137 0,170
Table 9.2
30
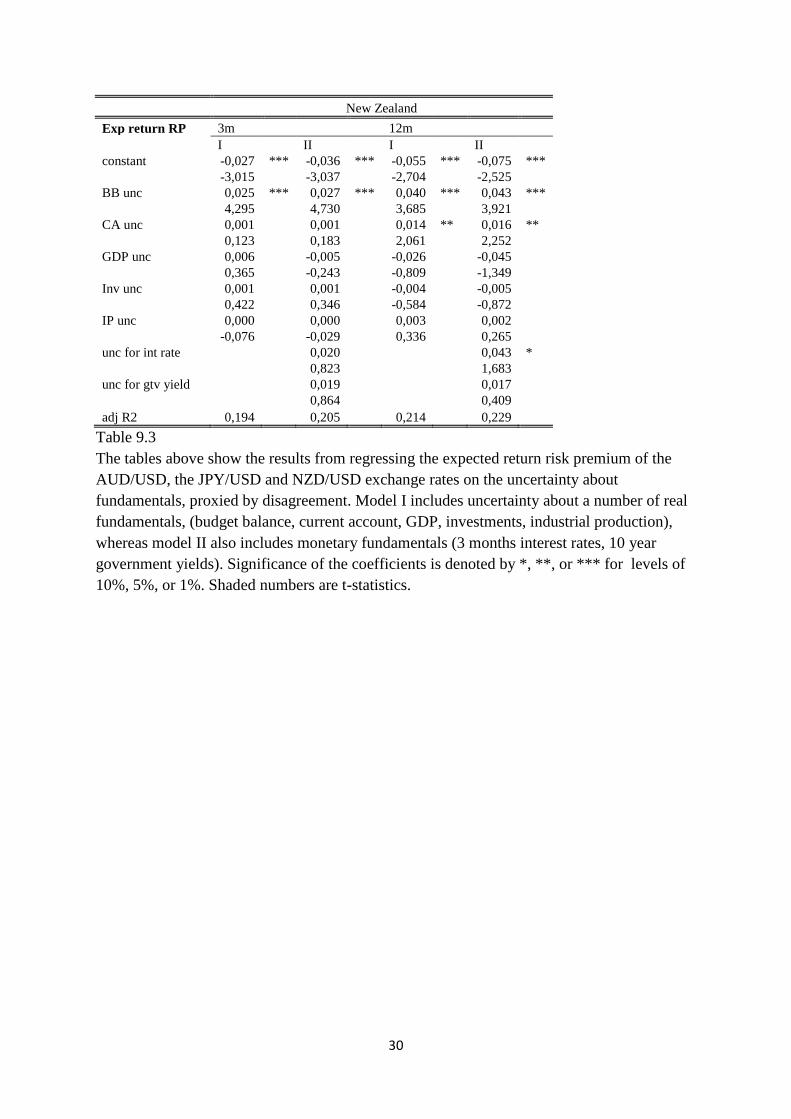
New Zealand
Exp return RP 3m 12m
I
II
I
II
constant -0,027 *** -0,036 *** -0,055 *** -0,075 ***
-3,015
-3,037
-2,704
-2,525
BB unc 0,025 *** 0,027 *** 0,040 *** 0,043 ***
4,295
4,730
3,685
3,921
CA unc 0,001
0,001
0,014 ** 0,016 **
0,123
0,183
2,061
2,252
GDP unc 0,006
-0,005
-0,026
-0,045
0,365
-0,243
-0,809
-1,349
Inv unc 0,001
0,001
-0,004
-0,005
0,422
0,346
-0,584
-0,872
IP unc 0,000
0,000
0,003
0,002
-0,076
-0,029
0,336
0,265
unc for int rate
0,020
0,043 *
0,823
1,683
unc for gtv yield
0,019
0,017
0,864
0,409
adj R2 0,194 0,205 0,214 0,229
Table 9.3
The tables above show the results from regressing the expected return risk premium of the
AUD/USD, the JPY/USD and NZD/USD exchange rates on the uncertainty about
fundamentals, proxied by disagreement. Model I includes uncertainty about a number of real
fundamentals, (budget balance, current account, GDP, investments, industrial production),
whereas model II also includes monetary fundamentals (3 months interest rates, 10 year
government yields). Significance of the coefficients is denoted by *, **, or *** for levels of
10%, 5%, or 1%. Shaded numbers are t-statistics.

31
Table 10.1-10.3 – Fundamentals: Volatility risk premium
Australia
VRP 3m 12m
I
II
I
II
constant 10,529 *** 9,225 *** 10,577 *** 10,070 ***
9,843
8,083
11,636
10,970
BB unc -0,049
-0,025
0,028
0,038
-0,343
-0,187
0,187
0,255
CA unc 0,777 *** 0,711 *** 0,723 *** 0,741 ***
5,663
6,369
7,453
7,854
GDP unc -6,206 *** -6,253 *** -5,302 *** -4,925 ***
-2,362
-2,731
-2,984
-2,735
Inv unc 0,048
-0,017
-0,178
-0,213
0,149
-0,056
-0,734
-0,954
IP unc -0,503
-0,224
-0,604
-0,683
-0,866
-0,474
-1,184
-1,366
unc for int rate
11,469 *
-3,101 **
1,739
-2,101
unc for gtv yield
-3,105
4,214 *
-0,902
1,694
adj R2 0,473 0,506 0,549 0,560
Table 10.1
Japan
VRP 3m 12m
I
II
I
II
constant 9,312 *** 6,167 *** 9,128 *** 7,012 ***
7,693
4,226
9,630
5,285
BB unc 0,073
0,118
0,135
0,156
0,480
0,877
1,201
1,444
CA unc 0,122
0,085
0,143 * 0,049
1,308
1,062
1,848
0,699
GDP unc 1,832
-2,533
2,520
-0,864
0,790
-1,079
1,221
-0,384
Inv unc -0,509
-0,014
-0,690
-0,243
-0,960
-0,031
-1,449
-0,484
IP unc 1,006 *** 1,326 *** 0,828 ** 1,332 ***
2,713
3,605
2,112
3,618
unc for int rate
15,797 ***
5,322 **
2,735
2,123
unc for gtv yield
11,581 ***
4,431
2,676
1,406
adj R2 0,102 0,263 0,129 0,193
Table 10.2

32
New Zealand
VRP 3m 12m
I
II
I
II
constant 8,779 *** 6,363 *** 8,473 *** 6,737 ***
8,018
4,841
9,601
5,039
BB unc 3,116 *** 3,026 *** 2,605 *** 2,346 ***
4,317
4,635
4,989
5,009
CA unc 0,573 ** 0,506
0,958 *** 0,988 ***
2,086
1,357
4,343
4,646
GDP unc 2,228
0,586
0,606
-0,703
1,047
0,277
0,365
-0,396
Inv unc 0,423
0,132
0,496
0,361
1,174
0,334
1,624
1,459
IP unc -0,739
-0,474
-0,292
-0,278
-1,349
-1,163
-0,605
-0,573
unc for int rate
13,587 ***
0,678
2,624
0,315
unc for gtv yield
3,329
7,316 **
1,096
2,115
adj R2 0,372 0,483 0,489 0,535
Table 10.3
The tables above show the results from regressing the volatility risk premium of the
AUD/USD, the JPY/USD and NZD/USD exchange rates on the uncertainty about
fundamentals, proxied by disagreement. Model I includes uncertainty about a number of real
fundamentals (budget balance, current account, GDP, investments, industrial production),
whereas model II also includes monetary fundamentals (3 months interest rates, 10 year
government yields). Significance of the coefficients is denoted by *, **, or *** for levels of
10%, 5%, or 1%. Shaded numbers are t-statistics.