Embed Size (px)
Citation preview
Risk and Return - Part 2
• Efficient Frontier
• Capital Market Line
• Security Market Line

Risk and ReturnC h an ge s in P o rtfolio S ta n dard D e via tions w ith A d d itions o f S ec urit ies to th e P o rtfo lio fo r
Vary ing L ev els o f C orre lations Am ong S ec uritie s
0.0 0
0.0 5
0.1 0
0.1 5
0.2 0
0.2 5
0.3 0
0.3 5
0.4 0
1 2 3 4 5 6 7 8 9 1 0 1 1 1 2 1 3 1 4 1 5 1 6 1 7 1 8 1 9 2 0 2 1 2 2 2 3 2 4 2 5 2 6 2 7 2 8 2 9 3 0
Num be r of Se c uritie s
Po
rtfo
lio
Sta
nd
ard
De
via
tio
ns
C orr =0.7 0
C orr =0.5 0
C orr =0.0 0
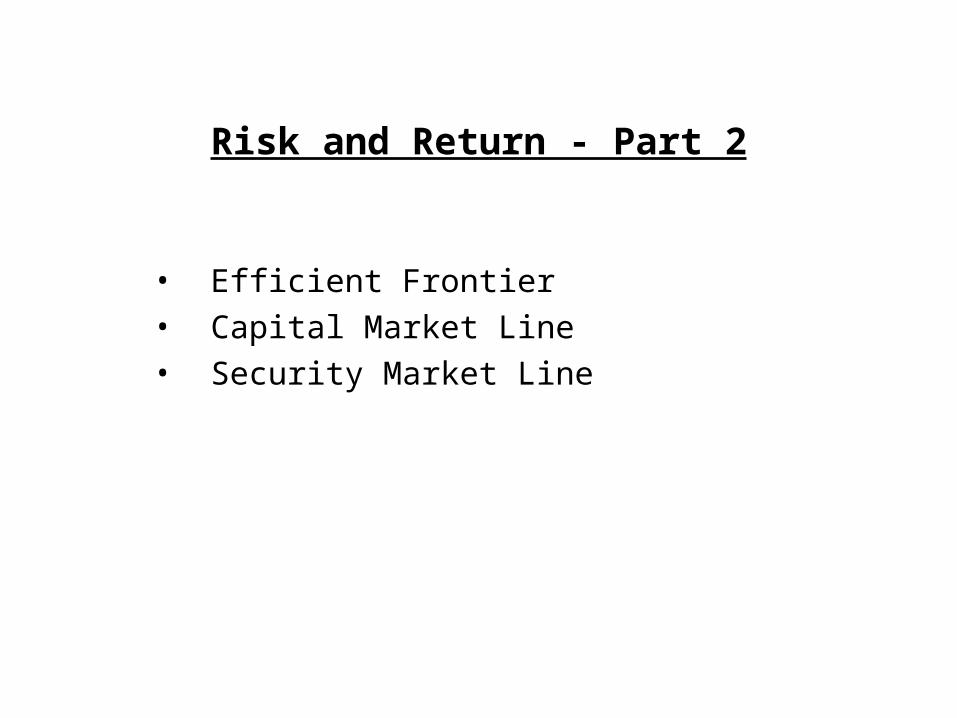
Risk and Return Expected Returns and Standard Deviations for Various Levels of Correlation
0.00
2.00
4.00
6.00
8.00
10.00
12.00
14.00
16.00
0.00 5.00 10.00 15.00 20.00 25.00
Standard Deviations
Exp
ecte
d R
etu
rns
Correlation = 1.0
Correlation = -1.0
-1.0 < Correlation < 1.0

Risk and Return: Feasible Investments
• What does the risk-return tradeoff look like if we combine many securities into a portfolio?
Expected Returns and Standard Deviations
0.00
2.00
4.00
6.00
8.00
10.00
12.00
14.00
16.00
18.00
20.00
0.00 5.00 10.00 15.00 20.00 25.00 30.00
Standard Deviations
Ex
pe
cte
d R
etu
rns
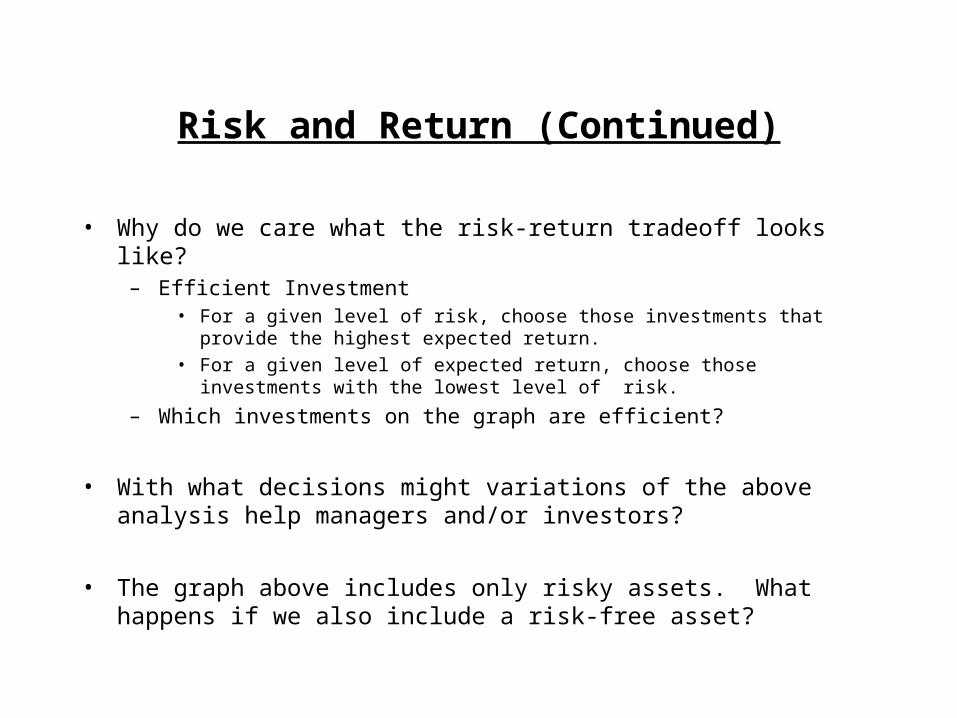
Risk and Return (Continued)
• Why do we care what the risk-return tradeoff looks like?– Efficient Investment
• For a given level of risk, choose those investments that provide the highest expected return.
• For a given level of expected return, choose those investments with the lowest level of risk.
– Which investments on the graph are efficient?
• With what decisions might variations of the above analysis help managers and/or investors?
• The graph above includes only risky assets. What happens if we also include a risk-free asset?

Risk and Return: Capital Market Line
• What investments are efficient if we include the risk-free asset?Expected Returns and Standard Deviations
0.00
2.00
4.00
6.00
8.00
10.00
12.00
14.00
16.00
18.00
20.00
0.00 5.00 10.00 15.00 20.00 25.00 30.00
Standard Deviations
Exp
ecte
d R
etu
rns

Risk and Return: Capital Market Line
• For well diversified portfolios, the required return can be determined by what is known as the Capital Market Line. That is,
• Where,– Rf is the rate of return on a risk-free asset.
– E(Rm) is the expected return on the market portfolio
p is the standard deviation of the return on the portfolio in question, and
m is the standard deviation of the return on the market portfolio.
])([*)( fmm
pfp RRERRE

Risk and Return: Capital Market Line
• Important conclusions so far:– When securities’ returns are less than perfectly positively correlated,
diversifying enables investors• to increase their investment opportunity set and
• to invest efficiently
– When investors have the same expectations about what opportunities for risk and return they have, they will invest in two sets of assets that include
• positive (lending) or negative (borrowing) amounts of the risk-free asset and
• the market portfolio that has been completely diversified across all risky assets.
– What are the risk/return tradeoffs in this type of environment? • Risk is measured as the standard deviation of portfolio returns.
• Expected return is measured as the expected return on the portfolio.
Risk and Return: Capital Market Line
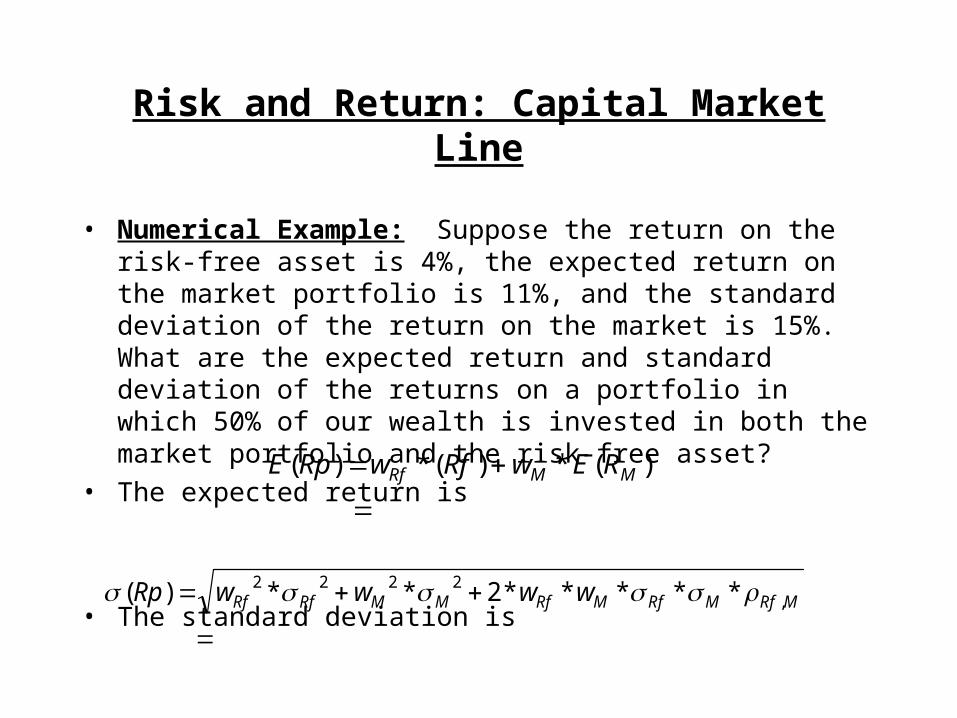
• Numerical Example: Suppose the return on the risk-free asset is 4%, the expected return on the market portfolio is 11%, and the standard deviation of the return on the market is 15%. What are the expected return and standard deviation of the returns on a portfolio in which 50% of our wealth is invested in both the market portfolio and the risk-free asset?
• The expected return is
• The standard deviation is
)(*)(*)(
MMRf REwRfwRpE
*****2**)( ,2222
MRfMRfMRfMMRfRf wwwwRp
Risk and Return: Capital Market Line
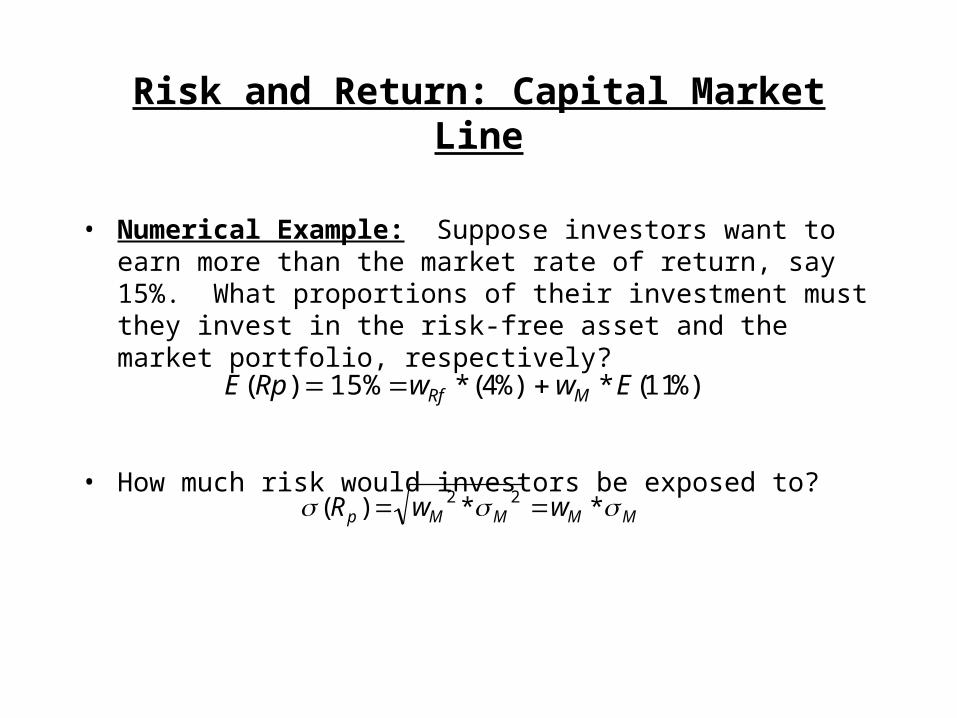
• Numerical Example: Suppose investors want to earn more than the market rate of return, say 15%. What proportions of their investment must they invest in the risk-free asset and the market portfolio, respectively?
• How much risk would investors be exposed to?
%)11(*%)4(* 15% )( EwwRpE MRf
MMMMp wwR **)( 22

Risk and Return: Capital Market Line for Individual Securities? Why or why not?
Risk and ReturnC h an ge s in P o rtfolio S ta n dard D e via tions w ith A d d itions o f S ec urit ies to th e P o rtfo lio fo r
Vary ing L ev els o f C orre lations Am ong S ec uritie s
0.0 0
0.0 5
0.1 0
0.1 5
0.2 0
0.2 5
0.3 0
0.3 5
0.4 0
1 2 3 4 5 6 7 8 9 1 0 1 1 1 2 1 3 1 4 1 5 1 6 1 7 1 8 1 9 2 0 2 1 2 2 2 3 2 4 2 5 2 6 2 7 2 8 2 9 3 0
Num be r o f Se c uritie s
Po
rtfo
lio
Sta
nd
ard
De
via
tio
ns
C orr =0.7 0
C orr =0.5 0
C orr =0.0 0

Risk and Return: The Risk of Individual Securities in an N-stock Portfolio
Securities 1 2 3 N
1 W1
2*
1
2 W1*W
2*
1*
2*
1,2
W1*W
3*
1*
3*
1,3
2 W1*W
2*
1*
2*
1,2
W2
2*
2
2 W2*W
3*
2*
3*
2,3
3 W1*W
3*
1*
3*
1,3
W2*W
3*
2*
3*
2,3
W3
2*
3
2
N WN
2*
N
2

Risk and Return: The Risk of Individual Securities in an N-stock Portfolio
• Suppose N=100, how many terms in the portfolio variance are influenced by correlations between returns on the different stocks?
• How many terms in the portfolio variance are not influenced by the correlations?
• How much risk does stock 1 contribute to the portfolio? How do we measure risk?

Risk and Return: The Risk of Individual Securities in an N-stock Portfolio
• The contribution to portfolio risk made by an individual stock is called beta, .
• Do we have to calculate the correlations between returns on each pair of stocks in the portfolio to calculate ?– No, there is a simpler approach: Regression Analysis.
– How does this regression work?
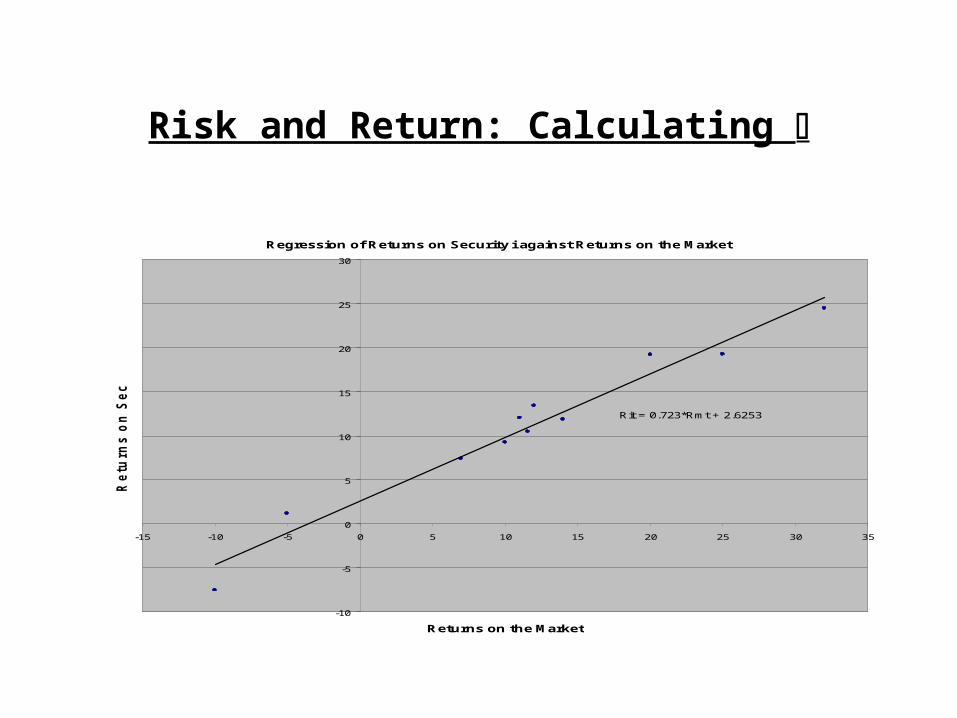
Risk and Return: Calculating
Regression of Returns on Security i against Returns on the Market
Rit = 0.723*Rmt + 2.6253
-10
-5
0
5
10
15
20
25
30
-15 -10 -5 0 5 10 15 20 25 30 35
Returns on the Market
Re
turn
s o
n S
ec
uri
ty i

Risk and Return: What does mean?
• As we noted earlier, is the contribution to portfolio risk made by a security (or group of securities) in a specific portfolio. Another way of saying this is that the portfolio p is the weighted average of the individual s in the portfolio. That is,
• We also said that is the slope from a regression that explains the relationship between returns on an individual security (or group of securities) and returns on the market. What does the slope tell us?
N
iiip w
1*
Risk and Return: What does mean?
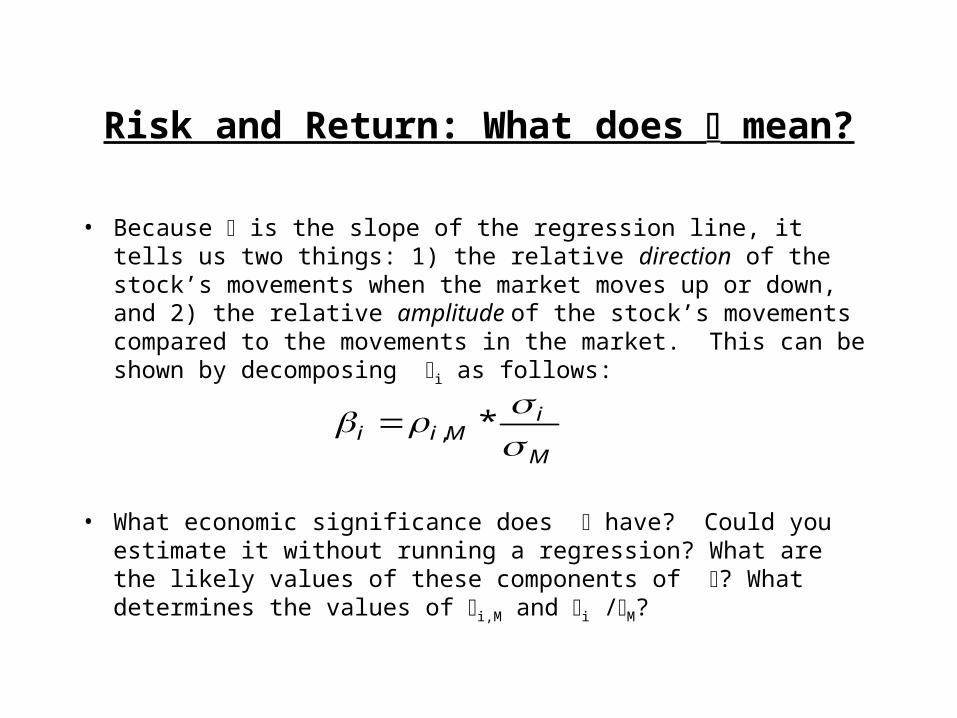
• Because is the slope of the regression line, it tells us two things: 1) the relative direction of the stock’s movements when the market moves up or down, and 2) the relative amplitude of the stock’s movements compared to the movements in the market. This can be shown by decomposing i as follows:
• What economic significance does have? Could you estimate it without running a regression? What are the likely values of these components of ? What determines the values of i,M and i /M?
M
iMii
*,

Risk and Return: Can you explain these s?
Company Beta
Microsoft 1.45
AT&T 0.86
Novell 1.70
Ford Motor Company 0.96
Union Pacific Corp 0.63
Pacificorp 0.19
Delta Air Lines 0.75
American Express 1.36
Geneva Steel 0.24
Iomega 2.07

Risk and Return: How do we use ? The Security Market Line
• One way to use is to calculate the cost of equity for individual firms. This is done by using the Security Market Line as follows
• Where– E(Ri) is the expected and required return on stock i
– Rf is the rate of return on the risk-free asset
i is the beta for stock i, and
– E(Rm) is the expected and required rate of return on the market.
• What determines the values of these factors?
])([*)( fmifi RRERRE

Risk and Return: How do we use ? The Security Market Line
Required Returns on Stock Using the Security Market Line
-5.00%
0.00%
5.00%
10.00%
15.00%
20.00%
-1.50 -1.00 -0.50 0.00 0.50 1.00 1.50 2.00 2.50
Beta
Re
turn
s

Risk and Return: How do we use ? The Security Market Line
• Numerical Example: Suppose three stocks have s of 1.5, .75, and -.30, respectively. We plan to invest 30% of our wealth in the first two stocks and 40% of our wealth in the third stock. If the risk -free rate is 4% and the expected (required) return on the market is 11%, calculate the following:
– The for the portfolio of three stocks.
– The contribution to the portfolio risk made by each stock.
– The required return for the portfolio.
– The required return for the individual stocks.

Risk and Return: Assignment for Next Time
• Estimate the cost of equity for Star Appliance– Convert price and earnings per share data to returns for Star
– Estimate the • Estimate without the numbers, using what you know about Star’s product
and industry.
• Estimate with the numbers, using regression analysis.
• Determine Star’s cost of capital for capital budgeting.