Embed Size (px)
Citation preview

Risk and Performance Based
Fire Safety Design of Steel and
Composite Structures
David James Lange
Doctor of Philosophy
The University of Edinburgh
2009
Declaration
The research which is detailed in this thesis has been completed solely bymyself at the University of Edinburgh under the supervision of Professor AsifUsmani and Professor Jose Torero. Where other sources are used, appropri-ate references are made.
David Lange
The University of Edinburgh 2009
i

Abstract
For the development of performance based design on a proper scientific basisthe use of the concept of risk is inevitable. However, the application of thisconcept to actual structural design is not simple because of the large rangesof probability and consequences of events which exist. This is compoundedby a plethora of different actions that can be taken to reduce the probabilitiesof the events and also the magnitude of the consequences. It is the reductionin the magnitude of these consequences which is essentially the goal of design.
This work aims to address the challenges posed by the application of theconcepts of performance based design for structures in fire. Simple method-ologies have been developed for the assessment of the consequences of anextreme event. These methodologies are based upon fundamental behaviourof structures in fire.
A methodology has been developed which can be used to assess the ca-pacity/deflection behaviour through the complete thermal deflection of floorslabs. This takes into account positive effects on the capacity of floor slabs ofthe membrane stress at the slabs boundaries at low deflections as well as thefinal capacity provided by the tensile membrane action of the reinforcementmesh at high deflections.
For vertical stability of structures in fire, analytical equations to describethe behaviour of floor systems at the perimeter of a building are developed.From these equations, the resulting pull-in forces on external columns canbe calculated as well as the resulting horizontal load applied to the column.From this, a simple stability assessment is proposed which can be used to
ii

assess the consequences of multiple floor fires on tall buildings.
These analytical methodologies are brought together in a risk based frame-work for structural design which can be used to identify areas in a buildingor structural components which pose a high residual risk. These elementscan be qualitatively ’ranked’ according to their relative risk and appropriatemeasures taken to reduce the risk to an acceptable level. The framework isillustrated via 2 case studies. The first is of a typical small office building,and the second is of a prestige office development.
iii

Acknowledgements
This work has been supported by Corus Group plc. and the EPSRC throughan industrial CASE award.
I would like to acknowledge the support and help of my friends and colleaguesat the University of Edinburgh; in particular my academic supervisors Pro-fessors Asif Usmani and Jose Torero.
iv

Publications
Journal Papers
Charlotte Roben, A. Usmani, G. Flint, A. Jowsey, and D. Lange; Tall build-ing collapse mechanisms initiated by fire; Part 1, Mechanisms Explained;submitted to the Structural Engineer, July 2007; under revision
David Lange, C Roben, A. Usmani; Tall building collapse mechanisms ini-tiated by fire; Part 2, Design Method; submitted to the Structural Engineer,July 2007; under revision
Conference Papers
David Lange, Asif Usmani, Neil Cameron, Wolfgang Winkler and JoseTorero; A performance based design methodology for composite floor slabsin fire; Proceedings of the 4th International Workshop Structures in Fire (SiF’06) 10-12 May 2006
David Lange, Asif Usmani and Jose Torero; A Risk Based Framework forPerformance Based Fire Safety Design of Steel and Composite Structures;Fifth International Conference on Advances in Steel Structures (ICASS 2007)5-7 December 2007
David Lange, Asif Usmani and Jose Torero; The Reliability of Structuresin Fire, Proceedings of the 5th International Workshop Structures in Fire(SiF ’08) 28-30 May 2008
v

David Lange, Asif Usmani; Collapse of tall buildings in multi-storey fires;9th International Symposium on Fire Safety Science; 21-26 September 2008
Other Presentations
David Lange, C. Roben, A. Usmani; Tall building collapse mechanisms ini-tiated by fire: Design Method; presentation at Steel in Fire Forum, April 2007
David Lange, Asif Usmani and Jose Torero; Development of a risk basedframework for performance based fire safety design of steel and compositestructures; presentation at Corus Academia symposium, March 2008
vi

Contents
Declaration i
Abstract ii
Acknowledgements iv
Publications v
Contents vii
List of Figures xiii
List of Tables xix
1 Introduction 1
1.1 Background to the Project . . . . . . . . . . . . . . . . . . . . 1
1.2 Research aims . . . . . . . . . . . . . . . . . . . . . . . . . . . 3
1.3 Thesis Overview . . . . . . . . . . . . . . . . . . . . . . . . . . 4
2 Basic Fire Modelling for Structural Design 7
vii

2.1 Introduction . . . . . . . . . . . . . . . . . . . . . . . . . . . . 7
2.2 Nominal fire curves . . . . . . . . . . . . . . . . . . . . . . . . 8
2.3 Parametric fire curves . . . . . . . . . . . . . . . . . . . . . . . 10
2.4 One Zone Fire Models . . . . . . . . . . . . . . . . . . . . . . 12
2.5 Multi Zone Fire Models . . . . . . . . . . . . . . . . . . . . . 14
2.6 Field Models . . . . . . . . . . . . . . . . . . . . . . . . . . . . 15
2.7 Temperature of Structures Exposed to Fire . . . . . . . . . . . 16
2.8 Summary . . . . . . . . . . . . . . . . . . . . . . . . . . . . . 17
3 Overview of the Basics of Structures in Fire 19
3.1 Introduction . . . . . . . . . . . . . . . . . . . . . . . . . . . . 19
3.2 The Cardington Tests . . . . . . . . . . . . . . . . . . . . . . . 21
3.2.1 British Steel Test 1 . . . . . . . . . . . . . . . . . . . . 23
3.2.2 British Steel Test 2 . . . . . . . . . . . . . . . . . . . . 24
3.2.3 British Steel Test 3 . . . . . . . . . . . . . . . . . . . . 24
3.2.4 British Steel Test 4 . . . . . . . . . . . . . . . . . . . . 25
3.2.5 BRE Test 1 . . . . . . . . . . . . . . . . . . . . . . . . 25
3.2.6 BRE Test 2 . . . . . . . . . . . . . . . . . . . . . . . . 25
3.2.7 Summary . . . . . . . . . . . . . . . . . . . . . . . . . 26
3.3 Numerical Studies . . . . . . . . . . . . . . . . . . . . . . . . . 26
3.4 Analytical Techniques for Describing the Behaviour of Struc-tures in Fire . . . . . . . . . . . . . . . . . . . . . . . . . . . . 28
3.4.1 Thermal Displacements . . . . . . . . . . . . . . . . . . 28
3.4.2 Thermal Force . . . . . . . . . . . . . . . . . . . . . . . 30
viii

3.5 Alternative Load Carrying Mechanisms . . . . . . . . . . . . . 31
3.6 Material Properties . . . . . . . . . . . . . . . . . . . . . . . . 32
3.6.1 Steel at Elevated Temperatures . . . . . . . . . . . . . 32
3.6.2 Concrete at Elevated Temperatures . . . . . . . . . . . 33
3.7 Summary . . . . . . . . . . . . . . . . . . . . . . . . . . . . . 34
4 Performance Based Design 37
4.1 Introduction . . . . . . . . . . . . . . . . . . . . . . . . . . . . 37
4.2 History of Performance Based Design . . . . . . . . . . . . . . 39
4.3 Fundamentals of Performance Based Design . . . . . . . . . . 39
4.4 Performance Based Design Frameworks . . . . . . . . . . . . . 41
4.5 Performance Goals . . . . . . . . . . . . . . . . . . . . . . . . 44
4.6 Summary . . . . . . . . . . . . . . . . . . . . . . . . . . . . . 47
5 Risk and Reliability 49
5.1 Risk Assessment . . . . . . . . . . . . . . . . . . . . . . . . . . 49
5.2 Risk Based Design Goal . . . . . . . . . . . . . . . . . . . . . 50
5.3 Acceptable Risk . . . . . . . . . . . . . . . . . . . . . . . . . . 51
5.4 Fire Probability . . . . . . . . . . . . . . . . . . . . . . . . . . 51
5.5 Risk Matrix . . . . . . . . . . . . . . . . . . . . . . . . . . . . 53
5.6 Reliability . . . . . . . . . . . . . . . . . . . . . . . . . . . . . 55
5.6.1 Reliability Theory . . . . . . . . . . . . . . . . . . . . 55
5.7 Reliability of Structures in Fire . . . . . . . . . . . . . . . . . 58
5.7.1 Thermal Load Variation . . . . . . . . . . . . . . . . . 59
ix
5.7.2 Reliability Calculation . . . . . . . . . . . . . . . . . . 62
5.7.2.1 Performance Function . . . . . . . . . . . . . 62
5.7.2.2 Monte Carlo Analysis . . . . . . . . . . . . . 63
5.8 Reliability Goals . . . . . . . . . . . . . . . . . . . . . . . . . 64
5.9 Risk Informed Framework for Structural Fire Design . . . . . 67
5.9.1 Risk Assessment . . . . . . . . . . . . . . . . . . . . . 68
5.9.2 Reliability Assessment . . . . . . . . . . . . . . . . . . 70
5.9.3 Complete Risk Based Framework . . . . . . . . . . . . 71
5.10 Summary . . . . . . . . . . . . . . . . . . . . . . . . . . . . . 72
6 Floor Slab Behaviour and Design 74
6.1 Introduction . . . . . . . . . . . . . . . . . . . . . . . . . . . . 74
6.2 Floor Slabs at Large Deflections . . . . . . . . . . . . . . . . . 75
6.3 3-Dimensional Slab Modelling . . . . . . . . . . . . . . . . . . 77
6.3.1 Summary . . . . . . . . . . . . . . . . . . . . . . . . . 90
6.4 The Bailey BRE Method . . . . . . . . . . . . . . . . . . . . . 92
6.5 The Cameron Usmani Method . . . . . . . . . . . . . . . . . . 93
6.6 Catenary and Membrane Mechanisms . . . . . . . . . . . . . . 100
6.7 Thermally Pre-stressed Yield Line . . . . . . . . . . . . . . . . 101
6.7.1 Numerical Modelling . . . . . . . . . . . . . . . . . . . 101
6.7.2 Ultimate Moment of a Heated Section . . . . . . . . . 106
6.7.3 Thermally Prestressed 1-way Spanning Slab . . . . . . 109
6.7.4 Thermally Pre-stressed 2-way Spanning Slab . . . . . . 111
x

6.8 Ultimate Capacity Assessment . . . . . . . . . . . . . . . . . . 113
6.9 Conclusions . . . . . . . . . . . . . . . . . . . . . . . . . . . . 118
7 Tall Building Stability 120
7.1 Introduction . . . . . . . . . . . . . . . . . . . . . . . . . . . . 120
7.2 Weak Floor Failure Mechanism . . . . . . . . . . . . . . . . . 121
7.3 Strong Floor Failure Mechanism . . . . . . . . . . . . . . . . . 123
7.4 Numerical Modelling . . . . . . . . . . . . . . . . . . . . . . . 124
7.5 Analytical Modelling . . . . . . . . . . . . . . . . . . . . . . . 129
7.5.1 Thermal Deflection and Thermal Force . . . . . . . . . 130
7.5.2 Floor Boundary Conditions . . . . . . . . . . . . . . . 131
7.5.3 Horizontal Reaction . . . . . . . . . . . . . . . . . . . . 132
7.5.4 Vector Resolution . . . . . . . . . . . . . . . . . . . . . 133
7.5.5 Catenary Tension . . . . . . . . . . . . . . . . . . . . . 134
7.5.6 Floor Elongation . . . . . . . . . . . . . . . . . . . . . 135
7.5.7 Floor Catenary Deflection . . . . . . . . . . . . . . . . 136
7.5.8 Composite Beam Pull-in Force Example . . . . . . . . 137
7.5.9 Reinforcement Mesh Pull-in Force example . . . . . . . 140
7.6 Column Loading . . . . . . . . . . . . . . . . . . . . . . . . . 142
7.7 Minimum Deflection Required . . . . . . . . . . . . . . . . . . 143
7.8 Failure Mechanism Assessment . . . . . . . . . . . . . . . . . . 145
7.8.1 Floor Failure . . . . . . . . . . . . . . . . . . . . . . . 146
7.8.2 Weak Floor Collapse Mechanism . . . . . . . . . . . . 146
xi

7.8.3 Strong Floor Collapse Mechanism . . . . . . . . . . . . 147
7.9 Proposed Tall Buildings in Fire Stability Assessment Method-ology . . . . . . . . . . . . . . . . . . . . . . . . . . . . . . . . 148
7.9.1 Example . . . . . . . . . . . . . . . . . . . . . . . . . . 151
7.10 Conclusions . . . . . . . . . . . . . . . . . . . . . . . . . . . . 155
8 Case Studies 157
8.1 Introduction . . . . . . . . . . . . . . . . . . . . . . . . . . . . 157
8.2 Building A . . . . . . . . . . . . . . . . . . . . . . . . . . . . . 158
8.2.1 Overview . . . . . . . . . . . . . . . . . . . . . . . . . 159
8.2.2 Structural Scheme Studied . . . . . . . . . . . . . . . . 160
8.2.3 Loading . . . . . . . . . . . . . . . . . . . . . . . . . . 161
8.2.4 Building Layout . . . . . . . . . . . . . . . . . . . . . . 162
8.2.5 Building A Risk Assessment . . . . . . . . . . . . . . . 164
8.2.6 Building A Reliability Assesment . . . . . . . . . . . . 169
8.3 Building B . . . . . . . . . . . . . . . . . . . . . . . . . . . . . 174
8.3.1 Structural Scheme Studied . . . . . . . . . . . . . . . . 178
8.3.2 Design Loading . . . . . . . . . . . . . . . . . . . . . . 179
8.3.3 Building Layout . . . . . . . . . . . . . . . . . . . . . . 179
8.3.4 Building B Risk Assessment . . . . . . . . . . . . . . . 182
8.3.5 Building B Reliability Assessment . . . . . . . . . . . . 185
8.4 Summary . . . . . . . . . . . . . . . . . . . . . . . . . . . . . 193
9 Conclusions 195
xii

9.1 Summary . . . . . . . . . . . . . . . . . . . . . . . . . . . . . 195
9.2 Discussion and Possible Further Work . . . . . . . . . . . . . . 197
References 201
xiii

List of Figures
2.1 Nominal fire curve comparison . . . . . . . . . . . . . . . . . . 11
2.2 One Zone fire model . . . . . . . . . . . . . . . . . . . . . . . 13
2.3 Two zone fire model . . . . . . . . . . . . . . . . . . . . . . . 14
2.4 idealised temperature distribution through a concrete slab . . 17
3.1 British Steel fire tests layout [1] . . . . . . . . . . . . . . . . . 22
3.2 BRE fire tests layout [1] . . . . . . . . . . . . . . . . . . . . . 23
3.3 Thermal deflection due to expansion . . . . . . . . . . . . . . 29
3.4 Thermal deflection due to curvature . . . . . . . . . . . . . . . 29
3.5 thermal forces in the floor system . . . . . . . . . . . . . . . . 30
3.6 stress-strain behaviour of structural steel at ambient and ele-vated temperatures [2] . . . . . . . . . . . . . . . . . . . . . . 33
3.7 coefficient of thermal expansion variation with temperature . . 34
3.8 reduction factors of compressive strength of concrete at ele-vated temperatures . . . . . . . . . . . . . . . . . . . . . . . . 35
3.9 reduction factors of tensile strength of concrete at elevatedtemperatures . . . . . . . . . . . . . . . . . . . . . . . . . . . 36
4.1 Expanding spectrum of solutions [3] . . . . . . . . . . . . . . . 41
xiv

4.2 PEER earthquake engineering performance based design method-ology [4] . . . . . . . . . . . . . . . . . . . . . . . . . . . . . . 42
4.3 Performance system model [5] . . . . . . . . . . . . . . . . . . 43
4.4 Hierarchical approach to performance-based design [6] . . . . . 45
4.5 performance timeline of building response [7] . . . . . . . . . . 48
5.1 NFPA risk matrix [8] . . . . . . . . . . . . . . . . . . . . . . . 54
5.2 The standard stress-strength model . . . . . . . . . . . . . . . 55
5.3 the margin of safety . . . . . . . . . . . . . . . . . . . . . . . . 57
5.4 the reliability factor . . . . . . . . . . . . . . . . . . . . . . . . 58
5.5 variation with exposure of the reliability and reliability goal . 64
5.6 reliability variation with exposure . . . . . . . . . . . . . . . . 65
5.7 resource investment for increasing level of risk analysis [9] . . . 69
5.8 proposed risk matrix . . . . . . . . . . . . . . . . . . . . . . . 70
5.9 complete proposed framework . . . . . . . . . . . . . . . . . . 73
6.1 ambient load deflection behaviour of a concrete slab . . . . . . 76
6.2 load deflection behaviour of a concrete slab at elevated tem-peratures . . . . . . . . . . . . . . . . . . . . . . . . . . . . . 77
6.3 minimum stress values at the bottom slice of the floor slab forthe first load case . . . . . . . . . . . . . . . . . . . . . . . . . 81
6.4 maximum stress values at the bottom slice of the floor slab forthe first load case . . . . . . . . . . . . . . . . . . . . . . . . . 81
6.5 minimum stress values at 3/4 depth of the floor slab for thefirst load case . . . . . . . . . . . . . . . . . . . . . . . . . . . 82
6.6 maximum stress values at 3/4 depth of the floor slab for thefirst load case . . . . . . . . . . . . . . . . . . . . . . . . . . . 82
xv
6.7 minimum stress values at mid of the floor slab for the firstload case . . . . . . . . . . . . . . . . . . . . . . . . . . . . . . 83
6.8 maximum stress values at mid depth of the floor slab for thefirst load case . . . . . . . . . . . . . . . . . . . . . . . . . . . 83
6.9 minimum stress values at quarter of the floor slab for the firstload case . . . . . . . . . . . . . . . . . . . . . . . . . . . . . . 84
6.10 maximum stress values at quarter depth of the floor slab forthe first load case . . . . . . . . . . . . . . . . . . . . . . . . . 84
6.11 minimum stress values at the upper surface of the floor slabfor the first load case . . . . . . . . . . . . . . . . . . . . . . . 85
6.12 maximum stress values at the upper surface of the floor slabfor the first load case . . . . . . . . . . . . . . . . . . . . . . . 85
6.13 minimum stress values at the bottom slice of the floor slab forthe second load case . . . . . . . . . . . . . . . . . . . . . . . 86
6.14 maximum stress values at the bottom slice of the floor slab forthe second load case . . . . . . . . . . . . . . . . . . . . . . . 86
6.15 minimum stress values at 3/4 depth of the floor slab for thesecond load case . . . . . . . . . . . . . . . . . . . . . . . . . . 87
6.16 maximum stress values at 3/4 depth of the floor slab for thesecond load case . . . . . . . . . . . . . . . . . . . . . . . . . . 87
6.17 minimum stress values at mid depth of the floor slab for thesecond load case . . . . . . . . . . . . . . . . . . . . . . . . . . 88
6.18 maximum stress values at mid depth of the floor slab for thesecond load case . . . . . . . . . . . . . . . . . . . . . . . . . . 88
6.19 minimum stress values at quarter of the floor slab for the sec-ond load case . . . . . . . . . . . . . . . . . . . . . . . . . . . 89
6.20 maximum stress values at quarter depth of the floor slab forthe second load case . . . . . . . . . . . . . . . . . . . . . . . 89
xvi

6.21 minimum stress values at the upper surface of the floor slabfor the second load case . . . . . . . . . . . . . . . . . . . . . 90
6.22 maximum stress values at the upper surface of the floor slabfor the second load case . . . . . . . . . . . . . . . . . . . . . 91
6.23 compressive stress vectors along the diagonal of a quartermodel square floor slab under static loading . . . . . . . . . . 103
6.24 compressive stress vectors along the diagonal of a quartermodel square slab under thermal loading only . . . . . . . . . 104
6.25 compressive stress vectors along the diagonal of a quartermodel square slab under thermal and static loading . . . . . . 105
6.26 compressive stresses remain in the plane of the yield line butare not available in the tension-compression couple about theyield line . . . . . . . . . . . . . . . . . . . . . . . . . . . . . . 106
6.27 compressive stress along the top of the yield line . . . . . . . . 107
6.28 deflection along the top of the yield line . . . . . . . . . . . . 108
6.29 strains in the floor section as a result of thermal and static load108
6.30 the eccentricity of the restraining force varies with the deflec-tion of the slab. . . . . . . . . . . . . . . . . . . . . . . . . . . 110
6.31 membrane force variation along the perimeter of a slab . . . . 112
6.32 evolution of ultimate moment at the yield lines of the slab . . 113
6.33 evolution of ultimate moment along yield line projected ontoslab boundary for a 5 m square slab of 200mm depth, As=1130mm2/m50mm from the heated surface exposed to a British standardfire . . . . . . . . . . . . . . . . . . . . . . . . . . . . . . . . . 114
6.34 transition between flexural and a tensile membrane mechanismwith increasing deflection for 1- and 2- way spanning floor slabs115
6.35 schematic capacity variation with span/depth ratio . . . . . . 116
xvii

6.36 after a 20 minutes of a British standard fire, the capacity ofthe two mechanisms over a range of span/depth ratios . . . . . 117
7.1 weak floor collapse mechanism . . . . . . . . . . . . . . . . . . 122
7.2 strong floor failure mechanism . . . . . . . . . . . . . . . . . . 123
7.3 typical multi-storey building plan and representative section . 124
7.4 weak and strong floor collapse mechanisms: 2D FE Model [10] 126
7.5 weak floor horizontal reaction forces . . . . . . . . . . . . . . . 128
7.6 strong floor horizontal recation forces . . . . . . . . . . . . . . 129
7.7 exposed and unexposed steel temperatures . . . . . . . . . . . 131
7.8 lateral stiffness of the exterior column . . . . . . . . . . . . . . 132
7.9 displacements and forces as a result of initial heating . . . . . 133
7.10 total deflections and forces on the floor system under mechan-ical loading . . . . . . . . . . . . . . . . . . . . . . . . . . . . 134
7.11 components of the tension in the floor system . . . . . . . . . 135
7.12 pull-in force example structure . . . . . . . . . . . . . . . . . . 137
7.13 thermal deflection of the floor system in figure 7.12 . . . . . . 138
7.14 pull-in forces based upon the primary beam only . . . . . . . . 139
7.15 total vertical deflection of the floor system . . . . . . . . . . . 140
7.16 pull-in forces on the structure from an A142 steel anti-crackingmesh . . . . . . . . . . . . . . . . . . . . . . . . . . . . . . . . 142
7.17 vertical deflection from the catenary action of the reinforcement143
7.18 transfer of the pull-in forces from the steel reinforcement inthe floor to the column . . . . . . . . . . . . . . . . . . . . . . 144
7.19 simple assessment methodology . . . . . . . . . . . . . . . . . 149
xviii

7.20 2 dimensional representation of the structure . . . . . . . . . . 153
8.1 building A floor plan layout . . . . . . . . . . . . . . . . . . . 158
8.2 building A architectural impression . . . . . . . . . . . . . . . 159
8.3 building A composite slab construction details . . . . . . . . . 160
8.4 building A ground floor plan . . . . . . . . . . . . . . . . . . . 162
8.5 building A first floor plan . . . . . . . . . . . . . . . . . . . . 163
8.6 building A second floor plan . . . . . . . . . . . . . . . . . . . 163
8.7 building A third floor plan . . . . . . . . . . . . . . . . . . . . 163
8.8 Risk matrix . . . . . . . . . . . . . . . . . . . . . . . . . . . . 168
8.9 architectural features of building B . . . . . . . . . . . . . . . 176
8.10 structural layout of building B . . . . . . . . . . . . . . . . . . 177
8.11 building B composite beam/slab detail . . . . . . . . . . . . . 178
8.12 building B ground floor layout . . . . . . . . . . . . . . . . . . 179
8.13 building B 1st floor layout . . . . . . . . . . . . . . . . . . . . 180
8.14 building B 2nd floor layout . . . . . . . . . . . . . . . . . . . . 180
8.15 building B 6th floor layout . . . . . . . . . . . . . . . . . . . . 181
8.16 building B 7th floor layout . . . . . . . . . . . . . . . . . . . . 181
xix

List of Tables
2.1 ASTM E119 fire curve . . . . . . . . . . . . . . . . . . . . . . 10
4.1 fire performance matrix [6] . . . . . . . . . . . . . . . . . . . . 46
5.1 reliability index targets [11] . . . . . . . . . . . . . . . . . . . 66
5.2 reliability index according to frequency . . . . . . . . . . . . . 67
6.1 ductility limits for reinforcing bars according to EC2 . . . . . 98
6.2 summary of capacity dominance in figure 6.35 . . . . . . . . . 116
7.1 details of the numerical models . . . . . . . . . . . . . . . . . 127
7.2 lateral column stiffness at fire floors . . . . . . . . . . . . . . . 153
7.3 pull-in forces . . . . . . . . . . . . . . . . . . . . . . . . . . . . 154
8.1 building A design loading and materials . . . . . . . . . . . . . 161
8.2 total loading for building A including factored accidental loading162
8.3 building A relative fuel load potential . . . . . . . . . . . . . . 165
8.4 building A relative ignition potential . . . . . . . . . . . . . . 166
8.5 building A relative compartment risk ranking . . . . . . . . . 167
xx

8.6 building A Compartment areas and openings . . . . . . . . . . 170
8.7 structural details by compartment . . . . . . . . . . . . . . . . 173
8.8 level IV risk targeted reliability analysis . . . . . . . . . . . . 174
8.9 revised level IV risk targeted reliability analysis . . . . . . . . 175
8.10 level III risk targeted reliability analysis . . . . . . . . . . . . 176
8.11 building B relative fuel load potential . . . . . . . . . . . . . . 184
8.12 building B relative ignition potential . . . . . . . . . . . . . . 185
8.13 building B relative compartment risk ranking . . . . . . . . . 186
8.14 building B Compartment areas and openings . . . . . . . . . . 190
8.15 building B structural details by compartment . . . . . . . . . 191
8.16 level IV risk targeted reliability analysis (building B) . . . . . 192
xxi

1Introduction
1.1 Background to the Project
For the Development of performance based design on a proper scientific basis
the use of the concepts of risk and reliability is inevitable. The application
of the concepts of performance based methodology to actual design is not
simple because of the large ranges of probability and consequences of events
which exist. This is compounded by a plethora of different actions that can
1

be taken to reduce the probabilities of the events and also the magnitude of
the consequences, which is essentially the goal of design.
Clearly while the use of this concept poses major challenges, it also offers
enormous opportunities because of the element of choice inherent in the con-
cept. The designer using these concepts has numerous choices to address his
design problem to enable him to arrive at a solution for which the ’risk is
acceptable’.
Risk is defined as a function of probability and consequence. For our pur-
poses, the probability refers to some undesirable event over a period of time
(which in fire terms could be described as a fire event over a certain critical
magnitude of severity during the design life of the building). Consequence
refers to the effects of the occurrence of the event (in fire terms it would
mean a loss of life, damage to property, damage to business and longer term
damage to society for major events).
Reliability is defined as the probability of ’success’, or the complement of
the probability of failure. A risk-based approach will also allow the calcu-
lation of quantitative estimates of reliability for particular design solutions,
and hence provide stakeholders with a numerical measure for guiding their
choice between various solutions.
2

1.2 Research aims
Although design codes allow for the implementation of performance based de-
sign techniques, the analysis required to understand and quantify complete
structural response is typically computationally intensive. Where numeri-
cal techniques have been validated by classical theories and their validity
demonstrated in well understood ambient conditions, counterpart ’classical’
theories for elevated temperature response have not until relatively recently
existed. Numerical analysis of the Cardington tests as well as other deliber-
ate or accidental fires in large buildings has helped to develop and improve
an understanding of structural behaviour at elevated temperatures. Where
numerous ’simple’ analytical techniques have been developed to determine
response of buildings subject to fire attack, there has been no known attempt
made to develop and combine these techniques in a comprehensive risk or
reliability based design methodology. The primary aim of this project is,
therefore:
• To develop a performance based design methodology for structures in
fire, addressing the concepts of risk and reliability;
To accomplish this, the following has to be addressed as part of the design
framework:
• the probability of a fire event and the consequences of said fire have to
be defined; and,
• a method for the determination of the reliability of a structure given a
fire has to be employed in the framework.
3

As inherently modular, performance based design methodologies require ad-
ditional components which satisfy the performance criteria upon which they
are based. Therefore an additional research goal occurs as a result of the
nature of the primary research goal:
• To draw on previous research which has been carried out in the deter-
mination of structural response and capacity in fire and develop this
research where necessary into a useable tool which can be incorporated
into the design framework.
1.3 Thesis Overview
The following is a summary of the chapters in this thesis:
Chapter 2. Basic Fire Modelling for Structures
In this chapter, various fire models available for structural fire engineering
are introduced. An overview of their level of complexity is given as well as
the level of complexity involved in their use. Basics of heat trasnfer to struc-
tural elements are also described.
Chapter 3. Overview of the Behaviour of Structures in Fire
In this chapter, an overview and a brief review of the behaviour of struc-
tures in fire is given. A brief history of researcgh in the field is given, fol-
lowed by a description of some of the fundamental principles which govern
the behaviour of structures in fire, along with their analytical description.
4

Behaviour of materials under elevated tempertures is briefly described.
Chapter 4. Performance Based Design
The basic principles of performance based design are laid out, describing
the basic elements of a performance based design framework. An overviw of
some of the curreent methodologies is given and their application to fire is
discussed.
Chapter 5. Risk and Reliability
In this chaper the meanings of risk and reliability are described as well as
their difference and the different applications of the concepts. Following this,
a simple risk informed framework for the design of structures in fire is de-
scribed. The framework incorporates a risk assessment to identify areas of
relatively high risk wihtin a building. This is then followed by an assesment
of the reliability of the structure based on real possible fires to evaluate the
current design evolution,
Chapter 6. Floor slab design
This chapter describes the behaviour and capacity of floor slabs over a com-
plete deflection history. An analytical methodology for the determination
of tensile membrane capacity of floor slabs in fire is described. The forces
on the floor slab at low displacements are used to derive a methodology for
the calculation of the capacity of a thermally ’pre-stressed’ floor slab at low
deflections.
5

Chapter 7. Performance based design framework
This chapter describes two possible collapse mechanisms for tall structures
in fire. These mechanisms have been identified previously using numerical
modelling. Following the description of these collapse mechanisms a simple
method for calculating the forces which govern the potential for collapse is
described and a methodology for the assessment of tall building stability in
fire is described.
Chapter 8. Case Study: the SCI buildings
Using the buildings which were designed by the Steel Construction Insti-
tute (the SCI) for their comparative study of building costs, the response of
two buildings using different structural configurations is determined analyti-
cally and changes are suggested using the design framework proposed which
allow the structure to achieve target reliability.
Chapter 9. Discussion and conclusions
A general discussion is given here, summarising the results, conclusions and
any issues which have been brought up in previous chapters.
Possible further work is suggested.
6

2Basic Fire Modelling for
Structural Design
2.1 Introduction
Before beginning any structural design process, the loads which have to be
resisted need to be determined. For structural design for fire resistance,
regardless of whether or not the solution is one of protection or another so-
lution, as will be disucessed in detail later in this thesis, the fire which the
7

structure is required to resist must be defined.
Various fire models exist, with varying degrees of control over their complex-
ity, and some are more suited to use in determining structural loads than
others. With an increase in complexity of the fire model generally comes an
associated increase in the level of input required by the user. The models can
broadly be divided into five categories, which are listed in ascending order of
complexity [12]:
• Nominal fire curves;
• Parametric fire curves;
• One zone fire models;
• Multi-zone fire models, and;
• Field models
These models are described briefly below, however for more information as
to the uses and limitations of these models, additional references should be
consulted.
2.2 Nominal fire curves
Standard temeprature time curves represent an average compartment gas
temperature which varies over the duration of the fire. They are specified
in codes for single structureal element testing methods and being empirical
they do not incorporate any aditional variables, apart from fire duration, to
8

describe the compartment temperature, fire duration, or the fires growth rate.
Their use is limited, especially for rational structural design for fire, except
as a basis for comparison with other more appropriate test methods [13].
The standard British fire curve is the same as the ISO 834 fire curve, and is
given by the equation:
Θg = Θa + 345log10(8t + 1) (2.1)
The British standard fire is intended to be used where the fuel load is mainly
composed of cellulosic material, i.e. wood. Where the fuel source is hydro-
carbon based a more severe fire can occur with an increased heating rate. In
these instances, an alternative design fire is given in the Eurocodes as:
Θg = 1080(1 − 0.325e−.167t− 0.675e−2.5t) + Θa (2.2)
The american ASTM E119 fire curve is not described as an equation, but
rather by a series of data points, Table 2.1, which give temperature values
at different times [14].
A comparison of the three nominal fire curves is shown in figure 2.1. It is
apparent that there is little difference between the British or ISO curves and
the ASTM fire curve. The maximum temperature achieved in the hydro-
carbon fire curve is lower than that achieved over a long duration standard
fire, although the increase in temperature is faster and the fire could be con-
sidered to be more severe for a shorter duration (measures of severity are
largely subjective and a severe fire could be considered such based on any of
the following: a more aggressive heating rate; a longer duration; or a higher
achieved temperature).
9

Time (Minutes) ASTM E119 Temperature (OC)
0 20
5 538
10 704
30 843
60 927
120 1010
240 1093
480 1260
Table 2.1: ASTM E119 fire curve
2.3 Parametric fire curves
Parametric fire curves are described in Eurocode 1 part 1-2 [15]. They pro-
vide a more rational indication of compartment temperatures than those
prescribed by nominal fire curves. They are based on full-scale compartment
fire tests and take into account both the physical characteristics of the com-
partment: the geometry and the effect of the bounding surfaces; and fuel
load in the occupancy.
During the heating phase of the fire, the temperature is described via the
following relationship wiht time:
Θg = Θa + 1325(1 − 0.324e−0.2t∗− 0.204e−1.7t∗
− 0.472e−19t∗) (2.3)
10

Figure 2.1: Nominal fire curve comparison
Where t∗ is the notional time given by the current time multiplied by a factor
Γ representing the opening factor and the compartment boundarys thermal
inertia and their ratios to some reference values:
Γ =(F v/b)
2
(0.04/1160)2(2.4)
Where F v is the ventilation factor (or opening factor) of the compartment
and b is the square root of the thermal inertia of the wall linings. The
ventilation factor is given by the expression:
F v =Av
At
√
Hv (2.5)
Where Av is the sum of the areas of the openings, At is the total area of the
compartment boundaries and Hv is the weighted avergae height of all of the
window and door openings [14].
The Eurocode parametric fire curve is very similar to the so-called ”‘Swedish”’
11

curves of Magnusson and Thelanderson.
Both nominal and parametric fire models describe the fire as an average
compartment tempertaure time curve.
Alternative parametric fire curves have been developed as alternative to the
Eurocode parametric fire, with specific attention paid to their relevance for
structural fire engineering [16]. A number of analyses are run using the zone
model CFAST to study the effects on the fire of fire load, ventilation condi-
tions, geometry and thermal properties of the enclosure. The model relies on
the rate of heat release as input, and accounts for traveling fires by allowing
breakthrough between cells of a compartment and an adjustment of the heat
release rate. However this approach is ultimately conservative since there is
no indication of near and far exposure to the fire and the inherent assumption
appears to be that once ignited, all material contribution to the fire load is
cumulative with no expiry time.
2.4 One Zone Fire Models
One zone fire models have uniform temperature distribution throughout the
compartment, and the gas temperature is calculated by solving the heat
and mass balance equations for the system [14]. A one zone model takes
account of the transfer of mass between the inside of the compartment and
its surroundings and between the fire and the gas in the compartment. As
with the Eurocode paramteric fire, one zone models take account of energy
transfe between the gas, the compartment surroundings, the compartment
12

boundaries and the fire, figure2.2. The physical variables used to describe
the model are [17]:
• Θg, the gas temperature
• m, the mass of the gas inside the compartment
• V , the volume of the compartment
• E, the internal energy of the compartment
• ρ, the density of the gas inside of the compartment
• p, the compartment pressure
The major assumption of the one-zone model is that the physical properties
of the gas are uniformly distributed throughout the compartment.
Figure 2.2: One Zone fire model
The rate of heat release into the compartment from the fire controls the
13

amount of energy allowed into the system; this is balanced with the ener-
gy in the compartment and the energy lost via openings and through the
compartment boundaries.
2.5 Multi Zone Fire Models
A multi-zone fire models is similar in concept to a one zone fire model, with
the important assumption that the compartment can be divided into two sep-
arate regions, figure ??: a hot gas, or smoke, layer abover a cooler gas layer.
Two zone models require the mass and energency balance to be resolved
between the two layers iun the compartment as well as the exterior of the
compartment. They are therefore more onerous than one-zone models. How-
ever, they are particularly suited to situations where the fire is localised [12].
Figure 2.3: Two zone fire model
14

There are eleven variables which describe two zone models, constrained by
the following equations [17]:
ρi = mi/Vi
Ei = cvmiTi
p = RρiTi
V = Vu + VL
Where in the above set of equations, the upper and lower layers are denoted
by i=U,L. Differential relationships between these variables can be derived
from the mass and energy balance equations.
2.6 Field Models
Although similar to multi-zone models, field models solve the equations for
mass and energy at discrete points in space rather than in two separate
layers. Complex compartment geometries can be considered using field mod-
els, and non-linear temperature dependant material properties can be more
easily incorporated into the models. Some examples of field models which
are frequently used for fire modeling are NISTS Fire Dynamics Simulator
(FDS) [18], Ansys CFX [19] and the BRE’s JASMINE model [20].
Field models are computationally intensive and any results obtained from
field models are extremely sensitive to the input chosen by the user [21,22].
15

2.7 Temperature of Structures Exposed to
Fire
There are three mechanisms which control the through depth of a structural
element exposed to fire: conduction, convection and radiation. Conductive
heat transfer describes the balance of energy through a solid or via a solid
interface; convective heat transfer describes the transfer of energy through a
gas-solid interface; and radiative heat transfer describes the transfer of en-
ergy to a solid via the electromagnetic spectrum from a radiative heat source.
Using the nominal temperature time curves described above provides a mean
compartment temperature. For simplicity this is often taken to be the tem-
perature of the exposed surface of all structural components within the com-
partment. This results in the through depth temperature distribution of most
structural elements being controlled by conduction rather than convection or
radiation. For thermally thin materials such as steel and other metals, the
temperature of the element is often assumed to follow the mean compartment
temperature.
Where a steel beam is protected by some material in contact with the section,
BS 7974 [2] provides a simple equation for calculating the mean temperature
of the section given a gas temperature time curve:
∆Tm =1
ρmCm
(Hp
A)ki
di
(Tg − Tm)∆t (2.6)
16

Additionally, Eurocode 2 Annex A provides calculated temperature profiles
for slabs and beams [15]. Annex B of the same document provides a simpli-
fied calculation method.
Through the modelling of the Cardington tests, some simplifications were
made regarding the through depth temperature distribution of floor slabs
and other thermally thick structural elements. The non-linear temperature
distribution was idealised as an equivalent average temperature increase, ∆T ,
and through depth thermal gradient, T, z, Figure 2.4 [23, 24]. All that is re-
quired in this method is that the elongation and curvature strains imposed
by the idealised temperature increase and gradient are equivalent to those
imposed upon the section by the original through depth temperature distri-
bution.
Figure 2.4: idealised temperature distribution through a concrete slab
2.8 Summary
In this chapter an overview was given of the various fire models which can be
used for structural applications. Although the nominal fire curve, including
17

the parametric fire curves are code based and used in design codes to specify
temperatures of fire compartments the more complicated models are permit-
ted as required to rationalise design solutions which are not code based, as
will be discussed in later chapters. The application of these fire models to
structures and various methods of calculating the temperature distribuion
ina heated structural element was also described as well as the mechanisms
which permit heat trasnfer.
18

3Overview of the Basics of
Structures in Fire
3.1 Introduction
Traditional structural design for fire centres on a furnace test of an unre-
strained structural component. The component is subjected to a ’standard
fire’ of some prescribed duration following which the capacity of the com-
ponent is checked to ensure that it meets any loading requirements which
19

it is required to. Testing focuses on the loss of stiffness and strength of the
material, and where the component fails, passive fire protection is applied to
ensure that it could not reach the ’critical’ temperature for the duration of
the furnace test.
On the 23rd of June 1990, a fire broke out in the partially completed struc-
ture of Broadgate phase 8 - a 14 storey composite office building which was
largely completed but which had no passive fire protection installed. The
building did not collapse, although it did suffer very large deflections as a
result of the elevated temperatures.
Although it was widely known at the time that current fire testing tech-
niques were scientifically unsound - failure of elements in a real fire inside of
a highly redundant structure bears little resemblance to failure of elements
in a furnace test - the Broadgate fire led to a more focussed and concerted
effort to understand real frame behaviour in real fires. This was made man-
ifest in the Cardington tests - a set of full scale tests which were carried out
on a composite steel structure inside of the airship hangars at Cardington,
in Bedfordshire.
This work, undertaken jointly by Corus (then British Steel) and the Building
research Establishment (BRE) consisted of 6 full scale fire tests designed and
carried out in order to facilitate a better understanding of the behaviour of
frames subject to fire. The tests were carried out between January 1995 and
July 1996. The UK governments department for the environment transport
and regions funded the partners in technology (DETR PiT) project in 1996 -
a consortium of establishments undertook to analyse the results and develop
20

numerical models to aid in the understanding and analysis of the underlying
mechanics which govern structural response to fire.
The understanding of the principles which govern the behaviour of struc-
tures subject to fire has led to the development of analytical techniques to
describe their behaviour.
This chapter presents a broad overview of the research carried out in the
late 1990’s and the early 2000’s. For more detailed information a number
of sources can be looked at, some of which are referenced here, however for
a good introduction to the behaviour of structures in fire, the original PiT
project report [25] as well as a number of PhD theses from the University
of Edinburgh [1, 26, 27] give a comprehensive overview of the background to
the Cardington tests, their results, and the outcome of the modelling which
followed.
3.2 The Cardington Tests
The Cardington building was an 8 story composite steel frame, designed and
constructed to represent a typical office building in the UK [28]. It was
a braced frame comprised of a composite floor system constructed from an
A142 anti-cracking mesh embedded in a concrete slab with a minimum depth
of 130mm. In plan, the building measured 21 x 45 metres, and it was 33m
in height. Of the six tests which were carried out on the structure 4 were
planned by British Steel plc, and the remaining two were planned by the
BRE.
21

The aims of the tests were threefold:
1. To provide data for numerical analysis of the behaviour of composite
steel frames in fire;
2. To demonstrate the behaviour of multi-storey frames in fire; and,
3. To provide a platform from which to build an understanding of the
behaviour of multi-storey frames in fire upon which design recommen-
dations and, ultimately, practical methodologies can be based.
The layout of the British Steel tests is shown in figure 3.1. These consisted
of, in order, test 1: a restrained beam test, test 2: a plane frame test, test
3: a corner test and test 4: a demonstration test. The BRE tests were of
a corner compartment, and a large compartment; their layout is shown in
figure 3.2.
Figure 3.1: British Steel fire tests layout [1]
22

Figure 3.2: BRE fire tests layout [1]
3.2.1 British Steel Test 1
The first British Steel test was the restrained beam test. It was carried out
on the 7th floor and was designed to demonstrate the real behaviour of a sin-
gle structural element which is restrained by the surrounding structure. The
beam was connected to columns at either end via partial depth end-plates.
It was subject to a furnace fire over most of its length - 0.5m was left outside
of the furnace at either end.
2 things of note were observed in this test. Aside from the expected large
vertical mid-span displacements in the beam, the lower flanges of the beam
and lower depths of the web yielded plastically at either end as a result of
large compressive forces restraining the beams thermal expansion. The large
displacements during heating were not fully recovered upon cooling.
23

3.2.2 British Steel Test 2
The second British Steel test was conducted over the entire length of a series
of 3 beams spanning across the buildings shorter span. It also encompassed
the 4 exposed columns which the beam was connected to, which were left
unprotected for the purposes of this test. The objective of the test was to ob-
serve the behaviour of connections in fire as well as to observe the behaviour
of the frame in the vicinity of the connections. This was the only test where
the columns were exposed to heat directly without passive protection being
applied up to the level of the floor.
The assembly was heated by a furnace, as in the previous test. Similar
behaviour was observed as to the first test: plastic yield and buckling dis-
tortions were observed in the lower flanges of the beams at either end, and
squashing of the column heads occurred directly beneath the floor system.
Large displacements occurred upon heating which were not fully recovered
upon cooling.
3.2.3 British Steel Test 3
The British Steel corner test was designed to study the entire compartment,
and in particular the large deflection ’membrane’ behaviour of the heated
floor. Similar behaviour was observed to the previous tests, large displace-
ments and buckling of the lower flanges as a result of the restraint provided
by the adjacent unheated structure.
24

3.2.4 British Steel Test 4
The 4th British Steel test was designed to demonstrate that the behaviour
observed in the previous tests would occur in a large compartment subject to
a ’real’ fire. The test compartment was the largest of all of the tests carried
out by British Steel, and it covered fully two bays of the structure and a
large portion of the neighbouring bays.
Again, large displacements were observed upon heating that remained par-
tially after cooling. Buckling of the flanges of the beams occurred adjacent
to the connections to the column. Cracking of the concrete floor slab was
observed around the columns, but there was no indication that the structure
was near to failure.
3.2.5 BRE Test 1
The first BRE fire test was conducted on a single corner compartment on the
2nd floor. Although there was a deflection of the structure remaining after
the fire, there was no local buckling observed.
3.2.6 BRE Test 2
The second BRE test was carried out over two full bays of the structure on the
2nd floor. Like most of the British Steel tests, the columns were protected to
the level of the floor. Similar behaviour was observed to the British Steel tests
- large displacements in the floor system and beams, accompanied by local
25
buckling of the lower flanges of the beams about the column connections.
3.2.7 Summary
In all of the tests which were carried out, large deflections were seen to occur
in the horizontal components - the floor slabs and the primary and secondary
beams. However, there was no indication that the structure was ever any-
where near failure during any of the tests. In all but the 1st BRE test which
was carried out, local buckling was observed at either end of the steel beams
as a result of large compressive forces developing in the steel upon heating.
Contrary to the philosophy behind the standard furnace test, the behaviour
of a composite steel frame in fire is not controlled by the behaviour of the
components subject to heating in a determinate mechanical test. The be-
haviour is determined by the ability of a heated component to expand due
to temperature increases; and by the ability of the surrounding structure to
resist this expansion.
3.3 Numerical Studies
A number of numerical studies to understand the behaviour of structures
under thermal actions had been undertaken prior to the Cardington tests.
Some examples of these modelled the behaviour of steel frames subject to
fire using sub frames taking account of the restraint provided by the adjacent
structure [29]. However, there were no available experimental results with
which to compare the data and the only validation that was made was using
26

existing, codified, limiting temperatures.
The PiT project was a joint collaboration between teams at the Universi-
ty of Edinburgh, the BRE, Imperial College London, British Steel and the
SCI. Its goal was [28]:
To understand and exploit the results of the large scale fire tests
at Cardington so that rational design guidance can be developed
for composite steel frameworks at the fire limit state
This was achieved through the development of numerical models of the ex-
isting test data to verify the ability of numerical techniques to model the
phenomena observed [30,31]. These models were then simplified to accurate-
ly predict the behaviour of steel framed structures under thermal effects [32].
Similar models were then developed separately to test the assumptions which
had been made in the original and simplified models [33].
Following the understanding which had been gained from these models and
the results of the Cardington tests, analytical techniques were developed to
accurately predict and explain the response of multi-storey frames to fire.
27

3.4 Analytical Techniques for Describing
the Behaviour of Structures in Fire
3.4.1 Thermal Displacements
The overriding factor which controls the behaviour of steel structures in fire
is the thermal strain and the combination of expansion and restraint which
describes the response of the structure. As will be discussed, this combination
may allow for alternative thermally enhanced mechanisms to mobilise which
allow the structure to sustain the mechanical load to which it is subjected.
The thermal strain is the product of the coefficient of thermal expansion and
of the temperature increase of the material.
εT = α∆T (3.1)
It is mechanically separate and distinct from the mechanical strain, although
it does contribute to the overall total strain [34,35]:
εtot = εmech + εT (3.2)
Considering a determinate beam in fire - one end is supported on a roller
support, and the other is simply supported, i.e. it is free to rotate about
the support but restrained against axial translation. The thermal displace-
ments consist of two components, one dependant upon the expansion strain
caused by the equivalent uniform temperature increase (∆T ) and the other
on curvature strain imposed by the equivalent uniform temperature gradi-
28

ent (T ,z) through the depth of the composite section. The first component,
the additional length generated by the outward translation of the support at
the perimeter of the structure caused by the thermal expansion of the floor
system, is as shown in figure 3.3.
Figure 3.3: Thermal deflection due to expansion
LT = L(1 + εT ) (3.3)
The second component is the inward translation of the support at the perime-
ter of the structure caused by the bowing of the floor system after the ap-
plication of the thermal gradient as shown in figure 3.4. The bowing strains
cause a vertical deflection of the floor system. In combination with the ex-
pansion strains, the thermal curvature strains lead to some horizontal, uT ,
and some vertical, wT , displacement in the floor system, dependant upon the
thermal curvature φ = αT ,z.
Figure 3.4: Thermal deflection due to curvature
εφ = 1 −sinLφ
2Lφ2
(3.4)
29

wT =2L
π
√
εφ +εφ
2
2(3.5)
3.4.2 Thermal Force
Where the thermal strains are accommodated in the structure by deforma-
tions there is no resulting stress in the material. Where the strains are not
accommodated by some displacement of the structure they induce some ther-
mal stress:
σT = EεT (3.6)
Where no lateral translation is allowed in the floor system, the distance
between the supports is fixed. Therefore thermal expansion and thermal
bowing induce lateral forces, NT , and Nφ, at the support, dependant upon
the thermal deflection, wT [35], figure 3.5. The thermal force at the restrained
Figure 3.5: thermal forces in the floor system
ends of the beam is equivalent to the thermal force in the section:
NT = Es(T )AsεT (3.7)
Nφ =
(
√
1
2
(πwT
L
)2
+ 1 − 1
)
Es(T )As (3.8)
30

The total horizontal force at the supports from the thermal loading is the
combined load from the thermal forces:
N tot = NT + Nφ (3.9)
Thermal loading on the section is presented in two components, both related
to the temperature distribution: a thermal force, NT , caused by the restraint
against expansion of the slab heated by the mean temperature; and as a ther-
mal moment, MT , caused by the expansion due to the temperature gradient
present in the section [36].
NT = Ebα
h/2∫
−h/2
T (z) dz = EAα∆T (3.10)
MT = Ebα
h/2∫
−h/2
T (z)z dz = EαT ,zI (3.11)
3.5 Alternative Load Carrying Mechanisms
Although it was widely recognised as a potential action in both ambient and
elevated temperature design for floor systems at large displacements, the
results of the 3rd and 4th British Steel Cardington tests demonstrated the
potential for structures to adopt a catenary or a membrane mechanism in fire.
These mechanisms are greatly enhanced by the presence of non-mechanical
thermal strains in the structure which allow the load to effectively ’hang’
without the build up of large mechanical strains in the material which lead
31

to rupture.
They are discussed further in later chapters.
3.6 Material Properties
Despite the potentially positive effect that thermal expansion may have on a
structure by mobilising alternative mechanisms, thermal action on material
tends to have some negative effect on its stiffness and its strength. BS 7974
and Eurocodes 2 and 4 provide descriptions of the behaviour of materials at
elevated temperatures [2, 37, 38]. This behaviour is relatively intuitive - an
increase in temperature is accompanied by a decrease in both stiffness and
strength - and is only summarised here.
3.6.1 Steel at Elevated Temperatures
The factors which describe stress-strain behaviour of structural steel is shown
in figure 3.6. The yield plateau, not including strain hardening (represent-
ed by the dashed line), is relatively constant between 0 and 400C, although
the modulus of elasticity, or Young’s modulus, reduces with relatively low
temperature increases. These factors are an approximation and assume a
constant strain hardening.
For hot rolled reinforcing steels, the stress-strain behaviour at elevated tem-
perature can be described using the same tables and figures as for structural
steel. Poisson’s ratio of steel is relatively constant at all temperatures, and
32
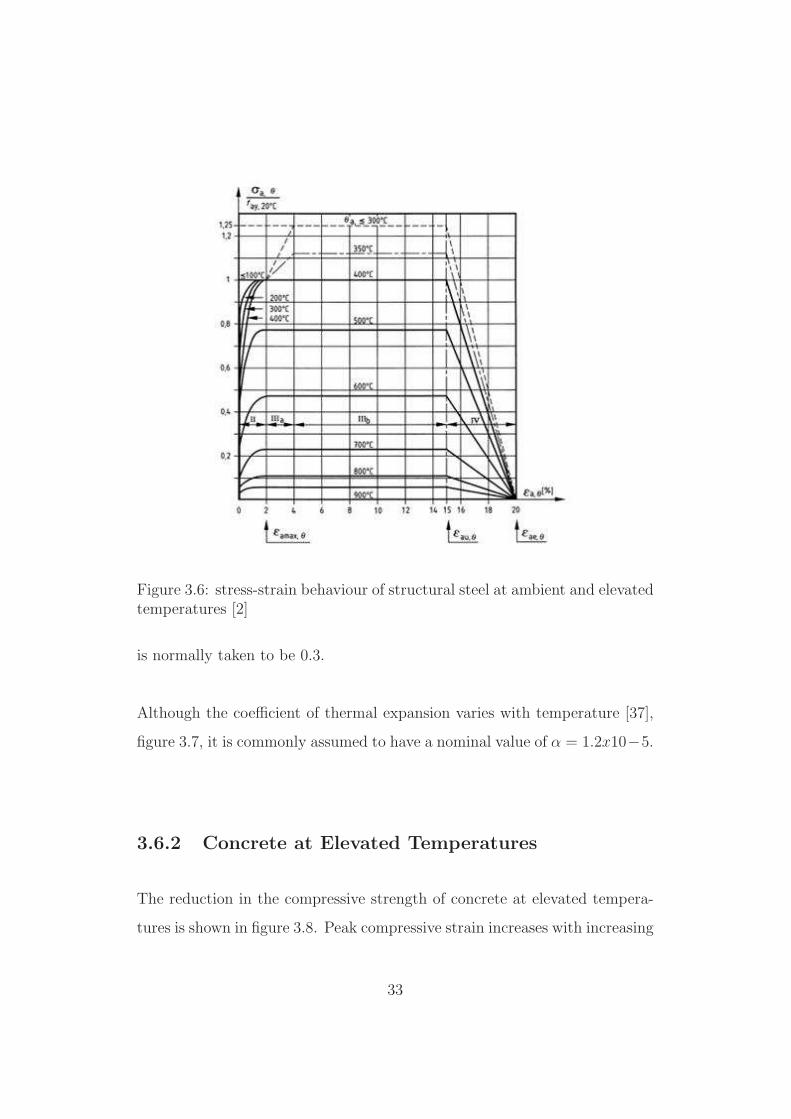
Figure 3.6: stress-strain behaviour of structural steel at ambient and elevatedtemperatures [2]
is normally taken to be 0.3.
Although the coefficient of thermal expansion varies with temperature [37],
figure 3.7, it is commonly assumed to have a nominal value of α = 1.2x10⁻⁵.
3.6.2 Concrete at Elevated Temperatures
The reduction in the compressive strength of concrete at elevated tempera-
tures is shown in figure 3.8. Peak compressive strain increases with increasing
33
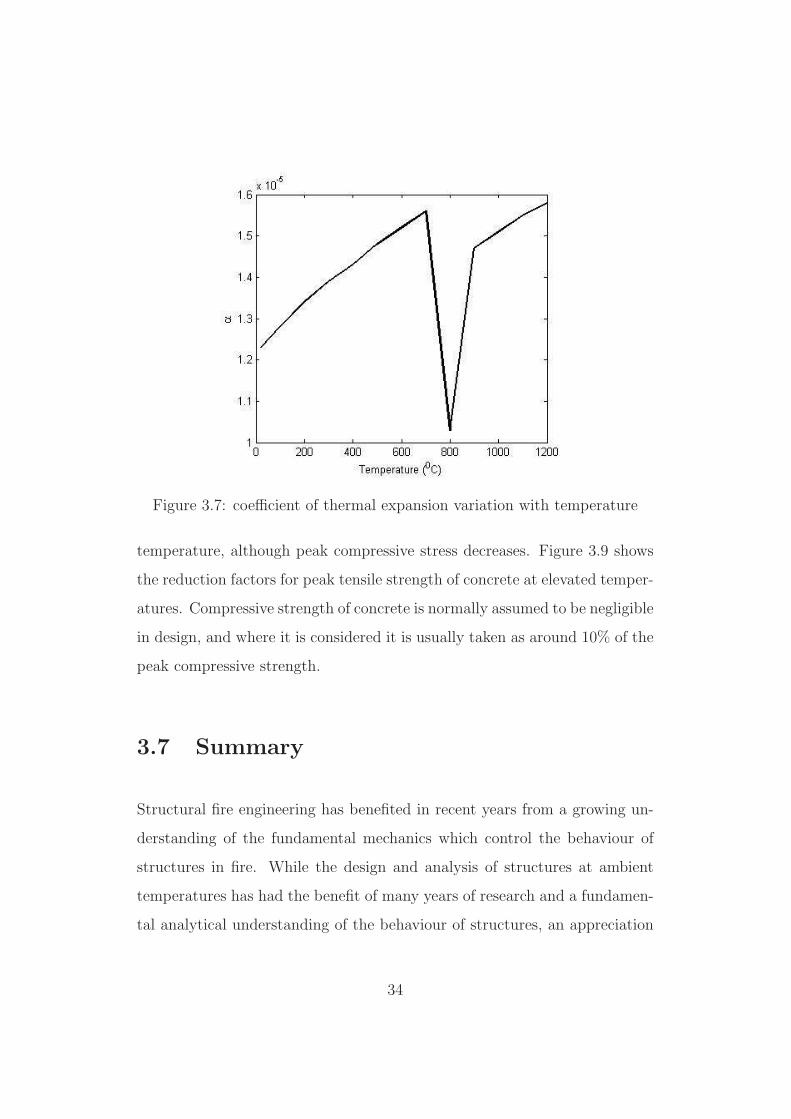
Figure 3.7: coefficient of thermal expansion variation with temperature
temperature, although peak compressive stress decreases. Figure 3.9 shows
the reduction factors for peak tensile strength of concrete at elevated temper-
atures. Compressive strength of concrete is normally assumed to be negligible
in design, and where it is considered it is usually taken as around 10% of the
peak compressive strength.
3.7 Summary
Structural fire engineering has benefited in recent years from a growing un-
derstanding of the fundamental mechanics which control the behaviour of
structures in fire. While the design and analysis of structures at ambient
temperatures has had the benefit of many years of research and a fundamen-
tal analytical understanding of the behaviour of structures, an appreciation
34

Figure 3.8: reduction factors of compressive strength of concrete at elevatedtemperatures
of the principles of structures in fire has only relatively recently been avail-
able for structures in fire.
Theories and mechanisms identified and developed through the numerical
analysis of the response of real structures to deliberate or accidental fires
has allowed for the validation of simple analytical theories which accurately
describe and predict the behaviour of structural systems to elevated temper-
atures.
Although temperature dependant material properties are of importance when
analysing the response of real frames in fire, these methods have departed
from the traditional emphasis on the effect of temperature on structural stiff-
ness and strength. They therefore allow for a more rational and proportionate
response to the problem of structural design for fire attack.
35

Figure 3.9: reduction factors of tensile strength of concrete at elevated tem-peratures
36

4Performance Based Design
4.1 Introduction
Performance based design is an alternative to prescriptive code based de-
sign which has developed over the last few years in a number of engineering
disciplines. It changes the goal of design from that of attaining a ’deemed
to satisfy’ solution to a solution which can be shown to meet performance
goals as set out at the beginning of a project. The performance goals are
37

the statement of intent of the design. They can meet any number of criteria:
financial; life safety; environmental; structural stability or integrity; cost to
repair or recover or any combination of these goals. They are specified in
standard cases by authorities having jurisdiction and are normally disposed
to the assurance of life safety and reducing environmental contamination as
opposed to other goals. However, for low probability/extreme consequence
events such as earthquakes or fires, there is a great deal of scope for both
improvement of safety and cost saving. This can be achieved by adopting
an approach to the design of the building which not only considers the life
safety and environmental consequences of the event but also other factors
which may be of interest to the project owners such as the cost to repair or
replace in the event of a fire.
While prescriptive codes describe how a structure should be designed to
meet performance goals which are hidden in the design codes, performance
based codes should allow for a specification of the performance goal and
should allow for any solution to be composed which can be demonstrated
to meet these goals. The performance goals specified depend upon the type
of design being carried out: severe weather; earthquake; fire. In fire safety
engineering, prescriptive codes specify how to achieve minimum levels of fire
resistance times for structures, performance based codes should detail how
levels of performance should be calculated and allow sufficient scope for the
Engineer to design a solution which achieves the desired performance.
Prescriptive codes rely upon a similar philosophy to traditional fire test-
ing techniques: elements are protected from thermal effects to prevent a loss
of strength and stiffness by ensuring an appropriate level of insulation from
38

temperature increases. A fully performance based code would allow the user
to define the required performance goal for a structural element in situ in
the structure, with the appropriate static, dynamic and fire loading. For a
complete building system, however, it may also look at methods of fire sup-
pression, containment, and methods of reducing the impact of a fire attack.
4.2 History of Performance Based Design
Performance based codes for building design first began appearing in the USA
in the 1970’s [39], and their proliferation across most of the building regu-
lations in place worldwide has been steady. Notably in Europe, where the
Conseil International de Batiment (CIB) issuing a report in 1982 in which
prescriptive codes were found to be restrictive and inefficient. The report
detailed performance requirements and how they can be gleaned from pre-
scriptive codes and also gave some sample solutions of how these performance
goals could be applied . The current Eurocodes, developed by the CIB, all
accept a performance based solution as opposed to the ’deemed to satisfy’
prescriptive solution.
4.3 Fundamentals of Performance Based
Design
Performance based design is based upon three main criteria [40]:
• Definition of the objectives of the design process
39

• Investigation of the alternative designs available to meet the objectives
• Reliability and risk assessment of alternatives to select the most efficient
solution
The basic elements of a performance based design framework are defined in
such a way as to allow the user freedom to compose any solution to the prob-
lem, allowing also the freedom to employ new techniques and technology as
they become available. The objectives must be clearly stated at the outset
of the project, and any design solution which fulfils these objectives whilst
still adhering to the performance targets of the design framework should be
permitted. It should be noted that although the targets in terms of life,
property and business protection may remain similar to those prescribed in
prescriptive design codes, these targets should remain independent of the
prescriptive building code performance goals.
There are many justifications for the use of performance based design codes
as opposed to prescriptive design codes. Although prescriptive codes are still
in use in many countries it is generally accepted that these are flawed in
many ways [39].
Prescriptive codes are based upon previous experience: safety and design
criteria were prescribed individually and independently of each other. How-
ever, this is rarely the most cost effective and resource efficient method of
design, since the inefficiency of prescriptive techniques tends to lead to an
overlapping of fire safety measures. The use of performance based codes al-
lows for the use of advances in both fire science and engineering to facilitate
an optimum design, one which meets not only the code safety objectives but
40

also the needs of the designer and of the user.
While the prescriptive codes are simple and easy to work with, Performance
based design allows the engineer a degree of flexibility in selecting a method
for design so that a structure resists both a fire load as well as a static design
load. It is possible for the engineer to innovate, and use the behaviour of
materials and structural arrangements to their advantage, possibly reducing
cost, and with the ultimate goal of optimising the final design. Ultimately, a
performance based approach increases the range of solutions which are open
to the design engineer over a prescriptive approach, figure 4.1 [3].
Figure 4.1: Expanding spectrum of solutions [3]
4.4 Performance Based Design Frameworks
Traditional design techniques approach the design of structures for acciden-
tal and severe loading in a very linear manner, approaching the problem by
defining the loading and then applying this loading to the structure. This is
41

particularly well illustrated for earthquake engineering in many instances , for
example Irfanoglu [41] presents a comprehensive framework for performance
based earthquake design which uses utility functions to assess performance
under multiple objectives.
The application of the concepts of performance based design to fire engineer-
ing has also been attempted, in particular by Hamilton et al. [4], where the
authors propose a Performance Based Fire Engineering Methodology which
follows the linear process of Fire Hazard Analysis, Structural Analysis, Dam-
age Assessment and finally loss and risk assessment. This methodology is an
exact mapping of a performance based structural engineering methodology
for earthquake design developed at the John A. Blume Pacific Earthquake
Engineering Research (PEER) Centre, figure 4.2, with Seismic Hazard Anal-
ysis replaced by Fire Hazard Analysis. This same linear methodology can
Figure 4.2: PEER earthquake engineering performance based design method-ology [4]
be utilised for the performance based design of almost any system under any
form of extreme extrinsic loading. However while the acceleration and loca-
42

tion of earthquakes is independent of the structure which is being designed;
fire loading is inherently intrinsic and varies with the structure in question
and with the features of the building. The ’worst case’ fire varies from com-
ponent to component and from performance goal to performance goal.
Barry [5] describes a complete performance based design framework which
flows the steps of Appraisal, Analysis, Performance and Assessment, figure
4.3. A complete set of design fires and fire scenarios is developed and the
performance of a system is assessed. Although this methodology focuses on
industrial risk assessment rather than structural design, a number of the con-
cepts in the work are relevant and can be applied to structures in fire. Of
Figure 4.3: Performance system model [5]
particular relevance is the development of a number of possible fire scenarios
for a component or system and the assessment of building performance as a
result of these events and based upon the likelihood of the initiating event.
Although this is onerous in terms of the amount of calculation required for
design and assessment, this is one of the only solutions which allows for any-
thing other than an ad-hoc design methodology which is based upon a single
design fire.
In Barry’s book, the actual event probability for risk assessment is estimated
using an event tree. This process is used to achieve a ranking of high risk
43

components of the system for mitigation in the framework.
4.5 Performance Goals
Moving from performance based codes to prescriptive codes has led to a re-
quirement for the explicit statement of performance goals and requirements
of the system. While the methodologies employed to both quantify and
assess system performance are left open where performance based design is
allowed, the acceptable levels of performance for buildings has to be classified
and prescribed externally. A common approach to the allowance of perfor-
mance based design in building codes is the use of a hierarchical system for
the overall design of buildings which allows for both a performance based
and a prescriptive based approach [6, 42], figure 4.4. In this approach, the
functional requirements are consistent for both prescriptive and performance
based codes, and whether a ’deemed to satisfy’ solution is implemented or
a fully performance based solution is engineered depends upon the decisions
made earlier in the project, while the performance requirements and the ac-
ceptable methods are being determined or stated. This approach in turn has
led to a necessity for the classification of buildings for extreme events where
the performance requirements are stated based on the type of building and
its utilisation.
Mowrer [6] proposes a fire performance matrix, table 4.1, which is based
upon the performance groups defined in the ASCE 7 standard:
• Group 1 - this group includes buildings which are normally unoccu-
pied, such as agricultural buildings and sheds. Significant loss of life is
44

Figure 4.4: Hierarchical approach to performance-based design [6]
unlikely given occurrence of a fire in these buildings.
• Group 2 - this group includes most other buildings, such as residential,
retail and commercial structures. Occupants are not restricted in their
mobility.
• Group 3 - this group includes buildings which are occupied by large
groups of people, services or by people with reduced mobility. Loss of
life is likely given an extreme event.
• Group 4 - these buildings are deemed high consequence buildings. They
are essential for public welfare and include hospitals, police stations and
fire stations.
In the performance matrix, performance levels are defined for structural ap-
plications as:
• Mild - No damage
• Moderate - Moderate, repairable
45

Performance Groups
Performance I II III IV
Level
Severe Infrequent Rare Very Rare Extremely Rare
High Frequent Infrequent Rare Very Rare
Moderate Very Frequent Frequent Infrequent Rare
Mild Very Frequent Very Frequent Frequent Infrequent
Table 4.1: fire performance matrix [6]
• High - Significant, repairable
• Severe - Substantial, irreparable
These performance goals are, fundamentally, qualitative and their specific
application to design is only valid in a general sense.
Beller [42] addresses the suitability of qualitative and quantitative state-
ments of goals in performance based design codes. Since performance based
codes are meant to provide a link or a dialogue of the process which society
expects a building to perform to and the design which is meant to meet these
objectives. Therefore both qualitative and quantitative statement of goals is
necessary, although at different stages in the process of design. Qualitative
statements reflect the expectations which society and the profession places
upon a structure, whereas quantitative goals reflect the suitability of the final
design to meet these goals.
A method for determining reliability acceptance criteria for exceptional struc-
46

tures is detailed in [43]. Although this details consequences of extreme events
in terms of life, economy, cultural assets and the environment as opposed to
structural consequences.
Figure 4.5 [7] illustrates schematically building performance goals in fire in
terms of evacuation and structural integrity. Performance goals over the
course of fire growth are prescribed for the room of origin; the floor of origin;
and the entire building in terms of tenability limits of the compartments and
the integrity of the structure in fire. Design codes allow for the reduction in
design loading given extreme events [44]. During a fire attack on a building
the design loading may vary with the time of exposure. Early on in a fire, the
design static loading will be very similar to ambient static loading, with this
value reducing as fire progresses until the structure is required to sustain only
its own self weight. The characteristic design load is therefore a function of
time. This method of determining performance goal takes account of a num-
ber of different performance criteria of importance to fire safety engineering,
and the specification of tenability limits as a function of evacuation times
is of use to fire safety engineers. The specification of the goal of structural
integrity seems to be a reasonable goal since no fire will burn indefinitely.
The loss of structural integrity shown in figure 4.5 should therefore not be
allowed to occur.
4.6 Summary
Performance based design is a concept which offers designers the ability to
specify their own criteria for acceptance of a solution. They are effectively
47
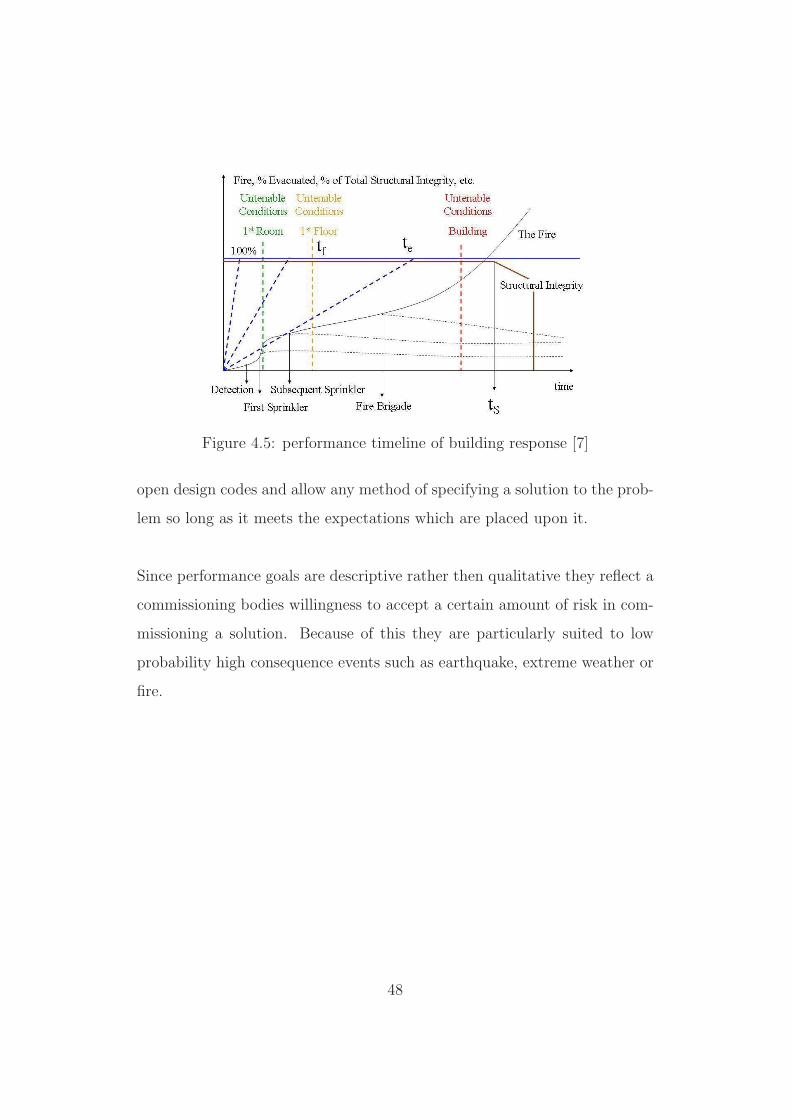
Figure 4.5: performance timeline of building response [7]
open design codes and allow any method of specifying a solution to the prob-
lem so long as it meets the expectations which are placed upon it.
Since performance goals are descriptive rather then qualitative they reflect a
commissioning bodies willingness to accept a certain amount of risk in com-
missioning a solution. Because of this they are particularly suited to low
probability high consequence events such as earthquake, extreme weather or
fire.
48

5Risk and Reliability
5.1 Risk Assessment
The concept of risk is a very subjective one. What constitutes a high risk
to one person may be deemed to be a low risk to another, depending upon
their perspective. While risk is determined by the product of the probability
and the consequence of an event, equation(1.1), as a meaningful measure for
design unless it is based upon reliable statistical data it is limited by the fact
49

that any risk acceptance decision is a value judgement dependant upon the
risk analysis done in the first place and upon the experience and opinion of
the engineer doing the analysis.
Risk = Probability × Consequence (5.1)
As discussed in the previous chapter, as a value judgement, risk represents
the goals which society expects a structure or building to achieve. A com-
prehensive risk assessment will enable the identification and ranking of high
risk areas for more detailed design.
5.2 Risk Based Design Goal
The consideration of fire as a load in every part of a building is an onerous
task and in many cases it is not practical due to time or financial constraints.
especially for such a low probability event.
The potential for a serious fire event occurring in different areas of a building
is largely dependant upon the use and occupancy of those areas. Similarly,
the potential consequences in terms of structural stability or integrity are
largely dependant upon the design. However, by assessing both the likeli-
hood and the consequences of a fire event in an area regions of higher risk
can be identified for more detailed design.
The purpose of this identification as part of a design framework will be to
rank compartments in terms of overall risk and to demonstrate by other
means that components conform to any predetermined design goals. These
50

high risk regions should be individually checked for acceptance until a suit-
ably low risk is found for the entire building. A suitable risk based framework
for structural design should describe methodologies to identify these higher
risk areas and their systematic targeting according to some risk or hazard
ranking in order to reduce the overall risk to the structure.
5.3 Acceptable Risk
The lower level of acceptable risk will depend upon a number of factors,
including but not limited to: the building owners, the authority having ju-
risdiction, the insurers, and the building occupants. It will also depend upon
the proposed use of the building: some occupancies have naturally higher
risk associated with them either as a result of processes being carried out
within the building, for manufacturing or other facilities, or as a result of
arson or terrorist attacks on, for example, schools or on high profile public
buildings.
This concept of acceptable risk is recognised, although not explicitly, in a
number of current design codes where life safety objectives are altered de-
pending upon the occupancy.
5.4 Fire Probability
Much of the previous work on risk based fire safety design has tended to
employ annual return periods of fires of given severities, similar to the way
51

in which earthquake probability is defined. Lin [45] uses a Poisson process to
model the probability of fires based upon numbers of annual fire occurrences
and floor area. This is similar in approach to work by Ramachandran [46],
where the risk from a fire is defined as the product of the probability of fire
occurrence and the floor area damaged. While potentially viable as statistical
measures of fire loss, these methods are generally unsuitable for structural
design since fire is often man made, not a natural phenomenon, and proba-
bilities derived from fire statistics do not reflect the poor informativeness of
the relatively small sample group of fire ignition.
Some local bodies or groups maintain their own records and statistics of
fire occurences and these are subject to analysis and interpretation, however
these analyses range from the very informative [47] and useful for developing
a range of scenarios, including estimates of fire growth rate and fuel load
by occupancy type, to the descriptive [48]. Any rational attempt to design
based on these analyses will be only applicable for the region or country
from which the statistics are collected and will not be a general application
of the concepts. Of use, however, may be some sort of a map which collects
fire statistics and from which social factors can also be incorporated into the
design information.
The following corollaries are therefore proposed for the design of buildings
for fire:
1. For Structural design, a building has to be designed under the assump-
tion that a meaningful fire will occur, i.e. P(fire occurring)=1.
2. The quantification of the probability of a particular fire event occurring
52

in a building cannot be simply described as a probability over a return
period. This is at odds with existing frameworks for exceptional and
accidental loading and suggests that other design frameworks cannot
simply have their wording changed to address fire loading.
3. It is unscientific to use historical data to derive statistics for use within
a design process and draw probability distributions of fire duration or
temperatures for use in a risk assessment.
4. The perceived risk should be associated with real and possible fires in
the building being designed and the subjective consequence of these
fires on the structure. This data should be based upon information
about the individual construction project and its proposed usage.
The second, third and fourth points above are addressed in work by Hostikka
and Keski-Rahkonnen [49], where the probability of the fire and the associ-
ated consequences are directly related to assumed probability distributions
of the variables associated with the fire model and system being designed.
Although this work was not focussed on the risk as a result of fire, it did
model the probabilities of a number of fire events occurring as a product of a
number of assumed distributions of input variables for the model which was
considered the most likely outcome of an event.
5.5 Risk Matrix
A risk matrix is a simple graphical tool for assessing risk. It correlates the
likelihood of an event with its severity to provide a simple visual assess-
ment of the risk associated with the occurrence of the event. NFPA 551 [8]
53

provides a simple example of this concept, figure 5.1. In the example, the
Figure 5.1: NFPA risk matrix [8]
consequences are listed along the horizontal axis and the probabilities are
listed along the vertical axis. High consequence - high probability events
have higher risk than low probability - low consequence events. All combi-
nations of the intermediate categories have some intermediate level of risk
associated with them. In this example there are three risk classifications
which are distributed between the different combinations.
This is a common management tool for assessing risks and is used widely
in one form or another throughout the construction industry.
54

5.6 Reliability
The current Eurocodes present a design framework which is based upon the
First Order Reliability Method, or FORM. The targets of the Eurocodes are
based upon indices of Safety or Reliability. The reliability of a system (or
component) is a measure of the probability that the load on the system will
be less than the systems resistance. This concept is the basis for the partial
safety factors which are prevalent throughout design codes worldwide, and it
therefore seems only natural to apply it to structural fire safety design.
5.6.1 Reliability Theory
The standard stress-strength model is shown in figure 5.2. The load on
the system is represented by normally distributed random variable Q, and
the resistance of the system is represented by normally distributed random
variable R. The probability of failure of the system is the probability that
the resistance will be less than the load, equation 5.2.
Figure 5.2: The standard stress-strength model
55

P f = P (R < Q) (5.2)
For some characteristic value, Q∗, of Q, this is:
P f = P (R < Q∗) =
∞∫
Q∗
R dLoad (5.3)
In cases where Q is also unknown:
P f = P (R < Q) =
∞∫
−∞
∞∫
Q
RQ d2Load (5.4)
The reliability of a system, SR, is the probability that the strength is greater
than the stress on the system, i.e. SR = P (Q < R) [50].
SR = P (Q < R∗) =
R∗
∫
−∞
Q dLoad (5.5)
SR = P (Q < R) =
∞∫
−∞
R∫
−∞
QR d2Load (5.6)
The conventional factor of safety of a system is the ratio of the resistance to
the load applied [51].
FS =R∗
Q∗(5.7)
Factors of safety are prescribed such that probabilistically the resistance of a
system will be such that the system will be able to withstand a design load.
For serviceability limit states these factors are applied to the loads, whereas
for ultimate states the factors are applied to the system.
56

The margin of safety is the margin between the load and the resistance
of the system. For characteristic values of these, figure 5.3, this is given be
equation 5.8.
M = R∗− Q∗ (5.8)
For normally distributed values of Q and R, the margin of safety is also
Figure 5.3: the margin of safety
normally distributed [40], and has mean and variance dependant upon the
mean and variance of Q and R.
µM = µR − µQ (5.9)
var(M) = σ2M = σ2
R + σ2Q (5.10)
The reliability factor, β, is the number of standard deviations of the margin
of safety between its mean and 0, figure 5.4.
β =µM
σM
(5.11)
57

Figure 5.4: the reliability factor
5.7 Reliability of Structures in Fire
A number of sources suggest that the concept of reliability should be applied
to structures in fire. The SFPE handbook describes the concept of reliability
as a tool for measuring the failure rate of a system [52], and also for estimat-
ing physical responses of material and components in fire [53]. Alternative
sources describe the concepts of reliability within the derivation of a perfor-
mance based framework for structural design [40,50], although there is little
or no illustration or discussion of the proposed application.
The relationship between the reliability of a component or a series of com-
ponents and the features of the building in which it is contained is not one
that is normally addressed as part of a reliability calculation. However, it is
known that the details of a compartment control the potential thermal load
within and on a building and this interaction is of primary importance in the
determination of structural reliability in fire. It must therefore be included
as a factor in the acceptance or otherwise of a design.
58

Given a protected component, such as an encased column; or a component
which is not exposed to any increase in temperature; the ’thermal loading’
of surrounding components will manifest itself through additional thermo-
mechanical loads which need to be considered in addition to the dead and
live loading of the structure. For unprotected components or components
which adopt an alternative, thermally enhanced or controlled, mechanism
for carrying the static load ’thermal loading’ in terms of the temperature
increase of the component needs to be considered when selecting the active
mechanism, this is in addition to the thermo-mechanical loading which needs
to be considered and the ’standard’ dead and live ’static’ loading.
While the current design codes do allow for a reduction in static loading
when a fire occurs, the load which a structure must be designed to resist
does not vary with the magnitude of the fire, and it is still generally a pre-
scribed one. Additional loads will, nevertheless, manifest themselves as a
result of the structures adoption of alternative mechanisms. Without restat-
ing the static load imposed upon a structure, a framework for structural fire
safety design which includes an assessment of reliability can be developed and
which is in line with existing design methodologies for static and dynamic
loading.
5.7.1 Thermal Load Variation
As discussed in previous chapters, the list of variables which affect the de-
velopment and spread of a fire in a compartment is potentially endless, and
the more complicated the model used, the more variables which need to be
59

defined. From the robust nominal standard fire curve; where the duration of
the fire has to be declared, to the finest celled field model; where the equa-
tions for mass, energy and momentum have to be solved in every field, add to
that energy loss through the boundaries and radiative heat transfer and the
number of variables can become unmanageable. A balance has to be struck
between reasonable certainty in the model, appropriateness of the model for
the purpose it is required, and complexity of the model.
The variables which affect the temperature in a compartment fire can broad-
ly be separated into two groups: constant and non-constant variables. The
constant variables are those which are not changing on a day to day basis;
e.g. variables such as construction material properties, compartment geom-
etry, compartment boundary construction, and occupancy. Although these
variables have some random distribution, they are generally specified in the
design process at ambient temperatures by nominal values. It should be
noted that suitable research into the variation of material properties at ele-
vated temperatures has not been carried out, and the only values which can
be relied upon are the variation of the materials at ambient temperatures.
Those variables which are non-constant are those which can change through-
out not just the life of the building but from day to day use of the building;
e.g. fuel load, fuel distribution (compartment configuration), and ventilation
conditions. These indeterminate variables are those which cannot be fore-
seen during the design process and only a range of values with indefinable
probabilities can be determined.
According to Knight [54], there are three types of probability relevant to
decision making:
60

1. ”‘a priori probability”’, which applies where there is ”‘absolute homo-
geneous classification of instances, completely identical except for really
indeterminate factors”’;
2. ”‘statistical probability”’, namely, ”‘empirical evaluation of the fre-
quency of association between predicates”’; and
3. ”‘estimates”’, which ”‘must be radically distinguished from probability
or chance of either type”’
Evidently, ”a priori” probability and ”statistical” probability are ill suited
to the study of fire since there is neither homogeneity between events nor
a large enough number of samples for there to be a reasonable informative-
ness in the frequencies obtained. From the points listed, it is clear that the
probability of a fire falls into the third classification of probability as defined
by Knight: estimates. It is proposed to use estimates of the variables which
affect compartment temperature in determining reliability in fire. In design-
ing a sample set of fires using assumed probabilities of the input variables
for the fire model, no dependency upon the probability of a fire occurring
is required, this is accounted for in the risk assessment stage of the design
process by assessing the relative likelihood of occurrence of a fire in each
location. This proposed estimation of a sample set of fires satisfies the 2nd
3rd and 4th corollaries listed above, and allows the design to be based upon
a range of possible real fires in a building.
61

5.7.2 Reliability Calculation
The loading and the resistance of any component in fire is a complex product
of a number of variables, and the determination of the actual reliability
can only be achieved by integrating the load and resistance function where
necessary of the mechanism being designed for over the entire sample space
of variables.
5.7.2.1 Performance Function
Describing the complex system, Z, of load and resistance using the perfor-
mance function of the variables which describe the system, X [55]:
Z = Z(X1, X2, ..., Xn) = Resistance − Load (5.12)
Each of these variables has some distribution either random or deterministic,
and the reliability of the system is given by:
SR = 1 − P f = 1 −
∫
...
∫
fx1,x2,...,xn(x1, x2, ..., xn)dx1dx2, ..., dxn (5.13)
The use of the performance function must consider the effects of fire at each
stage of the design process. At the initial statement of the problem the
active mechanism should be considered, whether it is a thermally enhanced
one, or changing with the exposure. The actual analysis of the structure
should consider all loads; dead loads, live loads and any additional thermo-
mechanical loads:
62

Q = f
Dead Loads
Live Loads
Thermo − mechanical Loads
The actual integration of the performance function and the determination of
the reliability of a structure, system or component is an onerous one which
becomes more and more complicated with increasing complexity of both the
structural model and the model which is used to describe the fire. Since
the number of variables becomes increasingly difficult to manage, alternative
methods for the integration of the performance function are required. There
are two common methods for doing this [55]: Taylor series expansion and
Monte Carlo analysis.
5.7.2.2 Monte Carlo Analysis
Monte Carlo analysis is a random sampling technique which draws on a
library of variables and their distributions to generate N random events. As
with statistical probability, the informativeness of the resulting distribution
increases with the number of events, N.
SR = 1 −N f
N(5.14)
63

5.8 Reliability Goals
For any given system, of resistance R, subjected to a load, Q, the reliability
of the system will vary with the degree of exposure, figure 5.5. The goal
of design must be to improve the resistance of the system so that the per-
formance goal in terms of reliability of the project is met for all reasonable
exposure values, as set out at the beginning of the project. The reliability
goal of the system can be reduced in accordance with the increased ’tolerable’
risk to the structure with increased exposure. Figure 5.6 shows the expected
Figure 5.5: variation with exposure of the reliability and reliability goal
evolution of the stress-strength model over the duration of exposure to a fire,
including a stepped reduction in the load on the structure as well as a gradual
change in the resistance of the system. At ambient, the stress-strength model
is as described above, with Qa and Ra the static design values for strength
and resistance. Allowing for the reduction in design loading, the required
load resistance (strength) of the structure, R(T, t) is reduced over the time
to evacuation while the actual structural resistance (stress), changes with
increased duration of exposure to fire. Since the fire will never be known at
64

the outset of the project, the performance goals of the building have to be
set irrespective of the fire itself, hence the stress, Q(t) does not vary with the
actual fire but rather the duration of exposure. Following some exceptional
and prolonged level of exposure it should be expected that the system will no
longer be able to sustain its own self weight and collapse of the structure will
ensue. Diamantidis [56] lists the Eurocode [11] classification system based
Figure 5.6: reliability variation with exposure
upon consequences of failure, although he defines the ratio of expected loss,
ρ, between total costs including; initial construction costs and losses due to
failure; and construction costs. Target reliability indices and probabilities of
failure for these classes are then defined, table 5.1.
Class 1 - Minor consequences: Risk to life, given a failure, is small to negli-
gible and economic consequences are small or negligible - ρ is less than 2
65

1 2 3 4
Relative Minor Moderate Large
cost of consequences consequences consequences
safety of failure of failure of failure
measure
Large β = 3.1 β = 3.3 β = 3.7
(P f ≈ 10−3) (P f ≈ 5 × 10⁻⁴) (P f ≈ 10−4)
Normal β = 3.7 β = 4.2 β = 4.4
(P f ≈ 10−4) (P f ≈ 10−5) (P f ≈ 5 × 10⁻⁶)
Small β = 4.2 β = 4.4 β = 4.7
(P f ≈ 10−5) (P f ≈ 5 × 10⁻⁵) (P f ≈ 10−6)
Table 5.1: reliability index targets [11]
Class 2 - Moderate consequences: Risk to life, given a failure, is medium
or economic consequences are considerable - ρ is between 2 and 5
Class 3 - Major consequences: Risk to life, given a failure, is high or economic
consequences are significant - ρ is between 5 and 10
Using an order of magnitude approach, the probability of failure of the perfor-
mance goals is related to the allowable frequency of occurrence of the event.
The probability of failure can be mapped to the reliability index [51], and re-
liability targets set for structures exposed to fire based upon the performance
group classification described in the previous chapter and the performance
level required, table 5.2.
66

Relative Conditional β
frequency P (R > Q)
Very frequent > 10−1
Frequent 10−1 1.29
Infrequent 10−2 2.33
Rare 10−3 3.1
Very Rare 10−4 3.72
Extremely Rare 10−5 4.25
Table 5.2: reliability index according to frequency
5.9 Risk Informed Framework for Structural
Fire Design
As previously described, the goals of a risk assessment is to satisfy the qual-
itative expectations which are placed upon a structure whereas the goal in
carrying out a reliability assessment of a structure is to demonstrate suitabil-
ity of the solution for the purpose for which it is intended. However, because
of the extremely low probability of fire and the indeterminacy of the fire
loading, the calculation of the reliability of every component of a structure
is uneconomical, especially where other circumstances may exist such as low
fuel loads as a result of the proposed occupancy.
It is therefore proposed to employ a 2 stage design process for structures
in fire. The first stage of the design process is a risk assessment of all of the
components, based upon the relative probability of a fire occurring in each
67
area of a building. The second stage is to rank each component according to
this risk and to systematically determine the reliability of the components
starting with the high risk components and descending through the ranked
components until the reliability is suitably high or until the risk is deemed
to be suitably low.
5.9.1 Risk Assessment
For the first stage of the design framework, the fire risk assessment, it is pro-
posed to use a very simple system of risk indexing to determine high areas
of risk. The benefits which arise from using this approach as opposed to
more detailed risk analyses in terms of the resources required are illustrated
in figure 5.7. Having discussed the poor informativeness of fire statistics and
the lack of a necessity for absolute determination of risk for structural fire
safety design when relative risk suffices to target areas for more detailed de-
sign risk indexing can be used to provide an informative estimate of the risk
in a compartment. Since the risk assessment is used to determine areas of a
structure for more detailed design consideration, the risk assessment should
describe the risk which will result in a meaningful fire for structural design.
Assuming that suitable air is available for materials to burn, the risk of a
meaningful fire can be defined to be a product to the likelihood of there being
an ignition source, the probability, and the amount of combustible materials,
the consequences; or magnitude of the event.
The compartments within the structure should be grouped into a number
of categories based upon these two factors and the risk should be determined
using a risk matrix similar to the NFPA risk matrix shown in figure 5.1.
68

Figure 5.7: resource investment for increasing level of risk analysis [9]
For example, if compartments are divided into four groups of relative po-
tential combustible loading (High, Medium, Low and Very Low) and the
same compartments are divided into 4 groups of relative potential ignition
(Very Likely, Likely, Unlikely and Very unlikely) one possible risk matrix is
shown in figure 8.8. There are 4 levels of risk in the proposed matrix. The
general form of the risk matrix is the same as the NFPA matrix, although the
risks have been changed to reflect the fact that a very likely ignition source
may include some forms of ignition where combustible materials are intro-
duced to a fire compartment for example in the case of likely arson targets.
Similarly occupancies where there is little or no risk of ignition represent
generally a low risk.
The proposed risk assessment methodology can be broken down into the
following stages:
69

Figure 5.8: proposed risk matrix
1. Identification of the compartments
2. Relative potential fuel load ranking and grouping into the 4 indices
proposed
3. Relative potential ignition ranking and grouping into the 4 indices pro-
posed
4. Ranking of the components according to their relative risk
5.9.2 Reliability Assessment
The risk assessment and subsequent ranking of the components according to
their relative risk reflects the qualitative aspects of the way that a building
70

should perform in fire. Following the statement of the qualitative require-
ments of the building in fire, the buildings performance in scenarios which
have a high expectation placed upon them should be demonstrated. Using
the reliability methodologies as described earlier, this should be achieved by
estimating the range of possible fires which can occur in a building and ap-
plying these fires to the structure. The reliability assessment methodology is
as follows:
1. Declaration of reliability goals
2. Definition of fire scenarios
3. Assignment of components to compartments
4. Targeted reliability assessment
5.9.3 Complete Risk Based Framework
As part of a design framework for structures in fire, the two assessment
methodologies should be applied successively to a proposed design and the
design should be iterated until it meets some requirements. Using the per-
formance criteria described in tables 5.1 and 5.2 the reliability of high risk
components should be assessed against those of the Eurocode.
As an alternative to proposing some risk based acceptance criteria, the reli-
ability assessment should be carried out systematically on the components,
beginning with those which represent a high risk and should end when the
reliability goal is met without any subsequent alteration.
71

The complete proposed design framework is shown in figure 5.9. The work-
flow, however, for the framework should follow the steps listed above, in the
order of risk assessment and then reliability assessment.
5.10 Summary
In this chapter, the fundamentals of risk and reliability were discussed as
well as their application in fire safety design.
Reliability theory was summarised as well as the effect fire has on relia-
bility and current Eurocode based reliability goals were given for structural
design.
A risk informed framework for structural fire safety design of steel and com-
posite structures was also proposed which draws on the concepts which are
introduced in this chapter.
72

Figure 5.9: complete proposed framework
73

6Floor Slab Behaviour and
Design
6.1 Introduction
There have been a number of methods proposed for the determination of
ultimate capacities of floor slabs in fire. For example, a compressive mem-
brane action enhanced yield line analysis, as proposed by Bailey [57,58], for
composite floor slabs in fire; or an energy method proposed by Cameron and
74

Usmani [36, 59, 60], for assessing tensile membrane capacity in fire. Both
of these methods deal with composite concrete floor systems subjected to
large deflections in fire, although they are fundamentally different in their
approaches.
Regardless of their differences, both methods provide a means of assessing
the membrane capacity of composite floor slabs in fire. Both agree that the
assumption that membrane capacity is the final load carrying capacity in
fire depends upon the presence of large displacements. However, neither of
the methods provide information for the lower limit of deflection at which
it becomes of use to the designer. For example, slabs with low span/depth
ratios are far less likely to experience large enough displacements to allow
significant membrane action to develop than slabs with high span/depth ra-
tios.
This chapter aims to explore the transition between the two mechanisms
further.
6.2 Floor Slabs at Large Deflections
Flexural capacity in floor slabs either disappears entirely or is massively
reduced at large displacements. These large displacements allow for the mo-
bilisation of membrane action in floor slabs. Initial deflection and rotation
of the slab about the supports induces an ’arching’ effect or compressive
membrane action - the slab pushes against the boundaries, and large com-
pressive forces develop through the slab. Increasing deflection allows for the
75

reduction of these compressive forces starting from the middle of the slab,
and leading to areas of tension and cracking in the centre of the slab. As
the deflection increases these cracks develop further outward, and the slab
develops tensile membrane action anchored at or supported by the bound-
ary. Most of this tensile membrane mechanism is likely to be provided by
the reinforcing mesh. In most ambient tests, the tensile membrane capacity
is similar to, or lower than, the compressive membrane capacity, and the
transition from compressive membrane action to tensile membrane action is
likely to be accompanied by a rapid increase in the central deflection of the
floor system. The ambient load deflection behaviour of reinforced concrete
slabs is summarised schematically in figure 6.1 [61,62].
Figure 6.1: ambient load deflection behaviour of a concrete slab
Where a slab is exposed to large temperature increases as a result of fire in
a structure, the increased temperature and thermal gradient induced in the
slab allows large deflections to develop often simply due to thermal strains
and without the extensive cracking at ambient temperature. These large
thermal strains are unaccompanied by corresponding mechanical strains and
76

therefore resulting in an increased tensile membrane capacity, figure 6.2.
Figure 6.2: load deflection behaviour of a concrete slab at elevated temper-atures
6.3 3-Dimensional Slab Modelling
The response of a slab modelled as a membrane or shell is well document-
ed [63], and the presence of a compressive ring around the perimeter is a
well acknowledged phenomenon in a deflected floor slab. However, previous
research has not considered the distribution of stresses through the depth
of a floor slab under heating. Compatible tensile stresses and strains will
develop in the slab away from the heated surface as the heated region of
concrete expands and forces the slab to adopt some deflected shape. These
tensile strains will increase the available mechanical compressive strain be-
fore failure of the concrete in the section thus increasing the ultimate bending
moment of a concrete section, thus increasing the flexural capacity of a floor
slab. At low deflections, where the tensile membrane capacity has not been
77

able to develop enough to sustain the static load imposed upon a floor system
this additional flexural capacity may be relied upon to provide additional re-
sistance where ambient flexural capacity can no longer be relied upon.
To explore the phenomena which lead to the replacement of a bending, or
flexural, action with an overriding tensile mechanism a simple quarter mod-
el of a floor slab is analysed under a variety of conditions using the finite
element method in ABAQUS. The results of this analysis illustrate the ef-
fects that thermal and static loading have on the distribution of stresses and
strains through the depth of a floor slab.
The following assumptions are made regarding the slab at low deflections:
• The slab is restrained at the perimeter at mid depth against transla-
tion but free to rotate - this restraint allows for the development and
utilisation of thermal pre-stressing forces which occur in the slab as a
result of thermal strains
• The temperature increase through the slabs depth is idealised by an
average temperature increase, ∆T ; and a through depth thermal gra-
dient, T ,z, as discussed previously
The model is exposed to two loading conditions, designed to increase the
deflection of the slab via initial thermal effects and then by an increasing
static loading. The model analysed is a quarter model of a 6 m x 6 m slab.
A concrete deck of 100mm depth is assumed. Continuum elements with
incompatible modes to avoid an over stiff response were used to model the
concrete and membrane elements were embedded at mid-depth to model an
78

A142 mesh reinforcement. The concrete was assumed to be perfectly elastic,
accounting for a reduction of stiffness with increasing temperature, according
to EC2. Load history is as follows:
• thermal loading was applied in the form of a ∆T=200OC and T ,z=-
5OC/mm
• a static loading was applied in two steps, leading to a combined deflec-
tion of ≈160mm and then ≈190mm.
The first combination of loading leads to a combined thermal and mechani-
cal deflection of around 160mm. The resulting compressive and tensile stress
vectors and their magnitudes are shown for the bottom surface of the floor
slab in figures 6.3 and 6.4.
At 3/4 depth in the floor slab, figures 6.5 and 6.6, the tensile stresses are
more developed than at the bottom surface of the floor slab. Figures 6.7
and 6.8 show the in plane compressive and tensile stress vectors at the slabs
mid depth. There is a clear area in the centre of the slab where compressive
stresses are not present. Tensile stresses are developed across the mid-spans
of the slab.
Figures 6.9 and 6.10 show the compressive and tensile stresses at 1/4 depth of
the concrete slab and figures 6.11 and 6.11 show the stress vectors and mag-
nitudes at the upper surface. Both the expected compressive ring around
the slabs perimeter and the tensile region in the centre of the slab are visible
in these figures - the compressive ring at low level and the tensile region in
midspan areas.
79

Following the increase of the static loading on the slab, so that the deflec-
tion is now 190mm, there is a clear ’relief’ of the compressive stresses at the
bottom of the floor slab caused by the increased mechanical loading. This
is evident in figures 6.13 and6.14 which shows that at the lower surface of
the slab compressive stresses are relieved in the middle of the slab and a
compressive ring is visible around the perimeter.
The same can be seen at 3/4 of the slabs depth, figures 6.15 and 6.16, and
at 1/2 of the slabs depth, figures 6.17 and 6.18. Compressive stresses are
localised around the restrained corner of the slab where they are much larger
than at lower deflections as a result of bending stresses restraining the uplift
of the corner. Tensile stresses act perpendicular to the slabs boundary across
the span.
Figures 6.19, 6.20,6.21 and 6.22 show the stress vectors and magnitudes at
1/4 depth and at the upper surface of the floor slab. Tensile stresses are
dominant, and compressive stresses are present at the perimeter of the slab
and in the restrained corner only. The relief of the compressive forces at the
slabs lower surface is accompanied by an increase in the tensile forces at the
upper surface.
80

Figure 6.3: minimum stress values at the bottom slice of the floor slab forthe first load case
Figure 6.4: maximum stress values at the bottom slice of the floor slab forthe first load case
81
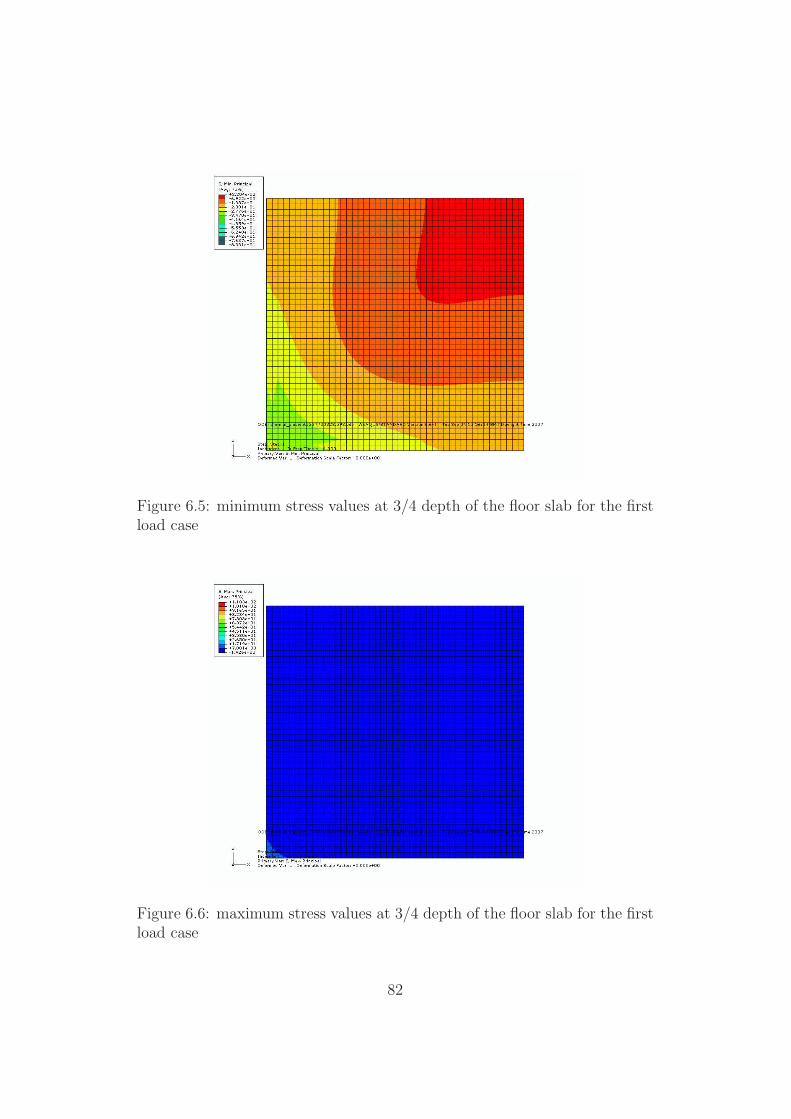
Figure 6.5: minimum stress values at 3/4 depth of the floor slab for the firstload case
Figure 6.6: maximum stress values at 3/4 depth of the floor slab for the firstload case
82

Figure 6.7: minimum stress values at mid of the floor slab for the first loadcase
Figure 6.8: maximum stress values at mid depth of the floor slab for the firstload case
83

Figure 6.9: minimum stress values at quarter of the floor slab for the firstload case
Figure 6.10: maximum stress values at quarter depth of the floor slab for thefirst load case
84

Figure 6.11: minimum stress values at the upper surface of the floor slab forthe first load case
Figure 6.12: maximum stress values at the upper surface of the floor slab forthe first load case
85

Figure 6.13: minimum stress values at the bottom slice of the floor slab forthe second load case
Figure 6.14: maximum stress values at the bottom slice of the floor slab forthe second load case
86

Figure 6.15: minimum stress values at 3/4 depth of the floor slab for thesecond load case
Figure 6.16: maximum stress values at 3/4 depth of the floor slab for thesecond load case
87

Figure 6.17: minimum stress values at mid depth of the floor slab for thesecond load case
Figure 6.18: maximum stress values at mid depth of the floor slab for thesecond load case
88

Figure 6.19: minimum stress values at quarter of the floor slab for the secondload case
Figure 6.20: maximum stress values at quarter depth of the floor slab for thesecond load case
89

Figure 6.21: minimum stress values at the upper surface of the floor slab forthe second load case
6.3.1 Summary
In summary, there are 3 aspects in the development of a slabs load bear-
ing mechanism with increasing thermo-mechanical deflections which can be
identified from the FE model:
1. A ’pre-stressing’ of the concrete around the slabs perimeter due to
thermal expansion inducing in-plane compressive stresses. This can
lead to an increase of the moment capacity of the concrete section
around the slabs perimeter, increasing the ultimate capacity of the
floor slab at low deflections.
2. Displacement of the slab below available in-plane resistance to compres-
sion. This is the point at which the central region of the slab begins
90

Figure 6.22: maximum stress values at the upper surface of the floor slab forthe second load case
to adopt a tensile membrane mechanism, effectively hanging from the
remaining compressive region which is now braced against the lateral
restraint.
3. Following the adoption of a tensile membrane mechanism at the slabs
central region, the perimeter of the slab continues to develop increased
compressive forces due to the in plane restraint provided by the sur-
rounding structure. These forces increase the capacity of the remaining
relatively un-deformed concrete by increasing the thermally induced
pre-stress which is present. Continued growth of the region adopting
a tensile membrane mechanism reduces the width of the supporting
compressive region.
91

6.4 The Bailey BRE Method
Bailey’s method assumes the slab to be simply supported, arguing that the
reinforcement over the supports may rupture given the localisation of strains
due to the cracking of the concrete over the supports. Although this phe-
nomenon was observed around the columns in the Cardington tests, it was
not present around the entire perimeter of the heated regions, in fact evi-
dence at the time pointed to the cracks occurring as a result of tensile strains
during cooling in the supporting structure [64]. In addition to this, further
work in the form of a seventh Cardington test has suggested that the re-
inforcement within the composite slab was not properly overlapped above
the primary beams, leading to the possibility that the floor slab was effec-
tively simply supported due to a lack of continuity of the reinforcement at
the perimeter [65]. This suggestion is further backed up by experimental re-
search carried out in New Zealand, where cracking of the concrete was seen
to propagate across a slab away from initial cracking as a result of tension
stiffening of the reinforcement as cracks form.
Bailey also assumes that secondary beams yield plastically at their mid point
and that this plastic deformation moves outward towards the primary beams,
allowing the slab to develop a standard shaped yield envelope. Whilst this
location of yield is consistent with a simply supported beam in fire, sec-
ondary beams are restrained against axial movement by connection to the
primary beams and are therefore not simply supported. In most cases, large
compressive forces in the region of the beam-column connection lead to plas-
tic yielding of the bottom flange of the section resulting in a change in the
boundary condition of the composite beam from fixed, or moment resist-
92

ing, to pinned. In lightly restrained slabs there is some evidence of concrete
cracks as well which could lead to rupture of the reinforcement in this region
leading to unrestrained boundary conditions. An unprotected beam at high
temperature will generally not provide much bending support and will follow
the deflected shape of the floor slab. Unrestrained boundary conditions mean
that no mechanical stress or strain will occur as a result of thermal expansion.
Failure in this method of assessment is by rupture of reinforcement in the
long span, leading to a full-width crack along the short span of the floor slab.
6.5 The Cameron Usmani Method
Cameron and Usmani observe that in the Cardington tests continuity in the
reinforcement was maintained at the supports away from the columns and so
in their method the slab is assumed restrained against lateral movement, but
free to rotate. The method takes account of the actual observed deflected
shape of the slab, and large mechanical stresses and strains occur in the slab
as a result of the restraint to thermal expansion at the boundary. The con-
crete in the floor system is ignored in calculating tensile membrane capacity
since large displacements at ultimate load will cause widespread cracking of
the concrete throughout the slab leaving only continuity in the reinforcing
mesh to support any load.
Failure in this calculation method is by rupture of the reinforcement in the
middle of the short span, since compatibility means that tensile strains in
the short span must be larger than tensile strains in the long span for a given
93

deflection. This method also assumes that the strain in a reinforcing bar does
not vary along its length and ignores the possibility of strain localisation at
the supports. It is argued that given that the reinforcement in Cardington
consisted of smooth bars while most current practice favours deformed bars,
this may be an unsafe assumption. However, the use of a low failure strain
and only in the first most highly strained single bar to define the point of
failure and the maximum membrane capacity reduces this risk.
Following the Cameron/Usmani methodology, the analytical method em-
ployed for determining the tensile membrane capacity of a slab subjected to
heating has three steps:
1. Calculation of the temperature distribution through the depth of the
member
2. Calculation of: the deflected shape of the member, based upon the gross
cross-sectional area; and the stresses and strains in the reinforcing bars
associated with this deflected shape and steel temperature
3. Calculation of the limiting deflection and the internal and external work
done to move from the thermal deflection to the limiting deflection, the
internal work done is based on the reinforcement only and ignores any
contribution from the concrete.
The methodology is summarised in this section, however for a more detailed
explanation further references [27,36,59,60] should be consulted.
The following assumptions are made in the derivation of the tensile mem-
brane capacity:
94

• The slab is simply supported around all four sides, i.e. it is restrained
against horizontal movement but free to rotate.
• The deflected shape under thermal loading is represented as a double
sine function
• Where tensile membrane action develops the concrete makes no contri-
bution to the resistance of the slab
The methodology is described here for a compartment temperature time his-
tory during the heating phase of the fire with analysis carried out at a number
of discrete time steps.
The first step, the calculation of the temperature distribution through the
depth of the member can be carried out in a number of ways as previously
discussed. For the subsequent steps, all that is required is the equivalent tem-
perature increase and the uniform through depth thermal gradient. Because
the slab is restrained at the boundaries, the temperature distribution results
in a thermal force in the section due to the average temperature increase and
a thermal moment in the section due to the through depth thermal gradient.
The calculation of the deflected shape of the member takes account only
of the concrete section. Applying the thermal loading to the section results
in a thermal deflection, wT . For a 1-way spanning slab of length L, and of
concrete with stiffness EC , this deflection can be calculated by solving the
following cubic equation for wT :
w3T +
(
4I
A−
4NT L2
π2EcA
)
wT +16MT L2
π3EcA= 0 (6.1)
95

Where I is the second moment of area of the section, A is the area, NT is
the thermal force and MT is the thermal moment - all calculated per unit
width of the section. Where a 2-way spanning slab is considered, equation
6.1 becomes:
34
{
(3 − ν2)(
1 + L4
B4
)
+ 4ν L2
B2
}
(
wT
h
)3
+
{
(
1 + L2
B2
)2
− 12L2(1+ν)NT
π2
(
1 + L2
B2
)
}
(
wT
h
)
−192L2(1+ν)MT
π4Ech4
(
1 + L2
B2
)
= 0
(6.2)
Where h is the depth and B the breadth of the slab; and ν is the poissons
ratio of the concrete. These equations both need to be solved iteratively for
each time step. In the calculation of the thermally deflected shape, the creep
and transient strains in the concrete are effectively ignored. Although this is
not considered in the derivation of the original methodology it may lead to an
underestimation of the maximum thermal deflection, however it is expected
that the end result of this omission will be minimal since the concrete plays no
furhter rols in this methodology after the deflected shape has been calculated.
The thermal deflection of the slab at any point, x, along the length can be
calculated for a 1-way spanning slab by assuming that the deflected shape is
that of a sine curve, with central deflection wT :
wT (x) = wT sinπx
L(6.3)
96

For a 2-way spanning slab the deflected shape is assumed to be that of a
double sine curve, thus equation 6.3 becomes:
wT (x, y) = wT sinπx
Lsin
πy
B(6.4)
The strains in the bars at the thermal deflection consist of two components,
the thermal strain as a result of the increase in temperature of the steel
and the strain induced in the steel as a result of the deflected shape of the
concrete in which it is embedded. As discussed in earlier chapters, the total
strain is the sum of the thermal strain and the mechanical strain, i.e.:
εtot = εmech + εT (6.5)
For a two way spanning slab, the total strains in the rebars spanning in the
x and y directions are given by the following equations:
εxx,tot(y) =w2
T π2
8L2
(
1 − cos2πy
B
)
+ νw2
T π2
8B2(6.6)
εyy,tot(x) =w2
T π2
8B2
(
1 − cos2πx
L
)
+ νw2
Tπ2
8L2(6.7)
The mechanical strains are obtained by subtracting the thermal strains from
equations 6.8 and 6.9:
εxx,mech(y) =w2
T π2
8L2
(
1 − cos2πy
B
)
+ νw2
T π2
8B2− αT s (6.8)
εyy,mech(x) =w2
T π2
8B2
(
1 − cos2πx
L
)
+ νw2
Tπ2
8L2− αT s (6.9)
97

The stress in the reinforcing bars is based upon the mechanical strains, and
is therefore given by:
σxx(y) =w2
T π2Es
8(1 − ν2)
(
1
L2+
ν
B2
)
−w2
T π2Es
8L2cos
2πy
B−
EsαT s
1 − ν(6.10)
σyy(x) =w2
T π2Es
8(1 − ν2)
(
1
B2+
ν
L2
)
−w2
T π2Es
8B2cos
2πx
B−
EsαT s
1 − ν(6.11)
Where Es is the modulus of elasticity and T s the temperature of the steel
and ν is the poisons ratio of the concrete.
If the slab is two way spanning, then the stresses and strains need only
be calculated for the reinforcement running along the axis of the slab and
the equations above should be modified accordingly to reflect the fact that
curvature is in one direction only.
Following the application of thermal loading, the slabs response to static
loading has to be determined. The capacity of the slab is limited by the
maximum strain of the reinforcement bars, dictated by the ductility limits
of the Eurocodes, table 6.1. The limiting deflection, wt, in a 1-way spanning
Class Diameter εuk
N(ormal) ≤ 16mm 2.5%
H(igh) > 16mm 5%
Table 6.1: ductility limits for reinforcing bars according to EC2
slab can be calculated by considering the maximum deflection as a result of
98
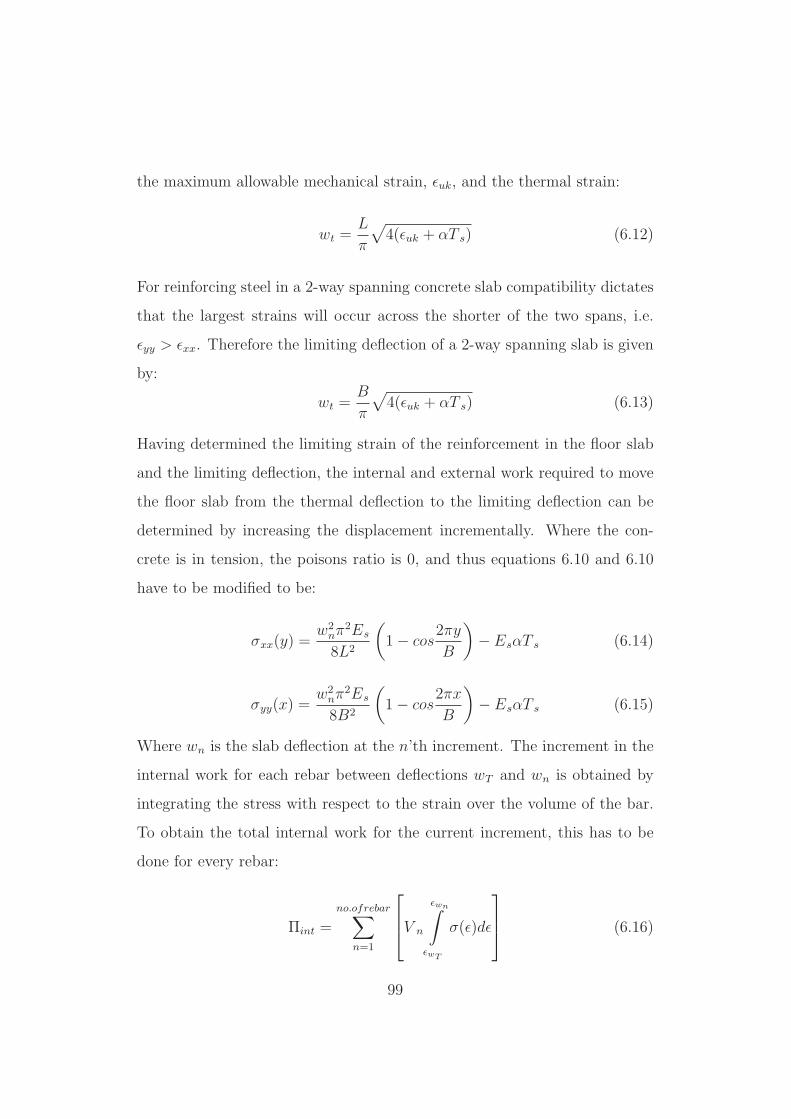
the maximum allowable mechanical strain, εuk, and the thermal strain:
wt =L
π
√
4(εuk + αT s) (6.12)
For reinforcing steel in a 2-way spanning concrete slab compatibility dictates
that the largest strains will occur across the shorter of the two spans, i.e.
εyy > εxx. Therefore the limiting deflection of a 2-way spanning slab is given
by:
wt =B
π
√
4(εuk + αT s) (6.13)
Having determined the limiting strain of the reinforcement in the floor slab
and the limiting deflection, the internal and external work required to move
the floor slab from the thermal deflection to the limiting deflection can be
determined by increasing the displacement incrementally. Where the con-
crete is in tension, the poisons ratio is 0, and thus equations 6.10 and 6.10
have to be modified to be:
σxx(y) =w2
nπ2Es
8L2
(
1 − cos2πy
B
)
− EsαT s (6.14)
σyy(x) =w2
nπ2Es
8B2
(
1 − cos2πx
B
)
− EsαT s (6.15)
Where wn is the slab deflection at the n’th increment. The increment in the
internal work for each rebar between deflections wT and wn is obtained by
integrating the stress with respect to the strain over the volume of the bar.
To obtain the total internal work for the current increment, this has to be
done for every rebar:
Πint =
no.ofrebar∑
n=1
V n
εwn∫
εwT
σ(ε)dε
(6.16)
99

And the external work increment for a 1-way spanning slab by:
Πext =
L∫
0
(
qn−1 +∆qn
2
)
∆w4L
π2(6.17)
Or for a 2-way spanning slab by:
Πext =
L∫
0
B∫
0
(
qn−1 +∆qn
2
)
∆w4LB
π2(6.18)
Where qn is the total load at the n’th increment, and ∆qn is the load at the
current increment. The internal and external work must equal each other,
and therefore these equations can be re-arranged and solved for ∆qn and the
ultimate capacity can be determined from:
qult =∑
∀n
∆qn (6.19)
6.6 Catenary and Membrane Mechanisms
Because a 1-way spanning slab will not develop a membrane action support-
ed on all sides by horizontal members, a distinction is made here between
a simple catenary mechanism and a tensile membrane mechanism. In the
catenary mechanism of a 1-way spanning slab, the capacity is enhanced via
thermal strains induced in the available steel, whereas in a 2-way spanning
slab this is enhanced further by compatibility of the mechanical strains in
the embedded reinforcement.
Since the slab is adopting a catenary mechanism, the resistance to load is
100

based upon the steel spanning between the supports, i.e. the steel spanning
in the shorter span. For slabs with small aspect ratios, i.e. where B/L < 2/3,
the slab can be assumed to be 1-way spanning since the deflected shape will
be governed by the behaviour of the system in the short span.
6.7 Thermally Pre-stressed Yield Line
As demonstrated in preceding parts of this chapter, increasing rigidity of the
floor slab actually leads to a decrease in the thermal deflections and the final
available tensile membrane capacity of the floor system. The numerical mod-
elling above suggests that at low deflections a large amount of compressive
stress is present to a varying degree through the depth of the slab. It fol-
lows that at low deflections of floor slab large reserves of flexural resistance
may be available for carrying loads, and these reserves may be enhanced
by a thermal pre-stressing where the restraint to thermal expansion remains
above the plane of the upper surface at the centre of the slab.
6.7.1 Numerical Modelling
The effect of heating on yield line capacity can be illustrated using the pre-
viously described finite element model. The slab was subjected to the total
thermal loading equivalent to a ∆T of 200OC and a T ,z of -5OC/mm. Three
cases were considered, firstly static loading with no thermal loading to illus-
trate bending only; secondly thermal loading to illustrate in-plane compres-
sive forces developing as the slab heats up; and thirdly thermal and static
loading to illustrate the reduction in compressive forces as the slab moves
101

through the static deflection. Since this model is intended to illustrate only
the distribution of thermal strains and stresses through the depth of the sec-
tion the concrete was again assumed to be perfectly elastic, accounting for a
reduction of stiffness with increasing temperature, according to EC2.
Under static loading only, the displacement at the mid-point is approximate-
ly equal to the depth of the slab. Since the only significant tensile stresses
present are in the reinforcement; compressive stresses alone are considered
for the concrete. Compressive stress vectors along the diagonal (yield line)
of the slab are shown in figure 6.23. The increase in compressive forces at
the perimeter of the slab as the slab is moved through the displacement is
clearly visible at the upper surface of the slab; this is similar to an ’arching’
effect as the slab boundaries push against the in-plane restraint to adopt the
deflected shape shown. Coincident with a reduction of in-plane restraint due
to central deflection of the slab, the compressive stresses in the middle of the
slab tend towards those required to sustain bending.
Under thermal loading only, the displacement is approximately 1.5 times
the depth of the slab. Compressive stress vectors are plotted in figure 6.24.
Similar to static loading only, the boundary of the slab is subjected to large
compressive forces, creating the well documented ’compressive ring’ due to
restraint against in-plane expansion and out of plane deflection of the slab at
the perimeter. However, the thermal gradient leads to compressive strains in
the bottom of the concrete as the thermal expansion of the lower concrete is
’restrained’ by the ambient concrete of the upper part of the section which
is not in compression. This thermal strain couple is what causes the thermal
deflection of the slab under elevated temperatures.
102

Figure 6.23: compressive stress vectors along the diagonal of a quarter modelsquare floor slab under static loading
When static loading is introduced to the thermally loaded model, the re-
sulting increase in deflection at the midpoint of the slab effectively balances
and then overcomes the thermal compression in the middle of the slab, fig-
ure 6.25. Although compressive stresses remain in the plane of the yield line,
figure 6.26, it is the compressive stresses about the yield line which create
the tension-compression couple resisting the applied moment. When these
compressive stresses are no longer available and only tensile stresses remain
in the steel of the slab then the slab begins to adopt a catenary mechanism
and no bending resistance is available in the region. The compressive region
of concrete disappears with increasing deflection.
Figure 6.27 shows the compressive stress along the top of the plane of the
yield line. At the corner the uplift to restraint causes a relief in the com-
103

Figure 6.24: compressive stress vectors along the diagonal of a quarter modelsquare slab under thermal loading only
pressive stress. 2.5 metres along the yield line, the compressive stress is zero.
Figure 6.28 shows the deflection along the yield line for comparison. It can
be seen that the point where compressive stress is no longer present coincides
with a deflection of 150mm.
In summary, there are two effects caused by geometrical changes induced
by thermal expansion on the ultimate moment of a section which have to be
considered:
1. Thermal loading induced by temperature increases in the slab; i.e.,
a thermal force generated by the average temperature increase and a
thermal moment induced by the difference in temperatures between the
heated and unheated surfaces. This causes an increase in the area of
the cross section under mechanical compressive strain (assuming that
the fire is below the slab and that there is restraint to lateral translation
104

Figure 6.25: compressive stress vectors along the diagonal of a quarter modelsquare slab under thermal and static loading
at the edges).
2. The downward deflection of the section removes the available in-plane
restraint to compression in the slab, effectively moving the neutral axis
for bending upwards through the depth of the slab.
These two actions are similar to the effect of pre-stressing on the concrete sec-
tion: the thermal loading (1) is equivalent to the compressive force caused by
pre-stressing tendons; the downward deflection (2) controls the eccentricity
of the pre-stressing, this has a negative effect when the eccentricity becomes
large enough that it is above the upper surface of the slab.
105

Figure 6.26: compressive stresses remain in the plane of the yield line butare not available in the tension-compression couple about the yield line
6.7.2 Ultimate Moment of a Heated Section
The strains in a fully restrained section as a result of thermal loading are
shown in figure 6.29. Assuming that no deflection is allowed in the section,
the result of the thermal strain is an effective non-linear pre-strain, ∆T (z),
applied to the section. The total strain in the steel before failure is increased
by an amount equivalent to the thermal strain in the reinforcing bar, ∆T s.
From compatibility, the depth to the neutral axis can be calculated by con-
sidering the strains in the concrete and the steel at the ultimate state, i.e.
where concrete has reached its ultimate compressive strain. For a pre-stressed
section assuming full bond between the concrete and the steel, this is [66]:
hna
he
=εcu
εcu + εpb − εpe − εe
(6.20)
106

Figure 6.27: compressive stress along the top of the yield line
Where hna is the depth to the neutral axis, he is the effective depth of the
section. εcu is the ultimate compressive strain of the concrete, εpb the strain
in the steel at the ultimate state, εpe the strain due to the effective pre-stress,
and εe is the concrete pre-stress at the depth of the steel.
For the thermal pre-stressing proposed, equation 6.20 becomes:
hna
he
=εcu
εcu + εpb + εTs − εTc(d)(6.21)
Where ∆T s is the thermal strain in the steel and ∆Tc(d) is the thermal strain
in the concrete at the effective depth.
From horizontal equilibrium of the section:
σs(T )As = σcubhna (6.22)
107

Figure 6.28: deflection along the top of the yield line
Figure 6.29: strains in the floor section as a result of thermal and static load
Where σs(T ) is the temperature dependant stress in the steel at the limit
state of the section, εcu is the stress in the concrete at the limit state, b is
the breadth of the section and As is the area of steel in the section.
The stress and strain in the steel at the ultimate state of the section can
be found by substituting 6.22 into 6.21 and rearranging for σs:
σs(T ) =σcubhe
As
εcu
εcu + εpb + εTs − εTc(d)(6.23)
108

This gives the relationship between the stress and the strain in the rein-
forcement at the ultimate state. These can then be determined from the
stress-strain curve.
Having determined the stress and strain in the rebar at the ultimate lim-
it state, the value of εpb can then be inserted into equation 6.21 and the
neutral axis location calculated. This can be used to calculate the residu-
al moment in the section from, assuming that the concrete stress block is
rectangular:
MR = σs(T )As
(
he −hna
2
)
(6.24)
Where MR is the residual moment of the section given the current thermal
loading.
6.7.3 Thermally Prestressed 1-way Spanning Slab
The membrane force in a 1-way spanning slab is given by [27]:
F x = EAπ2w2
T
4L2− NT (6.25)
Where wT is as given by equation 6.1.
Considering the slabs thermal deflection, the horizontal restraining force at
the supports will have some eccentricity to the section. For a one way span-
ning slab this eccentricity will vary with the distance from the supports, and
is denoted e(x). For a neutral axis coinciding with the plane of restraint, the
eccentricity is equal to the deflection of the slab; wT (x), figure 6.30. Whereas
if the neutral axis does not coincide with the depth to the plane of restraint at
109

the boundaries, the restraining force, F x, will have an additional eccentricity
equal to the distance from the plane of support to the neutral axis:
e(x) = w(x) −
(
he
2− hna
)
(6.26)
The residual moment of resistance of the section about the y-axis at a
Figure 6.30: the eccentricity of the restraining force varies with the deflectionof the slab.
thermal deflection, wT , is the moment of resistance of an un-deflected section
minus the moment induced by the restraining force and its eccentricity:
MRy = σs(T )As
(
he −hna
2
)
− F (x)e(x) (6.27)
The yield line method is based upon the principal of virtual work. Yield lines
in a 1-way spanning simply supported slab will tend to run along the middle
of the slab where the larger applied moment is. The capacity of the 1-way
spanning slab can be calculated by comparing the internal and the external
work of the system at failure. These should be equal, i.e. [67]:
work done in yield lines rotating = work done in loads moving
The internal work per unit breadth is the integral of the ultimate moment
of the section at x = L/2 multiplied by the rotation of the section; for all
110

sections:
Πint = 2MRΘ (6.28)
Where Θ is the rotation of the yield line at failure for a unit displacement;
i.e.:
Θ =1
L/2(6.29)
The external work per unit breadth is the load per unit breadth multiplied
by the displacement it goes through for a unit displacement at the centre of
the slab:
Πext = 2qL
4(6.30)
6.7.4 Thermally Pre-stressed 2-way Spanning Slab
For a two way spanning slab the eccentricity will vary with the position of
the section in the slab from both of the boundaries and is denoted e(x, y).
e(x, y) = w(x, y) −
(
he
2− hna
)
(6.31)
The membrane force at the perimeter of the slab varies along the perimeter,
figure 6 25, and can be calculated per unit length by integrating equations
6.10 and 6.11 with respect to the relevant axes.
The residual moments of resistance of the section at position x, y can be
calculated, as before, by taking moments about the section.
MRx(x, y) = σs(T )As
(
he −hna
2
)
− F ye(x, y) (6.32)
111

Figure 6.31: membrane force variation along the perimeter of a slab
MRy(x, y) = σs(T )As
(
he −hna
2
)
− F xe(x, y) (6.33)
The internal work done is the integral of the moment of resistance of the
section along the yield line multiplied by the angle of rotation of the section
through a unit displacement. For yield lines which do not run parallel with
the boundaries, the yield lines are integrated along their lengths projected
parallel with the boundaries. Thus the internal work is given by:
Πint =∑
∀yieldlines
Lx∫
0
MRy(x, y)Θdl +
Ly∫
0
MRx(x, y)Θdl
(6.34)
The external work is then given by, as for a 1-way spanning slab:
Πext =∑
Qδ (6.35)
Where Q is the resultant of the distributed load, q, on the section, and δ is
the vertical displacement of Q with unit displacement of the centre of the
112

slab.
6.8 Ultimate Capacity Assessment
To illustrate the transition from one mechanism to another, a 6m 1-way span-
ning floor slab was analysed. The slab had an assumed depth of 150mm, and
steel reinforcement of 1130mm2/m placed 50mm from the unheated surface
of the floor slab. The slab was exposed to a British standard fire of duration
1 hour.
Figure 6.32 shows the evolution of the ultimate moment at the position of
the yield lines of the floor slab. Initial expansion of the floor slab at low
deflections increases the ultimate moment of the floor slab, until large deflec-
tions allow for a release of the pre-stressing force.
Figure 6.32: evolution of ultimate moment at the yield lines of the slab
113

Similarly, for a 2-way spanning slab, the ultimate moment varies with the
position along the yield line. Since the centre of the slab experiences the
largest deflection, the pre-stressing force there is the lowest. At the perime-
ter of the slab the pre-stressing force is the highest since it experiences the
lowest deflections, figure 6.33. For a 2-way spanning slab, flexural capacity
resides around the perimeter of the slab for large displacements of the centre
of the slab. Although these ’strips’ of flexural capacity become increasingly
smaller with increasing displacement of the floor slab as the region in tension
increases. The complete deflection behaviour of 1- and 2-way spanning floor
slabs is illustrated in figure 6.34. If the capacities of the two mechanisms
Figure 6.33: evolution of ultimate moment along yield line projected ontoslab boundary for a 5 m square slab of 200mm depth, As=1130mm2/m 50mmfrom the heated surface exposed to a British standard fire
are plotted against the span / depth ratio there are 3 distinct regions in
the behaviour of different floor slabs at elevated temperatures and thermal
displacements, dependant on their span/depth ratio, figure 6.35. One where
114

Figure 6.34: transition between flexural and a tensile membrane mechanismwith increasing deflection for 1- and 2- way spanning floor slabs
115

Region Dominant Mechanism
A Flexural Only
B Flexural and Membrane
C Membrane Only
Table 6.2: summary of capacity dominance in figure 6.35
flexural capacity is dominant, one where membrane capacity is dominant
over flexural capacity and one where there is some cross over between the
two mechanisms where it can be expected that the mechanisms may work
together to provide an enhanced mechanism beyond that which is calculated
by one of the theories alone. These are summarised in table 6.2.
Figure 6.35: schematic capacity variation with span/depth ratio
Comparing the two mechanisms after 20 minutes of a British standard fire
over a range of span/depth ratios (depth=200mm, As = 1130mm2/m 50mm
from the heated surface), Figure 6 30, the span/depth ratio where transition
from one mechanism to another occurs is clear. As shown, the assessment of
the capacity of floor slabs must be rationalised by consideration of the cur-
116

Figure 6.36: after a 20 minutes of a British standard fire, the capacity of thetwo mechanisms over a range of span/depth ratios
rent mechanism. At low displacements, a yield line mechanism forms over the
slab. This can be enhanced by taking account of the thermal ’pre-stressing’.
Increasing deflection leads to cracking of the central region of the slab and
an onset of tensile membrane action. The tensile membrane hangs at this
point from a region of decreasing width around the perimeter. This is the
point at which transition to a tensile membrane mechanism described is more
likely to occur as the tensile region of the concrete grows and the deflection
increases until the load is ’caught’ by the steel reinforcement. In the dervia-
tion of the thermally prestressed yield line methodology, creep and transient
strains are effectively ignored, since the thermal deflection is take directly
from the tensile membrane calculations above. These components may have
a larger effect on the final capacity of the section, since the ultimate moment
is dependant upon the residual concrete strength, more work may therefore
be required to fully understand this.
117
6.9 Conclusions
For the design of floor slabs under thermal loading, research has tended to
rely upon a membrane mechanism which requires large deflections to develop
in order for the mechanism to mobilise. However, the transition between the
ambient flexural, low displacement, design and the tensile membrane mech-
anism has never been satisfactorily addressed. This omission ignores the
positive effect on bending capacity of large compressive forces which occur
during a fire.
A new design method was derived here which takes account of the ther-
mal pre-stressing of the concrete floor at developing thermal deflections. By
considering the typical yield pattern for a slab, and its evolution as the de-
flection increases, two distinct cases for the response of slabs under thermal
loading have been defined: 1 where the thermal deflection is low enough that
a thermally pre-stressed yield line theory still applies and where deflections
are not yet large enough for a tensile membrane mechanism to mobilise; and
2, where the deflection is large enough that the pre-stressed yield line the-
ory is no longer applicable due to tensile stresses across the slab but where
the deflection is developed enough that a tensile membrane mechanism can
develop. The area of region 2 increases with the deflection, decreasing the
length of the yield lines and lowering the capacity as calculated by the yield
line method, and is associable with the instability which occurs between low
and high deflections in concrete floor slabs.
For a tensile membrane mechanism, the ultimate load can be increased by
encouraging larger deflections using a thinner slab, or by allowing for a larger
118

thermal strain in the steel of which the membrane is composed by placing
it lower in the slab. For the thermal pre-stressing method, the capacity can
be enhanced by increasing the lever arm or by increasing the depth of the
section. For very high deflections, the membrane capacity is clearly domi-
nant over the flexural capacity, whereas for very low deflections the flexural
capacity is dominant.
119

7Tall Building Stability
7.1 Introduction
Despite the events of September 11th 2001, there has been very little re-
search carried out into the stability of tall buildings in multiple floor fires.
Quiel and Garlock [68, 69], calculate the capacity of beam-columns based
upon the axial elongation of the beam, using the column as a spring resist-
ing this elongation; this, however, did not consider the beams acting as a
120

catenary to support the static loading; and it did not consider the potential
for failure of the columns given fire on multiple floors. Analysis carried out
at the University of Edinburgh on the world trade centre towers focused on
identifying and understanding the mechanisms which may have led to their
collapse as a result of thermal loading alone. Initial findings and a proposed
collapse mechanism were presented in 2003 [70], with additional work pre-
sented in 2005 [71]. This collapse mechanism, referred to as a weak-floor
collapse mechanism relies is dependant upon the floors adjacent to the fire
floors being unable to resist the axial load placed upon them as a result of
adjacent floors adopting a catenary mechanism.
Further investigation into the mechanism identified led to the postulation
of a further collapse mechanism [72], which can occur when the floors are
strong enough axially to resist the forces required to support the fire floors
in a catenary mechanism. Although the method of collapse is different, the
chain of events leading to the two mechanisms is governed by the same un-
derlying structural mechanics.
7.2 Weak Floor Failure Mechanism
In the weak floor failure mechanism identified, illustrated in figure 7.1 for a
3-floor fire, fire starts simultaneously on multiple floors. Initially, the floors
are in a ’push-out’ stage, where central deflection of the floor system is rel-
atively low, and a flexural mechanism is still active. Top and bottom fire
floors push out against the column; the middle fire floors adopt tensile forces
due to compatibility. Floors adjacent to the fire floors, ’pivot floors’, which
121

remain cool are also in tension as they restrain the column against lateral
displacement. With increasing thermal deflection of the fire floors, resistance
to buckling decreases and the top and bottom fire floors are unable to sustain
the compressive axial load which is generated by thermal expansion. Top and
bottom fire floors lose flexural stiffness and adopt a catenary mechanism first.
The middle fire floors and pivot floors adopt compatibility compression as a
result of the pull-in forces applied to the column from the catenary of the
top and bottom fire floors. All fire floors eventually lose flexural stiffness and
adopt a catenary mechanism. This transition is a smooth one which results
from a gradual increase in pull-in forces and a decrease in the stiffness of the
heated floor systems.
Figure 7.1: weak floor collapse mechanism
122

Where the pivot floors are unable to sustain the horizontal pull-in forces
which result from the catenary of the fire floors, they buckle and the force is
transferred to the adjacent floors. Progressive collapse ensues as the buckling
’wave’ is propagated along the length of the column.
7.3 Strong Floor Failure Mechanism
In the strong floor failure mechanism, figure 7.2, initial response is similar to
that of the weak floor failure mechanism. At the point where all fire floors
lose have lost flexural stiffness and adopt a catenary mechanism, the stronger
pivot floors are able to resist the induced axial load.
Figure 7.2: strong floor failure mechanism
123

In this instance, the pull-in forces exerted on the column by the fire floors
acting as membranes causes the formation of 3 plastic hinges (column reaches
full plastic yield through a combination of axial compression and bending),
thus initiating collapse. This collapse is initiated by localised hinge forma-
tion, which is not as inherently progressive as the weak floor mechanism,
however once the three hinges are formed then the loads from the super-
structure will perpetuate the collapse.
7.4 Numerical Modelling
Although the collapse mechanisms described were initially identified for very
specific tall buildings in fire, subsequent work has shown them to be relevant
for regular multiple storey buildings so long as it can be represented by the
frame shown in figure 7.3.
Figure 7.3: typical multi-storey building plan and representative section
124

The external bays are assumed to be restrained by a stiff internal core [72],
i.e. as shown in figure 7.3. This is represented by a 2-dimensional cross sec-
tion of the column and floor system, as shown, although this representation
can be extended to include steel frames without a stiff concrete core so long
as sufficient stiffness can be shown to be provided by the bays interior to
those on fire.
To illustrate the applicability of the collapse mechanisms to more common
structures a conventional composite steel frame was analysed [73]. The beams
forming the floor system are laterally restrained by the stiff concrete core but
are free to rotate, as shown. They are fully fixed to the exterior column, since
much of the floor rotation will be transferred to the column via edge beams
under torsion. The column is fixed at the bottom but restrained only in the
horizontal direction at the top, allowing vertical displacement. A composite
steel/concrete floor system is modelled using beam elements tied together.
The structure is subjected to uniform loading on the floor system at each
level, as well as a point load on the column representing the load from the
structure above the model. The distributed load on the floor systems includes
the self weight of the concrete slab as well as the imposed load. To compare
the behaviour of the models several parameters were changed to obtain a
wide variety of results [10]. This includes changing loads, section sizes and
spans. The assumed material properties are in accordance with Euro Code
3-1. In the analysis, the fire was assumed to affect three floors (floors 6, 7
and 8). The steel was assumed to be unprotected and thus experienced a
uniform temperature increase equal to that of the fire. This allows for 1-way
spanning floor behaviour to develop, where the entire heated floor system
125

adopts a catenary mechanism. The maximum and ambient temperatures
were taken as 800OC and 20OC respectively with an exponential increase
and the columns are protected and are restricted to a maximum tempera-
ture of 400OC.
Two of the resulting models are shown in figure 7.4 which illustrate the
two collapse mechanisms. In both models a UC section size 305 x 305 x 198
was used. For the weak floor collapse mechanism a UB section size 305 x 102
x 28 was used and in the strong floor mechanism a UB 533 x 210 x 92 was
used. Details of the structures are given in table 7.1.
Figure 7.4: weak and strong floor collapse mechanisms: 2D FE Model [10]
126

Weak floor system Strong floor system
Structure
Column section 305 x 305 x 198 305 x 305 x 198
Beam section 305 x 102 x 28 533 x 210 x 92
Beam depth 309mm 533mm
As 36.3cm2 117cm2
Is 5420cm4 55230cm4
Es 200000N/mm2 200000N/mm2
Distance between 4000mm 4000mm
floors
Concrete slab:
Depth 100mm 100mm
Width 6000mm 6000mm
Span 10000mm 10000mm
Ac 0.6m2 0.6m2
Ec 14000N/mm2 14000N/mm2
Loading:
Distributed load 45N/mm 45N/mm
Column axial load 6900kN 6900kN
Table 7.1: details of the numerical models
127

In the weak floored model, collapse was initiated at approximately 550 sec-
onds. This is almost immediately following the buckling of the upper and
lower fire floors and the onset of catenary action of the fire floors. Reaction
Forces at the connection of the 4th to the 10th floors and the stiff core of
the building are shown in figure 7.5, where the buckling time and the time
of onset of collapse are indicated.
Figure 7.5: weak floor horizontal reaction forces
In the strong floored model, the initiation of the collapse mechanism oc-
curs after approximately 1000 seconds. Again this is immediately following
the transfer of the mechanism from a predominantly flexural to a catenary
one, figure 7.6. This collapse mechanism takes longer to initiate due to the
increased stiffness of the floors and their increased bending stiffness.
128

Figure 7.6: strong floor horizontal recation forces
The initiation of both weak and strong floor collapse mechanism for the two
generic structural models shown illustrates the validity of these two mecha-
nisms for a range of structures which can be idealised by the 2D representa-
tion shown.
7.5 Analytical Modelling
The first stage in the analytical assessment of the two collapse mechanisms
identified is to determine the floor response as a result of the thermal load-
ing. Thermal loading can be calculated using a simple one dimensional heat
transfer code, or via an appropriate finite difference calculation [74]. Alterna-
tively, BS7974 [75], offers a simplified calculation method for the temperature
129

of concrete slabs in fire.
7.5.1 Thermal Deflection and Thermal Force
Since the mechanisms described rely upon the floor system adopting a cate-
nary mechanism which in turn relies upon the presence of large mid-span
deflections, the thermally induced displacements of the floor system must
first be calculated.
For a composite steel building, the deflected shape of the floor is calculated
based upon the thermal stresses and strains in the concrete deck alone. The
application of catenary forces to the column is dependant upon the loss in
stiffness of the primary beam supporting the floor system. This is viable for
either an exceptionally severe fire in the case of a protected primary beam,
or for unprotected steel beams.
In instances where the beam is protected and does not experience a severe
temperature increase it is generally assumed that the beam will be able to
support the surrounding concrete floor systems as they adopt 1 or 2-way
spanning catenary mechanisms as described previously.
However, at the stage where bending is no longer a viable action of any
primary steel beams, the material is assumed to be ductile enough that the
deflected shape is governed by that of the concrete slab, figure 7.7. In this
case the steel of the beam will yield at the connections due to large ther-
mally induced expansion stresses and the steel will effectively hang from the
support, adopting the deflected shape of the concrete slab.
130

Figure 7.7: exposed and unexposed steel temperatures
7.5.2 Floor Boundary Conditions
During the early stages of fire where the floor system carries the load via
a flexural mechanism, the adjacent floors can be assumed to provide lateral
support to the column and therefore the stiffness of the column against lat-
eral displacement is high, allowing compressive forces to develop within the
floor slab with little or no deflection of the exterior column.
Similarly, where the fire exists on only one floor the translational stiffness
of the column is relatively large as a result of the supporting floors. With
increasing number of fire floors, this lateral stiffness is reduced, allowing larg-
er horizontal deflections of the exterior column at the fire floors and larger
mid-span deflection of the fire floors.
The horizontal stiffness of the column is calculated using the stiffness method,
as shown in figure 7.8, assuming an adequate 2-dimensional representation
of the structure. Increasing number of floors adopting a catenary mechanism
131

will decrease the stiffness of the column by increasing its effective length.
’Pivot’ floors, i.e. floors above and below the fire floors, are represented by
a rotational spring.
Figure 7.8: lateral stiffness of the exterior column
7.5.3 Horizontal Reaction
Upon initial heating, the floor is in a ’push-out’ stage. Forces are compressive
and push against the column, figure 7.9. At this stage, the column load is
simply the push-out force, NT , from the thermal loading in both the concrete
and the steel. However, for simplicity, it is assumed that εT ≈ εΦ, i.e. no net
thermal force is transferred to the column, and little or no initial horizontal
displacement is induced at the column. No catenary tension is present while
the floor supports load via a bending mechanism.
132

Figure 7.9: displacements and forces as a result of initial heating
Increasing thermal displacements reduce the flexural capacity of the floor,
forcing the uniformly distributed mechanical load on the floor to be support-
ed by the system via a catenary, or membrane, action, figure 7.10. This leads
to a horizontal pull-in force, Np, to be exerted on the perimeter framing (col-
umn and edge beams). The column resists the pull-in force as a translational
spring as discussed, of stiffness KT , and provides the supporting reaction for
the catenary tension in the floor system.
Np = KT up (7.1)
7.5.4 Vector Resolution
Considering the tension in the floor system, at a distance x along the span,
it is clear that, dependant upon the deflected shape of the floor system, the
horizontal reaction is given by the product of the vertical reaction and the
inverse of the gradient at x = 0. Assuming that the deflected shape adopted
133

Figure 7.10: total deflections and forces on the floor system under mechanicalloading
is that of a sine curve, the reaction is given by:
Np =pL2
2πwmax
(7.2)
7.5.5 Catenary Tension
The components of the tension in the floor system are shown in figure 7.11.
The tension in the floor at any point is the resultant of the shear forces at
that point and the horizontal force. By resolving the shear force and the
pull-in force vector, the tensile force in the floor is given by:
F (x) =√
Np(x)2 + V (x)2 (7.3)
The horizontal force is constant across the span, and therefore tension in
134

Figure 7.11: components of the tension in the floor system
the floor varies only with the shear force.
Np(0) = Np(x) = Np (7.4)
V (x) = p
(
l
2− x
)
(7.5)
7.5.6 Floor Elongation
At large displacements, the contribution from concrete to the floor system is
ignored due to widespread tensile cracking of the concrete. The horizontal
pull-in force should therefore be calculated based upon the total tensile force
in the steel in the floor system, at a vertical deflection where the available
steel carries the applied load.
F (x) = AsEs(T )εs(x) (7.6)
135

Substituting equation 7.3 into equation 7.6, the increase in length, ∆Lp, can
be calculated by integrating the strain along the length of the floor.
εs(x) =
√
Np2 + p2
(
l2− x)
2
AsEs(T )(7.7)
∆Lp
2=
l/2∫
0
εs(x)dx =1
AsEs(T )
l/2∫
0
(
Np2 + p2
(
l
2− x
)2)1/2
dx (7.8)
∆Lp
2= 1
AsEs(T )
[
2p2x2−p2l4p2
(
Np2 + p2
(
l2− x)2)1/2
+4p2(
Np2 + p2 l2
4
)
−p4l2
8p2 ln
(
2(
p2(
Np2 + p2
(
l2− x)2))1/2
+ 2p2x − p2l
)1/2
0
(7.9)
7.5.7 Floor Catenary Deflection
wmax, and up in equations 7.1 and 7.2 are related by the change in length of
the floor system under mechanical loading, ∆Lp. Recalling the assumption
that the lateral thermal deflection of the floor system is negligible, i.e. εT ≈
εφ, the maximum deflection is given by equation (8.10).
wmax =2L
π
√
√
√
√LT + ∆Lp
L+
(
LT +∆Lp
L
)2
2(7.10)
Equations7.1, 7.2, 7.9 and 7.10 can now be solved to obtain the pull-in forces
resulting from the mechanical load.
136

7.5.8 Composite Beam Pull-in Force Example
To illustrate the calculation of pull-in forces resulting from a fire under a floor
slab, the system shown in figure 7.12 is analysed. The steel beam is assumed
to be unprotected, and the temperature of the beam is assumed to follow
the compartment temperature time curve. The pull-in force is calculated for
the steel beam alone, in this case ignoring the contribution of the reinforcing
steel. Since steel is a thermally thin material, i.e. high conductivity, thermal
gradient is very low in the steel beam. Uniform high temperatures will in-
crease ductility of the steel and induce large compressive forces in the section
causing it to yield plastically at the connections early on in the fire. There-
fore the thermal deflection is calculated based upon the thermal gradient
and thermal expansion of the concrete floor slab spanning between primary
beams.
Figure 7.12: pull-in force example structure
137

A generalised exponential fire is applied to the underside of the floor system,
as described by equation 7.11, where α controls the heating rate. Maximum
temperature is 800OC, total duration is 3600seconds and α is 0.005. Heat
transfer to the slab is calculated using a one dimensional finite element script,
resulting in a uniform temperature increase, ∆T ; and an equivalent thermal
gradient, T ,z. As already stated, the steel beam is assumed unprotected and
therefore its temperature follows the compartment temperature.
T (t) = T 0 + (Tmax − t0)(1 − e−αt) (7.11)
Mechanical loading was applied to the beam via a 45N/mm line load, rep-
resenting the total distributed load on the floor of 7.5 × 10³N/mm2. The
resulting thermal deflections of the floor system are shown in figure 7.13.
Figure 7.13: thermal deflection of the floor system in figure 7.12
In order to verify the analytical study, a simple numerical analysis was car-
138

ried out using the finite element software ABAQUS. For the numerical study,
the bending resistance of the floor system was kept to a minimum in order
to encourage catenary action by using a very thin beam element to represent
the floor system. The element had the same area as the analytical model,
but a very small moment of inertia. Assuming that the beam is at constant
temperature equal to the maximum compartment temperature, the numeri-
cal model showed that at a deflection of approximately 910mm, the pull-in
force was 6.1×10⁵N.
Pull-in forces for the beam obtained from the analytical model are shown
in figure 7.14. From the same analysis, the total resulting deflection of teh
floor system is shown in figure 7.15. Comparison with the results of the nu-
merical analysis shows that the thermal deflection and the resulting pull-in
force of the floor system at 400 seconds is comparable with the numerical
analysis.
Figure 7.14: pull-in forces based upon the primary beam only
139

Figure 7.15: total vertical deflection of the floor system
The analytical deflection shown in figure 7.15 increases over the numerical
result shown after approximately 240 seconds have elapsed. In the analyt-
ical model, the primary beam is forced to follow the deflected shape of the
floor slab, and so additional tension is created in the beam as a result of the
concrete deflection. This increased deflection reduces the horizontal compo-
nent of the tension in the beam, and therefore the horizontal pull-in forces
decrease past this point, the corresponding decrease is seen in figure 7.14.
7.5.9 Reinforcement Mesh Pull-in Force example
In reality, membrane resistance will come from the reinforcement in the floor
slab, embedded within the entire span of concrete deck. Therefore the steel
used in calculating the pull-in forces should be that of the anti-cracking mash
spanning parallel to the beam as well as any additional reinforcement in the
140

slab. This steel will be much cooler than that of the primary beam.
The beam in figure 7.12 is replaced by an A142 anti-cracking mesh, typical of
steel reinforcement supplied in composite concrete panels. The mechanical
loading remains unchanged; however, the reinforcement is assumed to lie at
mid-depth in the concrete slab and therefore is at a much lower tempera-
ture. The resulting pull-in forces from this steel arrangement are shown in
figure 7.16. This is the total pull-in force applied across the entire span of
the floor system. The pull-in forces in this case are substantially larger due
to the lower ductility of the steel at the current temperature, and the corre-
sponding deflections are therefore lower, as shown in figure 7.17. Numerical
results from the same analysis as before are also shown in figures 7.16 and
7.17 for comparison with the analytical results. In this case, however, the
steel representing the reinforcing mesh in the numerical model is subject to
an increase in temperature over the course of the analysis representative of
the actual temperature of the reinforcing steel in the floor system. Over-
all good correlation is shown to occur between the two methods, with peak
forces being very similar.
Where additional structural steel in the form of primary beams is available,
equation 7.6 should include an additional term representing this. Unless the
steel is at a low temperature, i.e. in the case of unprotected steel, the re-
sulting material degradation will be such that the steel will have very low
strength and stiffness. Assuming that this additional steel has yielded due
to the applied thermal force, the tensile force becomes:
F (x) = AsEs(T )εs(x) + Abσyb(T ) (7.12)
141

Figure 7.16: pull-in forces on the structure from an A142 steel anti-crackingmesh
The highest pull-in forces occur after transition of the mechanism from a
flexural one to a catenary because of the high horizontal component of the
resulting axial load in the floor system at low deflections. Therefore the
surrounding structure should be designed to withstand these peak forces.
7.6 Column Loading
The result of the floor system adopting a catenary mechanism will be that
the tensile force of the reinforcement is transferred to perimeter beams via
shear studs and bent over reinforcement bars at the floors edge, and this
pull-in force is then transferred to the exterior column, figure 7.18. Where
the primary beam spanning between the exterior column and the stiff inter-
nal core of the building adopts a catenary, any additional pull-in force from
the beam will also be transferred to the column via the connection.
142

Figure 7.17: vertical deflection from the catenary action of the reinforcement
The resulting horizontal forces, in conjunction with the removal of lateral
restraint as a catenary mechanism is adopted by adjacent fire floors, will
cause large displacements in the column. The total moment on the column
is the sum of the P-δ moment from the axial load on the column and the
moment induced by the pull-in forces.
7.7 Minimum Deflection Required
For the one-dimensional model considered, the floor needs to adopt a cate-
nary response to the loading before any tensile forces can be applied to the
column. No provision is made for the floors ability to carry the load via a
flexural mechanism in the calculation method presented. The earliest time
at which the analysis can reasonably be applied to the columns corresponds
143
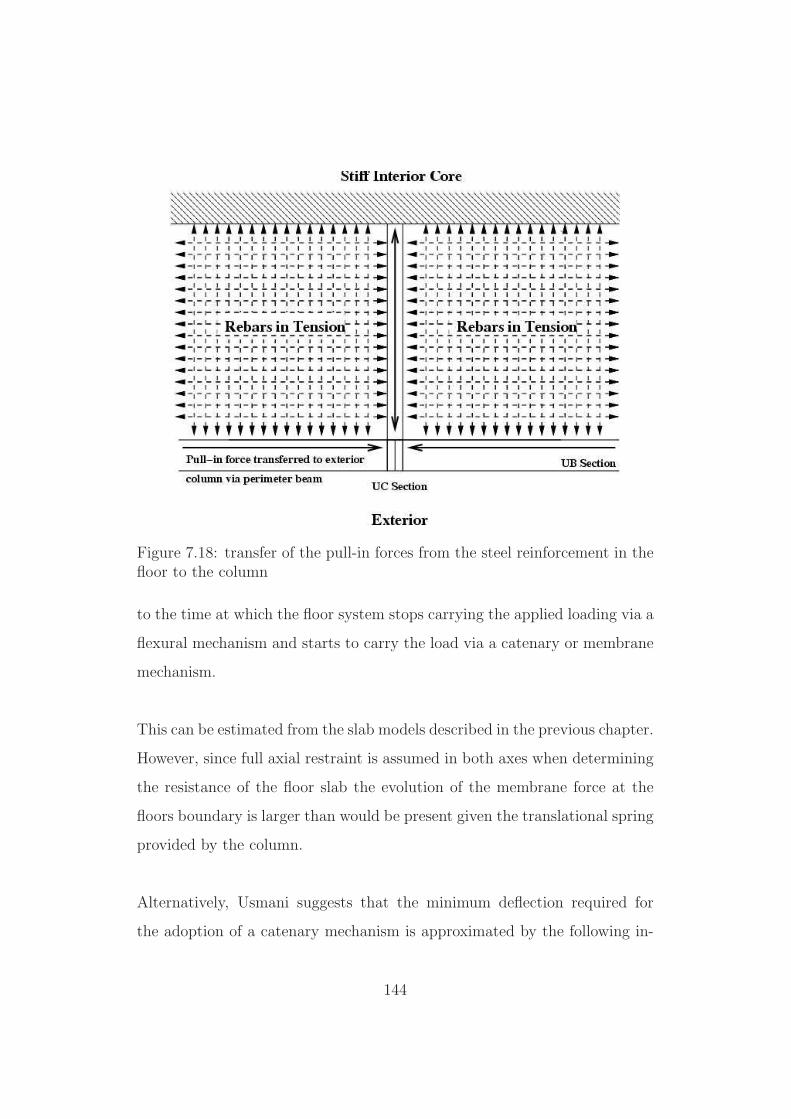
Figure 7.18: transfer of the pull-in forces from the steel reinforcement in thefloor to the column
to the time at which the floor system stops carrying the applied loading via a
flexural mechanism and starts to carry the load via a catenary or membrane
mechanism.
This can be estimated from the slab models described in the previous chapter.
However, since full axial restraint is assumed in both axes when determining
the resistance of the floor slab the evolution of the membrane force at the
floors boundary is larger than would be present given the translational spring
provided by the column.
Alternatively, Usmani suggests that the minimum deflection required for
the adoption of a catenary mechanism is approximated by the following in-
144

equality, based on empirical observations made during the analysis of the
Cardington tests:
wT >L
10(7.13)
7.8 Failure Mechanism Assessment
Having calculated the mechanical response of the floor, i.e. the horizon-
tal pull-in force, the increase in length, and the horizontal deflection of the
sprung support, there are three checks which need to be made to assess the
stability of the structure.
Firstly, the ability of the floor to sustain the required tensile load as a cate-
nary has to be determined; this should also include some consideration of
the transmission of the pull-in forces to the perimeter beam.
Secondly, the ability of the pivot floors to sustain axially the reaction re-
quired preventing lateral displacement of the column at levels above and
below the fire floors should be determined.
Thirdly, the moment resulting from the pull-in forces as well as the P-δ
moment resulting from the axial load on the column and the lateral displace-
ment should be determined.
145

7.8.1 Floor Failure
The floor system applies a very large horizontal pull-in force to the column.
It should be checked that the floor is able to sustain the load which it is
applying. The largest mechanical strains occur in the steel at the supported
edges of the floor system. From equation7.7:
εmax =
√
Np2 + p2
(
l2− x)
2
AsEs(T )(7.14)
In addition to this, the shear connectors around the edge of the floor system
which transfer the pull-in force to the perimeter beam should be able to resist
the pull-in force applied to the column, distributed along the entire length
of the perimeter beam. The force on the connectors, N s distributed at pitch
φ, for a floor of width L applying a pull-in force Np to the column is:
N s = NpL
φ(7.15)
7.8.2 Weak Floor Collapse Mechanism
The pivot floors, the floors above and below the fire floors, must be able
to resist axially the reaction required to resist horizontal translation of the
column. The axial resistance of the floor system should include a contribution
from both the steel and the concrete decking. According to Eurocode 4 [76],
the effective width of a concrete deck acting compositely with a steel beam
146

is equivalent to one quarter of the composite length:
Beff =Lcomp
4(7.16)
This effective width should be used to calculate the axial resistance of the
floor system as well as a bending stiffness using the reduced modular ratio
to determine the buckling resistance of the section.
It should be noted at this stage that equation 7.16 is intended for use in
calculating the effective width of the composite deck for bending. It is sug-
gested here for lack of a better value for the effective width and further
research may yield a more suitable value.
7.8.3 Strong Floor Collapse Mechanism
In the strong floor failure mechanism identified the pivot floors above and
below the fire floors are strong enough axially to resist the total horizontal
pull-in force. They are also strong enough to resist any P-δ moments as-
sociated with the cool floor deflection and the pull in force caused by the
fire floors. If the floors are strong enough and are shown not to buckle, the
column should be checked for the 3-hinge mechanism shown in figure 7.2.
The three hinge mechanism is caused by a combination of the moments in-
duced in the column by the horizontal pull-in force and the large P-δ moment
resulting from the horizontal displacement of the column under loading and
the vertical load above the pivot floor from the superstructure above the fire
floors.
147

For the column to withstand the pull-in forces, the following inequality should
be satisfied (where n=2 for a rectangular section; n≈1.3 for an I-section bend-
ing about it’s major axis or a box section; and n≈2 for an I-section bending
about its weak axis):
M
Mp(T )+
(
P
P p(T )
)n
< 1 (7.17)
7.9 Proposed Tall Buildings in Fire Stability
Assessment Methodology
By carrying out the above checks logically and following the analytical method
described, a simple assessment methodology for tall building collapse mech-
anisms in fire can be derived. Figure 7.19 illustrates such a design method-
ology.
The steps in the proposed methodology are as follows:
1. Structure and Thermal Loading Based on appropriate risk based crite-
ria, establish the following:
• An adequate two-dimensional representation of the structural frame,
including the exterior columns and the adjacent structural fram-
ing, which is assumed to be restrained in the interior by a stiff
core;
• The time dependent magnitude of fire in the compartments adja-
cent to the exterior columns of the structure (using one of BS476,
148

Figure 7.19: simple assessment methodology
ISO834, ASTME119 or Eurocode 1 based curves or other more
advanced fire models);
• The number of floors involved in the fire;
• The temperature distribution in the structural members of the
frame (columns and floor systems) at the end of the heating curve
using appropriate code formulas or tables or heat transfer calcu-
lations;
• Convert the temperature distribution at the end of the heating
phase to an equivalent uniform temperature and through depth
thermal gradient.
149

2. Floor Mechanical Loading Determine the mechanical state of the floor
system after application of the design thermal input (i.e the reduction
in strength and stiffness of the component materials and the change in
geometry) ignoring the mechanical loading, and follow these steps:
• Check if the applied uniformly distributed load (using appropriate
reduction factors allowed by code) on the floor can be resisted
through residual flexural capacity - if this is the case, stop the
analysis as the structure can not fail in either of the two collapse
mechanisms shown in figure 7.19;
• If the design udl is greater than the flexural resistance of the floor,
check to see if the udl can be resisted by the floor system through
catenary action, here the concrete tensile resistance is ignored and
only the reinforcement and any composite structural steel are as-
sumed to provide catenary resistance. If the floor system is un-
able to provide the tensile resistance (limited by rupture of re-
inforcement and fracture of structural steel connection) than the
floor system fails, leading potentially to progressive collapse. The
floor system should be redesigned until it is able to resist the udl
through flexure or catenary action.
• Determine the ”pull-in” forces applied on the column by the fire
floors sagging in catenary action.
• At this stage determine the ability of the floor system and the
shear studs to support the pull-in force
3. Column Mechanical Loading Using the catenary ’pull-in’ forces applied
by the floors, obtain the moments induced in the columns at the ’piv-
ot’ floors (adjacent to the fire floors) and in the centre of the height
150
between the pivot floors. Use an approximation of the column internal
displacement to calculate the additional P-δ moments experienced by
the columns.
4. Check for Weak Floor Collapse Mechanism Calculate the reaction of
the pivot floors as shown in figure 7.19 counteracting the membrane
’pull-in’ forces. If the floor membrane is unable to provide the reaction
calculated, a weak floor failure becomes possible. This failure is rel-
atively less likely to occur as it requires the pull in forces from many
floors on fire. However a combination of the membrane compression in-
duced in the floor and the additional moment imposed on the sagging
floor by the P-δ effect and by the rotation of the column may also cause
a combined bending and compression failure of the floor with only a
few floors on fire, also leading to a weak floor failure.
5. Check for Strong Floor Collapse Mechanism Perform an analysis to
calculate the column deflection under the ’pull-in forces’ from the fire
floors. Check the temperature dependent moment-force interaction di-
agram for the column to ensure that the column has not reached yield
surface (and thus formed a plastic hinge). If this is the case at all three
locations (pivot floors and middle fire floor) then the strong floor failure
mechanism identified can occur as the three hinges form a mechanism.
7.9.1 Example
To illustrate the methodology in use, the following structure is checked for
either of the two collapse mechanisms presented:
151
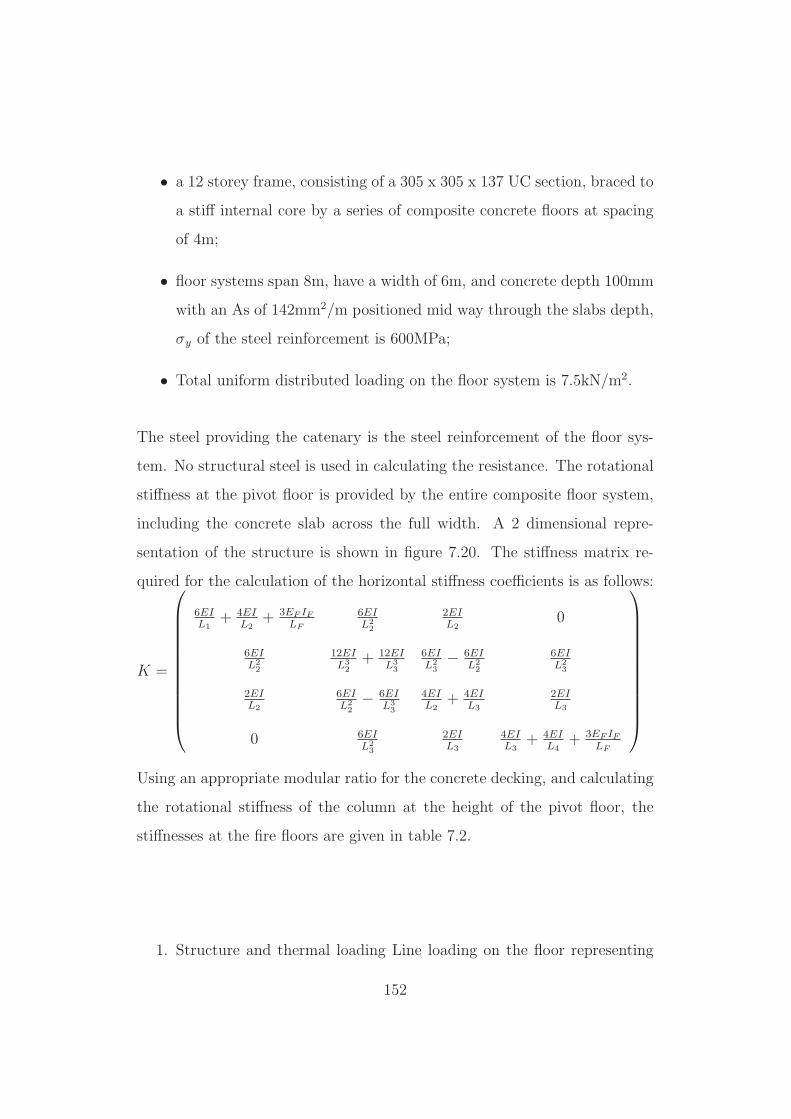
• a 12 storey frame, consisting of a 305 x 305 x 137 UC section, braced to
a stiff internal core by a series of composite concrete floors at spacing
of 4m;
• floor systems span 8m, have a width of 6m, and concrete depth 100mm
with an As of 142mm2/m positioned mid way through the slabs depth,
σy of the steel reinforcement is 600MPa;
• Total uniform distributed loading on the floor system is 7.5kN/m2.
The steel providing the catenary is the steel reinforcement of the floor sys-
tem. No structural steel is used in calculating the resistance. The rotational
stiffness at the pivot floor is provided by the entire composite floor system,
including the concrete slab across the full width. A 2 dimensional repre-
sentation of the structure is shown in figure 7.20. The stiffness matrix re-
quired for the calculation of the horizontal stiffness coefficients is as follows:
K =
6EIL1
+ 4EIL2
+ 3EF IF
LF
6EIL2
2
2EIL2
0
6EIL2
2
12EIL3
2
+ 12EIL3
3
6EIL2
3
−6EIL2
2
6EIL2
3
2EIL2
6EIL2
2
−6EIL3
3
4EIL2
+ 4EIL3
2EIL3
0 6EIL2
3
2EIL3
4EIL3
+ 4EIL4
+ 3EF IF
LF
Using an appropriate modular ratio for the concrete decking, and calculating
the rotational stiffness of the column at the height of the pivot floor, the
stiffnesses at the fire floors are given in table 7.2.
1. Structure and thermal loading Line loading on the floor representing
152

Figure 7.20: 2 dimensional representation of the structure
Weak floor system Strong floor system
K1, (N/mm) 4177 4386
K2, (N/mm) 24689 26381
Table 7.2: lateral column stiffness at fire floors
the entire UDL is 45kN/m length of floor. Thermal loading is approxi-
mated by an average temperature increase of 150OC and an equivalent
thermal gradient of 5OC/mm.
Lateral stiffness to translation at the floor levels is calculated taking
into account the contribution to the stiffness of the floors immediately
above and below the pivot floors.
2. Floor mechanical loading The severe thermal gradient which is imposed
153

Pull-in Vertical Lateral ∆L(mm)
force (N) Deflection (mm) Deflection (mm)
4.6 × 10⁵ 785 36.0 98.9
Table 7.3: pull-in forces
on the floor slab will cause large thermal displacements, and therefore
it can be assumed that flexural capacity is not available as a viable load
carrying mechanism under the prescribed conditions.
Following the method presented, the pull-in force, the vertical deflec-
tion, the lateral deflection and the increase in the length from the floor
acting on the column are as summarised in table 7.3, for one mid-height
floor on fire.
The increase in length of the floor system is 98.8mm, equating to an
average strain in the reinforcement of 1.2%, which is less than the rup-
ture strain for standard ductility reinforcement steel as described in
EC2 [38]. The pull-in force equates to an average stress of 540MPa on
the steel reinforcement, which is less than the yield stress stated.
3. Column mechanical loading Assuming that there are 3 fire floors, above
which are 6 non-fire floors the axial load on the column at the level of
the top pivot-floor is 2160N. Performing a 2nd order elastic analysis on
the structure using the program Mastan 2 [77], the maximum moment
on the column as a result of the combined P-δ moment and the pull-in
154

forces is 1.6×10⁶Nm. The horizontal reaction forces at the pivot floors
is 1.4 × 10⁶N.
4. Check for Weak Floor Collapse Mechanism The steel beam acting in
composite with the floor system should be able to withstand an axial
load of 1.4 × 10⁶N without buckling. The capacity of the floor system
to withstand the axial load can be enhanced by considering the com-
bined buckling capacity of the steel beam and concrete decking acting
in composite, using an appropriate modular ratio.
5. Check for Strong Floor Collapse Mechanism The column section obvi-
ously has some effect on the stiffness to lateral translation, and therefore
will have a small effect on the pull-in forces calculated in the analysis.
However, the column design should be iterated to withstand the max-
imum moment as calculated.
7.10 Conclusions
Two possible collapse mechanisms for tall buildings in fire have been postulat-
ed. Although the analyses carried out have generally been for 2-dimensional
structures, most structures are of regular plan and therefore the results can
be taken to be representative of the response of a regular multi-storey build-
ing subject to fire attack on multiple floors.
155

Pull-in forces and deflections of floor systems as a result of fire can be simply
and effectively calculated using the analytical techniques developed in this
chapter, and the resulting forces and deflections compare well with those
from finite element analyses. These pull-in forces are transferred via edge
beams and primary beams to perimeter columns of buildings, inducing large
displacements and moments in the columns leading to one of the two collapse
mechanisms described.
The results from the pull-in force calculation can be used in the presented
design methodology to provide a quick and simple assessment of tall building
stability given fire on multiple floors - something which current codes and
design guides omit. Where uncertainty or potential failure of the building is
apparent using the method a more complex numerical study can be carried
out to provide an additional check, or the structure can be strengthened and
rechecked using the method presented. The results can also be used to de-
termine the validity of finite element analyses, providing an initial estimate
of the magnitude of pull-in forces in complex structural models.
156

8Case Studies
8.1 Introduction
In 1992 the steel construction institute published a document comparing the
costs of various construction options in generic commercial buildings. The
study was updated in 2003, funded by Corus group plc. in order to compare
new technologies being taken advantage of by the construction industry [78].
The results of the project are summarised in a document published by Corus
157

C&I titled ’Supporting the commercial decision’ [79].
Two buildings were considered for the study, a small building of 2600m2
floor area, four storeys high; and a larger commercial building with an atri-
um of 18000m2 floor area 8 storeys high. For the purposes of the study, the
smaller of the two buildings was assumed to be in Manchester, and the larger
of the two buildings was assumed to be in London.
In this chapter, the performance in fire of the two buildings is determined
for two of the structural schemes considered in the original study, following
the proposed assessment methodology and recommendations are made to
overcome any deficiencies encountered.
8.2 Building A
The Manchester office building is a four storey office building, the plan and
architectural features of which are shown in figure 8.1 and figure 8.2.
Figure 8.1: building A floor plan layout
158

Figure 8.2: building A architectural impression
8.2.1 Overview
A number of schemes are presented in the comparative study for the building,
5 short span floor systems, and 8 long span floor systems. The long span floor
schemes are designed to allow for the removal of the internal columns except
in the cores at either end of the building. The long span floor systems are
neglected for this case study, and the performance of the short span systems
is determined. The short span systems include:
• Slimflor beams with pre-cast concrete slabs and a 60mm concrete top-
ing;
• Two Slimdek composite floor options, one where the floor spans longitu-
dinally through the building and one where the floor spans transversely;
• Composite concrete beam and slab option, and a;
• Reinforced concrete slab option.
159

8.2.2 Structural Scheme Studied
The structural scheme studied in this chapter is the composite concrete beam
and slab option. The initial design is the design as detailed in the SCI
document, and is summarised in figure 8.3. The slabs are modelled with
a nominal thickness of 95mm. Strength is based on only the anti cracking
mesh in the upper layer of the slab. It is assumed initially that none of the
secondary steelwork is protected against thermal effects.
Figure 8.3: building A composite slab construction details
160

8.2.3 Loading
Design loading and additional information regarding the materials used is
presented in table 8.1. All floors, including the roof level are designed to
resist the same loading. Although it is not stated, it is assumed that all rein-
forcing steel has yield strength of 460MPa. The building is divided into two
Design Loading
Imposed load 3.5kN/m2
Partition loading 1kN/m2
Services, ceiling 0.7kN/m2
loading, etc.
Floor
Concrete Normal weight concrete
Steel grade
Columns and primary Grade s355
beams
All other beams Grade s275
Table 8.1: building A design loading and materials
bays of 6m and 7.5m by the line of columns down the middle of its length.
This results in the regular structural grid seen in Figure 9 1. The floors are
sited at a vertical spacing of 2.7m.
The total distributed load on the floors of the structure using the composite
beams and composite slab construction option consists of the fully factored
live load of 5.2kN/m2 plus an additional dead load of 2.4kN/m2 which rep-
161

resents the composite concrete decking.
The original building was designed to have a fire resistance of 60 minutes,
using the factors allowed in Eurocode 4 [37], the imposed load on the struc-
ture can be reduced by a factor of 0.65 to 2.275kN/m2 from 3.5kN/m2. Fully
factored design loading is shown in table 8.2. In the analysis, the un-factored
Live Load 4.5kN/m2
Dead Load 2.4kN/m2
Total Load 6.9kN/m2
Table 8.2: total loading for building A including factored accidental loading
material strengths are used, in accordance with Eurocode 4.
8.2.4 Building Layout
The layout of the building on all four floors is as shown in figure 8.4, figure 8.5,
figure 8.6, and figure 8.7. The building runs east to west and the stairwells
are located on the north face of the building.
Figure 8.4: building A ground floor plan
162

Figure 8.5: building A first floor plan
Figure 8.6: building A second floor plan
Figure 8.7: building A third floor plan
163

8.2.5 Building A Risk Assessment
Step 1. Division of the structure or system into suitable compartments and
components
Step 1 is the identification of the compartments which will comprise the
structural fire risk assessment. These are listed below:
Records (GF)
Kitchen (1F)
Kitchen (2F)
Reception
Cellular Offices (GF)
Cellular Offices (2F)
Cellular Offices (3F)
Open Plan Offices (1F)
Open Plan Offices (2F)
Open Plan Offices (3F)
Storage Room (GF)
Meeting Room (1F)
Step 2. Fuel load ranking
164

The different compartments are arranged in order of relative potential fu-
el load. This is the first stage in the development of the relative risk matrix
for the project which will lead to the risk ranking. The compartments are
arranged against the headings described in Chapter 5 in table 8.3.
Relative
potential fuel High Medium Low Very Low
load
Compartments Records(GF) Cellular Kitchen(1F)
Storage Offices(GF) Kitchen(1F)
room (GF) Cellular Reception
Offices(2F)
Cellular
Offices(3F)
Open plan
offices (1F)
Open plan
offices (2F)
Table 8.3: building A relative fuel load potential
The records room and storage room are expected to have the highest po-
tential fuel load, followed by the offices where there may be some instances
of combustibles such as office furniture or reference material. The recep-
tion area will have little combustible material present and is expected to be
165

mainly used as a waiting area. Similarly, the kitchen is expected to have
little combustible material present although it will have a number of ignition
sources present.
Step 3. Ignition source ranking
The potential for ignition in each of the areas identified is summarised in
table 8.4.
Relative
ignition Very Likely Likely Unlikely Very Unlikely
potential
Compartment Kitchen Cellular Records (GF)
(1F) Offices (GF) Storage
Kitchen Cellular Room (GF)
(2F) Offices (2F) Recpetion
Cellular
Offices (3F)
Open plan
Offices (1F)
Open plan
Offices (2F)
Table 8.4: building A relative ignition potential
166

Risk Ranking IV III II I
Compartments Records (GF) Reception Cellular
Storage Room (GF) Offices (GF)
Kitchen (1F) Cellular
Kitchen (2F) Offices (2F)
Cellular
Offices (3F)
Open Plan
Offices (1F)
Open Plan
Offices (2F)
Table 8.5: building A relative compartment risk ranking
Step 4. Risk Ranking
The relative risk matrix is used in correlation with the tables above to order
the compartments into their relative risk from fire and the potential which
they may have for a meaningful fire occurring within the building.
The overall relative risk is summarised in table 8.5. This is the list which will
be used in determining the order in which the structure should be checked
for achieving the reliability required. This list is based on the risk matrix
described in the chapter 5 figure 8.8.
167

Figure 8.8: Risk matrix
168

8.2.6 Building A Reliability Assesment
The structural models used in the analysis are those described in previous
chapters. For the purposes of tensile membrane action and the pre-stressed
yield line method the slab is assumed to by 2-way spanning between the
supports.
The slabs are constructed from normal weight concrete 60mm deep ignor-
ing the depth of the ribs, with an A142 anti-cracking mesh positioned 25mm
from the heated surface. The steel column section is a UC 203 x 203 x 60.
Although in the original study the steel elements were protected with an in-
tumescent coating it is assumed that the steel beam is a 280ASB100 section
with an exposed lower flange. All primary steelwork has yield strength of
355MPA. It is assumed that the temperature of the steel beam follows the
compartment temperature-time curve.
Step 1. Reliability Goal Definition
From the ASCE 7 standard the building is in performance group 2, i.e. it
is a commercial structure where the occupants are unlikely to have reduced
mobility. Using the performance matrix of table 4.1, the required frequency
of severe structural damage is rare which corresponds to a reliability index
of 3.1 according to table 5.2.
Step 2. Fire Scenario Definition
Using the Eurocode parametric fire curve, variation in the fire scenario is
169

defined primarily by the opening factors of the building and the areas of the
rooms. For each of the compartments, these are as detailed in table 8.6.
Compartment Floor area Windows
Records (GF) 36m2 1 × (5 x 2 m)
Kitchen (1F) 36m2 3 × (1.5 x 1.5 m)
Kitchen (2F) 36m2 1 × (1.5 x 1.5 m)
Reception 115m2 3 × (5 x 2 m)
Cellular Offices 144m2 4 × (5 x 2 m)
(GF)
Cellular Offices 144m2 6 × (1.5 x 1.5 m)
(2F)
Cellular Offices 216m2 14 × (5 x 2m)
(3F)
Open Plan Offices 486m2 36 × (1.5 x 1.5 m)
(1F)
Open Plan Offices 306m2 7 × (1.5 x 1.5 m)
(2F)
Storage Room (GF) 72m2 2 × (5 x 2m)
Meeting Room (1F) 36m2 3 × (1.5 x 1.5 m)
Table 8.6: building A Compartment areas and openings
Variation of the openings is achieved using a normal distribution, truncated
at 0 and the maximum opening possible. The mean of all of the openings is
taken to be 75% of the opening factor, and the standard deviation is 10% of
the opening factor plus 1% per window up to a maximum of 20%.
170
The limiting time is linearly distributed between 900 and 1500s.
The fuel load is based on the fuel load prescribed by EC 1 [15] for the closest
occupancy type. Variation is a normal distribution with mean as described
in EC1 and standard deviation of 7.5%.
All other variables required for the analysis are deterministic and are not
varied during the analyses. This is chosen arbitrarily, and is intended to
represent a range of real fires which may occur within each compartment.
Step 3. Structural component pairing with compartment.
As discussed above, the floor slabs within the building are assumed to be
2-way spanning. They are modelled using the techniques described in Chap-
ter 6.
In this example, it is assumed that fire stopping is adequately installed be-
tween the floors and therefore a fire on multiple floors is not considered.
However, building stability as a result of a fire on one floor is considered.
This is modelled using the techniques described in Chapter 7. It is assumed
in this case that the structure outwith the fire compartment provides enough
support to adequately restrain the floor system at the interior edge for one
of the collapse mechanisms described to occur.
The structural components which correspond to each of the compartments
are listed below in table 8.7. Where a compartment boundary lies along a
171

grid line and there are no grid lines within the compartment the floor sys-
tem is assumed to be supported by the compartment boundary and therefore
catenary action is unable to form which means that the column is not ex-
posed to any additional pull-in forces. In these cases, the column in the table
which pertains to the floor length is left blank and columns are not analysed
in these compartments.
The structural detailing is similar for all components and is detailed in 8.2.2,
above. It is therefore not summarised again here.
Step 4. Targeted Reliability Analysis.
The reliability analysis of the components listed in table 8.7 follows the or-
der dictated by the risk ranking in table 8.5. It is based on deterministic
structural details and the details provided on the fire loading as detailed in
the previous step.
The first targeted analysis is performed on those components which are as-
sociated with the highest risk compartments. The results of this reliability
analysis are detailed in table 8.8. These results are based upon a study of
100 samples. None of the slabs in the compartments are able to sustain the
static loading required under a deterministic analysis using the means of the
input variables; using the varied input variables to perform a reliability study
of the components highlights the fact that the margin of safety is negative,
indicating failure in most cases.
Increasing the diameter of the steel reinforcement used in the calculation
172

Floor slab Column
Compartment Quantity Dimensions Floor Length
Records (GF) 1 6 × 6m
Kitchen (1F) 1 6 × 6m
Kitchen (2F) 1 6 × 6m
Reception 2 6 × 6m 6m
1 6 × 7.5m
Cellular Offices (GF) 4 6 × 6m 6m
Cellular Offices (2F) 5 6 × 6m 6m
Cellular Offices (3F) 6 6 × 6m 6m
8 6 × 7.5m
Open Plan Offices (1F) 6 6 × 6m 6m
6 6 × 7.5m 7.5m
Open Plan Offices (2F) 8 6 × 6m 6m
Storage Room (GF) 2 6 × 6m 6m
Meeting Room (1F) 1 6 × 6m
Table 8.7: structural details by compartment
from 6mm to 7mm, i.e. changing the mesh from an A142 mesh to an A193
changes the reliabilities of the floor slabs to those shown in table 8.9. Increas-
ing the diameter of the anti-cracking mesh which the membrane capacity is
reliant upon dramatically increases the reliability of the floor plates in fire,
more than doubling the reliability indices of the floor plates in question.
The risk acceptance criteria proposed in the design framework requires that
the reliability analysis should continue through successive risk levels until the
173

Compartment Component Dimensions µ(M) σ(M) β Pass/Fail
Records Slab 6 × 7.5m 1.0 0.53 1.89 Fail
(GF) kN/m2 kN/m2
Storage Slab 6 × 6m 1.0 0.56 1.79 Fail
room (GF) kN/m2 kN/m2
Kitchen Slab 6 × 6m 1.1 .38 2.89 Fail
(1F) kN/m2 kN/m2
Kitchen Slab 6 × 6m 0.96 0.47 2.04 Fail
(2F) kN/m2 kN/m2
Table 8.8: level IV risk targeted reliability analysis
solution satisfies the requirements ’as is’. The reliability analysis is therefore
extended to encompass components which are associated with compartments
which have been allocated the next level of risk, table 8.10.
Table 8.10 shows all of the components which are associated with the com-
partments having the next level of risk to meet the reliability goals. The
floor slabs meet them satisfactorily. Since the fire is considered to occur on
only one floor and the floor to floor spacing is relatively low the reliability of
the columns is very much higher than the reliability goal.
8.3 Building B
The prestige office block in London, figure 8.9, is an 8 storey high quadran-
gle consisting of 2 structural bays which circle around a closed roof atrium.
The reliability of the atrium roof structure is not considered in this study,
174

Compartment Component Dimensions µ(M) σ(M) β Pass/Fail
Records Slab 6 × 7.5m 3.9 0.65 6 Pass
(GF) kN/m2 kN/m2
Storage Slab 6 × 6m 4.0 0.55 7.3 Pass
room (GF) kN/m2 kN/m2
Kitchen Slab 6 × 6m 3.9 .67 5.8 Pass
(1F) kN/m2 kN/m2
Kitchen Slab 6 × 6m 3.9 0.56 7.0 Pass
(2F) kN/m2 kN/m2
Table 8.9: revised level IV risk targeted reliability analysis
and it is assumed that appropriate ventilation is included in the overall fire
strategy for the building to ensure that the gas temperature in the atrium
is controlled and maintained below a temperature at which it may become
of relevance to the surrounding structure. Therefore the atrium is effectively
ignored.
The building is 45m wide by 60m in length and the atrium measures 15m
x 30m. The structural bays are arranged on a regular grid of 7.5m squares,
figure 8.10.
175

Compartment Component Dimensions µ(M) σ(M) β Pass/Fail
Reception Slab 6 × 6m 1.2 .36 3.3 Pass
kN/m2 kN/m2
(GF) Slab 6 × 7.5m 1.2 0.35 3.4 Pass
kN/m2 kN/m2
Column 6m 6.6 .068 97 Pass
floor length kNm kNm
Table 8.10: level III risk targeted reliability analysis
Figure 8.9: architectural features of building B
176

Figure 8.10: structural layout of building B
177

8.3.1 Structural Scheme Studied
As with building A, a number of structural schemes were considered in the
original SCI study. In this study, the scheme comprising a composite beam
and slab is chosen. The structural details are summarised in figure 8.11.
Figure 8.11: building B composite beam/slab detail
178

8.3.2 Design Loading
Design loading in building B is the same as in building A, table 8.2.
8.3.3 Building Layout
The building layout is as shown in figures 8.12, 8.13, 8.14, 8.15 and 8.16.
Floors 2-5 have the same layout and are treated as one floor in the analysis.
Figure 8.12: building B ground floor layout
179

Figure 8.13: building B 1st floor layout
Figure 8.14: building B 2nd floor layout
180

Figure 8.15: building B 6th floor layout
Figure 8.16: building B 7th floor layout
181

8.3.4 Building B Risk Assessment
Step 1. Division of the structure or system into suitable compartments and
components
As before, step 1 is the identification of the compartments which will com-
prise the structural fire risk assessment.
Storage (GF)
Meeting / Conference room (GF)
Exhibition space (GF)
Reception (GF)
Cellular offices (GF)
Kitchen (1F)
Dining area (1F)
Lecture theatre (1F)
Cellular offices (1F)
Open plan office (2-5)
Archive store (6F)
Cellular offices (6F)
Equipment testing benches (6F)
Cellular offices (7F)
182

Step 2. Fuel load ranking
The different compartments are arranged in order of relative potential fu-
el load. This is the first stage in the development of the relative risk matrix
for the project which will lead to the risk ranking. The compartments are
arranged against the headings described in Chapter 5 in table 8.11.
The records room and storage room are expected to have the highest po-
tential fuel load, followed by the offices where there may be some instances
of combustibles such as office furniture or reference material. The recep-
tion area will have little combustible material present and is expected to be
mainly used as a waiting area. Similarly, the kitchen is expected to have
little combustible material present although it will have a number of ignition
sources present.
Step 3. Ignition source ranking
The potential for ignition in each of the areas identified is summarised in
table 8.12.
Step 4. Risk Ranking
The relative risk matrix is used in correlation with the tables above to order
the compartments into their relative risk from fire and the potential which
they may have for a meaningful fire occurring within the building.
The overall relative risk is summarised in table 8.13. This is the list which will
183

Relative
potential fuel High Medium Low Very Low
load
Compartments Storage Cellular Meeting/Conference
(GF) offices (GF) room (GF)
Archive Cellular Exhibition space
store (6F) offices (1F) (GF)
Open plan Reception (GF)
offices (2-5) Kitchen (1F)
Cellular Dining area (1F)
offices (6F) Lecture theatre
Equipment (1F)
testing
benches (6F)
Cellular
offices (7F)
Table 8.11: building B relative fuel load potential
be used in determining the order in which the structure should be checked
for achieving the reliability required.
184

Relative
ignition Very Likely Likely Unlikely Very Unlikely
potential
Compartment Kitchen (1F) Cellular Storage (GF)
Equipment Offices (GF) Archive store (6F)
testing Cellular Meeting/conference
benches (6F) Offices (1F) room (GF)
Open plan Exhibition space
offices (2-5) (GF)
Cellular Reception (GF)
offices (6F) Dining Area (1F)
Cellular Lecture Theatre
offices (7F) (1F)
Table 8.12: building B relative ignition potential
8.3.5 Building B Reliability Assessment
The structureal models used in the analysis are those described in previous
chapters. For the purposes of tensile membrane action and the pre-stressed
yield line method the slab is assumed to be 2-way spanning between the sup-
ports.
The slabs are constructed from normal weight concrete 60mm deep ignor-
ing the depth of the ribs, with an A142 anti-cracking mesh positioned 25mm
from teh heated surface. The steel column is a UC 204 x 203 x 60. Although
in the original study the steel elements were protected with an intumescent
185

Risk Ranking IV III II I
Compartments Storage Cellular Kitchen Meeting/conference
(GF) offices (GF) (1F) room (GF)
Archive Cellular Exhibition space
store (6F) offices (1F) (GF)
Open plan Reception (GF)
offices (2-5) Dining area (1F)
Cellular Lecture theatre
offices(6F) (1F)
Cellular
offices (7F)
Equipment
testing
benches (6F)
Table 8.13: building B relative compartment risk ranking
186

coating it is assumed that the steel beam is a 280 ASB 100 section with an
exposed lower flange. All primary steelwork has yield strength of 355MPa. It
is assumed that the temperature of the steel beam followes the compartment
temperature-time curve.
Step 1. Reliability goal definition
From the ASCE 7 standard the building is in performance group 2, i.e. it
is a commercial structure where the occupants are unlikely to have reduced
mobility. Using the performance matrix of table 4.1, the required frequency
of severe structural damage is rare which corresponds with a reliability index
of 3.1 according to table 5.2.
Step 2. Fire Scenario Definition
Using the Eurocode paramteric fire curve, variation in teh fire scenario is
achieved by varying the opening factors of the building, the limiting time
and the fuel load per unit area. For each of the compartments, areas and
openings are detailed in table 8.14.
The variation of the openings is the same as with the previous example, i.e.
it is As with building A, the limiting time is linearly distributed between 900
and 1500s.
The fuel load is based on the fuel load prescribed by EC 1 [15] for the closest
occupancy type. Variation is a normal distribution with mean as described
in EC1 and standard deviation of 7.5%.
187

All other variables required for the analysis are deterministic and are not
varied during the analyses. This is chosen arbitrarily, and is intended to
represent a range of real fires which may occur within each compartment.
Step 3. Structural Component Pairing with Compartment
As discussed above, the floor slabs within the building are assumed to be 2-
way spanning. They are mdoelled using the techniques desscribed in Chapter
6.
In this example, it is assumed that fire stopping is adequately installed be-
tween the floors and therefore a fire on multiple floors is not considered.
However, building stability as a result of a fire on one floor is considered.
This is modelled using the techniques described in Chapter 7. It is assuemd
that the tructure outwith the fire compartment provides enough support to
adequately restrain the floor system at the interior edge for one of the col-
lapse mechanisms described to occur.
The structural components which correspond to each of the compartments
are listed below in table 8.15. Where a compartment boundary lies along a
grid line and there are no grid lines within the compartmnet the floor sys-
tem is assumed to be supported by the compartment boundary and therefore
catenary action si unable to form which means that the column is not ex-
posed to any additional pull-in forces. In these cases, the column in the table
which pertains to the floor length is left blank and columns are not analysed
in these compartments.
188

The structural detailing is similar for all components and is detailed in sec-
tion 8.3.1, above. It is therefore not summarised again here.
Step 4. Targeted Reliability Analysis.
The first reliability analysis of building B is on those components which
ahave been allocated the highest level of risk. These are teh storage and the
archive rooms. The results of this reliability analysis are detailed in table
8.16.
All of the components of building B meet the reliability targets as set out
in Stage 1 of the reliability assessment without any further revision. Since
no revision is required to the components which comprise the compartments
with the highest risk no further analysis is necessary for the remaining com-
partments. As with building A, the reliability of the columns is very much
higher than the reliability goal of the project. If a fire on multiple floors was
considered or if the floor to floor spacing was lower then the reliability of the
columns would be expected to be lower.
189

Compartment Floor area Windows
Storage (GF) 450m2 6 × (7 × 2m)
Meeting/conference 450m2 6 × (7 × 2m)
room (GF)
Exhibition space (GF) 366m2 3 × (7 × 2m)
Reception (GF) 366m2 2 × (7 × 2m)
Cellular offices (GF) 2532 3 × (7 × 2m)
Kitchen (1F) 2252 4 × (7 × 2m)
Dining area (1F) 4502 4 × (7 × 2m)
Lecture theatre (1F) 225m2 4 × (7 × 2m)
Cellular offices (1F) 380m2 4 × (7 × 2m)
Open plan offices (2-5) 1603m2 22 × (7 × 2m)
Archive store (6F) 450m2 6 × (7 × 2m)
Cellular offices (6F) 337.5m2 5 × (7 × 2m)
Equipment testing 337.5m2 5 × (7 × 2m)
benches (6F)
Cellular offices (7F) 380m2 5 × (7 × 2m)
Table 8.14: building B Compartment areas and openings
190

Floor slab Column
Compartment Quantity Dimensions Floor Length
Storage (GF) 8 7.5 × 7.5m 7.5m
Meeting / conference 8 7.5 × 7.5m 7.5m
room (GF)
Exhibition space (GF) 7 7.5 × 7.5m 7.5m
Reception (GF) 7 7.5 × 7.5m 7.5m
Cellular offices (GF) 5 7.5 × 7.5m 7.5m
Kitchen (1F) 4 7.5 × 7.5m 7.5m
Dining area (1F) 8 7.5 × 7.5m 7.5m
Lecture theatre (1F) 4 7.5 × 7.5m 7.5m
Cellular offices (1F) 8 7.5 × 7.5m 7.5m
Open plan offices (2-5) 30 7.5 × 7.5m 7.5m
Archive store (6F) 8 7.5 × 7.5m 7.5m
Cellular offices (6F) 10 7.5 × 7.5m 7.5m
Equipment testing 10 7.5 × 7.5m 7.5m
benches (6F)
Cellular offices (7F) 8 7.5 × 7.5m 7.5m
Table 8.15: building B structural details by compartment
191

Compartment Component Dimensions µ(M) σ(M) β Pass/Fail
Storage Slab 7.5 × 7.5m 1.8 0.46 3.88 Pass
(GF) kN/m2 kN/m2
Column 7.5m floor × 7.5m 3.6 .096 37.8 Pass
length kN/m2 kN/m2
Archive store Slab 7.5 × 7.5m 1.8 0.46 3.88 Pass
(6F) kN/m2 kN/m2
Column 7.5m floor × 7.5m 5.3 .096 55.2 Pass
length kN/m2 kN/m2
Table 8.16: level IV risk targeted reliability analysis (building B)
192

8.4 Summary
In the original study by the SCI, buidling A was designed to have a 60 minute
fire resistance and building B was designed to have a 90 minute fire resis-
tance. This was provided via a combinationof board encasement, spray on
intumescent coating applied both ons and offsite as well as a cementitious
spray protection.
The approach suggested here will hopefully reduce the cost of the fire pro-
tection required. Especially for building A where, although a number of the
floor plates require additional reinforcement to be applied, it is expected that
some saving can be achieved by omitting fire protection from all secondary
beams using the design principles given here. The motivation for employing
the techniques described here is further enhanced by the added security and
safety that the more scientific approach taken here to the assessment of the
structure for high temperatures will provide.
There were very few changes required to building A, these comprise an in-
crease in the anti-cracking mesh size for only a few hazard rooms. If the use
and / or occupancy of building A is expected to change over its life time then
additional measures may be requried to mitigate against any additional risks
introduced as a result of this.
Building B meets the performance goals as it is currently designed, how-
ever as with building A if any changes are expected to occur during the
buildings life time then additional work may be required to identify and to
mitigate against any additional risks.
193

The amount of work introduced to a project by this methodology is lim-
ited, especially where the structure is designed around a simple grid system
as the buildings described in this chapter. The work required does not re-
quire any specialist tools or software and as such the cost introduced to a
project in order to carry out these analyses will be very low.
194

9Conclusions
9.1 Summary
The aim of this thesis has been to develop a performance based design
methodology for structures in fire, addressing the concepts of risk and relia-
bility. This goal was complemented by the need to develop further suitable
analytical techniques for the assessment of a structures response in fire.
195

A methodology for the performance based design of structures in fire has
been proposed, based on the concepts of risk and reliability and drawing on
the common aspects of a performance based design framework. The frame-
work is not dependant upon statistical means to define fire scenarios for a
building to resist and takes a more holistic approach which allows the design
fires to be based upon the likely distribution of fuel, ignition sources and
ventilation within a building.
The framework is demonstrated in use by assessing the performance of two
’standard’ buildings in fire. The buildings are assessed using a complete
model describing floor plate behaviour at increasing deflection and a sim-
ple assessment methodology for stability of tall buildings in fire. These two
techniques are developed and described in earlier chapters and are analyt-
ical methods which are based on the fundamental principles of structural
behaviour in fire.
The floor plate methodology is a continuation and modification of a the-
ory for describing tensile membrane capacity of heated floor plates. The
membrane forces are used to derive a thermally pre-stressed yield line theory
for floor plates which are sufficiently rigid that they do not experience large
thermal deflections at their mid-span and therefore do not lend themselves
well to tensile membrane action.
The tall building assessment methodology is based on the results of exhaus-
tive numerical studies carried out to identify potential collapse mechanisms
of tall buildings in fire. Analytical techniques are derived which describe the
contributing forces for these mechanisms.
196

Following assessment of the risk and reliability of the two structures in fire,
improvements are made based upon the results of the analysis to increase the
reliability of the structures such that they meet simple reliability targets.
9.2 Discussion and Possible Further Work
The structural work and assessment of capacities in this thesis has been
primarily concerned with the growth and burning phase of a compartment
fire. It is becoming increasingly clear to researchers, however, that the large
strains which develop in a structure or frame during the cooling phase of a fire
can and do have a significant effect on the resulting stability of the structure
after fire. Despite this, the design methodology presented and the method
for the assessment of the performance of the building during fire is applicable
to all design situations. Since performance based design methodologies are
inherently modular, cooling, and any additional design situations for which
a performance goal can be defined can be addressed in the methodology in
one of three ways:
1. The modules which comprise the assessment procedure can be changed
to take account of the cooling effects of fire on the structure;
2. Additional modules can be introduced to describe and assess the struc-
tures response to other design scenarios; or,
3. Entirely new modules can be developed as required or as new knowledge
and understanding becomes available to the designer.
197

The risk assessment methodology proposed draws together a lot of the con-
cepts which are currently in use for structural fire safety design for excep-
tional structures, such as identification of locations of high fuel loads and
compartments where a fire is likely to be of greater magnitude than in anoth-
er compartment. The methodology proposed draws these concepts together
into a coherent methodical framework which has been shown to be suitable
for the assessment of more regular structures. However, the framework at
present does not incorporate the structural detailing and the vulnerability of
some, e.g. long span, systems to fire. This vulnerability can have a serious
impact on the risk from fire. It may be possible to incorporate this aspect
into future iterations of the framework by including a subsequent ranking of
the components analysed in each compartment by their own relative hazard.
The arrangement and grouping of the compartments by relative fuel load
(hazard) and ignition likelihood is potentially very subjective. Guidelines for
consistent selection of the groupings could be based upon the occupancy - in
the examples, office areas are considered to be of medium or low combustible
loading, and to have an unlikely ignition potential driven by a failure in a
standard piece of electrical equipment. Other areas, such as public areas
may have a higher ignition potential as would kitchens and work benches,
etc. Storage areas will have a higher fuel load, and large open spaces will
have lower fuel loads.
The reliability goals which are used in the case studies are based on the
Eurocode reliability goals, and selected from a performance matrix and the
ASCE 7 standard. This draws on a number of standards and proposed stan-
dards which may have different foundations and goals. As such the reliability
198

goals may seem high for such a low probability event. However, their use is
justified by the fact that no alternative reliability goals exist at present for
fire. These are an initial suggestion for the reliability goals, and lower less
onerous reliability goals may be equally suited to the purpose.
The selection of fire scenarios in the analyses is based upon an arbitrary
selection of random distributions for the non-deterministic variables. The
examples are chosen such that the fire scenarios will represent the range of
possible fires which may occur within the compartment; however this selec-
tion will vary from user to user and will be dependant upon the modelling
approach taken.
There is at present no scientific method for determining the probability of
an event within a compartment. However, the field of fire engineering is con-
stantly evolving and structural design for fire safety on a performance basis
is in its infancy. It is highly likely that new developments and methods will
become available for the estimation of these probabilities and the techniques
described here will need to be adapted to reflect these.
For ambient design, loads and material strengths are multiplied by some
factor which is intended to ensure that the final design meets the reliabili-
ty goal of the system. These safety factors are derived from the reliability
methodologies described in this thesis; however no such factors, aside from
the reduced live design load, exist for elevated temperatures. It would be
possible to develop a range of partial factors for the material strengths to be
used in the design methodologies described in this thesis, based on the results
of repeated, physical or analytical, reliability testing to prevent the necessity
199

for such a subjective arbitrary variation in the thermal loading suggested
here. These factors would be easier to use than the proposed methodology
and would facilitate a more widespread growth in the use of performance
based structural design for fire safety.
The methodologies described for the determination of floor slab capacity
in fire assume a low deflection and a large deflection respectively. The pre-
stressed yield line methodology when it yields will allow the slab to adopt
a large deflection, increasing towards that of a tensile membrane capacity.
Through this increase in the deflection, a large amount of external work is
released without a correspondingly large increase in the internal work as the
concrete cracks across the slabs surface. Where the thermal effects on the
slab are high enough, this transition will be arrested by the reinforcement
mesh as it adopts a tensile mechanism. However, where the capacity of a
tensile membrane mechanism is not high enough to arrest the load on the
slab the slab will fail.
It is likely that regions of concrete at low deflection will continue to pro-
vide a laterally compressed support through this transition, with the level of
support decreasing correspondingly with an increasing area having adopted
a tensile membrane mechanism. Further study into this is possible, and may
yield a further enhancement to the capacity calculated via tensile membrane
mechanisms and provide greater confidence in the ability of a floor slab to
sustain static loading despite large central deflections.
200

References
[1] S. Lamont. Behaviour of steel framed structures in fire. The Universityof Edinburgh, 1997.
[2] Pd 7974-3: 2003 application of fire safety engineering principles to thedesign of buildings - part 3: Structural response and fire spread beyondthe enclosure of origin (sub-system 3).
[3] B. Tubbs. Icc performance codes for buildings and facilities structuralfire protection provisions. 2001.
[4] S.R. Hamilton, C.A. Menun, and G.G. Deierlein. Probabilistic aspects ofperformance-based engineering methodologies for fires and earthquakes.2002.
[5] T.F. Barry. Risk informed - performance based industrial fire protection.first edition. Tennessee Valley Publishing, 2002.
[6] F.W. Mowrer. A performance framework for structural fire safety.
[7] J.L. Torero, J.G. Qunitiere, and T. Steinhaus. Fire safety in high-risebuildings, lessons learned from the wtc. Vereinigung zur Forderung desDeutschen Brandschutzes e.V, 2002.
[8] Nfpa 551 guide for the evaluation of fire risk assessments 2007 edition.
[9] J.M.J. Watts. Fire risk ranking. The SFPE Handbook of Fire ProtectionEngineering, 2nd Edition, 1995.
[10] C. Roben. Fire induced instability in multi-storey frames. The Univer-sity of Edinburgh, 2006.
[11] En 1990:2002 eurocode - basis of structural design.
201

[12] J. Twilt, J. Van Oerle, and U. Kirchner. Fire characteristics for use in anatural fire design of building structures, in competitive steel buildingsthrough the natural fire safety concept. Profil Arbed, 1999.
[13] Bs iso/tr 13387-2:1999 fire safety engineering - part 2: Design fire sce-narios and design fires.
[14] A.H. Buchanan. Structural design for fire safety. 2001.
[15] En 1991-1-2:2002 eurocode 1: Actions on structures - part 1-2: Generalactions - actions on structures exposed to fire.
[16] J. Zehfuss and D. Hosser. A parametric natural fire model for the struc-tural fire design of multi-storey buildings. Fire Safety Journal, 42:115–126, 2007.
[17] J.M. Franssen and J.-F. Cadorin. Natural fire models in competitivesteel buildings through the natural fire safety concept.
[18] Nist, fire dynamics simulator (fds).
[19] Ansys, ansys cfx.
[20] Bre, jasmine.
[21] G.T. Rein, W. Jahn, J. Stern-Gottfried, N.L. Ryder, S. Desanghere,M. Lazaro, F. Mowrer, A. Coles, D. Joyeux, D. Alvear, J.A. Capote,A. Jowsey, and P. Reszka. A priori modelling of fire test one, in thedalmarnock fire tests: Experiments and modelling. 2007.
[22] W. Jahn, G. Rein, and J. Torero. A posteriori modelling of fire test one,in the dalmarnock fire tests: experiments and modelling. 2007.
[23] A.M. Sanad, S. Lamont, A.S. Usmani, and J.M. Rotter. Structuralbehaviour in fire compartment under different heating regimes - part 1(slab thermal gradients). Fire Safety Journal, 35:99–116, 2000.
[24] A.M. Sanad, S. Lamont, A.S. Usmani, and J.M. Rotter. Structuralbehaviour in fire compartment under different heating regimes - part 2(slab mean temperatures). Fire Safety Journal, 35:117–130, 2000.
[25] Behaviour of steel framed structures under fire conditions. Main report,DETR PiT project, 2000.
[26] M. Gillie. The behaviour of steel-framed composite structures in fireconditions. The University of Edinburgh.
202

[27] N. Cameron. The behaviour and design of composite floor systems infire. The University of Edinburgh, 2003.
[28] British Steel plc. The behaviour of multi-storey steel framed buildingsin fire. Swinden Technology Centre, 1999.
[29] Y.C. Wang, T. Lennon, and D.B. Moore. The behaviour of steel framessubject to fire attack. Journal of Constructional Steel Research, 35:291–322, 1995.
[30] M. Gillie, A. Usmani, and M. Rotter. A structural analysis of the firstcardington test. Journal of Constructional Steel Research, 57:581–601,2001.
[31] M. Gillie, A. Usmani, and M. Rotter. A structural analysis of the card-ington british steel corner test. Journal of Constructional Steel Research,58:427–442, 2002.
[32] M. Gillie, A. Usmani, M. Rotter, and M. O’Connor. Modelling of heatedcomposite floor slabs with reference to the cardington experiments.
[33] S. Lamont, A.S. Usmani, and M. Gillie. Behaviour of a small compositesteel frame structure in a ”long-cool” and a ”short-hot” fire. Fire SafetyJournal, 39:327–357, 2004.
[34] J.M. Rotter and A.S. Usmani. Thermal effects. Proceedings of the 1stInternational workshop, Structures in Fire, 2000.
[35] A.S. Usmani, J.M. Rotter, S. Lamont, A.M. Sanad, and M. Gillie.
[36] A.S. Usmani and N.J.K Cameron. Limit capacity of laterally restrainedreinforced concrete floor slabs in fire. Cement and Concrete Composites,26:127–140, 2004.
[37] En 1994-1-2:2003 design of composite steel and concrete structures -part 1-2: General rules - structural fire design.
[38] En 1992-1-2:2002 eurocode 2: Design of concrete structures - part 1-2:Structural fire design.
[39] G.V. Hadjisophocleus, N. Benichou, and A.S. Tamim. Literature reviewof performanced based fire codes and design environment. Journal ofFire Protection Engineering, 9:12, 1998.
203

[40] Performance based design of steel structures in fire, work in progress1st draft. Structural Engineering for Fire Resistance, Short course atTianjin University of Technology, 2002.
[41] A. Irfanoglu. Structural design under seismic risk using multiple perfor-mance objectives. PhD thesis, CalTEC: California, 2000.
[42] D. Beller, G. Foliente, and B. Meacham. Qualitative versus quantita-tive aspects of performance based design regulations. 4th Internationalconference on performance based codes and fire severity design methods,2002.
[43] M.H. Faber, O. Kubler, M. Fontana, and M. Knobloch. Failure conse-quences and reliability acceptance criteria for exceptional building struc-tures - a study taking basis in the failure of the world trade centre twintowers. Institute of Structural Engineering, Swiss Federal institute ofTechnology.
[44] En 1993-1-2:2005 eurocode 3: Design of steel structures - part 1-2: Gen-eral rules - structural fire design.
[45] Y.-S. Lin. Estimations of the probability of fire occurrences in buildings.Fire Safety Journal, 40:728–735, 2005.
[46] G. Ramachandran. The economics of fire protection. 1998, london: Eand fn spon.
[47] P.G. Holborn, P.F. Nolana, and J. Golt. An analysis of fire sizes, firegrowth rates and times between events using data from fire investiga-tions. Fire Safety Journal, 39:481–524, 2004.
[48] K. Helm. Statistical information, twelve month analysis of 250 000 -plus fires. Fire prevention and Fire Engineers Journal, April 2005.
[49] S. Hostikka and O. Keski-Rahkonen. Probabilistic simulation of firescenarios. Nuclear Engineering and Design, 224:301–311, 2003.
[50] D.J. Rasbash, G. Ramachandran, B. Kandola, J.M. Watts, and M. Law.Evaluation of fire safety. Chichester: John Wiley and Sons, Ltd, 2004.
[51] M.E. Harr. Reliability-based design in civil engineering. McGraw Hill,Inc, 1987.
[52] G.N. Berlin. Probability models in fire protection engineering. The SF-PE Handbook of Fire Protection Engineering, pages 4–43 – 4–52, 1988.
204

[53] J. Van Bowen Jr. Reliability. The SFPE Handbook fo Fire ProtectionEngineering, pages 4–34 – 4–42, 1988.
[54] T. Cheung. A note on knights concepts of ”risk” and ”uncertainty”.
[55] B. M. Ayyub. Uncertainty modelling and analysis in civil engineering.CRC Press LLC., 1998.
[56] D. Diamantidis. Risk acceptance criteria: A review. note prepared forthe joint committee on structural safety. 2004.
[57] C.G. Bailey and D.B. Moore. The structural behaviour of steel frameswith composite floor slabs sunject to fire: Part 1: Theory. The StructuralEngineer, 78/11:19–27, 2000.
[58] C.G. Bailey and D.B. Moore. The structural behaviour of steel frameswith composite slabs subject to fire: Part 2: Design. The StructuralEngineer, 78/11:28–33, 2000.
[59] N.J.K. Cameron and A.S. Usmani. A new design method to determinethe membrane capacity of laterally restrained composite floor slabs infire part 1: Theory and method. The Structural Engineer, 83/19:28–33,2005.
[60] N.J.K. Cameron and A.S. Usmani. A new design method to determinethe membrane capacity of laterally restrained composite floor slabs infire part 2: Validation. The Structural Engineer, 83/19:34–39, 2005.
[61] M. S. Black. Ultimate strength study of two-way concrete slabs. Journalof the Structural Division of the ASCE, page 13, jan 1975.
[62] A.T. Salami. Equation for predicting the strength of fully-clamped two-way reinforced concrete slabs. Procedures of the Institution of CivilEngineers Structures and Buildings, 104:101–107, 1994.
[63] M. Gillie, A. Usmani, and M. Rotter. Bending and membrane action inconcrete slabs. Fire and Materials, 28:139–157, 2004.
[64] G.M. Newman, J.T. Robinson, and C.G. Bailey. Fire safe design: Anew approach to multi-storey steel-framed buildings. Fire and SteelConstruction, 2000.
[65] S. Foster, M. Chladna, C. Hsieh, I. Burgess, and R. Plank. Thermaland structural behaviour of a full-scale composite building subject to asevere compartment fire. Fire Safety Journal, pages 183–199, 2007.
205

[66] F.K. Kong and R.H. Evans. Reinforced and pre-stressed concrete 3rdedition. Van Nostrand Reinhold (UK) Co. Ltd., 1987.
[67] G. Kennedy and C. Goodchild. Practical yield line design. Reinforcedconcrete council, 2003.
[68] S.E. Quiel and M.E.M. Garlock. A performance-based design approachfor steel perimeter columns subject to fire. Fourth International Work-shop Structures in Fire, 2006.
[69] M.E.M. Garlock and S.E. Quiel. Combined axial load and momentcapacity of fire-exposed beam-columns with thermal gradients. FourthInternational Workshop Structures in Fire, 2006.
[70] Chung Y.C. and Torero J.L. Usmani, A.S. How did the wtc towerscollapse? a new theory. Fire Safety journal, 38:501–533, 2003.
[71] A.S. Usmani. Stability of the world trade center twin towers structuralframe in multiple floor fires. Journal of Engineering Mechanics, pages654–657, 2005.
[72] G.R. Flint. Fire induced collapse of tall buildings. The University ofEdinburgh, 2005.
[73] A.S. Usmani, C. Roben, L. Johnston, G. Flint, and A. Jowsey. Tall build-ing collpase mechanisms initiated by fire. Fourth International WorkshopStructures in Fire, 2006.
[74] D.D. Drysdale. An Introduction to Fire Dynamics, Second Edition. JohnWiley and Sons, Ltd., 1998.
[75] Pd 7974-1: 2003 application of fire safety engineering principles to thedesign of buildings - part 1: Initiation and development of fire withinthe enclosure of origin.
[76] En 1994-1-1:1994 eurocode 4: Design of composite steel and concretestructures - part 1-1: General rules and rules for buildings.
[77] R.D. Ziemian and W. McGuire. Mastan 2. 2000.
[78] S.J. Hicks, R.M. Lawson, J.W. Rackham, and P. Fordham. Comparativestructure cost of modern commercial buildings (second edition). TheSteel Construction Institute, 2004.
[79] Supporting the commercial decision. Corus Construction and Industrial.
206