Embed Size (px)
DESCRIPTION
IBN technologies provides complete Risk & Quantitative Analysis services to their client. Our team consist of highly professionals with more than 8 years of exp - PowerPoint PPT Presentation
Citation preview

Quantitative Research & Analysis Service
IBN TECHNOLOGIES LIMITED
www.ibntech.com © 2015 IBN Technologies Limited. All rights reserved.

ISO 9001:2008 Company
Overview
Quantitative Research & Analysis Services
In Finance Market, the volume of data available for analysis has
increased dramatically. Yet too often data is not fully leveraged
as an investment asset because of trim analytical staff and
information overload. IBN Quantitative Research services can
assist you by applying advanced statistical technique to help
you get more from your data, this will help you in making better
Investment Decisions. IBN Quantitative Research team works
closely with Fund Managers/Fund Research Team/Onshore
Analysts and assists them in:
Addressing your Investment Concern
DECISIO
NS
Performance Analysis
Statistical Analysis of Returns
Risk/Return Analysis
Alpha-Beta Analysis
Correlation & Sensitivity Analysis
Volatility Analysis
VAR Analysis
Global Risk Analysis
Momentum Analysis
Portfolio Optimization
Advanced Quantitative Research
o Artificial Intelligence
o Clustering
o Modeling
o Optimization
ISO 9001:2008 Company
Overview Conti..
Quantitative Research & Analysis Services
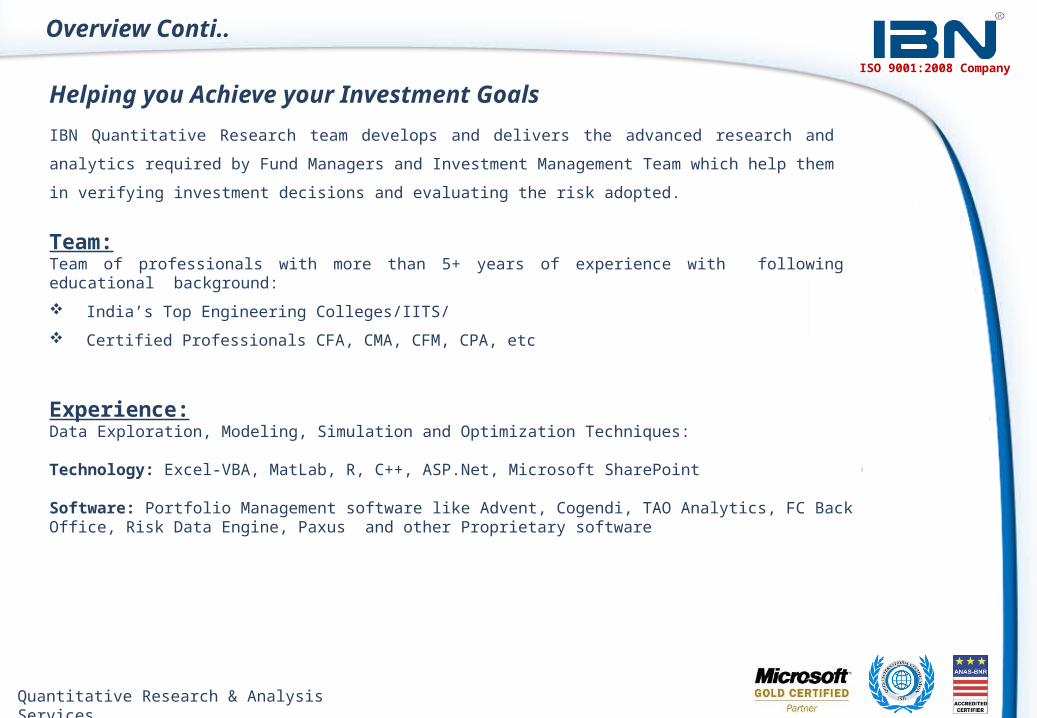
IBN Quantitative Research team develops and delivers the advanced research and analytics
required by Fund Managers and Investment Management Team which help them in verifying
investment decisions and evaluating the risk adopted.
Helping you Achieve your Investment Goals
Team:Team of professionals with more than 5+ years of experience with following educational background:
India’s Top Engineering Colleges/IITS/
Certified Professionals CFA, CMA, CFM, CPA, etc
Experience:Data Exploration, Modeling, Simulation and Optimization Techniques: Technology: Excel-VBA, MatLab, R, C++, ASP.Net, Microsoft SharePoint
Software: Portfolio Management software like Advent, Cogendi, TAO Analytics, FC Back Office, Risk Data Engine, Paxus and other Proprietary software

ISO 9001:2008 Company
Process Flow
Quantitative Research & Analysis Services
• IBN Data Team tracks & report data as per requirement• Data tracked in excel or client’s database
IBN Data Team
IBN’s Quantitative Team develops and delivers Models independently on subject matter
Models delivered as per Client’s requirement
Requirement & Instructions given by Client for Model
ISO 9001:2008 Company
Quant Solutions to Investment Managers
Quantitative Research & Analysis Services
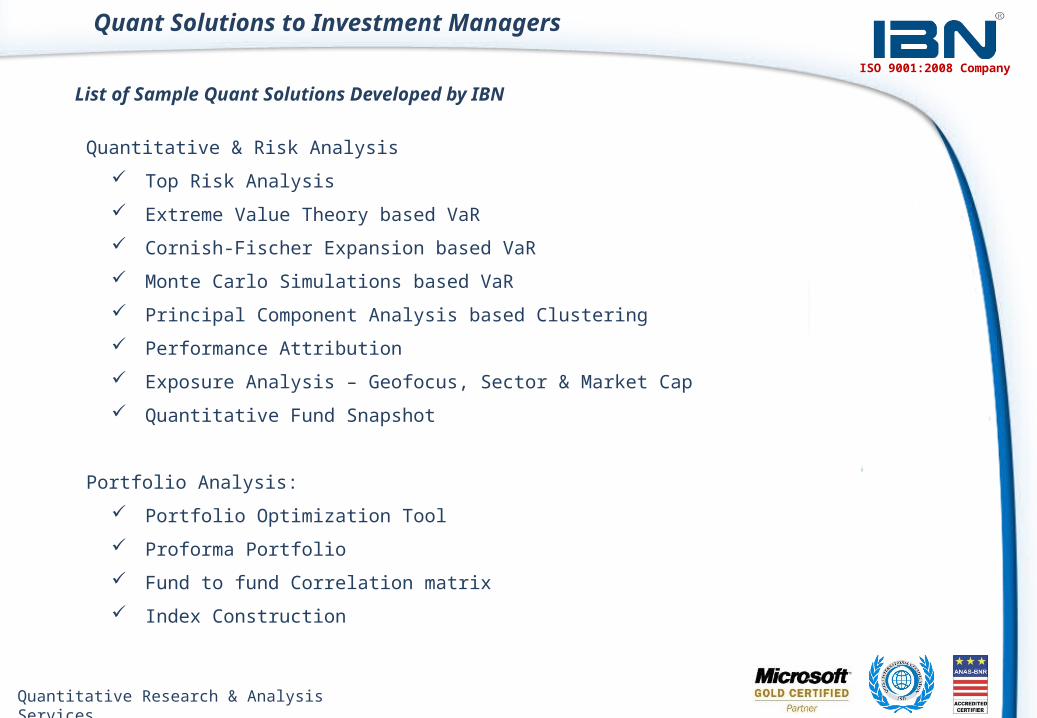
Quantitative & Risk Analysis
Top Risk Analysis
Extreme Value Theory based VaR
Cornish-Fischer Expansion based VaR
Monte Carlo Simulations based VaR
Principal Component Analysis based Clustering
Performance Attribution
Exposure Analysis – Geofocus, Sector & Market Cap
Quantitative Fund Snapshot
Portfolio Analysis:
Portfolio Optimization Tool
Proforma Portfolio
Fund to fund Correlation matrix
Index Construction
List of Sample Quant Solutions Developed by IBN
ISO 9001:2008 Company
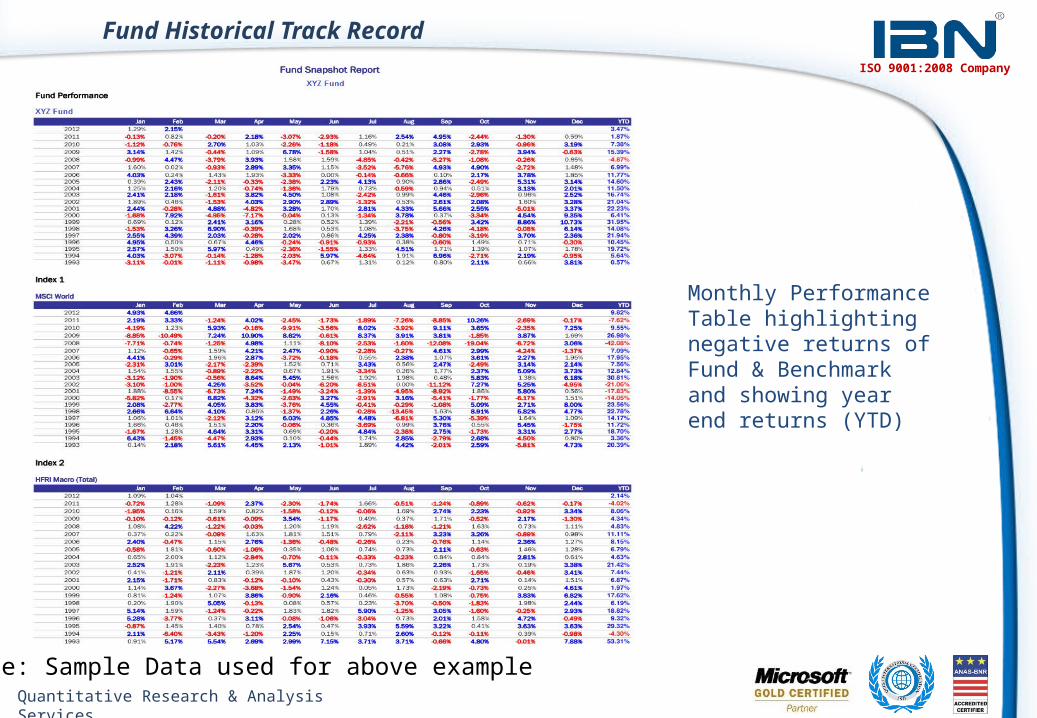
Fund Historical Track Record
Monthly Performance Table highlighting negative returns of Fund & Benchmark and showing year end returns (YTD)
Quantitative Research & Analysis Services
Note: Sample Data used for above example

ISO 9001:2008 Company
Drawdown Analysis
Drawdown Analysis highlighting start of downward returns, its length and recovery period with dates for each drawdown
Quantitative Research & Analysis Services
Note: Sample Data used for above example
ISO 9001:2008 Company
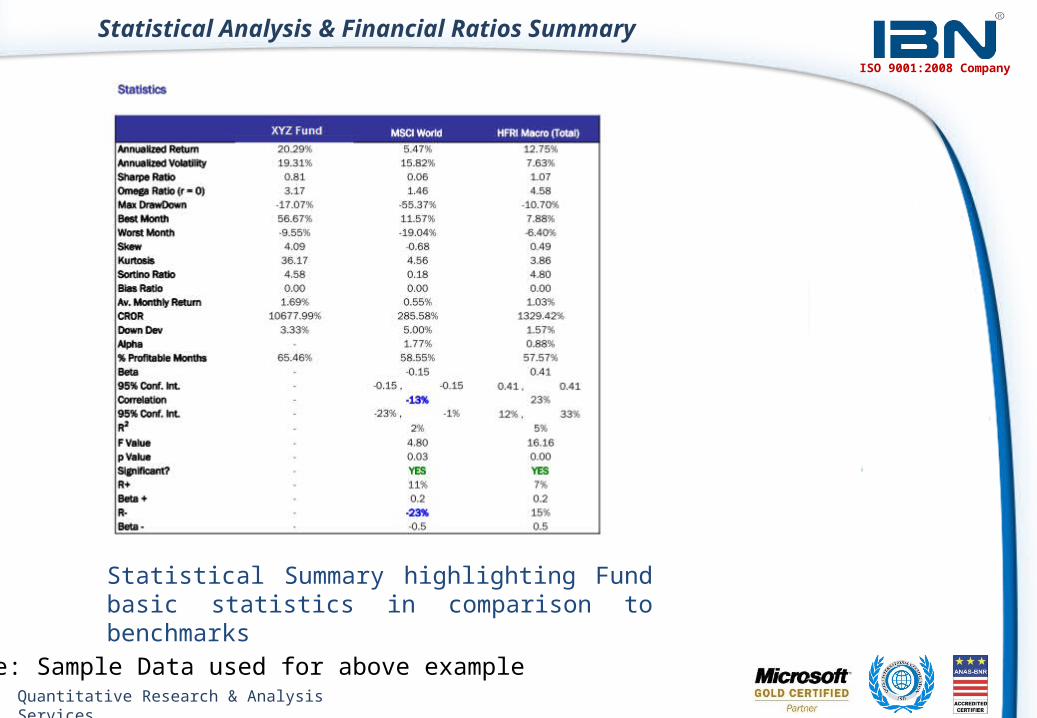
Statistical Analysis & Financial Ratios Summary
Statistical Summary highlighting Fund basic statistics in comparison to benchmarks
Quantitative Research & Analysis Services
Note: Sample Data used for above example
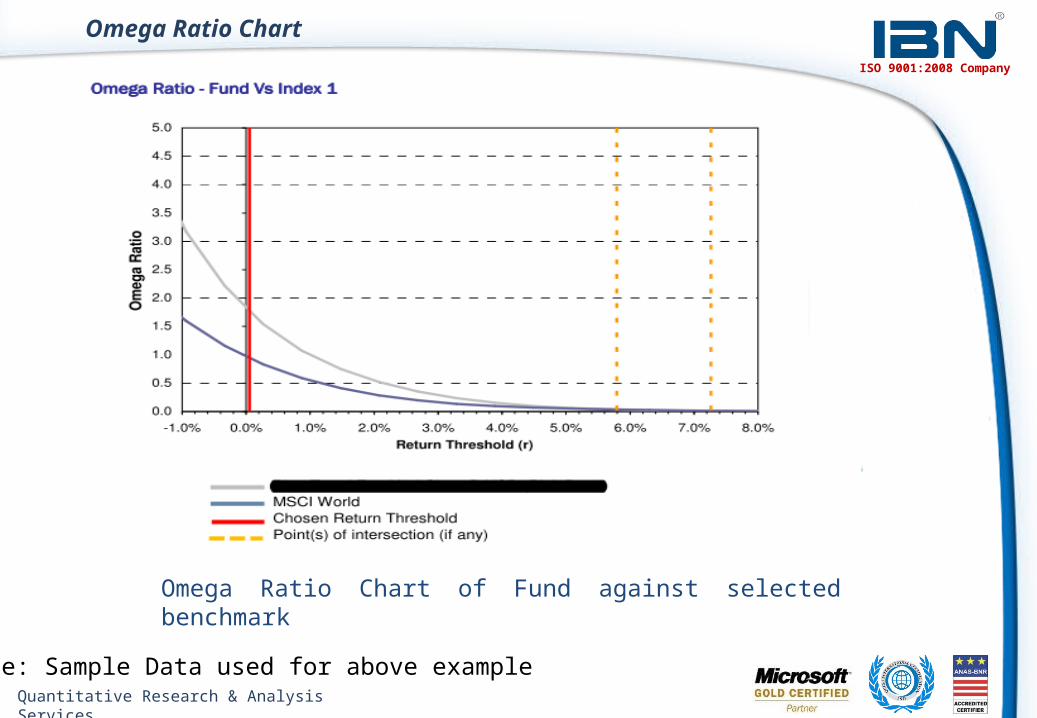
Omega Ratio Chart of Fund against selected benchmark
Quantitative Research & Analysis Services
Note: Sample Data used for above example
Omega Ratio Chart
ISO 9001:2008 Company

ISO 9001:2008 Company
6M Annualized Rolling Return Chart
Annualized 6 Month Rolling Return chart highlighting 6(or selected rolling window) months Rolling Annualized performance in comparison to selected Benchmarks
Quantitative Research & Analysis Services
Note: Sample Data used for above example
ISO 9001:2008 Company
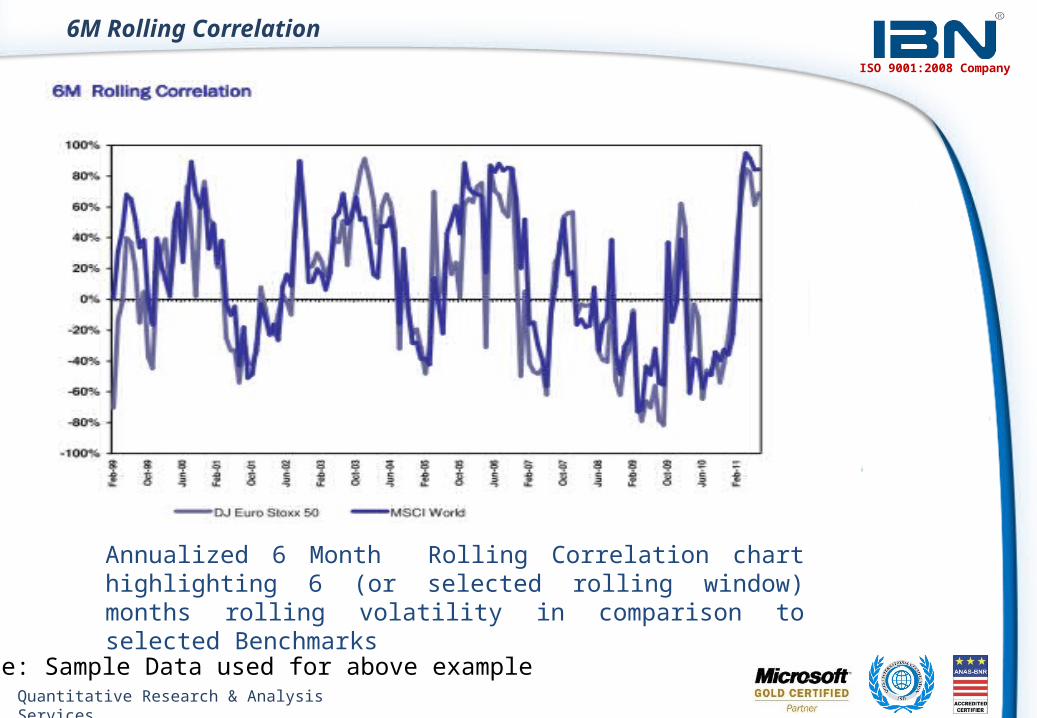
6M Rolling Correlation
Annualized 6 Month Rolling Correlation chart highlighting 6 (or selected rolling window) months rolling volatility in comparison to selected Benchmarks
Quantitative Research & Analysis Services
Note: Sample Data used for above example
ISO 9001:2008 Company
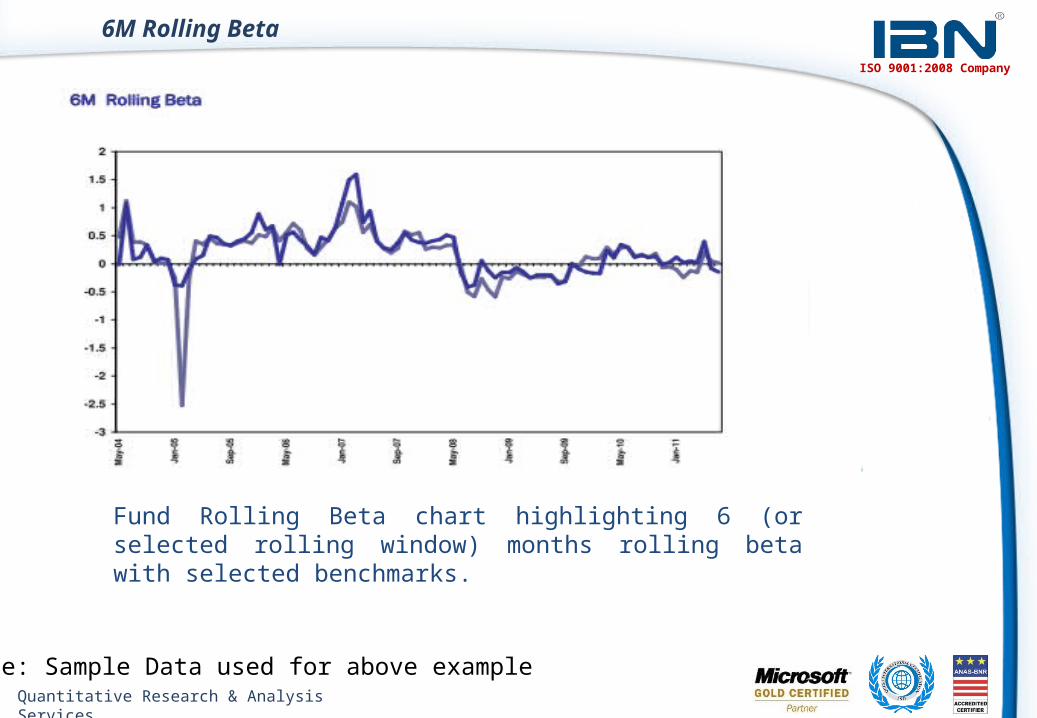
6M Rolling Beta
Fund Rolling Beta chart highlighting 6 (or selected rolling window) months rolling beta with selected benchmarks.
Quantitative Research & Analysis Services
Note: Sample Data used for above example
ISO 9001:2008 Company
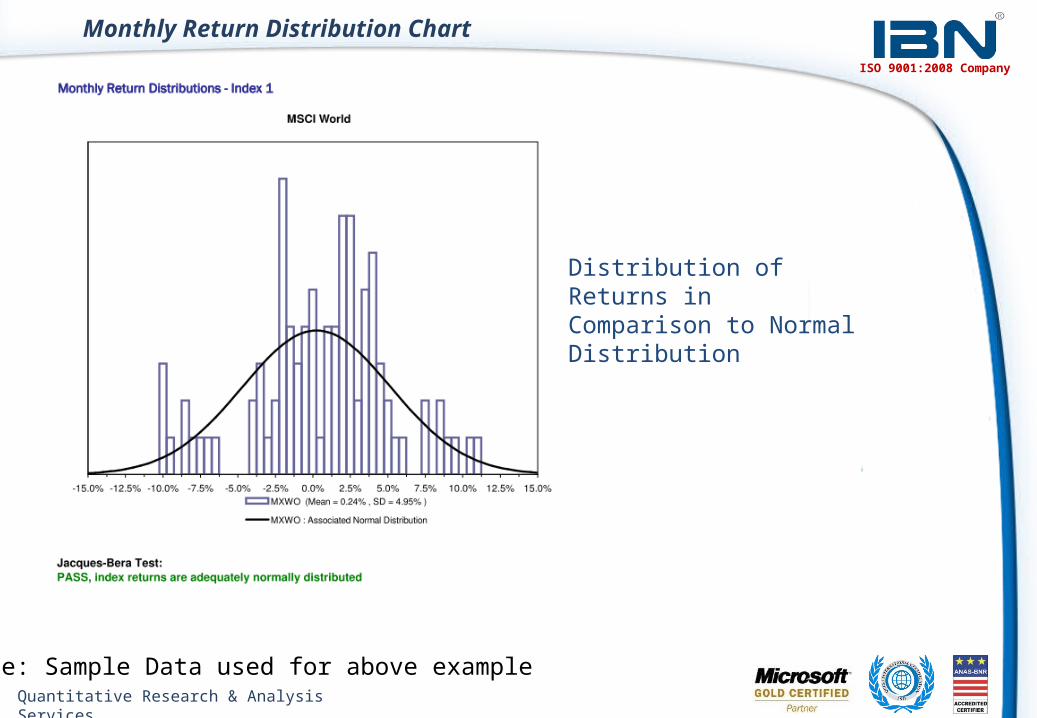
Monthly Return Distribution Chart
Distribution of Returns in Comparison to Normal Distribution
Quantitative Research & Analysis Services
Note: Sample Data used for above example
ISO 9001:2008 Company
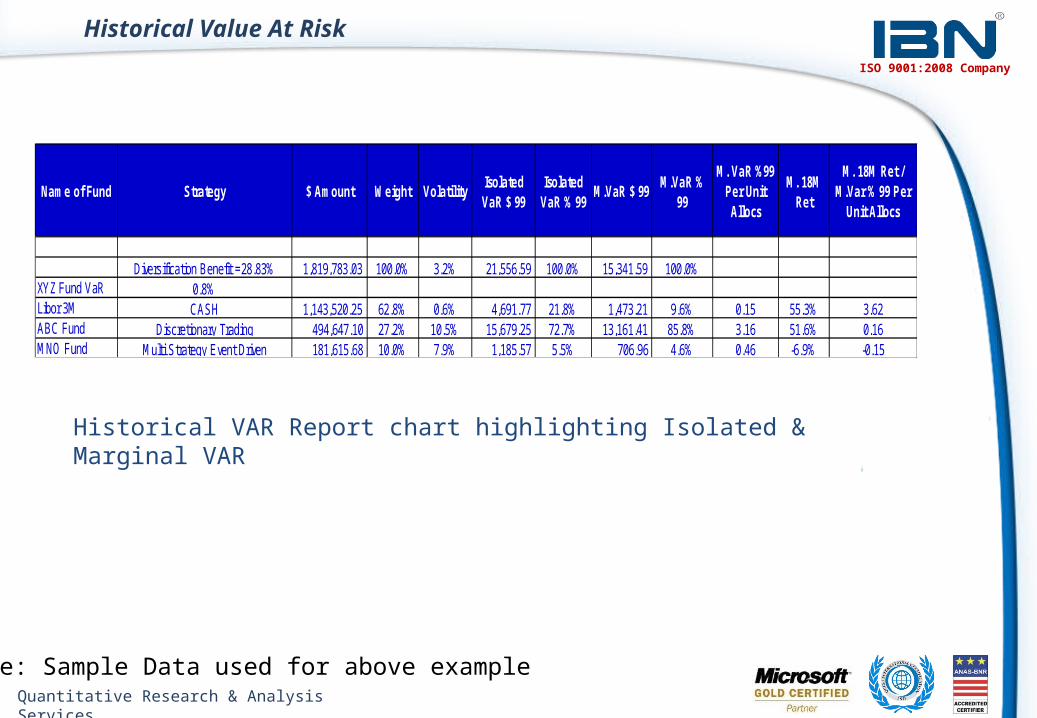
Historical Value At Risk
Historical VAR Report chart highlighting Isolated & Marginal VAR
Quantitative Research & Analysis Services
Name of Fund Strategy $ Amount Weight VolatilityIsolated VaR $ 99
Isolated VaR % 99
M.VaR $ 99M.VaR %
99
M. VaR %99 Per Unit Allocs
M. 18M Ret
M. 18M Ret / M.Var % 99 Per
Unit Allocs
Diversification Benefit =28.83% 1,819,783.03 100.0% 3.2% 21,556.59 100.0% 15,341.59 100.0%XYZ Fund VaR 0.8%Libor 3M CASH 1,143,520.25 62.8% 0.6% 4,691.77 21.8% 1,473.21 9.6% 0.15 55.3% 3.62ABC Fund Discretionary Trading 494,647.10 27.2% 10.5% 15,679.25 72.7% 13,161.41 85.8% 3.16 51.6% 0.16MNO Fund Multi Strategy Event Driven 181,615.68 10.0% 7.9% 1,185.57 5.5% 706.96 4.6% 0.46 -6.9% -0.15
Note: Sample Data used for above example
ISO 9001:2008 Company
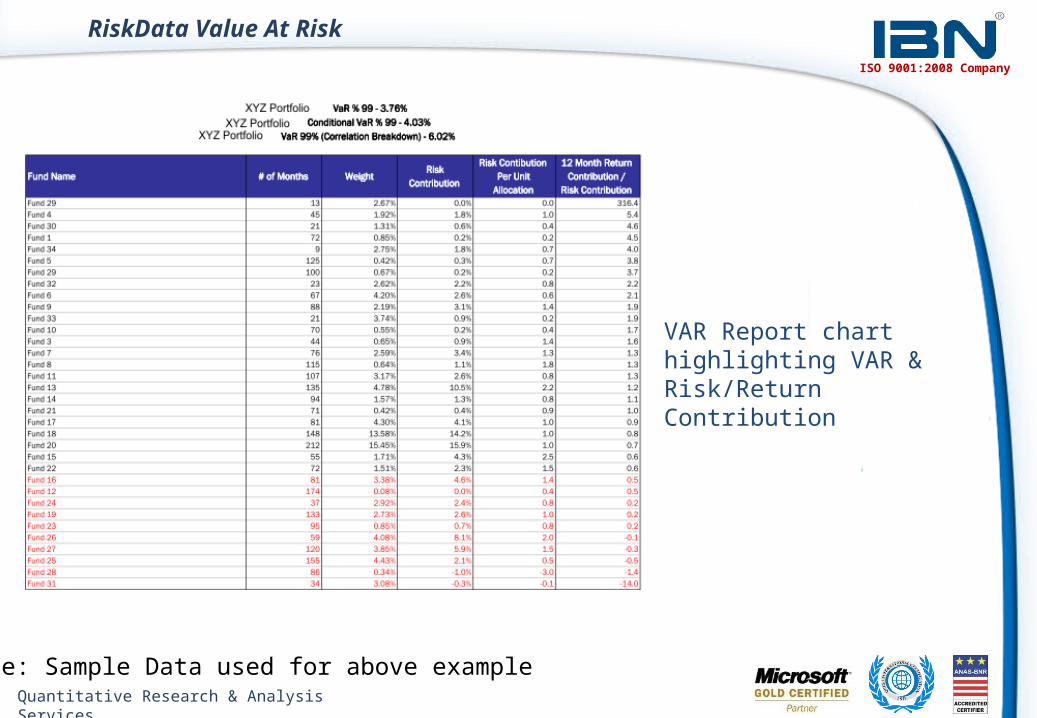
RiskData Value At Risk
VAR Report chart highlighting VAR & Risk/Return Contribution
Quantitative Research & Analysis Services
Note: Sample Data used for above example

ISO 9001:2008 Company
Correlation Matrix Report
Jan-09 to Dec-11
Fund
01
Fund
02
Fund
03
Fund
04
Fund
05
Fund
06
Fund
07
Fund
08
Fund
09
Fund
10
Fund
11
Fund
12
Fund
13
Fund
14
Fund
15
Fund
16
Fund
17
Fund 01 1.00
Fund 02 0.86 1.00
Fund 03 0.15 0.12 1.00
Fund 04 0.64 0.64 0.15 1.00
Fund 05 0.20 0.20 -0.07 0.20 1.00
Fund 06 -0.06 -0.23 0.15 -0.16 -0.08 1.00
Fund 07 0.37 0.38 -0.09 0.46 0.26 0.14 1.00
Fund 08 0.40 0.42 0.20 0.09 0.60 0.02 0.29 1.00
Fund 09 0.69 0.73 0.15 0.28 0.01 -0.03 0.27 -0.01 1.00
Fund 10 0.58 0.70 0.24 0.59 0.17 0.06 0.63 0.43 0.41 1.00
Fund 11 0.82 0.74 0.20 0.58 0.11 -0.12 0.34 0.38 0.63 0.60 1.00
Fund 12 0.29 0.45 0.11 0.29 -0.04 -0.25 0.23 0.59 0.22 0.43 0.29 1.00
Fund 13 0.67 0.66 0.22 0.50 0.29 -0.36 0.26 0.73 0.51 0.33 0.64 0.59 1.00
Fund 14 0.39 0.29 0.12 0.24 -0.04 0.13 0.16 -0.12 0.42 0.19 0.24 0.41 0.51 1.00
Fund 15 -0.10 0.02 0.05 -0.35 -0.07 -0.09 -0.15 0.14 -0.16 0.06 0.05 0.02 0.06 1.00
Fund 16 0.32 0.28 0.16 0.57 0.07 0.04 0.43 0.56 0.08 0.40 0.27 0.45 0.54 0.28 -0.16 1.00
Fund 17 0.63 0.65 -0.15 0.60 0.19 0.19 0.59 0.26 0.39 0.79 0.66 0.22 0.17 0.01 -0.64 0.34 1.00
XYZ PortfolioCorrel Matrix
Quantitative Research & Analysis Services
Note: Sample Data used for above example
ISO 9001:2008 Company
Contact Us
Quantitative Research & Analysis Services
USAIBN Technologies (US) LLC
108 West 13th Street, Wilmington, Delaware 19801
UK – LondonIBN Technologies Limited (Reg – FC031335)26 Barclay Road, Croydon, Surrey CR0 1JN
Global Delivery Center (India)IBN Technologies Limited
CyberNex, 4th Floor, Shankar Sheth Road, Swargate, Pune, Maharashtra 411037, India.T : +91 20 24264182/4183 F: +91 20 24264184 E: [email protected]