Embed Size (px)
Citation preview
© Sumpoorna 2012
1
Rising Star– Sutlej Textiles June 8, 2012
Recommendation Buy
Transaction Price Range Rs.145-Rs.162
Target Rs.208
Time horizon 6 months
1-yr stock price movement (NSE)
Snapshot
CMP 154.05
Date 8-June-12
Beta 0.64
52-week High (Rs.) 269.00
52-week Low (Rs.) 126.05
Industry Textiles
FYE March
Adj. EPS (Rs.) 29.06
P/EPS ratio (x) 5.30
Cash EPS (Rs.) 89.7
P/ Cash EPS (x) 1.72
P/ BV ratio (x) 0.61
BV/ Share (Rs.) 252.58
M. Cap/ Sales (x) 0.11
Market Cap (Rs. Cr) 168.25
Dividend yield (%) 0
FV/ share (Rs.) 10
F&O Presence NO
Avg. Daily Trades (Rs. Cr.) 0.09
Bloomberg Ticker SUTJ IN
NSE Ticker SUTLEJTEX
BSE Ticker 532782
Return Comparison vis-à-vis Nifty
Particulars (%) 1m 3m 1yr
Sutlej Textiles & Industries Ltd.
-12.7% -6.4% -32.7%
Nifty 2.1% -5.0% -7.6%
Particulars (Rs. Cr.)
FY12 FY1
Q3 9m 12m
Net Sales 345.7 1,119.4 1,512.5
Net Profit 5.2 18.1 31.7
Cash Profit 22.3 70.0 182.2
Profit (%) 1.5% 1.6% 2.1%
Adj. EPS (Rs.) 4.7 16.6 29.1
Share Holding Pattern
No. of shares: 10,921,908
Promoter holding (%): 43.38
Institutions (%): 33.09
Non-Institutions (%): 23.26
Free Float (%): 36.17
Investment Rationale: The company is one of the leading integrated textile companies in India with a large and
diversified portfolio of domestic and international clients and is well placed to take
advantage of India further progress as a global textile power house. The company retained
cash is always used in expansion, forward integration, product development and
modernization of technology due to this Sutlej Textiles is likely to achieve strong volume-
driven growth in yarn and fabric segments in the coming years.
Technology upgradation fund scheme expired in March 2012 so low cost fund will be
difficult to acquire which would slow down fresh capacity creation. Thus ensuring demand-
supply mismatch is expected to strengthen yarns and apparel prices which can boost the
profitability of the company.
Demand for yarn is large in domestic as well as favorable demographics. Hence due to
growing income and purchasing power and growing organized retailing malls demand is
expected to increase. The company has plans to increase the proportion of the value added
yarns, which is expected to help in increasing the realizations. Sutlej Textiles have abundant
availability of raw material as cotton is procured from indigenously and Man Made Fibre is
sourced from Grasim and Reliance Industries. Also for the Fabric division the main raw
material are manufactured in house.
During Fiscal year ended March 31, 2012 (‘FY2011-12’ or ‘FY12’) the net profit declined
72.25 percent to Rs.31.73 crore as against Rs.114.34 crore in FY11. Further, the sales
declined 2.77 percent to Rs.1,512.50 crore in FY12 as against Rs.1,581.65 crore in FY12.
The company’s share is quoted at an attractive valuation of ‘Price/Book value’ of 0.61 times,
‘Price/Cash EPS’ of 1.72 times, and Market Cap/ Sales of 1.11 times. The valuations are
quite attractive considering Sutlej Textiles is an integrated textile player, having presence
across value chain, extending from yarns to fabrics to garments to home textile along with a
strong customer base.
Thus, aided by modernization and upgradation of plants, and healthy consumption
demand (domestic and global) going forward, we strongly recommend a ‘BUY’ for the
company’s stock.
Business Outlook:
Strength: o A strong R&D team enables new product development as per the ongoing
trend and customer requirement. o Good reputation in domestic as well as the international markets. o Abundant availability of raw material o Flexible business model o Wide marketing network
Risks:
o Risk of rising material prices and margin pressures in the textile industry
o Low entry barriers because lot of competition
o Weakness in yarn prices
o Exchange rate volatility
o Competitive threat other low‐cost manufacturing countries like Korea,
Taiwan, Bangladesh, SriLanka and Vietnam
o Fluctuations in Sales and profit
o Limited ability to pass on increase in prices to customers.
*Annualized Investment rating scale: Buy (>15% returns); Add (5% <15% returns); Sell (<-5%returns)
120
170
220
270

© Sumpoorna 2012
2
Rising Star– Sutlej Textiles June 8, 2012
Business:
Sutlej Textiles & Industries Limited (“Sutlej Textiles” or “The Company”) manufactures value-added synthetic and blended dyed spun
yarn and is also one of the more prominent manufacturers of cotton and cotton blended dyed and mélange yarn. Also, the company is
amongst the few exclusive spinners in India for specialty yarns such as modal, lyocell, and tencel. Further, the company also
manufactures fabrics, ready-made garments, and home textiles Sutlej Textiles have a strong domestic & international clientele. The
company has one manufacturing unit in Rajasthan and Jammu & Kashmir and three in Gujarat. It has two textile mills, one fabric unit, one
garments unit and home textile unit. The installed capacities consisted of 2,53000 spindles, 60 looms along with a fabric processing
capacity of 20 million mtrs/annum and garmenting capacity of 16 lakh/annum.
Legal History & Structure:
Sutlej Textile and Industries Ltd. was incorporated on June 22, 2005. The company was formed by merging the demerged textile division
of Sutlej Industries Limited and Damanganga Processors Limited into itself. It is the flagship textile company of the K K Birla group,
which is present in fertilizer, engineering, textiles, sugar, tea, coffee, food products, media, information technology, bio‐technology and
shipping. The Company operates in all stages of textiles production. Its production facilities are vertically integrated from spinning and
weaving to dyeing and finishing to making apparel. Group Companies: Chambal Fertilizers and Chemicals Ltd., Texmaco Ltd., Upper Ganges Sugar & Industries Ltd., Gobind Sugar
Mills Ltd, Zuari Industries Ltd., The Hindustan Times Ltd, The Oudh Sugar Mills Ltd.
Brand Association: The company has introduced supported by the well known international brands like : o Modal from Lenzing o Lycra from Invista o Tencel from Lenzing o Esfrom from Saehan o Coolmax from Invista o Low Pill PSF from Far Eastern Textile Ltd.
Sutlej Textiles Integrated Value chain:
(Source: Company)
Sutlej Textiles had added around 44,898 spindles during the past three years (FY09-FY11). The table below gives the details of
the installed capacities across product lines as on March 31, 2011.
Units Location Products Installed Capacities
Rajasthan Textile Mills Bhawanimandi(Rajasthan) Cotton Yarn and Manmade fiber yarn
82,384 spindles 336 rotors
Chenab Textile Mills Kathua, Jammu & Kashmir Cotton Yarn and Manmade fiber yarn
1,70,616 spindles
Damanganga Fabrics Daheli, Gujrat Fabrics Processed Fabrics 20 Million meters per annum
Damanganga Garments Daheli, Gujrat Garments 1.6 million trousers per annum
Damanganga Home Textiles
Daheli, Gujrat Home textile furnishing 2 million meter per annum ( 24 shuttle less looms)
Fabric 1 Kg Yarn-0.95 Kg Fabric-1kg/3m Garments
(trousers) -
1.3/1 trousers
Garments of large
Brands-
1.3m/1 trousers
Rs.100 Rs.200 Rs.100/m Rs.400-500/pc Rs.800-1000/pc

© Sumpoorna 2012
3
Rising Star– Sutlej Textiles June 8, 2012
Management’s Growth Path:
Mission: The Company believes in an inspiration that make, to challenge the limits and overcome them. It also believe that, as
time changes, one must evolve in thinking. Each accomplishment marks a new beginning and inspires it to focus on tomorrow
in terms of new possibilities. Cutting edge technologies that will cater to the interests of the customers and investors.
Be innovative not only to invent new technology but also to fulfill the ever- changing needs of society and environment.
Vision: Sights on becoming a Global textile frontrunner, providing end to end solutions to the textile industry, from yarn to
garment. Thereby aim to create maximum value for our customer so that we become their choicest partner.
Expansion Plans:
o Sutlej Textiles plans to add 7,104 spindles at the existing plant in Bhawanimandi, Rajasthan. The total capex is expected to
be around Rs.126 crore and would be funded in a debt equity ratio of approximately 3 times.
o Company is on the verge of improving its product mix by enhancing the proportion of value added premium products. It is
producing lycra-based fabrics which enjoy high demand in the Gulf and has also initiated yarn trading to broaden the
product basket.
o It would further invest around Rs.54 crore during FY2011-12 for plant modernization and upgradation (expected to be
completed by FY13) of all the three plants to increase its manufacturing efficiency.
o The Indian yarn industry is expected to add around 10.6 lakh tonnes of yarn capacity during 2011-14 (Source: Centre for
Monitoring Indian Economy), out of this 5.5 lakh tonnes is expected to be added in cotton and blended yarn and 5.1 lakh
tonnes is expected to be added in the man-made yarn industry.
o After continuous rise in yarn prices in the past, the industry is now witnessing a downward trend in yarn prices. We
believe that downward trend in prices to continue in the near term. Lower demand from weaving mills and fall in yarn
prices would lead to the pile-up of yarn inventory made from expensive cotton, which in turn will lead to decrease in the
realization. However Sutlej Textiles being a leader in value-added synthetic and blended dyed spun yarn, we expect that it
will be able to withstand these challenges.
o Sutlej Textiles managed to increase production volumes and entering into newer regions along with growing presence in
domestic market.
Markets: o The company has a marketing network in 60 countries across the world. In India it has sales offices at Bhilwara, Delhi, and
Ludhiana, Mumbai, Tripura and depots at Ahmedabad, Amritsar, Indore, Jammu, Jaipur, Kolkata, Kanpur, Meerut, Panipat,
Patna, Salem, Secunderabad, Surat and Solapur. The company caters to major textile players such as Raymond’s, Harry’s
Collection, Digjam, Marks & Spencer, JC Penney, Next, B.H.S., ASDA, Carrefour, Grasim, Arrow, Arvind, John Miller, etc.
o In the yarns segment, Company commenced exports to Panama, Romania and Taiwan in 2010-11. In the home textiles segment,
Company started exports to Thailand, Mexico, Greece, Malaysia, Singapore and Kuwait. In the garments division, it
launched a premium trousers brand called Club Milano. It received an encouraging response from customers in the U.K. from
brands like Next, Burton etc. and is now looking to access the markets of Italy, France and Germany as well.
o Sutlej Textiles manufacturing facilities are strategically located within Indian regions for easy accessibility and uninterrupted as
well as the cost effective supply of raw material resources. The Company is in close proximity to their markets as well and
produces yarns customized to the needs of its clients.
o Sutlej Textiles have abundant availability of raw material as cotton is procured from indigenously and Man Made Fibre is
sourced from Grasim and Reliance Industries. Also for the Fabric division the main raw material are manufactured in house.
o Sutlej Textiles largely in consolidation phase with a strong focus on maximizing productivity, streamlining overheads and
marketing products to geographies that fetched in the higher realizations.

© Sumpoorna 2012
4
Rising Star– Sutlej Textiles June 8, 2012
Geographic Distribution FY12:
Based on the geographical distribution, the revenues are more skewed towards domestic market, which contributed around 70 percent
of the total revenues for FY12. However given the bleak export market scenario, the contribution of exports is around 30 percent
currently. The volatility seen in the currency movements, Sutlej Textiles is exposed to the foreign currency fluctuation risk. However, the
company currently has a policy to hedge majority of its foreign exchange exposure through forward contracts; therefore this risk to that
extent is mitigated.
Segmental Performance:
Segmental Revenue (Rs. Lakh)
Quarter ended Year ended
Mar'12 Dec'11 Sep'11 June'11 Mar'11 Mar'12 Mar'11
Segment Revenue
Yarn 32,822 34,063 39,596 40,455 42,567 1,45,883 1,51,532
Fabrics and apparels 2,720 2,448 2,879 2,363 2,781 10,316 11,024
Total 35,542 36,511 42,475 42,818 45,348 1,56,199 1,62,556
Less: Inter segment sales 581 635 448 834 378 2,498 2,368
Total 34,961 35,876 42,027 41,984 44,970 1,53,701 1,60,188
Segment PBIT
Yarn 1,829 2,278 2,343 2,952 5,548 9,649 19,745
Fabrics and apparels -95 -261 -126 -47 6 -520 -478
Total 1,734 2,017 2,217 2,905 5,554 9,129 19,267
Less: Finance cost 1,720 1,563 1,646 1,753 1,818 6,966 5,722
Add: Unallocable Income 743 322 252 454 387 1,797 1,236
Total PBT 757 776 823 1,606 4,123 3,960 14,781
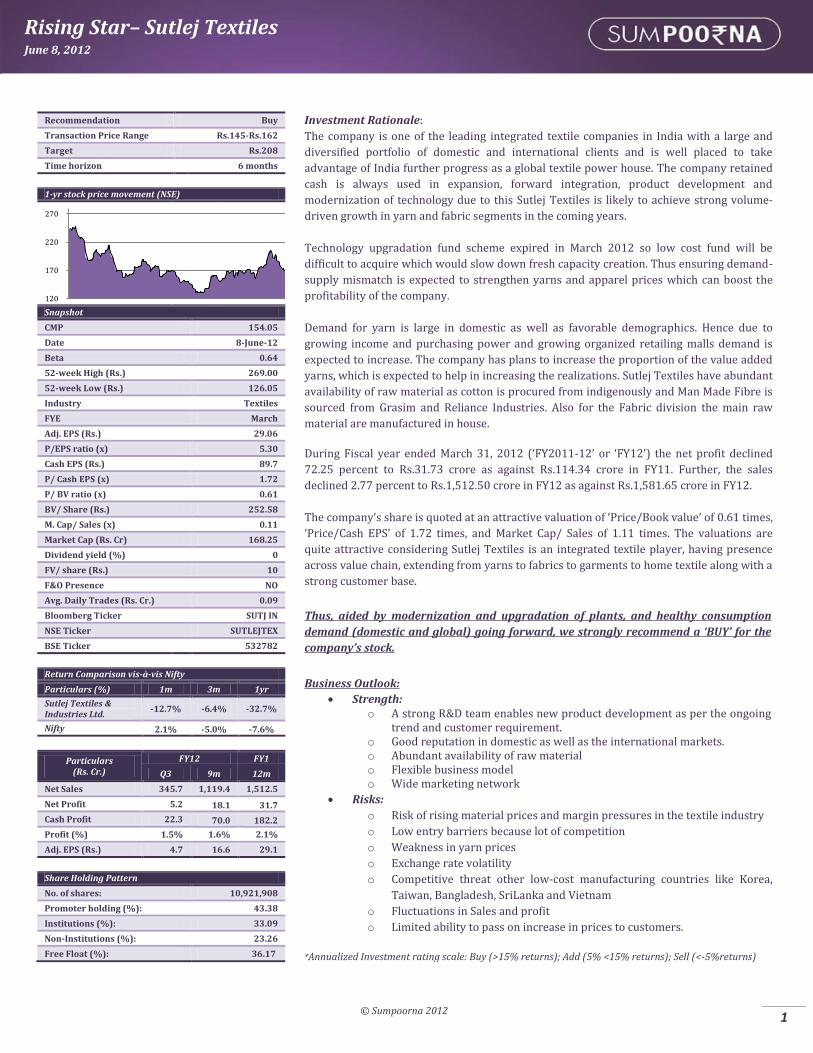
Net profit of Sutlej Textiles and Industries declined 90.19 percent to Rs.5.16 crore in the quarter ended March 2012 as against Rs.52.59
crore during the previous quarter ended March 2011. Sales declined 20.14 percent to Rs.345.74 crore in the quarter ended March 2012
as against Rs.432.92 crore during the previous quarter ended March 2011.
Domestic70%
Export30%

© Sumpoorna 2012
5
Rising Star– Sutlej Textiles June 8, 2012
Contribution to Top Line (FY12):
Contribution to Yarn (FY12):
The business of the Sutlej primarily consists of two business segments namely Yarn (comprising of Cotton and Man Made Fibres Yarn)
and Fabrics & Apparels (comprising woven of worsted/synthetic staple yarn, fabric processing, home furnishing and garments). The yarn
division was the prime contributor to the total sales at 93 percent in FY12 and the remaining was contributed by fabric & apparel
division. In the addition to the manufacturing of yarn, Sutlej also manufactures a variety of fabrics (mainly used for suiting and trousers),
manufactures trousers (primarily for exports under the brand name ‘Club Milano’) and has presence in home textiles. Under home
textiles, the product range includes curtain fabrics, upholstery fabrics, seats and seat covers; mattress covers, bed spreads and covers;
quilts and quilting materials; table linen and kitchen linen, etc.
Where a rupee is spent (Standalone data; FY 12):
Financial Notes (FY11)
At the end of the financial year under review, fixed deposits from the public, shareholders and employees amounted to
Rs.1377.30 lakh; deposits amounting to Rs.0.15 lakh remained unclaimed as on 31st March, 2011.
Land includes Freehold Land of Rs.513.50 lakh (Previous year Rs.478.10 lakh) and Leasehold Land of Rs.273.20 lakh (Previous
year Rs.273.20 lakh). In case of Kathua unit Leasehold Land for Rs.258.37 lakh (Previous year Rs.222.97 lakh) are pending for
registration in the name of the unit.
The asset of Rs.2625.65 lakh (Previous Year Nil) recognized by the Company as ‘MAT credit entitlement’ under ‘Loans and
Advances’ represents that portion of MAT liability, which can be recovered and set off in subsequent years based on the
provisions of Section 115JAA of the Income Tax Act, 1961.
Yarn93%
Fabric & Apparel
7%
Cotton Yarn32%
Synthetic Yarn68%
Raw Materials67%
Employee Cost8%
Depriciation 5%
Other20%
© Sumpoorna 2012
6
Rising Star– Sutlej Textiles June 8, 2012
Financial Performance (Standalone Basis):
Income Statement (Rs. Cr.)
FY 12 FY 11 FY 10 FY 09 Growth Mar'12 Dec’11 Sep '11 June '11 Mar '11
Annual Annual Annual Annual 09 '11 3 months 3 months 3 months 3 months 3 months
Net Sales 1512.60 1581.65 1146.91 851.03 8.71% 345.74 355.97 417.67 413.76 432.92
Growth -4.37% 37.90% 34.77% 7.54%
-2.87% -14.77% 0.94% -4.43% 5.98%
Total Income 1537.01 1615.06 1177.05 873.12 17.47% 361.79 362.06 423.77 424.45 454.09
Growth -4.83% 37.21% 34.81% 9.63%
-0.07% -14.56% -0.16% -6.53% 8.19%
Expenses 1459.31 1342.17 1022.95 817.47 19.13% 319.90 321.32 381.68 373.72 377.19
Growth 8.73% 31.21% 25.14% 14.62%
-0.44% -15.81% 2.13% -0.92% 8.69%
EBITDA 178.27 272.89 154.10 55.65 33.02% 41.89 40.74 42.09 50.73 76.90
Growth -35% 77.09% 176.88% -33.14%
2.82% -3.21% -17.03% -34.03% 576.00%
Int. & Fin. Charges 69.66 57.23 52.87 43.20 32.73% 17.20 15.63 16.46 17.53 18.76
Growth 21.73% 8.25% 23.38% 83.45%
10.04% -5.04% -6.10% -6.56% 44.42%
Depreciation 69.01 67.86 66.91 54.34 10.77% 17.12 17.35 17.40 17.14 16.93
Growth 2% 1.42% 23.14% 1.93%
-1.33% -0.29% 1.52% 1.24% -0.94%
PBT 39.60 147.80 34.32 -41.88 -153.19% 7.57 7.76 8.23 16.06 41.21
Growth -73.21% 330.65% -181.95% -755.79%
-2.45% -5.71% -48.75% -61.03% -3.33%
PAT 31.73 114.34 26.31 -30.15 -222.04% 5.16 6.29 6.63 13.65 52.59
Growth -72.25% 334.53% -187.29% -1093.52%
-17.97% -5.13% -51.43% -74.04% 1230.50%
Cash Profit 31.73 182.20 93.22 24.19 42.55% 22.28 23.64 24.03 30.79 69.52
Growth -83.00% 95.45% 285.36% -57.06% -5.75% -1.62% -21.96% -55.71% 71.15%
*Interim results Common-Size
Statement (% of Net Sales)
FY 12 FY 11 FY 10 FY 09
Cash Flow Statement
(Rs. Cr.)
FY 11 FY 10 FY 09 FY 08
Annual Annual Annual Annual
Annual Annual Annual Annual
Expenses 96.48% 84.9% 89.2% 96.1%
PBT 147.80 34.32 -41.88 6.39
Int. & Fin. Charges 4.60% 3.62% 4.61% 5.08%
Adjustments 0.93 10.71 107.83 -5.08
Depreciation 4.56% 4.29% 5.83% 6.38%
Operating Cash Flow 148.73 45.03 65.95 1.31
Cash Profit 2.09% 11.52% 8.13% 2.84%
Financing Cash Flow -126.33 -28.70 56.24 144.12
EBITDA 11.78% 17.25% 13.44% 6.54%
Investing Cash Flow -23.22 -13.29 -120.92 -145.71
Capital Employed 66.90% 67.47% 89.57% 115.16%
Free Cash Flow 220.26 158.01 -133.63 -28.72
Enterprise Value 51% 67.13% 86.69% 103.33%
Net Cash Flow -0.82 3.03 1.27 -0.28
Market Capitalization 11% 15.88% 10.57% 3.74%
Closing Balance 4.14 4.97 1.93 5.76
Key Ratios
Mar'12 Dec '11 Sep '11 June'11
Balance Sheet ( Rs. Cr.)
FY 12 FY 11 FY 10 FY 09
3 months 3 months 3 months 3 months
Annual Annual Annual Annual
Interest Coverage (x) 2.44 2.61 2.56 2.89
Equity Capital 10.92 10.92 10.92 10.92
PBT Margin (%) 2.17% 2.16% 1.96% 3.83%
Reserves 264.34 240.91 136.52 113.01
PAT Margin (%) 1.48% 1.75% 1.58% 3.25%
Net worth 276.89 251.84 147.44 123.93
ROE (%) 24.67% 30.07% 31.69% 65.25%
Market Capitalization 174.42 251.15 121.23 31.84
ROCE (%) 3.04% 2.66% 2.88% 4.56%
Debt 736.08 815.30 879.30 856.08
EPS (Rs.) 4.73 5.76 6.07 12.50
Payable within 1 yr. N/A 69.01 48.72 32.33
Capital Employed 1011.94 1067.13 1026.74 980.00
Highlights FY 12 FY 11 FY 08 FY 09
Annual Annual Annual Annual
Gross Block N/A 1086.89 1064.19 824.97
Interest Coverage (x) 2.62 3.58 1.65 0.03
Less: Depreciation N/A 481.47 420.84 359.62
PBT Margin (%) 2.58% 9.34% 2.99% -4.92%
Net Block N/A 605.41 643.35 465.35
PAT Margin (%) 2.06% 7.08% 2.24% -3.45%
Capital WIP 29.91 9.26 4.02 217.24
ROE (%) 29.10% 45.40% 17.85% -24.32%
ROCE (%) 17.61% 19.58% 8.69% 0.14%
Investments 1.82 1.65 0.45 0.42
EPS (Rs.) 29.06 104.40 24.09 -27.60
Debtors 112.34 132.65 95.82 71.59
Price/ EPS (x) 5.55 2.20 4.61 0.00
Cash & Bank balance 3.90 4.64 6.75 8.58
CEPS 29.06 166.82 85.35 22.15
Loans & Advances 50.11 46.89 18.90 30.45
Price/ CEPS (x) 1.80 1.38 1.30 1.32
Other Current Assets 34.83 58.05 55.57 57.41
BV/ Share 252.62 230.58 134.99 113.47
Total Current Assets 466.76 584.25 461.19 369.77
Price/ BV (x) 0.63 1.00 0.82 0.26
Total Current Liabilities 403.56 427.06 62.10 55.30
M. Cap/ Sales (x) 0.11 0.16 0.11 0.04
Net Current Assets 63.20 157.19 399.09 314.47
Debt/ Equity (x) 2.65 3.24 5.97 6.91
Dividend Yield (%) 0.00% 3.26% 2.25% 3.43%
Contingent Liabilities N/A 61.98 45.89 27.41
Note: Sutlej Textiles has recommended a dividend of Rs. 5.00 per equity share of Rs. 10 each for the year ended March 31, 2012 (excluding
Dividend Distribution Tax

© Sumpoorna 2012
7
Rising Star– Sutlej Textiles June 8, 2012
Investment rating scale:
Buy (>15% returns); Add (5% <15% returns);
Sell (<-5% returns)
Source: Sumpoorna Research, Company website and
other publicly available data
Document prepared by: Ishu Mann
Nitesh Aggarwala
For further information, please contact Sumpoorna Global Markets & Economics
Research
Phone: +91 120 4505200
Email:
url: www.sumpoornaonline.com
Note:
The information and opinions in this report have been prepared by Sumpoorna and are
subject to change without any notice. Please contact Sumpoorna for more
information on investment decisions. Sumpoorna, its affiliates and clients may have
investment positions in the investment vehicles recommended in this report.
Disclosure Sumpoorna Portfolio Limited and its affiliates (collectively referred to as ‘Sumpoorna’) are a full-service, integrated investment banking, investment management and brokerage and financing group. We along with affiliates are underwriter of securities and participate in virtually all securities trading markets in India. Our research professionals provide important input into our investment banking and other business selection processes. Sumpoorna generally prohibits its analysts, persons reporting to analysts and their dependent family members from maintaining a financial interest in the securities or derivatives of any companies that the analysts cover. Disclaimer This document is solely for the personal information of the recipient, and must not be singularly used as the basis of any investment decision. Nothing in this document should be construed as investment or financial advice. Each recipient of this document should make such investigations as they deem necessary to arrive at an independent evaluation of an investment in the security/ instrument referred to in this document (including the merits and risks involved), and should consult their own advisors to determine the merits and risks of such an investment. This document is being supplied to you solely for your information, and its contents, information or data may not be reproduced, redistributed or passed on, directly or indirectly. This report is not directed or intended for distribution to, or use by, any person or entity who is a citizen or resident of or located in any locality, state, country or other jurisdiction, where such distribution, publication, availability or use would be contrary to law, regulation or which would subject Sumpoorna and affiliates to any registration or licensing requirement within such jurisdiction. The securities described herein may or may not be eligible for sale in all jurisdictions or to certain category of investors. Persons in whose possession this document may come are required to inform themselves of and to observe such restriction. Sumpoorna Portfolio Limited, its affiliates, directors, its proprietary trading and investment businesses (collectively referred to as ‘Sumpoorna’) may, from time to time, make investment decisions that are inconsistent with or contradictory to the recommendations expressed herein. The views contained in this document are those of the analyst, and the company may or may not subscribe to all the views expressed within. The information in this document has been printed on the basis of publicly available information, internal data and other reliable sources believed to be true, but we do not represent that it is accurate or complete and it should not be relied on as such, as this document is for general guidance only. Sumpoorna or any of its affiliates/ group companies shall not be in any way responsible for any loss or damage that may arise to any person from any inadvertent error in the information contained in this report. Sumpoorna has not independently verified all the information contained within this document. Accordingly, we cannot testify, nor make any representation or warranty, express or implied, to the accuracy, contents or data contained within this document. While Sumpoorna endeavors to update on a reasonable basis the information discussed in this material, there may be regulatory, compliance, or other reasons that prevent us from doing so. Neither Sumpoorna, its directors, employees nor its affiliates shall be liable for any loss or damage that may arise from or in connection with the use of this information.