Embed Size (px)
DESCRIPTION
Rimonabant: A new approach to multiple cardiometabolic risk factors. Version 1.1 29 April 2005. RIO programme. RIO: Rimonabant In Overweight/Obesity . (>6600 patients enrolled). RIO - North America: 2-year treatment RIO - Europe: 2-year treatment RIO - Lipids: 1-year treatment - PowerPoint PPT Presentation
Citation preview

Rimonabant: A new approach to multiple cardiometabolic risk factors
Version 1.1
29 April 2005
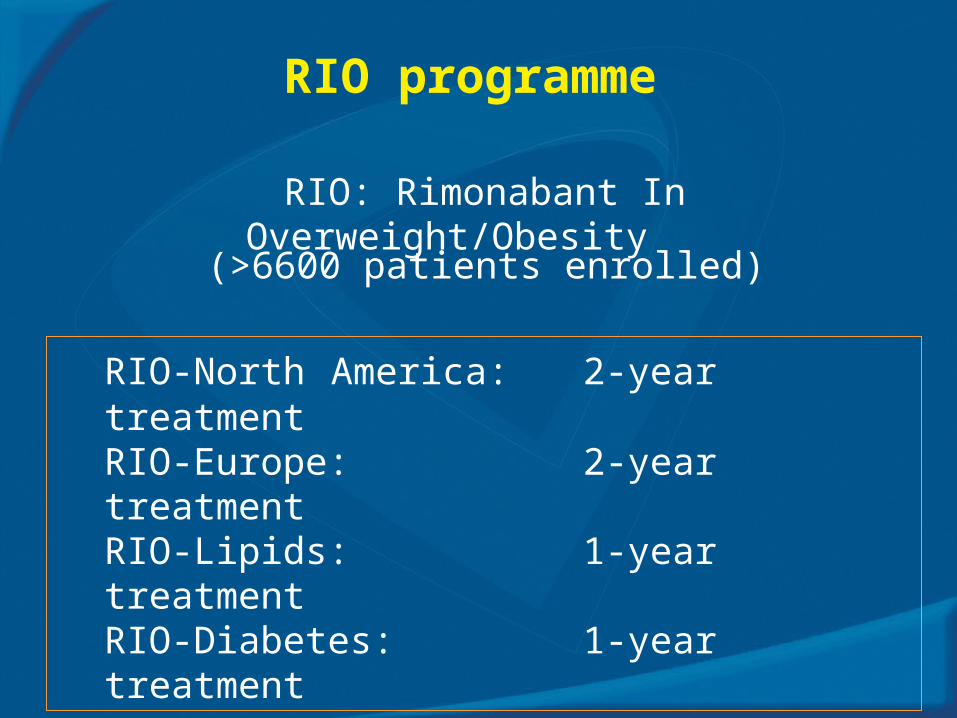
RIO programme
RIO: Rimonabant In Overweight/Obesity
RIO-North America: 2-year treatmentRIO-Europe: 2-year treatmentRIO-Lipids: 1-year treatmentRIO-Diabetes: 1-year treatment
(>6600 patients enrolled)
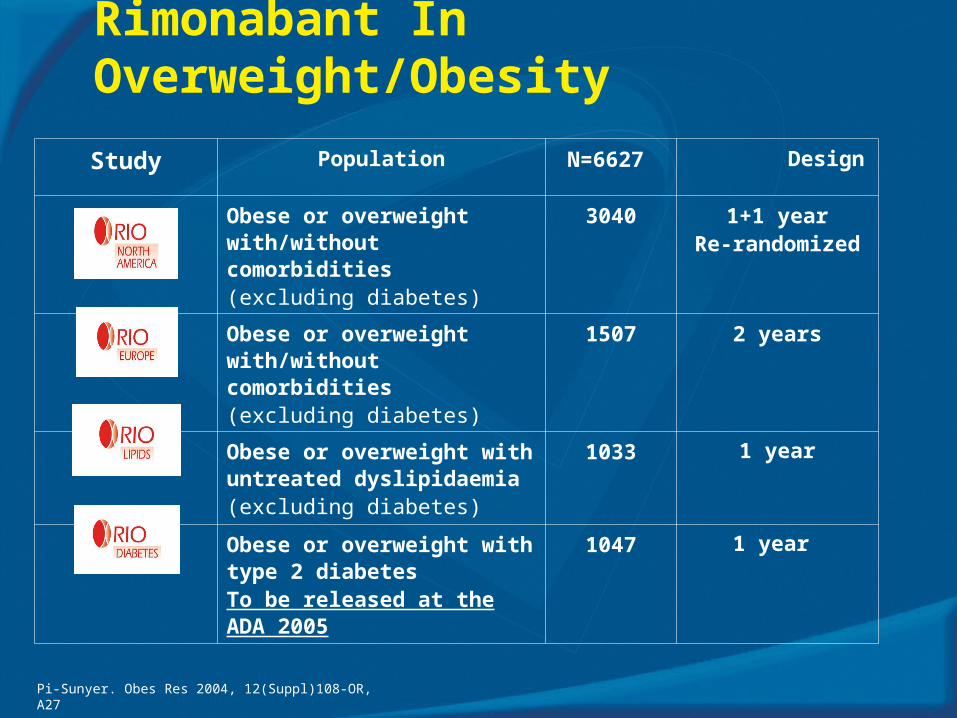
Study Population Design
Obese or overweight with/without comorbidities (excluding diabetes)
3040 1+1 yearRe-randomized
Obese or overweight with/without comorbidities (excluding diabetes)
1507 2 years
Obese or overweight with untreated dyslipidaemia(excluding diabetes)
1033 1 year
Obese or overweight with type 2 diabetesTo be released at the ADA 2005
1047 1 year
Rimonabant In Overweight/Obesity
N=6627
Pi-Sunyer. Obes Res 2004, 12(Suppl)108-OR, A27
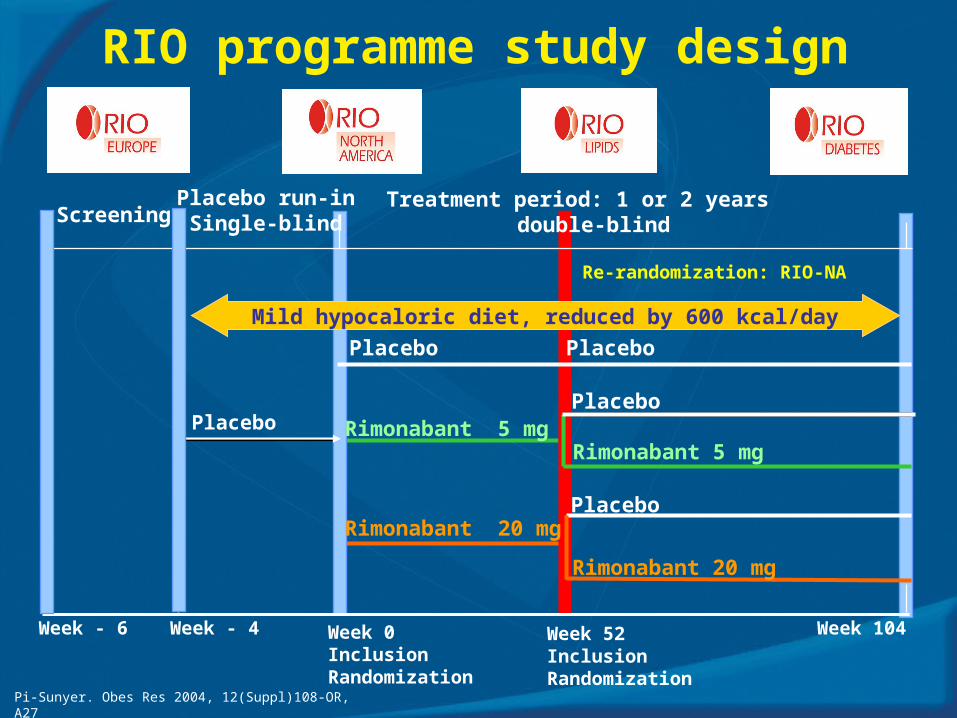
RIO programme study design
Rimonabant 20 mg
Rimonabant 5 mg
Placebo
Placebo
Week 104Week 52 InclusionRandomization
Week 0InclusionRandomization
Week - 4Week - 6
Mild hypocaloric diet, reduced by 600 kcal/day
ScreeningPlacebo run-in
Single-blindTreatment period: 1 or 2 years double-blind
Re-randomization: RIO-NA
Rimonabant 20 mg
Rimonabant 5 mg
Placebo
Placebo
Placebo
Pi-Sunyer. Obes Res 2004, 12(Suppl)108-OR, A27
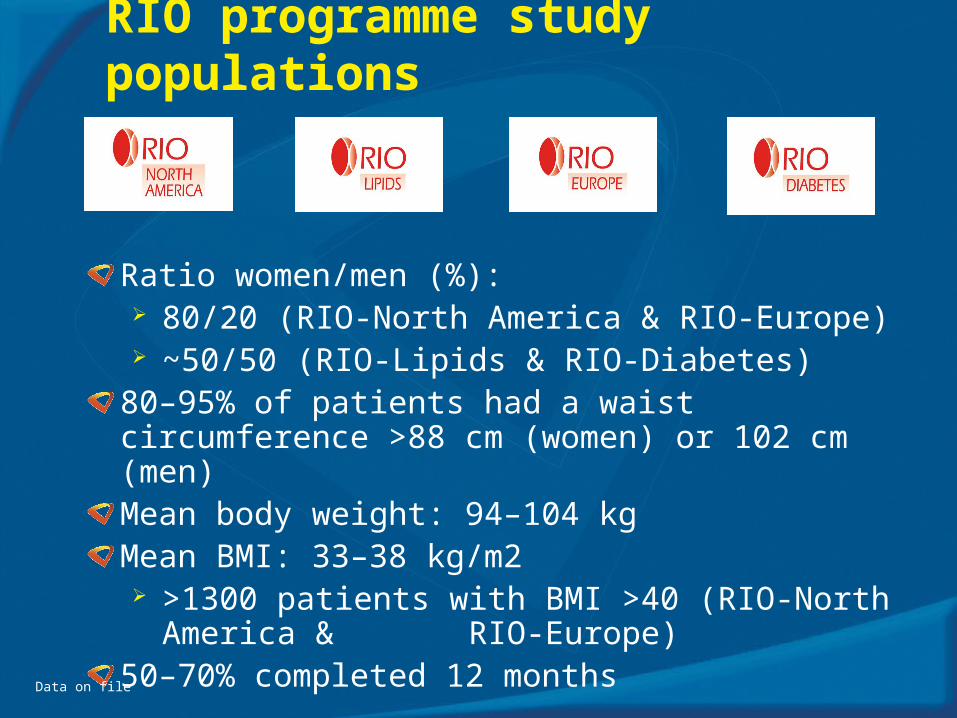
RIO programme study populations
Ratio women/men (%): 80/20 (RIO-North America & RIO-Europe) ~50/50 (RIO-Lipids & RIO-Diabetes)
80–95% of patients had a waist circumference >88 cm (women) or 102 cm (men)Mean body weight: 94–104 kg Mean BMI: 33–38 kg/m2 >1300 patients with BMI >40 (RIO-North America &
RIO-Europe)50–70% completed 12 months
Data on file
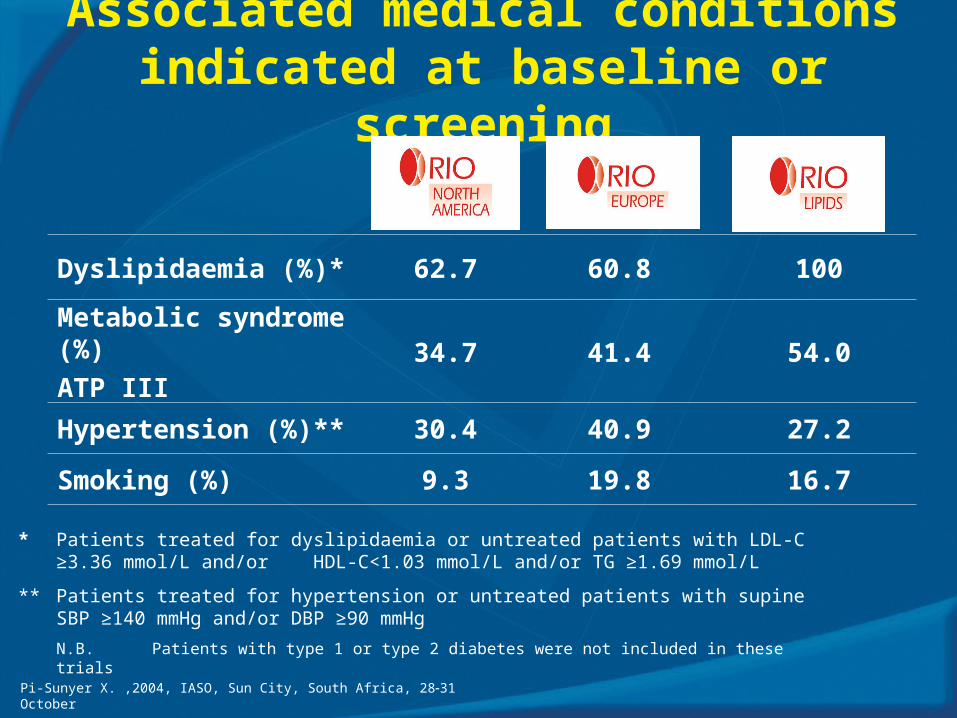
Associated medical conditionsindicated at baseline or screening
Dyslipidaemia (%)* 62.7 60.8 100
Metabolic syndrome (%)
ATP III34.7 41.4 54.0
Hypertension (%)** 30.4 40.9 27.2
Smoking (%) 9.3 19.8 16.7
* Patients treated for dyslipidaemia or untreated patients with LDL-C ≥3.36 mmol/L and/or HDL-C<1.03 mmol/L and/or TG ≥1.69 mmol/L
** Patients treated for hypertension or untreated patients with supine SBP ≥140 mmHg and/or DBP ≥90 mmHg
N.B. Patients with type 1 or type 2 diabetes were not included in these trials
Pi-Sunyer X. ,2004, IASO, Sun City, South Africa, 2831 October

Rimonabant induces consistent changes in:Waist circumference
Weight change
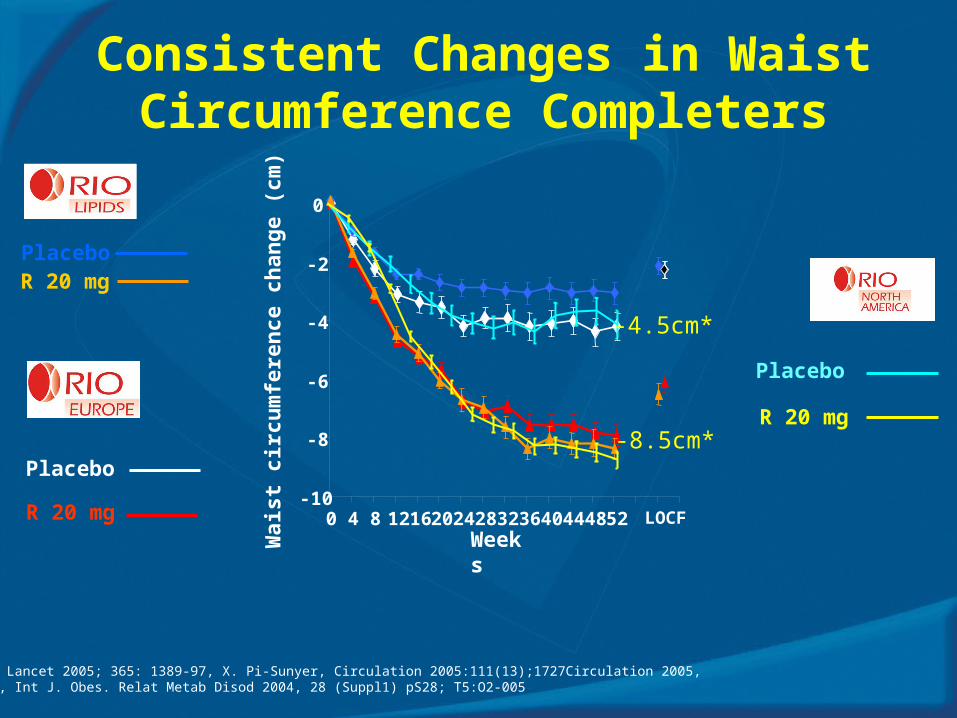
Consistent Changes in Waist Circumference Completers
-10
-8
-6
-4
-2
0
0 4 8 1216202428323640444852 LOCFWai
st c
ircu
mfe
ren
ce c
han
ge
(cm
)
Weeks
Placebo
R 20 mg
PlaceboR 20 mg
Placebo
R 20 mg
-4.5cm*
-8.5cm*
L.Van Gaal, Lancet 2005; 365: 1389-97, X. Pi-Sunyer, Circulation 2005:111(13);1727Circulation 2005, JP. Després, Int J. Obes. Relat Metab Disod 2004, 28 (Suppl1) pS28; T5:O2-005
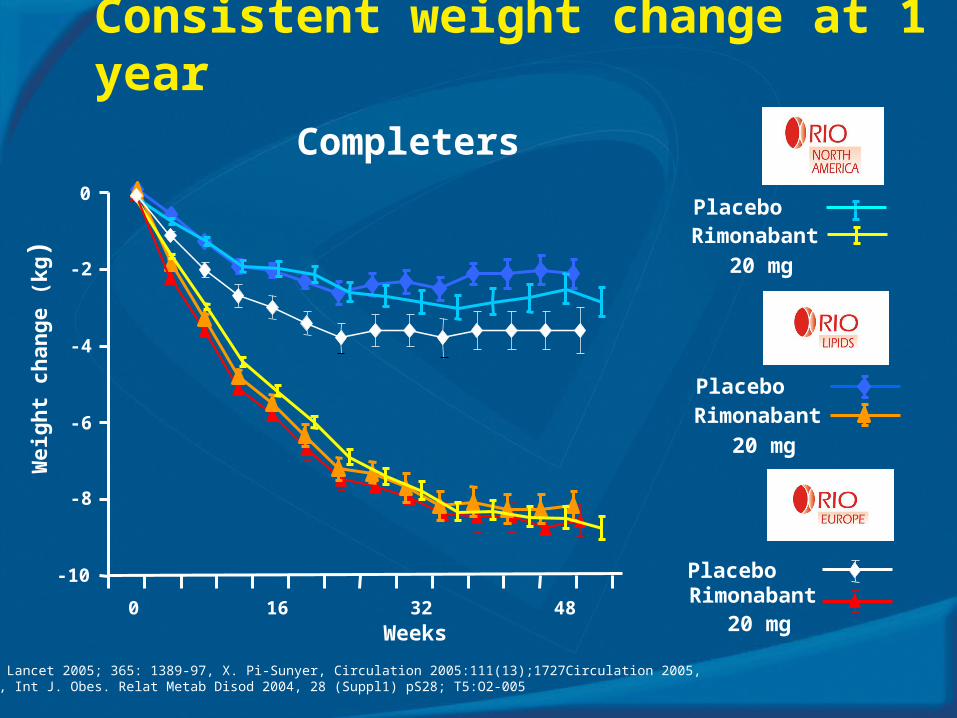
Consistent weight change at 1 year
Completers
PlaceboRimonabant
20 mg
PlaceboRimonabant
20 mg
PlaceboRimonabant
20 mg
-10
-8
-6
-4
-2
0
0 16 32 48
Wei
gh
t ch
ang
e (k
g)
Weeks
L.Van Gaal, Lancet 2005; 365: 1389-97, X. Pi-Sunyer, Circulation 2005:111(13);1727Circulation 2005, JP. Després, Int J. Obes. Relat Metab Disod 2004, 28 (Suppl1) pS28; T5:O2-005

Changes in weight & waist circumference at 1-year: RIO-Europe
Placebo
Rimonabant 5 mg Rimonabant 20 mg
Completers
Wai
st c
ircu
mfe
ren
ce c
han
ge
(cm
)
- 4.5 - 5.3
- 8.5
p<0.001
WeeksITT LOCF
placebo: - 2.4 cm 5 mg: - 3.9 cm (p=0.002 vs placebo) 20 mg: - 6.5 cm (p<0.001 vs placebo)
Waist (cm)Waist (cm)
Wei
gh
t ch
ang
e (k
g)
Weight (kg)Weight (kg)
- 3.6
- 4.8p=0.042
- 8.6p<0.001
Weeks
ITT LOCF placebo: - 1.8 kg 5 mg: - 3.4 kg (p=0.002 vs placebo) 20 mg: - 6.6 kg (p<0.001 vs placebo)
L.Van Gaal, Lancet 2005; 365: 1389-97
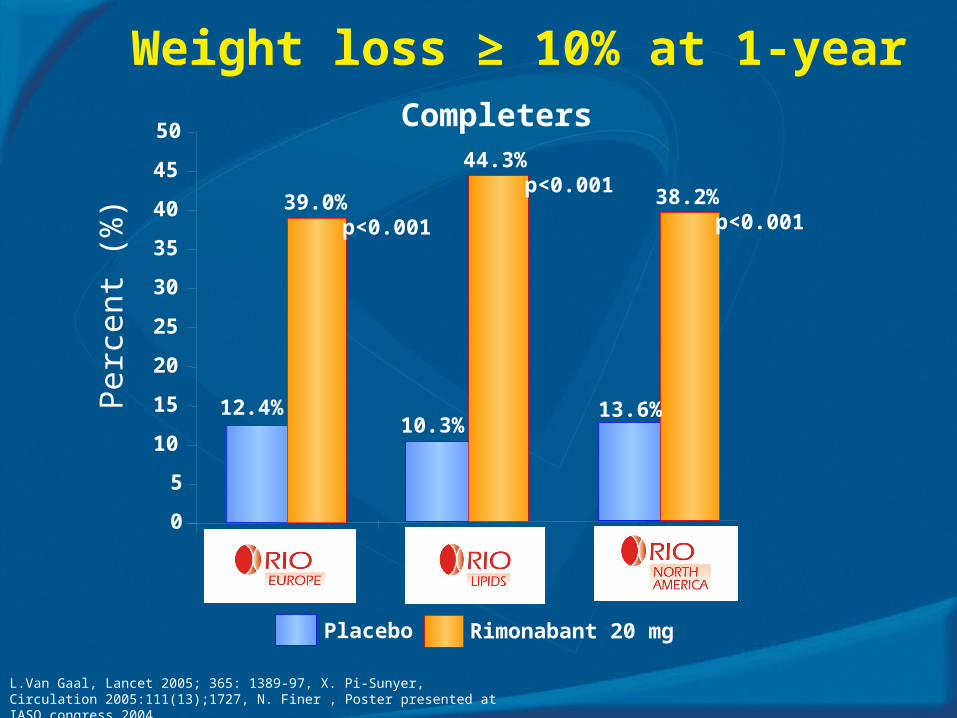
Weight loss ≥ 10% at 1-yearCompleters
Placebo Rimonabant 20 mg
12.4%10.3%
39.0%
44.3%
0
5
10
15
20
25
30
35
40
45
50
RIO~Europe RIO~Lipids
Per
cent
(%
) p<0.001
p<0.001
13.6%
38.2%p<0.001
L.Van Gaal, Lancet 2005; 365: 1389-97, X. Pi-Sunyer, Circulation 2005:111(13);1727, N. Finer , Poster presented at IASO congress 2004
Rimonabant produces consistent change in
metabolic parameters:
1 year results
• Lipids (triglycerides, HDL)
• Insulin resistance (HOMA)
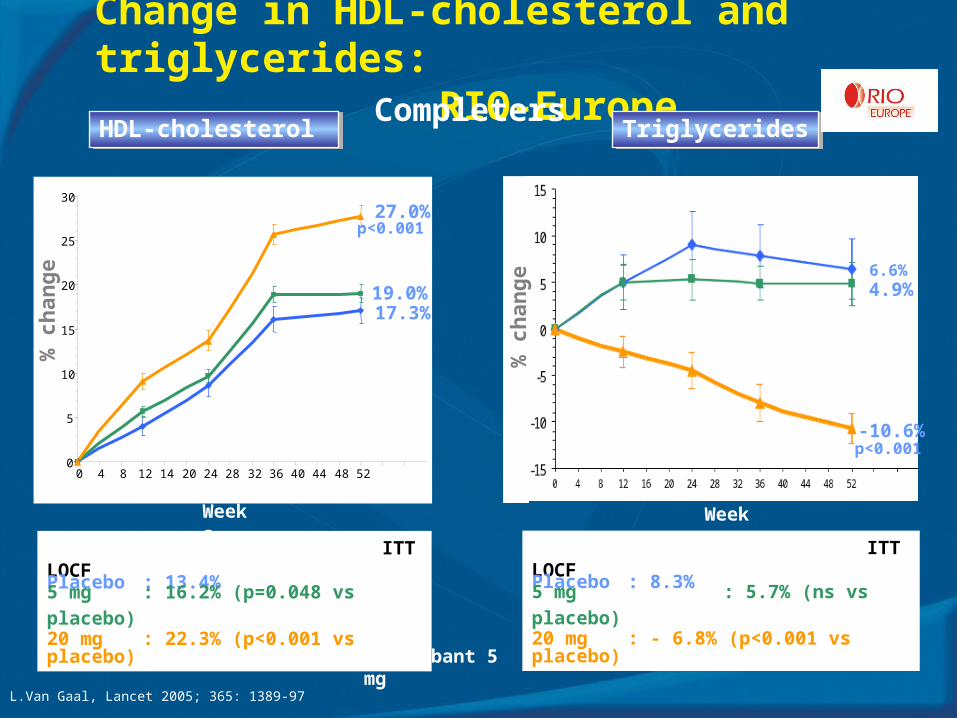
Change in HDL-cholesterol and triglycerides:RIO-Europe
TriglyceridesTriglycerides
Weeks
Placebo Rimonabant 5 mg
Rimonabant 20 mg
ITT LOCF Placebo : 8.3%
5 mg : 5.7% (ns vs placebo) 20 mg : - 6.8% (p<0.001 vs placebo)
ITT LOCF Placebo : 13.4%
5 mg : 16.2% (p=0.048 vs placebo) 20 mg : 22.3% (p<0.001 vs placebo)
Completers
6.6%4.9%
-10.6%
p<0.001
HDL-cholesterol HDL-cholesterol
Weeks
0
5
10
15
20
25
30
0 4 8 12 14 20 24 28 32 36 40 44 48 52
27.0%
19.0% 17.3%
p<0.001
% c
han
ge
% c
han
ge
L.Van Gaal, Lancet 2005; 365: 1389-97
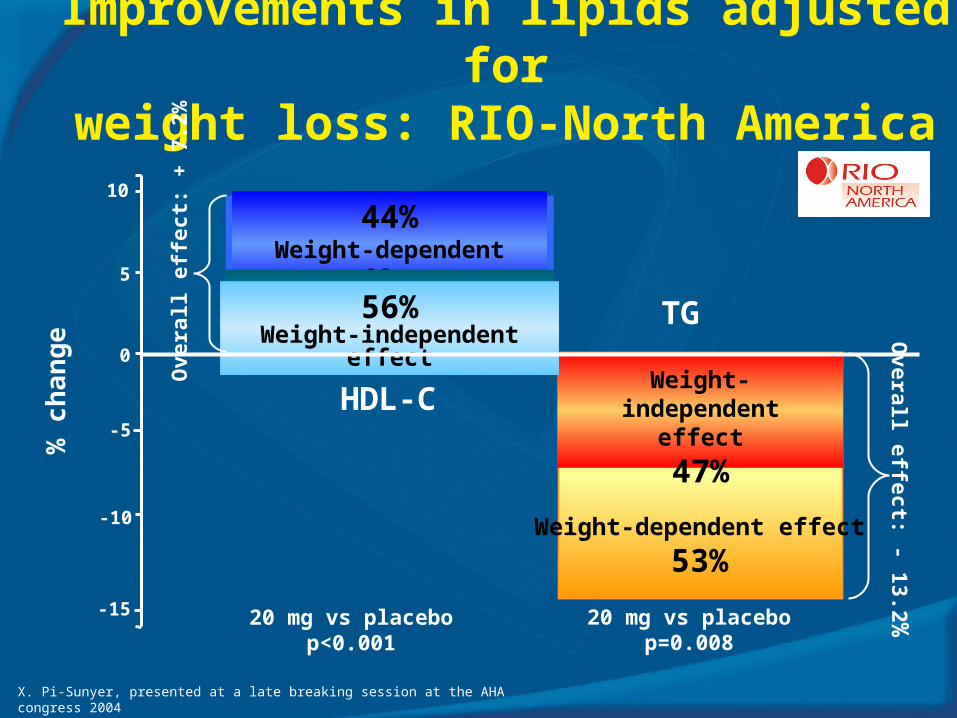
Improvements in lipids adjusted forweight loss: RIO-North America
20 mg vs placebop=0.008
20 mg vs placebop<0.001
TG
Weight-independenteffect
47%
Weight-dependent effect
53%
Overall effect: - 13.2%
44%Weight-dependent effect
HDL-C
56%Weight-independent effectO
vera
ll ef
fect
: +
7.2
%
% c
han
ge
-10
0
5
10
-5
-15
X. Pi-Sunyer, presented at a late breaking session at the AHA congress 2004

0.0
Improvement in fasting insulin and insulin resistance adjusted for weight loss:
RIO-North AmericaO
verall effect - 0.80*
- 0.8
- 0.6
- 0.4
- 0.2
2
50%Weight-
dependenteffect
50%Weight-
independent effect
- 3.0
- 2.5
- 2.0
- 1.5
- 1.0
- 0.5
0.0
FASTING INSULIN 20 mg vs Placebo
*p<0.001
HOMA-IR 20 mg vs Placebo
*p<0.001
Ch
ang
e in H
OM
A (%
)C
han
ge
in f
asti
ng
insu
lin (
µU
/mL
) 51%Weight-
independent effect
49% Weight-
dependent effectO
vera
ll ef
fect
- 2
.8*
1 Year Analysis
X. Pi-Sunyer, presented at a late breaking session at the AHA congress 2004

Insulin during OGTT among patients with/without metabolic syndrome (MS) at baseline:
RIO-LipidsITT-LOCF
010
Time
2030405060708090
100110
0 mn 30 mn 60 mn 90 mn 120 mn
ulU
/mL
Placebo
0
Rimonabant
20mg
102030405060708090
100110
0 mn 30 mn 60 mn 90 mn 120 mnTime
ulU
/mL
AU
Cu
lU/m
L*m
inWithMS
WithoutMS
AU
Cu
lU/m
L*m
in
WithMS
WithoutMS
Year 1 with MSYear 1 without MS
Baseline with MSBaseline without MS
R, Després J-P. Presented at the ACC congress, March 2004, Abstr. 409-1
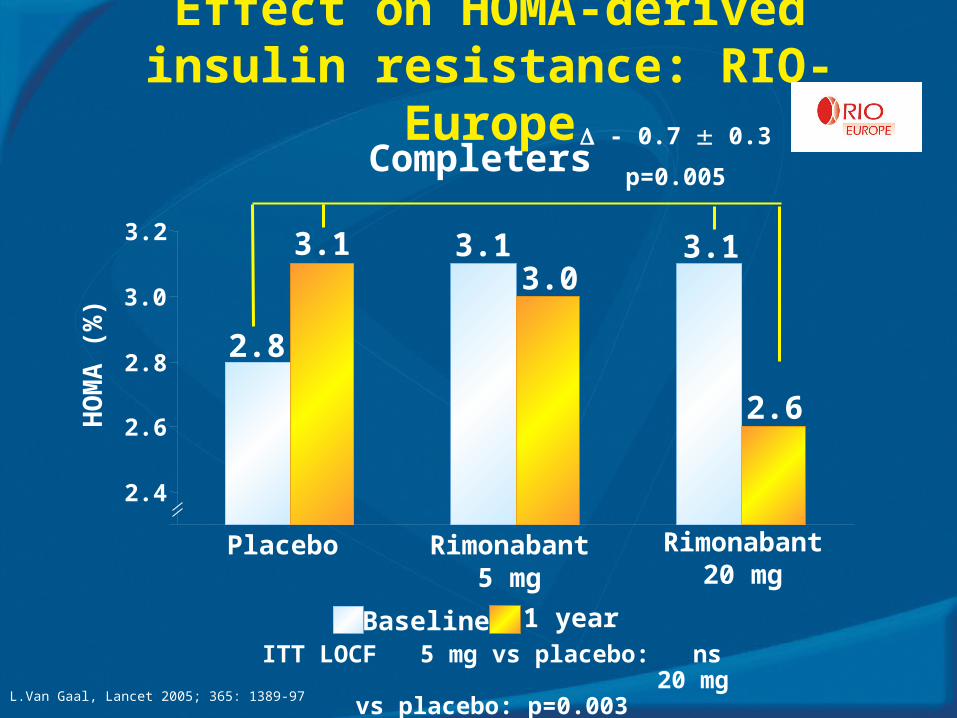
Effect on HOMA-derived insulin resistance: RIO-Europe
ITT LOCF 5 mg vs placebo: ns 20 mg vs placebo:
p=0.003
Baseline 1 year
Completers - 0.7 0.3
p=0.005
2.4
2.6
2.8
3.0
3.2
HO
MA
(%
)
2.8
3.1 3.13.0
3.1
2.6
Placebo Rimonabant 20 mg
Rimonabant 5 mg
L.Van Gaal, Lancet 2005; 365: 1389-97

Changes in leptin and adiponectin: RIO-Lipids
Lep
tin
leve
ls (
ng
/mL
)
- 3.8 ng/mL
p<0.001
1.6 g/mL
p=0.001
Ad
ipo
nec
tin
leve
ls (g
/mL
)
ITT-LOCF
Placebo Rimonabant 20 mg Placebo Rimonabant 20 mg
18 18 18
14
5.96.7
5.8
8.2
10
12
14
16
18
20
22
0
2
4
6
8
10
Baseline 1 Year
41%41%
Leptin Adiponectin
JP. Després, presented as a poster in ENDO congress 2004, Abst P1-345

Metabolic syndrome NCEP-ATP IIICriteria
Abdominal obesity: men: waist circumference >102 cm, women: waist circumference >88 cm
Hypertension: 130/85 mmHg
Hypertriglyceridaemia: 150 mg/dl
Low HDL-cholesterol: men: <40 mg/dl, women: <50 mg/dl
Abnormal fasting glucose: 110 mg/dl
To fulfill the diagnostic criteria for the metabolic syndrome patients must meet three of the following criteria:
NCEP-ATP-III, JAMA 2001, 285: 2486-2497

Reduction in metabolic syndrome
Placebo Rimonabant 20 mg
ITT
- 60
- 50
- 40
- 30
- 20
- 10
0
- 21%
- 53%
p<0.001
- 21%
- 51%
p<0.001
Red
uct
ion
in m
etab
olic
syn
dro
me
(%)
- 8%
- 39%
p<0.001
1 year
L.Van Gaal, Lancet 2005; 365: 1389-97, X. Pi-Sunyer, Circulation 2005:111(13);1727, JP. Després, Int J. Obes. Relat Metab Disod 2004, 28 (Suppl1) pS28; T5:O2-005

Rimonabant
induces improvement
in atherogenic parameters
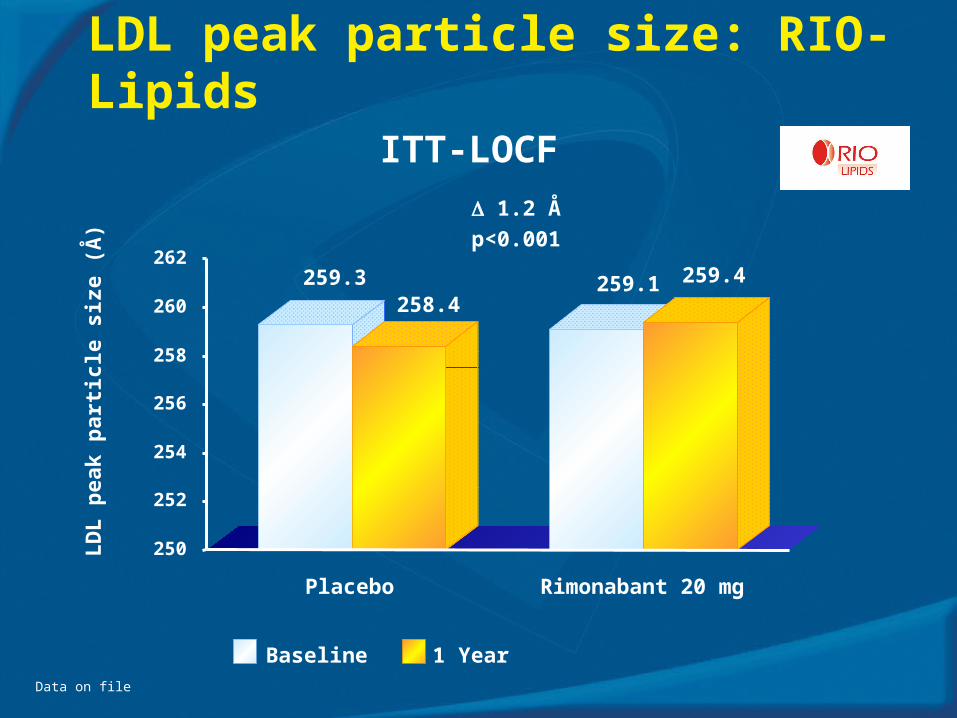
LDL peak particle size: RIO-Lipids
ITT-LOCF
1.2 Å
p<0.001
Placebo Rimonabant 20 mg
LD
L p
eak
par
ticl
e si
ze (
Å)
259.3258.4
259.1 259.4
250
252
254
256
258
260
262
Baseline 1 YearData on file

Change in proportion of small and large LDL particles: RIO-Lipids
Baseline 1 Year
Proportion of small LDL particles
ITT-LOCF
Placebo Rimonabant 20 mg
- 4.7%
p=0.002
26.2
29.5
25.824.4
20
22
24
26
28
30
32
34
% s
mal
l LD
L p
arti
cles
Proportion of large LDL particles
Placebo Rimonabant 20 mg
6.3%
p<0.00140.2
35.1
40.041.2
20
25
30
35
40
45
% la
rge
LD
L p
arti
cles
R, Després J-P. Presented at the ACC congress, March 2004, Abstr. 409-1
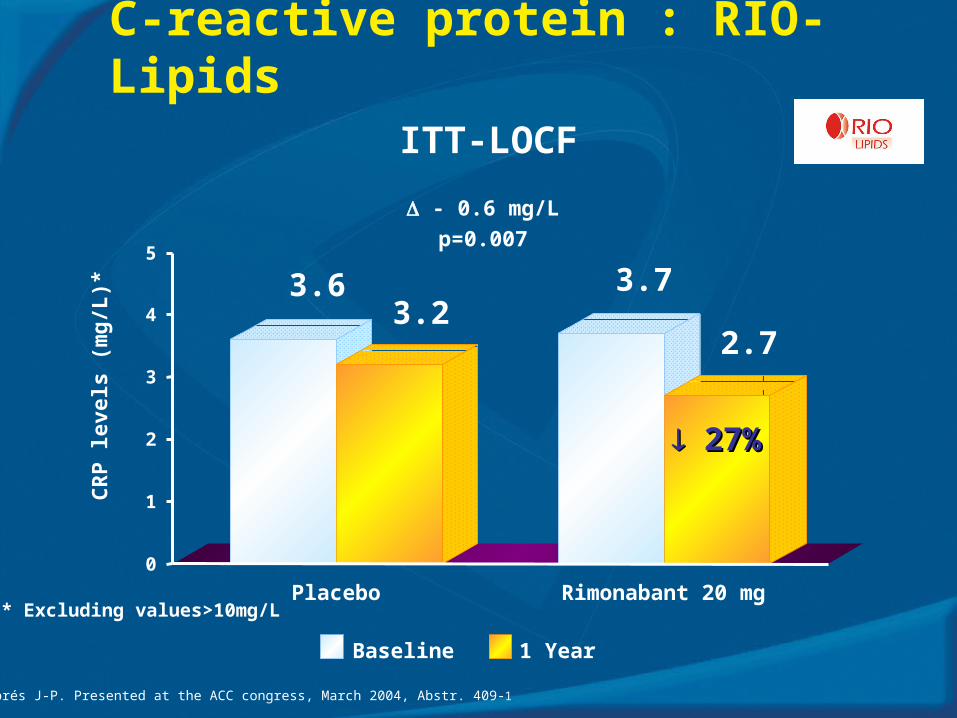
C-reactive protein : RIO-Lipids
ITT-LOCF
Baseline 1 Year
CR
P le
vels
(m
g/L
)*
- 0.6 mg/L
p=0.007
Placebo Rimonabant 20 mg
3.63.2
3.7
2.7
0
1
2
3
4
5
27%27%
* Excluding values>10mg/L
R, Després J-P. Presented at the ACC congress, March 2004, Abstr. 409-1

Rimonabant maintains metabolic benefits
over 2 years
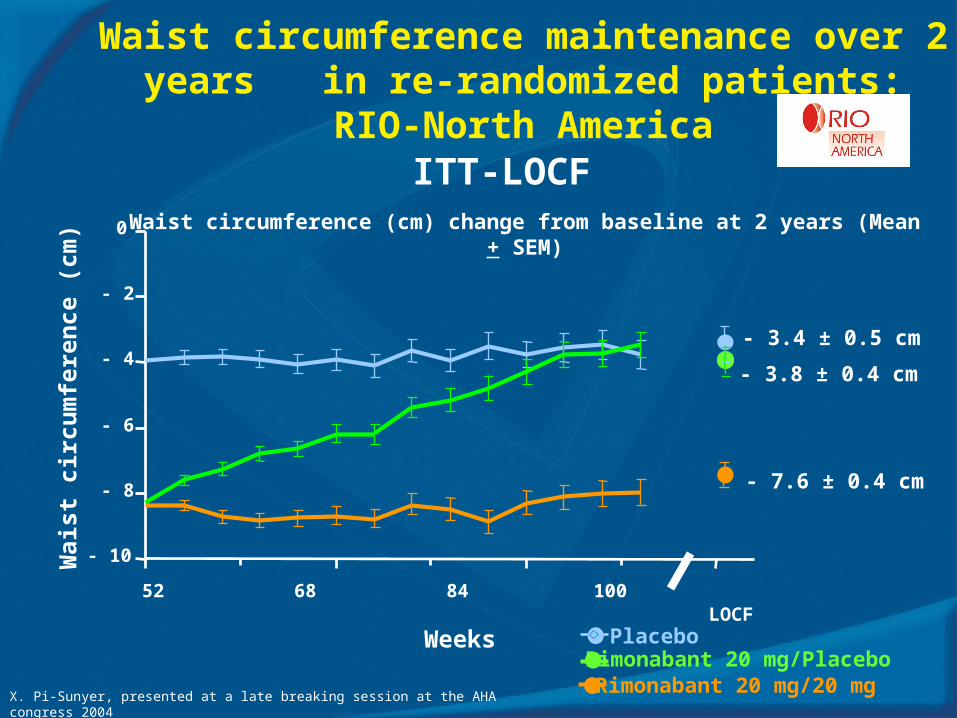
Waist circumference maintenance over 2 years in re-randomized patients:
RIO-North AmericaITT-LOCF
Waist circumference (cm) change from baseline at 2 years (Mean + SEM)
Wai
st c
ircu
mfe
ren
ce (
cm)
LOCF
- 7.6 ± 0.4 cm
- 3.4 ± 0.5 cm
- 3.8 ± 0.4 cm
- 10
- 8
- 6
- 4
- 2
0
52 68 84 100
Weeks PlaceboRimonabant 20 mg/Placebo Rimonabant 20 mg/20 mg
X. Pi-Sunyer, presented at a late breaking session at the AHA congress 2004

Prevention of weight regain by chronic therapy: RIO-North America
ITT-LOCF
Weight (kg) Change from Baseline at 2 Years (Mean + SEM)
LOCF
- 7.4 ± 0.4 kg
- 2.3 ± 0.5 kg
- 3.2 ± 0.4 kg
- 12
- 9
- 6
- 3
0
52 60 68 76 84 92 100
Weeks
Wei
gh
t ch
ang
e (k
g)
PlaceboRimonabant 20 mg/Placebo Rimonabant 20 mg/20 mg
X. Pi-Sunyer, presented at a late breaking session at the AHA congress 2004

Consistent Waist Circumference Changes in RIO Studies
Van Gaal L., . Presented at the ACC congress, March 2005, presentation 410-13
20 mg vs. placebo: -4.2cm (p<0.001)
RIO~NA
ITT (LOCF)
0
-2
-4
-6
-8
-10
-12
0 4 12 20 28 36 44 52 60 68 76 84 92 104 LOCF
Wai
st (
cm)
Weeks
Placebo
Rimonabant 20 mg
Placebo
Rimonabant 20 mg
20 mg vs. placebo: -4.1cm (p<0.001)
RIO~EUCOMPLETERS COMPLETERS
-12,0
-10,0
-8,0
-6,0
-4,0
-2,0
0,0
0 2 4 8 12 16 20 24 28 32 36 40 44 48 52 56 60 64 68 72 76 80 84 88 92 96100104 LO

Weight loss in completers on the same treatment for 2 years: RIO-North America
>5% weight loss>5% weight loss >10% weight loss>10% weight loss
ITT LOCFPlacebo: 19.3% 5 mg: 19.0% (ns vs placebo) 20 mg: 39.7% (p<0.001 vs placebo)
ITT LOCFPlacebo: 8.3% 5 mg: 8.5% (ns vs placebo) 20 mg: 16.5% (p<0.001 vs placebo)
*p<0.001
Placebo Rimonabant5 mg
Rimonabant20 mg
33.2% 36.7%
62.5%*
0
20
40
60
80
% o
f p
atie
nts
32.8%*
20.0%16.4%
0
20
40
60
80*p<0.001
Placebo Rimonabant5 mg
Rimonabant20 mg
% o
f p
atie
nts
X. Pi-Sunyer, presented at a late breaking session at the AHA congress 2004
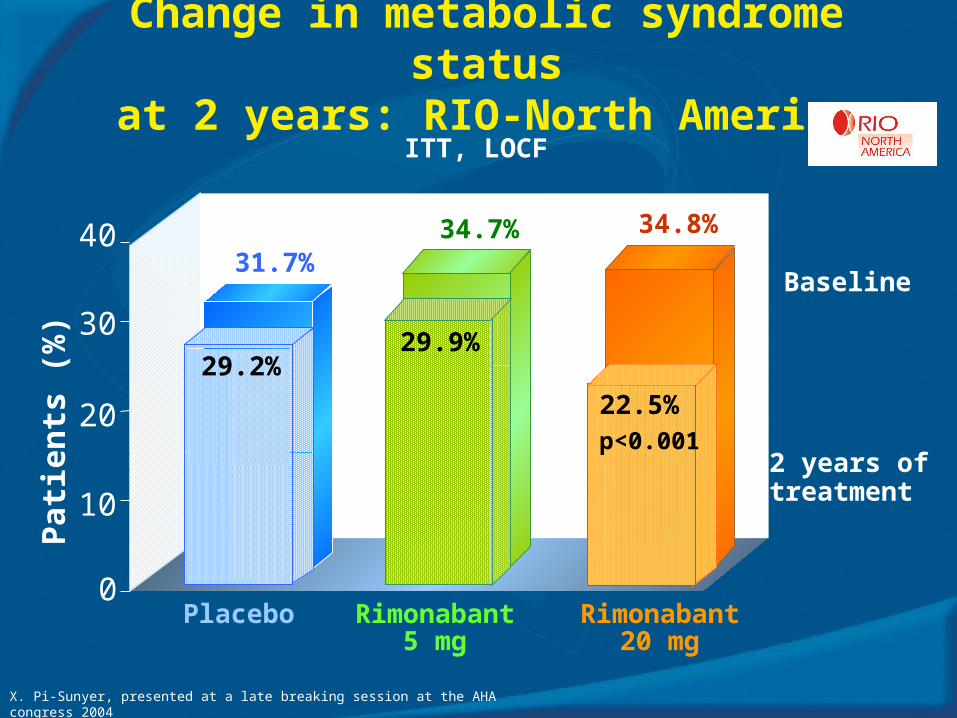
Change in metabolic syndrome statusat 2 years: RIO-North America
ITT, LOCF
Pat
ien
ts (
%)
Baseline
2 years of treatment
Rimonabant20 mg
Rimonabant5 mg
0
10
20
30
40
Placebo
31.7%
29.2%
34.7%
29.9%
34.8%
22.5%p<0.001
X. Pi-Sunyer, presented at a late breaking session at the AHA congress 2004

Consistent Reduction in Metabolic Syndrome at 2 Years
COMPLETERS
Reduction in Metabolic Syndrome (%)
Placebo Rimonabant20 mg
Placebo Rimonabant20 mg
-34 %
-57 %
-28 %
-54 %
OR= 0.599 (p<0.05)OR= 0.483 (p<0.05)
-60
-50
-40
-30
-20
-10
0
-54% -57%
Van Gaal L., . Presented at the ACC congress, March 2005, presentation 410-1X. Pi-Sunyer, presented at a late breaking session at the AHA congress 2004
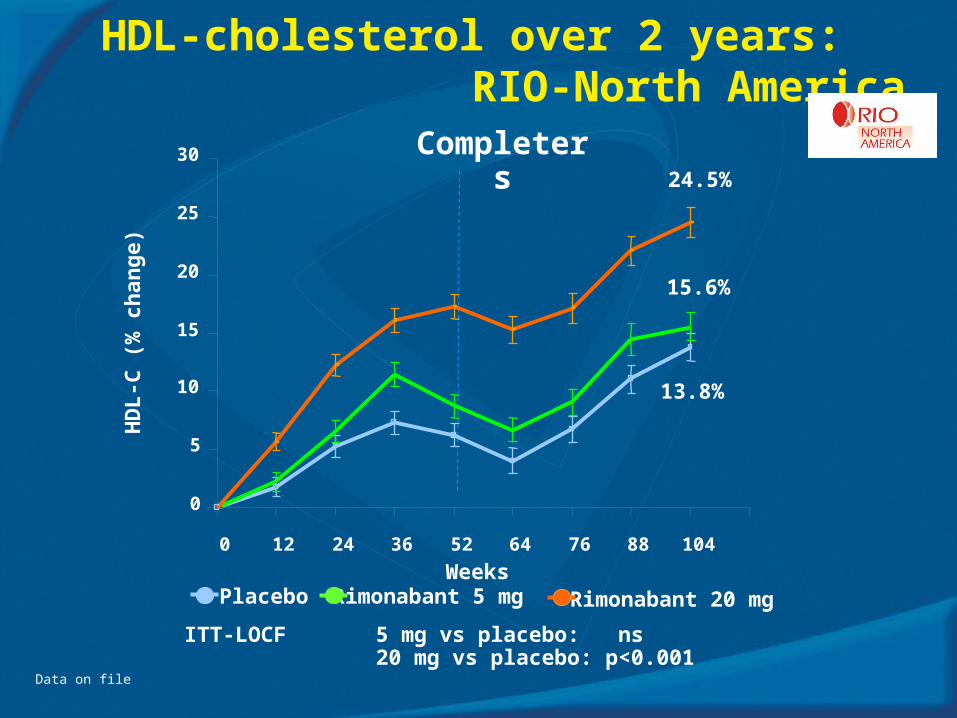
HDL-cholesterol over 2 years: RIO-North America
ITT-LOCF 5 mg vs placebo: ns20 mg vs placebo: p<0.001
Placebo Rimonabant 5 mg Rimonabant 20 mg
24.5%
15.6%
13.8%
0
5
10
15
20
25
30
0 12 24 36 52 64 76 88 104
Weeks
HD
L-C
(%
ch
ang
e)Completers
Data on file
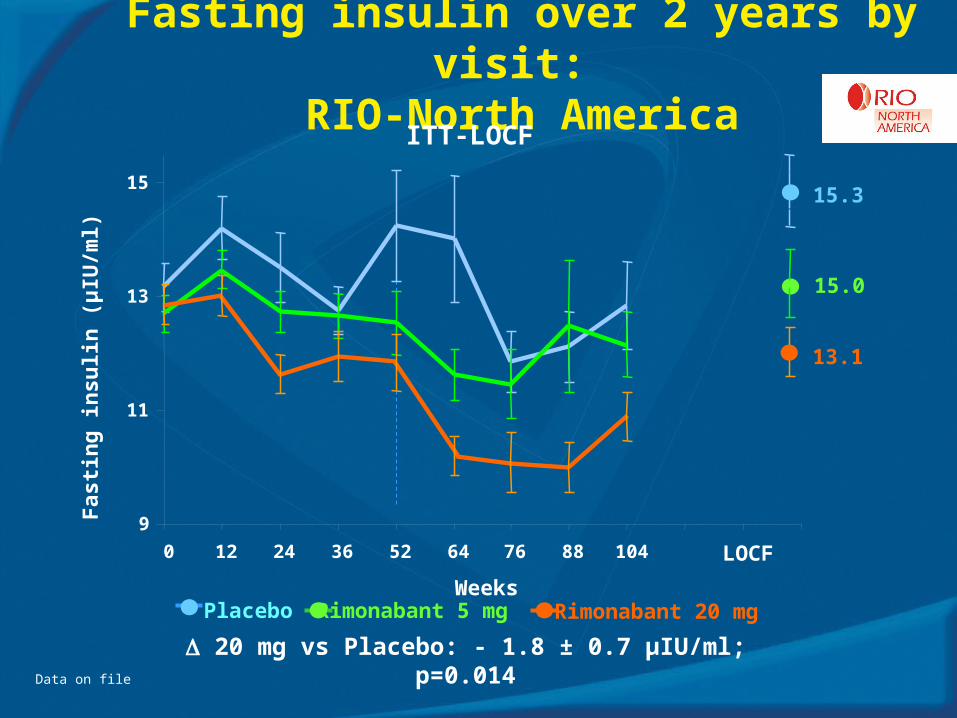
Fasting insulin over 2 years by visit: RIO-North America
20 mg vs Placebo: - 1.8 ± 0.7 µIU/ml; p=0.014
Placebo Rimonabant 5 mg Rimonabant 20 mg
13.1
15.0
15.3
9
11
13
15
0 12 24 36 52 64 76 88 104 LOCF
Weeks
Fas
tin
g in
sulin
(µ
IU/m
l)
ITT-LOCF
Data on file

Rimonabantimproves quality of life

Improvement in quality-of-life scale
- 4
- 2
0
2
4
6
8
10
12
14
16
Physicalfunction
Self-esteem
Sexuallife
Publiccomfort
Work Totalscore
Mea
n
PlaceboRimonabant 20 mg
Impr
ovem
ent
Mean IW-quality of life scorechange from baseline to year 1
JP. Després, Obes Res 2004, 12 (suppl) 231-P, A 61

Safety and tolerability of rimonabant
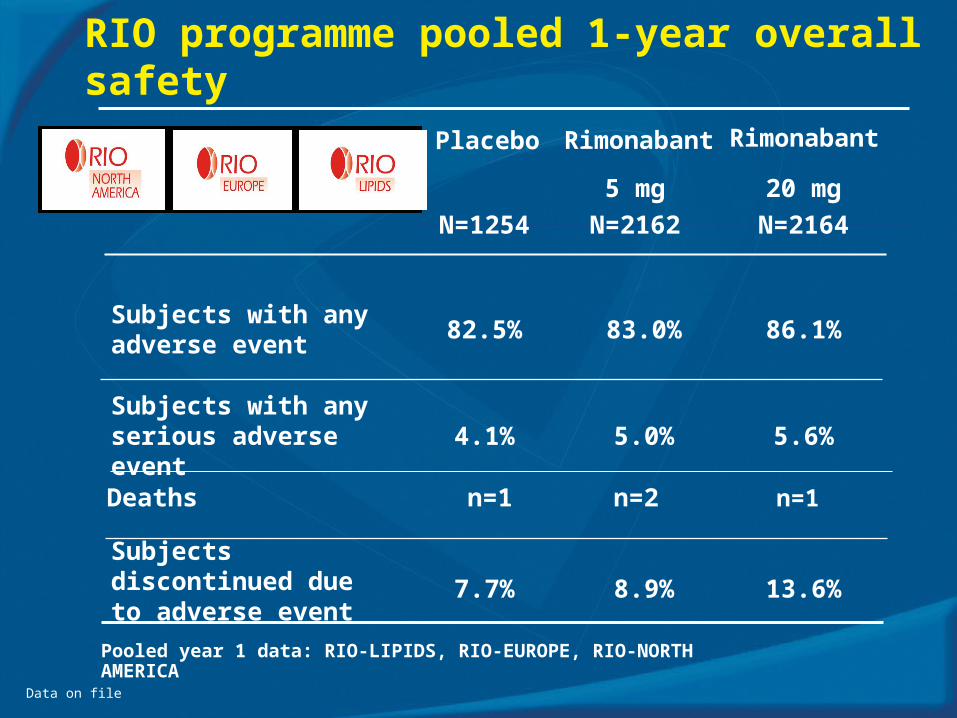
RIO programme pooled 1-year overall safety
Pooled year 1 data: RIO-LIPIDS, RIO-EUROPE, RIO-NORTH AMERICA
13.6%8.9%7.7%Subjects discontinued due to adverse event
RimonabantPlacebo
5.6%5.0%4.1%Subjects with any serious adverse event
86.1%83.0%82.5%Subjects with any adverse event
20 mg
N=2164
5 mg
N=2162N=1254
Rimonabant
Deaths n=1 n=2 n=1
Data on file
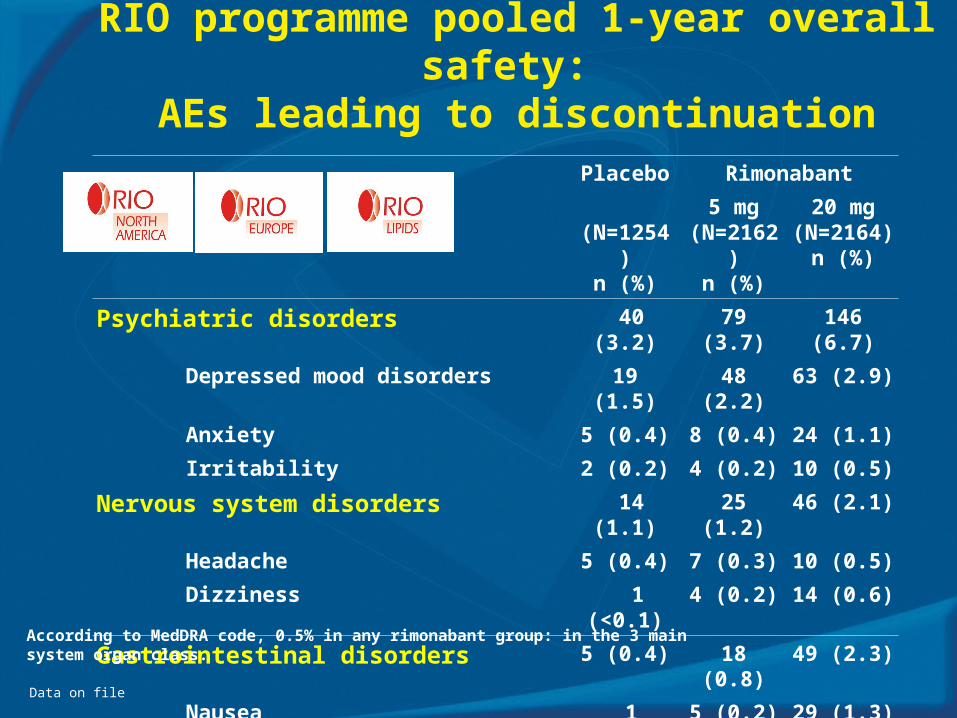
RIO programme pooled 1-year overall safety: AEs leading to discontinuation
Placebo Rimonabant
(N=1254)n (%)
5 mg(N=2162)
n (%)
20 mg(N=2164)
n (%)
Psychiatric disorders 40 (3.2) 79 (3.7) 146 (6.7)
Depressed mood disorders 19 (1.5) 48 (2.2) 63 (2.9)
Anxiety 5 (0.4) 8 (0.4) 24 (1.1)
Irritability 2 (0.2) 4 (0.2) 10 (0.5)
Nervous system disorders 14 (1.1) 25 (1.2) 46 (2.1)
Headache 5 (0.4) 7 (0.3) 10 (0.5)
Dizziness 1 (<0.1) 4 (0.2) 14 (0.6)
Gastrointestinal disorders 5 (0.4) 18 (0.8) 49 (2.3)
Nausea 1 (<0.1) 5 (0.2) 29 (1.3)
According to MedDRA code, 0.5% in any rimonabant group: in the 3 main system organ class.
Data on file
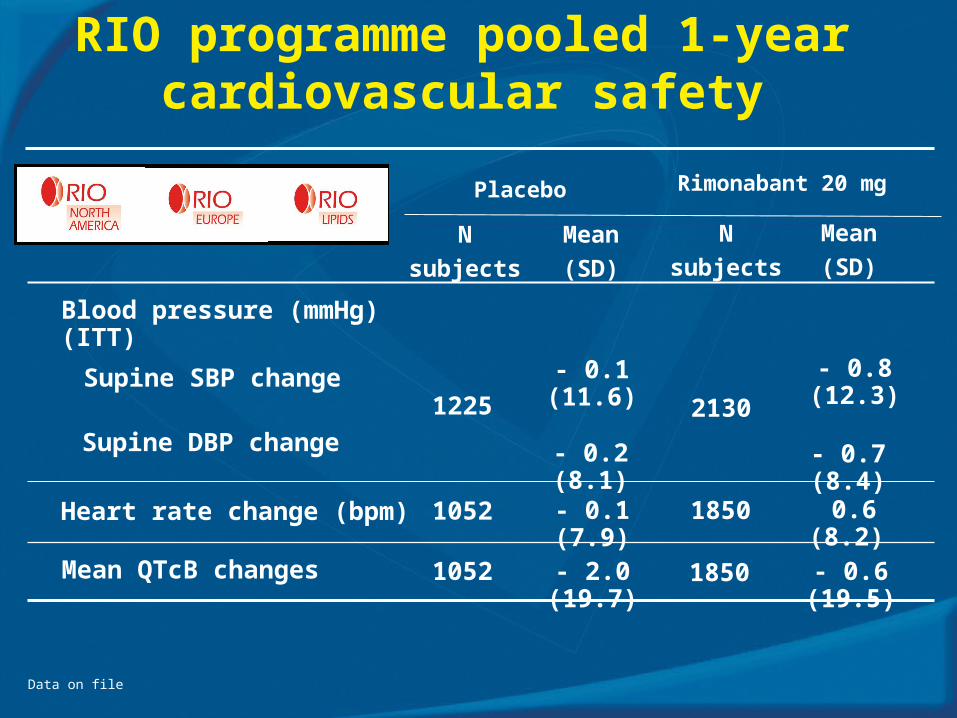
RIO programme pooled 1-yearcardiovascular safety
Placebo Rimonabant 20 mg
N
subjects
Mean
(SD)N
subjects
Mean
(SD)
Blood pressure (mmHg) (ITT)
Supine SBP change
Supine DBP change
Heart rate change (bpm)
Mean QTcB changes
1225
1052
1052
2130
1850
1850
- 0.1 (11.6) - 0.8 (12.3)
- 0.2 (8.1) - 0.7 (8.4)
- 0.1 (7.9) 0.6 (8.2)
- 2.0 (19.7) - 0.6 (19.5)
Data on file
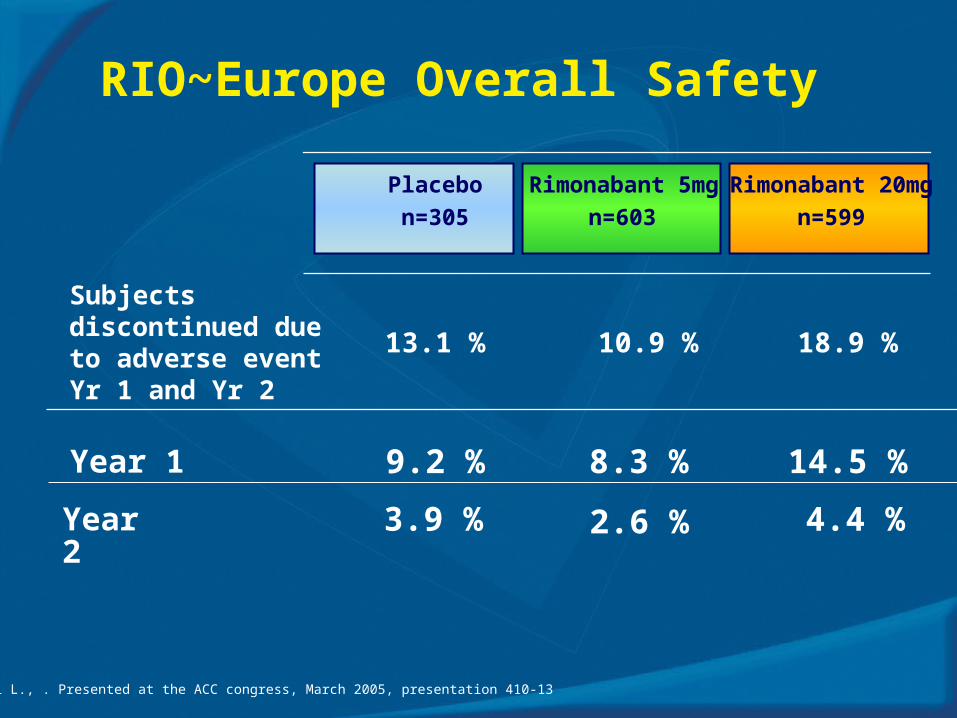
RIO~Europe Overall Safety
Van Gaal L., . Presented at the ACC congress, March 2005, presentation 410-13
14.5 %8.3 %9.2 %Year 1
18.9 %10.9 %13.1 %
Subjects discontinued due to adverse eventYr 1 and Yr 2
Rimonabant 20mg
n=599n=305 n=603
Rimonabant 5mgPlacebo
Year 2
3.9 % 2.6 % 4.4 %
Conclusions
Consistent results were replicated in 3 large studies
Rimonabant 20 mg consistently produced: Significant reductions in waist circumference and weight Significant improvement in metabolic profile:
• Increased HDL-cholesterol and decreased triglyceride levels
• Improved insulin sensitivity (HOMA) Significant decrease in % of subjects with metabolic
syndrome Weight-independent effect of rimonabant on several
metabolic variables suggestive of a direct pharmacological effect beyond weight loss alone

Conclusions II
Rimonabant 20 mg:
Improved other metabolic and cardiovascular risk factors:
Increased plasma adiponectin and decreased plasma
leptin
Decreased CRP, a marker of inflammation
Improved small dense LDL particles profile
Achieved efficacy at year 1 which was maintained over
year 2 with chronic therapy
Improved quality of life
Is well tolerated

DISCLAIMER
Rimonabant is not yet licensedThis information is provided for
medical information purpose