Embed Size (px)
Citation preview

RightSizing Project NextGen IOC Sensor Assessment Summary
AJP-6830 1 of 64 December 1, 2009

RightSizing Project NextGen IOC Sensor Assessment Summary
AJP-6830 2 of 64 December 1, 2009
TABLE OF CONTENTSEXECUTIVE SUMMARY ............................................................................................................ 3
1 INTRODUCTION ................................................................................................................ 4
1.1 Context and Motivation .....................................................................................................41.1.1 NextGen ...................................................................................................................... 41.1.2 4D weather cube ........................................................................................................41.1.3 Weather observation and forecast requirements to meet NextGen goals .................5
1.2 RightSizing Project Goals ....................................................................................................61.2.1 Assessment of Sensor Network ..................................................................................71.2.2 Identification of gaps based on functional and performance requirements ..............81.2.3 Development of master plan to meet NextGen weather observation requirements .8
1.3 Scope of this Report (FY 2009) ...........................................................................................8
2 PROGRAM MANAGEMENT AND SCHEDULE ....................................................................... 9
2.1 Timeline and Deliverables ..................................................................................................92.1.1 FY09 ............................................................................................................................ 92.1.2 FY10 and beyond ........................................................................................................9
2.2 Team Organization and Responsibilities ...........................................................................102.2.1 FAA Points of Contact ...............................................................................................112.2.2 NCAR ......................................................................................................................... 112.2.3 MIT LL ....................................................................................................................... 122.2.4 OU and IU .................................................................................................................122.2.5 Expanded team membership for FY10 and beyond ..................................................13
2.3 Data Sources ....................................................................................................................142.3.1 NOSA assessment and database ...............................................................................142.3.2 NSF Facilities Assessment Database .........................................................................152.3.3 NRC “Network of Networks” report .........................................................................16
2.4 OFCM ...............................................................................................................................162.4.1 NWS .......................................................................................................................... 172.4.2 NOAA/ESRL MADIS system .......................................................................................172.4.3 Department of Transportation Clarus Initiative ........................................................18
3 SCOPE AND METHODOLOGY ............................................................................................19
3.1 Approach ..........................................................................................................................193.2 Priorities and Limitations .................................................................................................21
3.2.1 Sensor and data ownership and access ....................................................................213.2.2 Sensors and their products .......................................................................................213.2.3 Sensor status ............................................................................................................223.2.4 Function and performance .......................................................................................223.2.5 Aviation hazards .......................................................................................................223.2.6 Coverage domains ....................................................................................................23
3.3 Terminology and Ambiguities ..........................................................................................233.3.1 Sensor and observation types ..................................................................................233.3.2 NAS domains ............................................................................................................243.3.3 Data characteristics ..................................................................................................243.3.4 Observing system “gaps” ..........................................................................................25
4 IOC ASSESSMENT AND INITIAL FINDINGS .........................................................................27
4.1 Sensor Catalogue .............................................................................................................27
RightSizing Project NextGen IOC Sensor Assessment Summary
AJP-6830 3 of 64 December 1, 2009
4.1.1 Sensor survey procedure ..........................................................................................274.1.2 Ground-based weather observing systems ..............................................................274.1.3 Wind-shear detection systems .................................................................................284.1.4 Weather radar systems .............................................................................................294.1.5 Satellite weather observing systems ........................................................................304.1.6 Space weather observing systems ............................................................................314.1.7 Aircraft-based observations ......................................................................................314.1.8 External risks .............................................................................................................31
4.2 Observing System Gaps ....................................................................................................324.2.1 Gap overview tables .................................................................................................324.2.2 The role of cost-effective human observations ........................................................464.2.3 Data access and utilization .......................................................................................464.2.4 Weather phenomena................................................................................................464.2.5 Space weather ..........................................................................................................484.2.6 Volcanic ash – not assessed in FY09 .........................................................................494.2.7 Environment – not assessed in FY09 ........................................................................494.2.8 Bird strikes and wildlife incursions............................................................................494.2.9 Boundary layer..........................................................................................................504.2.10 Oceanic weather .......................................................................................................50
4.3 Candidate Actions for High-Impact Gap Mitigation .........................................................50
5 Overview of Plans for the FY10-12 Period ........................................................................53
5.1 Sensor Survey and Gap Analysis ......................................................................................535.2 Mitigation Planning ..........................................................................................................545.3 Demonstrations................................................................................................................55
REFERENCES ..........................................................................................................................58
APPENDIX A: IOC Assessment Catalogue Parameters ............................................................59
APPENDIX B: RightSizing Team Member Biographies ............................................................62
APPENDIX C: List of Acronyms................................................................................................64
The RightSizing IOC Sensor Assesment Database may be found at http://wx.tc.faa.gov/rightsize/sensorIOClatest.xls

RightSizing Project NextGen IOC Sensor Assessment Summary
AJP-6830 4 of 64 December 1, 2009
EXECUTIVE SUMMARY
This document summarizes the activities, methods, findings, and results of the IOC Sensor Assessment task undertaken by the RightSizing Project Team under the auspices of the Reduce Weather Impact (RWI) program portfolio.
The real substance of the Sensor Assessment work is contained within the Sensor Assessment Database. As the name implies, the database is an intricate mapping of requirements, sensor platforms, measurement techniques, and performance characteristics for the sensor network anticipated at NextGen Initial Operating Capability (IOC) in 2013. The main purpose of this document is to describe what information regarding the NAS sensor network is contained in the database (and what is not), the basis for included information, the methods used to gather and evaluate the data, and finally what preliminary observations and analysis can be drawn from the data given the nascent state of some of the inputs.
The task of assessing the sensor network for IOC is one that cries out for a clear definition of boundaries and scope. After all, the entirety of the U.S. sensor network is almost infinite in its extent and variety. It contains many capabilities and platforms providing data that may be critical to some and trivial to others. To prevent the initiation of an unfocused and/or open-ended effort, the team adopted the Four-Dimensional Weather Functional Requirements for NextGen Air Traffic Management issued by the JPDO, to bound and organize the data collection effort and insure that it produced information relevant to the NextGen NAS. Thus the Sensor Assessment Database is organized with the functional requirements as the main axis of the primary table, which is set up so that every relevant sensor capability can be associated with any or all requirements. The other axis of the main table contains the individual sensor performance parameters which will be relevant to NextGen operation and performance. This parameter set was determined by a careful survey of other relevant sensor catalogs and careful review by a team of highly qualified experts. Other tables include mappings of preliminary performance requirements to the functional requirements, data sources, and parameter definitions. Having this detailed sensor performance information in this format will provide for a well defined and orderly process for doing detailed
performance gap identification and analysis, as the finalized detailed performance requirements become available.
The team that undertook the task of researching and entering the Sensor Assessment data (and preparing this report) is composed of a group of aviation weather experts with a deep understanding of the issues at hand. The team was split into groups of Subject Matter Experts organized by sensing technologies and techniques. MIT Lincoln Laboratory led the effort in the areas of radars and LIDARs, the National Center for Atmospheric Research team members worked on surface sensors, satellites and airborne sensors. University of Oklahoma and Indiana University contributed in the areas of advanced data assimilation and processing techniques. Another pool of expertise was drawn from the FAA’s Aviation Weather Group (AJP-68) to manage and oversee the effort. In addition to the full time team members, additional resources were called upon when appropriate to maximize the quality of the Assessment’s data. Information was contributed by Earth Systems Research Labatory (ESRL), DOT’s Clarus Initiative, and the National Severe Storms Laboratory (NSSL) to name just a few of the many valued participants.
This report also contains preliminary findings and observations of gaps which exist between the current set of functional requirements and the current (and out to IOC) weather sensing capabilities. These findings are described in Section 4 of this document. It is pointed out in this section that there are several potentially significant gaps between what will be required for the operation of the NextGen NAS and the capabilities now inherent in the sensor network. These gaps exist and are described at the level of individual functional requirements and also on a wider scale centered around the difficulties measuring certain weather phenomena in general.
The report then concludes by noting that this Sensor Assessment is only the first important step in the overall RightSizing process (as depicted in figure E.1). The Sensor Assessment Database will serve as a critically important input to the Gap Analysis and Mitigation activities that must follow in order to bring the sensing network efficiently and effectively up to the standards that will be required by NextGen.

RightSizing Project NextGen IOC Sensor Assessment Summary
AJP-6830 5 of 64 December 1, 2009
Figure E.1 The RightSizing Process
Current/FutureCapabilities
Assessments
GapIdentification
Use Cases
Technology Assessments
Architecture and
Roadmaps
Policiesand
Plans
Functional & Performance Requirements
GapAnalysis
GapMitigationPlanning
Demonstrations
GapMitigationActivities
Externally generated
RightSizing Core Processes
RightSizing Process Outputs
Combination of RightSizingand external Actions
Activities
RightSizingProcess
GapIdentification Reports
Gap AnalysisReports & GapAssignments
DemonstrationResults/Reports
DesignRecommendations
AcquisitionRecommendations
Motivators
Outputs
RecommendedRequirementsRevisions

RightSizing Project NextGen IOC Sensor Assessment Summary
AJP-6830 6 of 64 December 1, 2009
1 INTRODUCTION
This document describes and summarizes the IOC Sensor Assessment activities and results. The Sensor Assessment is a part of the overall activities conducted under the RightSizing project. The RightSizing project is part of the Reduced Weather Impact (RWI) program portfolio under the overall NextGen effort. Details regarding other RightSizing tasks, project resources, JPDO/FAA documentation, roadmaps, overall project schedule, etc. are presented in the RightSizing project Master Plan.
1.1 Context and Motivation
1.1.1 NextGen
In 2003 Congress endorsed the Next Generation Air Transportation System (NextGen) concept in response to the realization that the current system will not be able to meet growing air traffic demand and that a concerted effort was needed to address this problem. Legislation established the Joint Planning and Development Office (JPDO) to lead the planning for NextGen. The JPDO has published a Concept of Operations for NextGen as envisioned in 2025 (JPDO
2007) as well as a set of operational improvements, (the Weather Concept of Operations (JPDO 2006)), needed in order to make the 2025 vision a reality.
The goal of NextGen is to significantly increase the safety, security, capacity, efficiency, and environmental compatibility of air transportation operations by 2025. A cardinal principle is to provide Air Traffic Management (ATM) Decision Support Tools (DSTs) with information designed for specific NextGen operational decisions. The weather information needed for such DSTs must be specified in terms of spatial and temporal resolution, refresh rate, availability, latency, uncertainty, geographic location, and any other metadata specifying the data quality and their validity. This weather information should be usable directly by various and evolving DST functions which will necessitate formats and access methods that are standardized. This standardization will lead to multiple users having the same “common weather picture” (situational awareness) and thus provide the basis for nationwide decision collaboration and weather information uniformity.
The FAA will address the NextGen weather goals via the NextGen Network Enabled Weather (NNEW) and RWI
CapabilityThrusts
To Improve NAS Performance
JPDO defined weather operational improvements (OI’s) which reduce weather impact.
Provide improved access to weather information by all users
Improve weather observations
Improve quality of current and forecast weather information
Integrate weather location, severity and impact information data into operational decision making
Dissemination NNEW
Observation
RWIForecast
Integration
Figure1.1. Application of improvements in dissemination, observation, forecasting, and
integration to NNEW and RWI to improve overall NAS performance.

RightSizing Project NextGen IOC Sensor Assessment Summary
AJP-6830 7 of 64 December 1, 2009
programs. Under the NNEW effort, improved weather observations, model outputs, analyses, and forecasts will reside in a virtual repository known as the 4-D Weather Data Cube (the Cube). This Cube will contain all unclassified weather information used directly or indirectly to make aviation decisions. The Cube will yield complete and efficient access to weather information and observations required for analyses and forecasts of weather for decision makers in the NAS. Selected weather data from the Cube will be merged and processed to facilitate a consistent common weather picture to support Air Traffic Management decision-making; this subset of the Cube is known as the 4-D Weather Single Authoritative Source (SAS). Thus, for a given point in space and time, there will be only one observation or forecast source used for decision making. Additional details on both the Cube and the SAS can be found in the “Four-Dimensional Weather Functional Requirements for NextGen Air Traffic Management” published by the JPDO.
The RWI program will produce improved weather observation and forecast information so that NextGen users can accurately and quickly assess the current and future state of the atmosphere. Resulting capabilities will then significantly improve diagnoses of weather (Improve Weather Observations Figure 1.1) impacts to aviation (e.g., turbulence and icing conditions). To support these goals the RightSizing project is funded via the RWI program and will address the challenges of optimizing the weather observing network to support NextGen.
1.2 RightSizing Project Goals
For FY09, the RightSizing project was directed toward two goals:
1. An assessment of the sensor network anticipated at NextGen IOC (2013).
o Includes a preliminary completion of a survey of the characteristics of observing systems and initial identification of significant gaps in observation capabilities based on NextGen functional requirements.
2. Completion of an initial version of a RightSizing
Master Plan.
o A plan of plan for all activities associated with the evolution of the sensor network for NextGen.
These goals are briefly discussed in the sub-sections below.
1.2.1 AssessmentofSensorNetwork
Sensing the state of the atmosphere currently is performed by a broad network of sensors owned and managed by a wide variety of governmental agencies. These sensor networks encompass a multitude of different technologies, including:
• Satellites (geosynchronous and polar orbiters) ,
• Radars, including NEXRAD (Next Generation Weather Radar) , TDWR (Terminal Doppler Weather Radar) and ASR 9 and 11.
• Airborne sensors
• Surface sensors including:
o ASOS (Automated Surface Observing System),
o AWOS (Automated Weather Observing System),
o RVR (Runway Visual Range),
o LLWAS (Low Level Wind Shear Alert System),
o AWS (Air Weather Station),
o SAWS (Stand-Alone Weather Station).
The NAS uses this information in two basic ways, to enhance safety and to increase capacity. RightSizing started the assessment by developing an inventory of sensors; however a thorough understanding of the capabilities of each sensor to perform in a NextGen environment was required to adequately perform the tasked assessment. Thus existing sensor capabilities needed to be assessed per NextGen weather observational requirements.

RightSizing Project NextGen IOC Sensor Assessment Summary
AJP-6830 8 of 64 December 1, 2009
1.2.2 Functionalandperformancerequirements
The Four-Dimensional Weather Functional Requirements for NextGen Air Traffic Management, published by the JPDO Weather Functional Requirements Study Team on January 18, 2008, formed the basis and framework for the (IOC) assessment activity. Using the functional requirements for this assessment has limitations, as the requirements are for NextGen Final Operating Capability (FOC 2025) and have not been completely vetted by the user community. However the information was deemed mature enough to employ as a basis for performing the sensor assessment. As a result, the original organization of the functional requirements has been maintained in order to preserve traceability between the sensor capabilities and NextGen functional requirements.
Likewise the performance requirements from the NNEW/RWI Preliminary Portfolio Requirements document published by the Aviation Weather Office in September of 2008 are applicable to NextGen FOC. These performance requirements currently are very broad and lack the detail to provide a performance-based assessment. They were included in the sensor assessment effort to show common traceability to both functional and performance requirements. This effort will mature as the performance requirements mature.
1.2.3 DevelopmentofmasterplantomeetNextGenweatherobservationrequirements
Coincident with the IOC Assessment effort in FY09 is the development of the RightSizing Master Plan which will govern and guide RightSizing activities (initialized by the IOC Sensor Assessment) into the future. The plan will organize all of the assessment, gap identification, gap analysis, and gap mitigation activities that fall under the RightSizing umbrella.
The development and effective execution of this long-term Master Plan will include developing strategies for more effective use of existing data, continually assessing functional and performance requirements, providing a technology pathway that incorporates
dynamic adaptive sensing, cyberinfrastructure, and numerical prediction.
1.2.4 Interdependencies
Because weather decision-making is inextricably woven throughout the entire NextGen concept, NextGen weather observing capabilities must be developed in full collaboration with other components of the NAS. This is particularly important in the context of dynamic adaptation, where observing systems, prediction models, and decision support tools will operate not on fixed schedules, but rather in a manner that accommodates the situation at hand whether driven by weather, air traffic, or other factors.
The number and complexity of interrelationships within the broad NextGen framework make it absolutely essential to (a) understand these relationships and (b) employ effective mechanisms for communication within and across organizations. Specific groups with which the RightSizing Team needs to engage include the NNEW Team (particularly with regard to the 4D Data Cube) and the Policy and Requirements Team (role of SAS in the 4D Data Cube). Additionally, experts from agencies, academia, and the private sector will need to be engaged to thoughtfully plan for ongoing support as well as to develop, deploy, and effectively utilize emerging observational systems in the NextGen era.

RightSizing Project NextGen IOC Sensor Assessment Summary
AJP-6830 9 of 64 December 1, 2009
2 PROGRAM MANAGEMENT AND SCHEDULE
2.1 Timeline and Deliverables
2.1.1 FY09
The schedule for the RightSizing program for FY09 is shown in Figure 2.1. The program milestones, activities, and deliverables are shown on the schedule. Although the timeline was rather limited for such a comprehensive review and further shortened by program funding delays, the goals and deliverables were met within the project schedule.
2.2 Team Organization and Responsibilities
To execute the Sensor Assessment task, an initial RightSizing Team was organized. This team is comprised of key staff from four prominent U.S. institutions, and a core group of FAA subject matter experts (SMEs) and management staff. The staffs from the four external institutions were chosen due to their expertise in meteorological observations, aviation weather product development, information management, and data visualization.
Figure2.1. FY09 Schedule.

RightSizing Project NextGen IOC Sensor Assessment Summary
AJP-6830 10 of 64 December 1, 2009
2.2.1 FAAManagement
Management of the RightSizing team is provided by the Aviation Weather Group (AJP-68) New Weather Capabilities Team (AJP-6820) RWI program.
2.2.2 RightSizingProjectManagement
AJP-6830 manages the RightSizing project and is based at the William J Hughes Technical Center in Atlantic City, NJ. The team consists of AJP-68 employees and contract support. The team is organized such that each team member has a primary area of focus as shown in the table below.
2.2.3 FundedTeamMembers
For FY09, sub-teams were created from each external institution and assigned primary responsibility for a designated set of technical topics associated with the
sensor assessment task. The institutions and their primary responsibilities are:
• National Center for Atmospheric Research (NCAR) Research Applications Laboratory (RAL): Surface sensors, including wind shear detection and liquid water equivalent, sounding systems, airborne systems, satellite systems, and observations for space weather.
• Massachusetts Institute of Technology (MIT) Lincoln Laboratory (LL): Radar and LIDAR systems (ground-based and airborne).
• University of Oklahoma (OU) and Indiana University (IU): Advanced data management and visualization, system demonstrations.
Individual membership on each RightSizing sub-team is given in tables 2.1 through 2.4 below. A brief biography of each team member is provided in Appendix B.
Table 2.1: FAA Staff Points of ContactVictor Passetti [email protected] Team LeadTammy Farrar [email protected] In-situ POCDino Rovito [email protected] LWE POCMike Richards na Satellite POCFrank Law [email protected] Contract Support, PMErnest Sessa [email protected] PM, Ground Sensor POC
FAA William J Huges Technical Center

RightSizing Project NextGen IOC Sensor Assessment Summary
AJP-6830 11 of 64 December 1, 2009
2.2.3.1 NationalCenterforAtmosphericResearch
The NCAR Research Applications Laboratory (RAL) has an aviation extensive research program (approximately $11M/year supported by FAA, NASA, NWS, and international sponsors). In particular, people working under this program have expertise in the areas of convective and winter storms, ceiling and visibility, turbulence, in-flight icing, ground
deicing, and wind shear, including development of decision support tools. Moreover, significant efforts are underway that address data visualization and dissemination, and integration with decision support tools.
Table 2.2 NCAR Project StaffingDr. Matthias Steiner [email protected] 303-497-2720 Team LeadDr. Paul Herzegh [email protected] 303-497-2820 Co-lead; ground, ceiling & visibilityMr. Larry Cornman [email protected] 303-497-8439 in-situ, turbulenceMr. Andy Gaydos [email protected] 303-497-2721 software engineering supportDr. John Hubbert [email protected] 303-497-2041 radar, ground, convective storms, in-flight icingDr. David Johnson [email protected] 303-497-8370 satellite, lightning, wind shear detectionMr. Scott Landolt [email protected] 303-497-2804 ground, liquid water equivalent Dr. Roy Rasmussen [email protected] 303-497-8430 ground, LWE
Dr. Michael Wiltberger [email protected] 303-497-1532 space weather
National Center for Atmospheric Research at Boulder, CO

RightSizing Project NextGen IOC Sensor Assessment Summary
AJP-6830 12 of 64 December 1, 2009
2.2.3.2 MITLL
Massachusetts Institute of Technology Lincoln Laboratory (MIT LL) has played a key role in the development of weather radar systems, particularly with respect to aviation needs. Among these systems are the TDWR and ASR-9 WSP. It has also developed weather products for the FAA based on other sensors such as the NEXRAD and Doppler LIDAR. Lincoln Laboratory is currently working on an advanced radar that will be capable of performing aircraft and weather
surveillance simultaneously, the Multifunction Phased Array Radar (MPAR). Weather data integration and decision support systems for aviation is also a strong focus at Lincoln Lab, both at the terminal and national levels. Sensor network coverage and cost-benefit analyses as well as development of a net-centric, system-wide information management system are also part of Lincoln Laboratory’s effort for the FAA.
Table 2.3: MIT LL Project StaffingDr. John Cho [email protected] 781-981-5335 Team Lead
Dr. Robert [email protected]
781-981-2722 Radar/LIDAR
Dr. Suilou [email protected]
781-981-2172 Radar
Massachusetts Institute 0f Technology Lincoln Laboratory

RightSizing Project NextGen IOC Sensor Assessment Summary
AJP-6830 13 of 64 December 1, 2009
2.2.3.3 OUandIU
The OU team is comprised of members from the University of Oklahoma (OU) School of Meteorology, the Center for Analysis and Prediction of Storms (CAPS), and the Oklahoma Climatological Survey (OCS). Together, these groups bring over 10 years experience in developing and deploying weather radar, surface in situ networks, and the assimilation of these data into storm-scale analysis and prediction systems. The Indiana University (IU) team is comprised of members from the School of Informatics and Computing, providing a decade of expertise in information technologies. The OU/IU team brings 7 years of experience in working collaboratively in dynamic and adaptive weather forecasting in a highly distributed network of computers and data sources,
where the overarching design principle is the service-oriented architecture (SOA). Participation by the OU/IU team is a necessary ingredient for the success of the RightSizing effort. This group, while possessing extensive credentials in the field of aviation weather, have a fresh perspective and independent approach to many of the challenges brought about by the NextGen system.
2.2.3.4 ExpandedteammembershipforFY10andbeyond
In FY10 the RightSizing team will likely expand. Two near term planned additions to the team are Earth
Table 2.4: OU and IU Project Staffing
Dr. Jerry Brotzge [email protected] 405-325-5571 Co-Team Lead (OU)Dr. Beth Plale [email protected] 812-855-4373 Co-Team Lead (IU)Dr. Kelvin Droegemeier [email protected] 405-325-6561 AdvisorMr. Andrew Reader [email protected] 405-325-1869 Project ManagerDr. Fred Carr [email protected] 405-325-6561 Observational SensingDr. Chris Fiebrich [email protected] 405-325-6877 Ground, OU Mesonet
Mr. Scott [email protected]
812-855-9761 Metadata
National Weather CenterUniversity of Oklahoma
“Big Red” Super ComputerIndiana University

RightSizing Project NextGen IOC Sensor Assessment Summary
AJP-6830 14 of 64 December 1, 2009
Systems Research Labatory (ESRL) and National Severe Storms Laboratory (NSSL). These two groups bring additional expertise in the areas of data acquisition and processing which will be critical in the NexGen NAS. ESRL has pioneered the integration of non-traditional weather sensors and networks into an operational environment with their work on the MADIS (Meteorological Assimilation Data Ingest System) network of sensors. MADIS sensors consist not only of a vast array of additional surface sensors, but also of new sensor types such as the Weather In-Situ Deployment Optimization Method (WISDOM) balloons. ESRL also has valuable experience in techniques of data quality assurance and control that will be needed to operationalize non-federal data sources and networks and to accurately characterize sensor performance. NSSL brings advanced techniques of data quality assurance and data assimilation needed to produce the NMQ (National Mosaic QPF (Quantitaitve Precipitation Forecast)) group of radar products. The NMQ 3D radar mosaics represent, at the very least, a bridge to the next generation of fully assimilated data products which will be the cornerstone of many NexGen processes and products.
In 2009 the RightSizing team accomplished the integration of the ESRL MADIS database and the NSSL NMQ 3D product set within the NexGen Weather Evaluation Capabilities (NWEC) Lab. In 2010 we will further expand this integration so that these new data sources and products may be incorporated into future RightSizing demonstrations and evaluations.
2.3 Resources
2.3.1 NOSAassessmentanddatabase
The National Oceanic and Atmospheric Administration (NOAA) Observing System Architecture (NOSA) was established to help NOAA design observing systems that support mission requirements and provide maximum value, avoid duplication, and operate efficiently and in a cost-effective manner. NOSA includes an inventory of NOAA’s observing systems (and others), and documents the relationship amongst observing systems and requirements. As NOAA is an FAA NextGen partner that shares numerous sensor capabilities, this information was heavily leveraged in
the RightSizing effort.
NOSA sensor information is made available in database form as a series of sensor platform surveys which detail the performance of each surveyed platform in observing a range of meteorological variables and phenomena. Within the database, sensor performance is broken down and characterized in great detail in areas of accuracy, precision, measurement techniques, algorithm processing, measurement timelines, sampling and reporting frequencies, geographic coverages, and many others. This terminology was leveraged for the RightSizing Sensor Assessment and the associated information for each parameter was matched with the phenomena referenced in the NextGen functional requirements.
The RightSizing Sensor Assessment activity has made extensive use of this valuable resource in developing the program deliverables, especially the Sensor IOC Spreadsheet. Queries were developed that retrieved relevant information from the NOSA database for many of the parameters called out in the functional and performance requirements and these queries returned data in a format that facilitated ingest into the RightSizing tools. Several hundred entries were made utilizing information from NOSA. The quality of the information was generally quite good, although there were some instances and data fields where the information returned was ambiguous. The general approach in these cases was to leave the entries intact. In questionable cases additional entries were created correcting or clarifying the fields in question.
2.3.2 NRC“NetworkofNetworks”report
The National Research Council (NRC) report, Observing Weather and Climate from the Ground Up: A Nationwide Network of Networks (2008), envisions a weather sensor observing system consisting of a distributed adaptive “network of networks” serving multiple environmental applications near the Earth’s surface. Jointly provided and used by government, industry, and the public, such observations are essential to enable the vital services and facilities associated with health, safety, and the economic well-being of our nation.

RightSizing Project NextGen IOC Sensor Assessment Summary
AJP-6830 15 of 64 December 1, 2009
In considering its vision for the future of weather observation networks, practical considerations weighed heavily on the NRC Committee’s deliberations and in the formulation of its recommendations. To that end, the NRC study emphasizes societal applications and related factors influencing the implementation of an enhanced observing system, the intent of which is to markedly improve weather-related services and decision-making. The NRC Committee considered the various roles to be played by federal, state, and local governments, and by commercial entities. In essence, the NRC study provides a framework and recommendations to engage the full range of providers for weather, climate, and related environmentally sensitive information, while enabling users of this information to employ an integrated national observation network effectively and efficiently in their specific applications.
This NRC study did not attempt to compile an exhaustive catalogue of mesoscale observational assets, although it identifies and summarizes numerous important sources of such information in an appendix. Nor does the study attempt to design a national network, although it does identify critical system attributes and the ingredients deemed essential to retain sustained importance and relevance to users.
2.3.2.1 AMS
The American Meteorological Society (AMS) has conducted a number of activities that substantiate its role in organizing the public response to the NRC report. The RightSizing team remained cognizant of the AMS’s activities in support of this report and seeing its recommendations come to fruition. Most members of the team attended the AMS summer meeting in Norman, OK during August of 2009 in support of these efforts. It is anticipated that the goals of future RightSizing efforts will remain compatible and synergistic with AMS efforts.
2.3.2.2 OFCM
The Office of the Federal Coordinator for Meteorological Services and Supporting Research, more briefly known as the Office of the Federal Coordinator for Meteorology (OFCM), is an interdepartmental office that was established, because Congress and the Executive Office
of the President recognized the importance of full coordination of federal meteorological activities. The Department of Commerce formed the OFCM in 1964 in response to Public Law 87-843. The OFCM’s mission is to ensure the effective use of federal meteorological resources by leading the systematic coordination of operational weather requirements and services, and supporting research, among the federal agencies. In concert with its charter the OFCM has organized the federal response to the NRC Report, and has taken charge of overseeing related efforts. The OFCM committee charged with this task is the Committee on Integrated Observing Systems (CIOS). In order to ensure efficient coordination of efforts AJP-6830 is a member of the CIOS and briefed the activities, plans, and intent of the RightSizing Program and the Sensor Assessment initiative. Work and coordination will continue to ensure that OFCM CIOS and RightSizing efforts and focuses remain compatible and mutually beneficial.
2.3.3 NWS
During FY09 the RightSizing team sought to communicate and coordinate efforts with the National Weather Service (NWS). NWS Office of Science and Technology and NOAA personnel were briefed on multiple occasions regarding the project’s plans and progress. We anticipate close cooperation with NWS in the future as gap indentification and gap analysis efforts proceed.
2.3.4 NOAA/ESRLMADISsystem
MADIS is dedicated toward making value-added data available from the NOAA Earth System Research Laboratory (ESRL) Global Systems Division (GSD) for the purpose of improving weather forecasting, by providing support for data assimilation, numerical weather prediction, and other hydro-meteorological applications.
RightSizing Sensor Assessment established a con-nection to the MADIS data distribution network and leveraged this data source to study the value of incorporating MADIS data in the NextGen environment. Specifically for the IOC Sensor Assessment effort, MADIS was examined to determine what weather products rely on MADIS data for initialization and will

RightSizing Project NextGen IOC Sensor Assessment Summary
AJP-6830 16 of 64 December 1, 2009
be operational by IOC as at least some subset of the current MADIS data portfolio would then become a critical requirement for IOC.
2.3.5 DepartmentofTransportationClarusInitiative
The U.S. Department of Transportation (DOT) Federal Highway Administration (FHWA) Road Weather Management Program, in conjunction with the Intelligent Transportation Systems (ITS) Joint Program Office established the Clarus Initiative in 2004 to reduce the impact of adverse weather conditions on surface transportation users.
Clarus is a research and development initiative to demonstrate and evaluate the value of “Anytime, Anywhere Road Weather Information” that is provided by both public agencies and the private weather enterprise to the breadth of transportation users and operators. The goal of the initiative is to create a robust data assimilation, quality checking, and data dissemination system that can provide near real-time atmospheric and pavement observations from the collective states’ investments in road weather information system, environmental sensor stations (ESS), as well as mobile observations from Automated Vehicle Location (AVL) equipped trucks, and eventually passenger vehicles equipped with transceivers that will participate in the Vehicle Infrastructure Integration (VII) Initiative.
The Clarus program manager briefed the RightSizing team on the Initiative’s progress and capabilities, and a connection has been established between RightSizing and some of the Clarus data sources. Clarus was engaged to determine if new capabilities would be available to support the NAS in the IOC time frame and also to determine to what extent the Clarus data might be operationalized by partner agencies (e.g. NWS and NOAA) in order to produce the NextGen weather data
products.

RightSizing Project NextGen IOC Sensor Assessment Summary
AJP-6830 17 of 64 December 1, 2009
3 SCOPE AND METHODOLOGY
The broad aim of the Sensor Assessment is to characterize the anticipated state of the weather sensor network that will support the NAS at NextGen’s IOC (2013). This section discusses the methodology that was utilized, the motivations for going down this path, and associated assumptions and limitations.
3.1 Approach
Although this study is an assessment of sensors, its raison d’être is the weather information needs of NextGen. Therefore, rather than just developing a catalog of sensors and their characteristics, the team looked to inventory sensor capabilities per NextGen requirements for weather observations. However, development efforts associated with both functional and performance requirements for NextGen weather
observations are ongoing, leaving the assessment effort having to make do with the best information available at the time. For much of FY09, the functional requirements for NextGen found in “Four-Dimensional Weather Functional Requirements for NextGen Air Traffic Management” were used as a starting point for assessing the sensor network capability at 2013.
The Functional Requirements are organized in a hierarchical relationship. This hierarchical relationship is demonstrated in the example below (in this case “Determine the Horizontal Extent of Rain”). Sensor assessment relative to the detailed performance requirements is still needed and will begin to be conducted in FY10.
Figure3.1. Weather observation’s place in the NextGen Services hierarchy.

RightSizing Project NextGen IOC Sensor Assessment Summary
AJP-6830 18 of 64 December 1, 2009
3.1.1 TheSensorAssessmentSpreadsheet
To create a manageable structure for the sensor assessment we chose to employ an Excel spreadsheet to associate the 309 functional requirements (down the column) with the sensor capabilities (across the row). This structure allowed any sensor identified by the sub teams for a particular requirement to be associated with an individual requirement entry and multiple sensors could also be linked with a single requirement. The columns to the right were used to list the various sensor characteristics and attributes. The column labels and their descriptions are listed in Appendix A. As the spreadsheet was also populated with information from NOAA’s NOSA database, the sub teams were tasked to perform an assessment of NOSA information and note discrepancies.
3.1.2 Collaboration
In order to facilitate the simultaneous entry by different individuals, the spreadsheet matrix was translated into an NCAR-developed web-based interactive form that updated a master database in real time. In addition to individually filling in this assessment matrix, team members held biweekly teleconferences to discuss issues and findings as related to the effort and gathered
for a three-day RightSizing workshop to exchange information and ideas, and to formulate plans.
As the sensor assessment matrix was completed, individual team members took note of any functional requirements that lacked an association with a sensor capability. At the workshop mentioned above, these functional gaps were brought forth for consideration and collated into a preliminary list. The various categories of gaps are discussed in section 3.3.4. After the process of populating the assessment matrix came to a close, a more diligent search for gaps was conducted making full use of the information gathered. The team was not limited to exposing gaps relative to the weather observation requirements. If there were sensing needs particular to aviation that appeared to have been missed in the functional requirements, these instances were noted as well.
3.2 Priorities and Limitations
The range and scope of the information required by the assessment task is extremely large. Therefore, we established a set of priorities to insure that key aspects of relevant observing systems would be considered in the assessment. These key aspects are outlined in the following sub-sections.
The Sensor Assessment Spreadsheet

RightSizing Project NextGen IOC Sensor Assessment Summary
AJP-6830 19 of 64 December 1, 2009
3.2.1 Sensoranddataownershipandaccess
Weather sensors are owned and operated by public and private entities. The public sector is composed of government organizations at all levels—federal, state, county, city, etc. The private sector is also diverse, including groups such as universities, television stations, power utility companies, etc. The data produced by these sensors can be categorized as open, closed, or restricted, but the categorization is not necessarily the same as the sensor ownership status. For example, a public entity (the military) can keep its data closed (classified), whereas a private organization (a university) could make its data open to the public. Data access can further be parsed according to cost (free vs. priced), latency (real-time vs. delayed/archived), format (standard vs. proprietary), etc.
With regard to the Assessment, federally owned sensors with open-access data garnered top priority. FAA owned sensors were thoroughly studied, since one of the benefits of this study was to eventually supply recommendations on future decision points in the EA Weather Sensor Roadmap. It should be noted that many non-FAA sensors do contribute to the operation of the NAS. In some cases these contributions are indirect and not easy to discern at first glance; for example, many sensors and sensor processing techniques are used for the purposes of data assimilation and model initialization. The model data may well be included and available on the NAS, while the raw data from theses sensors is not.
Privately owned sensors were also considered, if their data status was open access. Sensors that were not part of a network tended not to be included. Given the time limitations, and based on the low probability that they would be available for NextGen use at IOC, we did not include sensors with closed-access data. Relevant foreign sensor data (such as from the Canadian weather radars) were not excluded from consideration, but were given low priority.
3.2.2 Sensorsandtheirproducts
Although the assessment matrix is an attempt to match sensors to weather observation requirements, in most cases useful weather information (the product)
is not obtained directly from the raw data output of the sensor. Usually, the raw data are processed further within what is defined to be the sensor’s own hardware and/or outside it. In some cases the processing incorporates data from other sensors (of the same kind, different, or both). In other cases the processing combines numerical model output data with the sensor data to generate the weather product. Therefore, an entry in the assessment matrix is usually a specific sensor product rather than the sensor itself. We gave high priority to single-sensor products and to the sensors that play a significant role in multi-sensor products, including sensors that are critical to numerical weather prediction.
3.2.3 Sensorstatus
Sensors (and their data products) are in various stages of technological maturity. Some sensors have been in operational mode for many years, while others are still considered research projects. The emphasis was on systems that are currently operational. However, since the assessment was for a future time (the NextGen IOC is planned for 2013), we also considered sensors and products that are expected to be ready for operational use at that time. Discussion of additional systems and processing algorithms, whose future availability is more uncertain, were included, if there is a possibility of a functional gap without them.
All sensors have a finite lifetime and require maintenance, upgrade, and, eventually, replacement. In assessing the status of sensors for the future (NextGen IOC and beyond), we need to take into account a sensor’s life cycle and the current schedule (if it exists) for upkeep and/or replacement. The risks associated with the possible future unavailability of key sensors are noted in section 4.1.
3.2.4 Functionandperformance
The examination of sensors to date has emphasized functional capabilities rather than specific performance metrics. Capabilities relating to performance, such as measurement accuracy, sensitivity range, or data latency, will begin to be examined as part of FY10’s gap analysis, provided the performance requirements become available.
RightSizing Project NextGen IOC Sensor Assessment Summary
AJP-6830 20 of 64 December 1, 2009
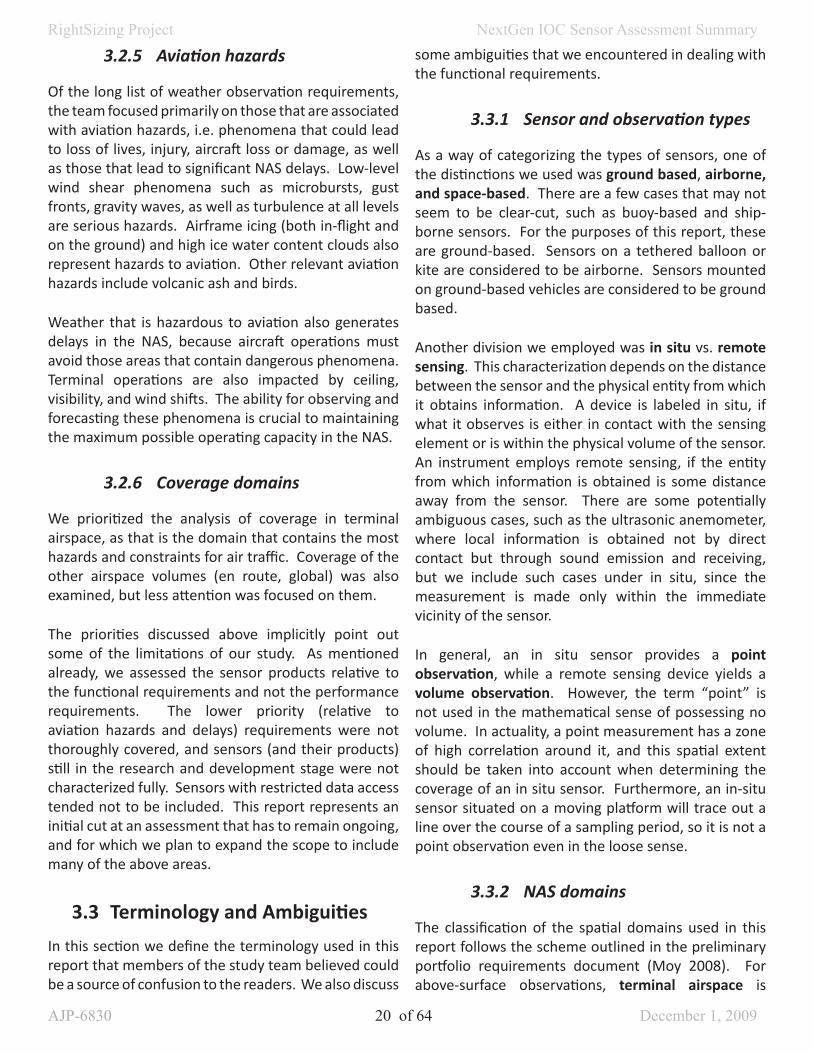
3.2.5 Aviationhazards
Of the long list of weather observation requirements, the team focused primarily on those that are associated with aviation hazards, i.e. phenomena that could lead to loss of lives, injury, aircraft loss or damage, as well as those that lead to significant NAS delays. Low-level wind shear phenomena such as microbursts, gust fronts, gravity waves, as well as turbulence at all levels are serious hazards. Airframe icing (both in-flight and on the ground) and high ice water content clouds also represent hazards to aviation. Other relevant aviation hazards include volcanic ash and birds.
Weather that is hazardous to aviation also generates delays in the NAS, because aircraft operations must avoid those areas that contain dangerous phenomena. Terminal operations are also impacted by ceiling, visibility, and wind shifts. The ability for observing and forecasting these phenomena is crucial to maintaining the maximum possible operating capacity in the NAS.
3.2.6 Coveragedomains
We prioritized the analysis of coverage in terminal airspace, as that is the domain that contains the most hazards and constraints for air traffic. Coverage of the other airspace volumes (en route, global) was also examined, but less attention was focused on them.
The priorities discussed above implicitly point out some of the limitations of our study. As mentioned already, we assessed the sensor products relative to the functional requirements and not the performance requirements. The lower priority (relative to aviation hazards and delays) requirements were not thoroughly covered, and sensors (and their products) still in the research and development stage were not characterized fully. Sensors with restricted data access tended not to be included. This report represents an initial cut at an assessment that has to remain ongoing, and for which we plan to expand the scope to include many of the above areas.
3.3 Terminology and Ambiguities
In this section we define the terminology used in this report that members of the study team believed could be a source of confusion to the readers. We also discuss
some ambiguities that we encountered in dealing with the functional requirements.
3.3.1 Sensorandobservationtypes
As a way of categorizing the types of sensors, one of the distinctions we used was ground based, airborne, and space-based. There are a few cases that may not seem to be clear-cut, such as buoy-based and ship-borne sensors. For the purposes of this report, these are ground-based. Sensors on a tethered balloon or kite are considered to be airborne. Sensors mounted on ground-based vehicles are considered to be ground based.
Another division we employed was in situ vs. remote sensing. This characterization depends on the distance between the sensor and the physical entity from which it obtains information. A device is labeled in situ, if what it observes is either in contact with the sensing element or is within the physical volume of the sensor. An instrument employs remote sensing, if the entity from which information is obtained is some distance away from the sensor. There are some potentially ambiguous cases, such as the ultrasonic anemometer, where local information is obtained not by direct contact but through sound emission and receiving, but we include such cases under in situ, since the measurement is made only within the immediate vicinity of the sensor.
In general, an in situ sensor provides a point observation, while a remote sensing device yields a volume observation. However, the term “point” is not used in the mathematical sense of possessing no volume. In actuality, a point measurement has a zone of high correlation around it, and this spatial extent should be taken into account when determining the coverage of an in situ sensor. Furthermore, an in-situ sensor situated on a moving platform will trace out a line over the course of a sampling period, so it is not a point observation even in the loose sense.
3.3.2 NASdomains
The classification of the spatial domains used in this report follows the scheme outlined in the preliminary portfolio requirements document (Moy 2008). For above-surface observations, terminal airspace is

RightSizing Project NextGen IOC Sensor Assessment Summary
AJP-6830 21 of 64 December 1, 2009
the volume of airspace within 100 km of airport centerfield from the ground up to the top of the terminal volume. En route airspace is the volume of non-oceanic national airspace system (NAS) not occupied by terminal airspace. Global airspace is the union of oceanic and non-NAS airspace. For surface observations, the terminal area refers to certain designated areas at airports. En route area covers the NAS surface areas minus the terminal areas. Global area indicates surface areas outside the NAS.
3.3.3 Datacharacteristics
Accuracy and precision are often used as complemen-tary terms to characterize the measurement performance of a sensor. However, according to the International Organization for Standardization (ISO), both are qualitative terms and have multiple definitions (ISO 1993). Thus, the use of accuracy and precision should be avoided in expressing quantitative parameters. Instead we opt to quantify the uncertainty, a parameter that characterizes the range of values in which the measured value lies within a specified confidence level. Although all three terms were listed in the assessment matrix, uncertainty will be the key quantity going forward.
We should also clarify the difference between resolution and reporting quantization. The former has real physical significance, while the latter is only the fineness of scale at which measured or derived results are reported or displayed. In the spatial domain, reporting quantization may be called grid spacing, gate interval, pixel size, etc. In the temporal domain, it may be referred to with terms such as reporting interval, output frequency, sample spacing, etc. These quantities should not be confused with the resolution, which defines the range within which the measurement is valid and independent of the neighboring measurements. It is possible for resolution and reporting quantization to have the same value, but in general they do not. If the reporting quantization interval is smaller than the resolution interval, the results are oversampled; if the reverse is true, then the results are undersampled. As discussed in section 3.2.2, various levels of processing are applied to raw sensor data to generate weather products. If a sensor product is directly related to the sensor measurement, it is classified as measured. Otherwise, the product is labeled derived.
The functional requirements themselves draw upon a wide variety of observational categories. Some requirements are measurements of a parameter or quantity (such as temperature or wind speed), while others are observations of a phenomenon (such as blowing spray or fog patch). The degree to which each requirement is defined, therefore, varied greatly. Also, the diversity in observational types created some ambiguity in filling out the parameter columns in the sensor assessment matrix. An effort was made to document the assumptions made in dealing with these ambiguities.
3.3.4 Observingsystem“gaps”
As one of the main goals of this sensor assessment is to identify gaps in meeting the weather observation requirements, we need to discuss what we mean by a gap. Although in many cases the term “gap,” in the context of observing systems, connotes a geographic or volumetric space devoid of or containing only limited observations, its meaning in NextGen is far broader. For example, gaps exist in our understanding of atmospheric phenomena as well as technologies for observing it. Certain key parameters, for example in space weather, are not now observed though technologies for doing so are under development. Capability gaps exist even though technologies might be available, and such gaps need not reside in the observing systems themselves.
Another important consideration is that gaps need not always be filled by observations. Modern data assimilation systems can, in certain cases, retrieve unobserved parameters with sufficient fidelity, and at far less cost, than actual observing systems. Consequently, the notion of gap analysis and mitigation extends beyond observing systems themselves into numerical prediction and decision support tools.
At the most basic level, there could be a knowledge gap, where there is not enough understanding on how to make measurements (or even what measurements to make) to meet an observation requirement. Given the appropriate knowledge, there could still be an engineering gap, where the technology necessary for building the needed sensor (and/or sensor platform) does not exist yet. If the sensor is built and deployed for research, time and effort are still needed to bring it to robust operational status; in the mean time, there is

RightSizing Project NextGen IOC Sensor Assessment Summary
AJP-6830 22 of 64 December 1, 2009
an operational gap. For a derived product, there will be a product gap until an algorithm for generating it is developed, implemented, and validated.
With the availability of a sensor product capable of fulfilling a functional requirement, there are still other types of potential gaps. If the spatial domain over which the requirement is defined is not completely covered, then there is a spatial coverage gap. If the required time coverage (e.g., 24/7) cannot be met, then there is a temporal coverage gap. If any of the performance requirements are not met, then there is a performance gap. There may be a communication gap, if access to the sensor product is restricted or if the data transfer infrastructure is inadequate, resulting in missed and/or tardy data. And in the context of the NNEW program and the NRC network-of-networks vision, a metadata gap can hinder the proper characterization, dissemination, and usage of the sensor product. A dynamic gap could occur temporarily due to sensor failure, network or power interruption, sabotage, or a natural disaster, etc. Finally, any of these gaps can be directly or indirectly produced by a funding gap.
Although the different gap parameters exist independently, they need to be examined within the context of one another. For example, performance parameters are often dependent on the coverage domain. Therefore, in such a case, a gap should be defined jointly with respect to both spatial coverage and performance parameters.
As the term “RightSizing” implies, the assessment of observational capabilities is not only a search for gaps, but it also includes ferreting out any redundancies. If multiple sensors yield the same information covering the same space-time domain, it may be possible to maintain the same observational capability with reduced costs by decommissioning some of the sensors. Even if the information provided by multiple sensors is not completely redundant, it may be possible to deploy new multifunctional systems that provide equivalent coverage with a fewer number of sensors—an example is the proposed Multifunction Phased Array Radar (MPAR) to replace weather and aircraft surveillance radars. Also, as discussed briefly above, use of data assimilation techniques may result in the reduction of deployed observational systems by optimizing the location and density of sensors necessary for required data accuracy. However, without the observational
performance requirements, it is not possible to declare that the coverage provided by two sensors is truly redundant, i.e. that they both produce data that meet those performance requirements. Therefore, for this stage of the right-sizing sensor assessment, we did not
attempt to identify redundancies.
RightSizing Project NextGen IOC Sensor Assessment Summary
AJP-6830 23 of 64 December 1, 2009
4 IOC ASSESSMENT AND INITIAL FINDINGS
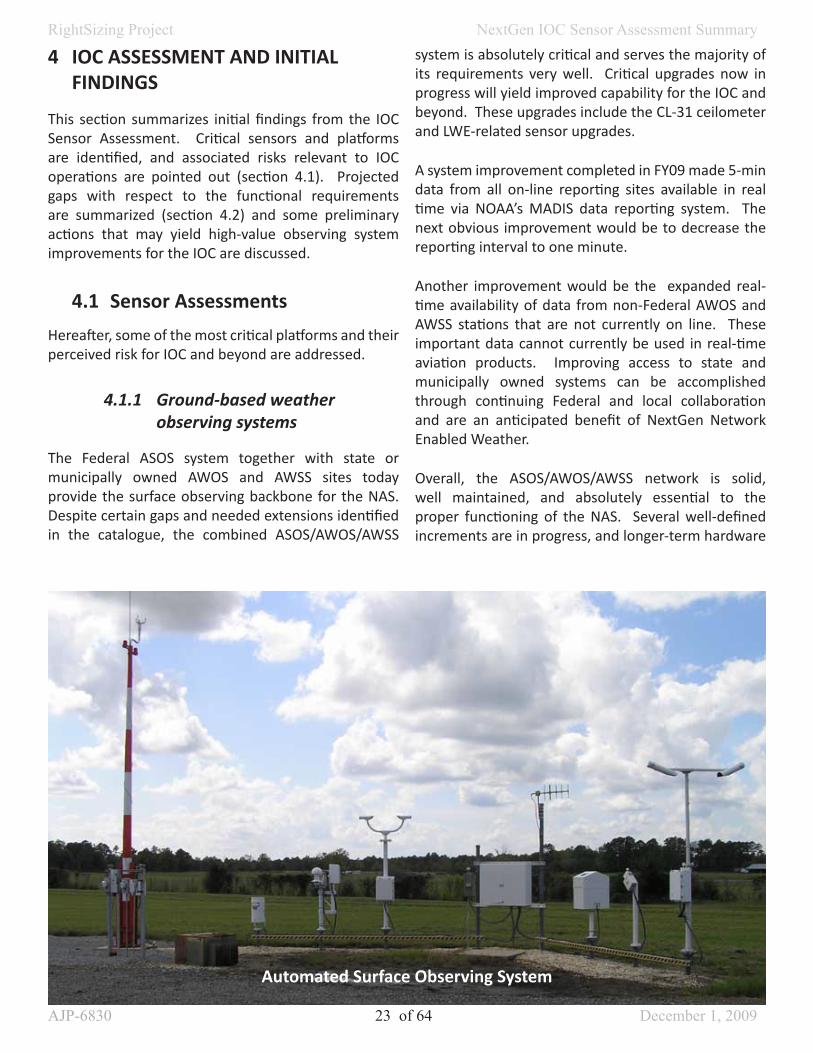
This section summarizes initial findings from the IOC Sensor Assessment. Critical sensors and platforms are identified, and associated risks relevant to IOC operations are pointed out (section 4.1). Projected gaps with respect to the functional requirements are summarized (section 4.2) and some preliminary actions that may yield high-value observing system improvements for the IOC are discussed.
4.1 Sensor Assessments
Hereafter, some of the most critical platforms and their perceived risk for IOC and beyond are addressed.
4.1.1 Ground-basedweatherobservingsystems
The Federal ASOS system together with state or municipally owned AWOS and AWSS sites today provide the surface observing backbone for the NAS. Despite certain gaps and needed extensions identified in the catalogue, the combined ASOS/AWOS/AWSS
system is absolutely critical and serves the majority of its requirements very well. Critical upgrades now in progress will yield improved capability for the IOC and beyond. These upgrades include the CL-31 ceilometer and LWE-related sensor upgrades.
A system improvement completed in FY09 made 5-min data from all on-line reporting sites available in real time via NOAA’s MADIS data reporting system. The next obvious improvement would be to decrease the reporting interval to one minute.
Another improvement would be the expanded real-time availability of data from non-Federal AWOS and AWSS stations that are not currently on line. These important data cannot currently be used in real-time aviation products. Improving access to state and municipally owned systems can be accomplished through continuing Federal and local collaboration and are an anticipated benefit of NextGen Network Enabled Weather.
Overall, the ASOS/AWOS/AWSS network is solid, well maintained, and absolutely essential to the proper functioning of the NAS. Several well-defined increments are in progress, and longer-term hardware
Automated Surface Observing System

RightSizing Project NextGen IOC Sensor Assessment Summary
AJP-6830 24 of 64 December 1, 2009
and software suitability are under systematic review to support planning for future system support and evolution.
4.1.1.1 TheLiquidWaterEquivalent(LWE)
LWE was a specialized subset of the assessment due to ongoing activties within the FAA associated with this emerging capability. LWE upgrades are intended to support an effective ground de-icing program (GDIP) at airports where freezing/frozen precipitation is common. Airport weather observation reports are fundamental in GDIP decision making. The pilot must determine the time allowed between the end of the deicing/anti-icing fluid application and aircraft take off. To ensure that the allowance time is optimum, yet does not compromise safety, weather reports used in the allowance time determination must be timely and represent current conditions at the aircraft site.
Because of shortfalls in the current ASOS detection and reporting system, improvements in weather support to the ground deicing program will need to involve the upgrading of two present ASOS detection sensors and the ASOS Control Unit. ASOS currently detects the type of precipitation occurring at a location by use of two sensors called the Light Emitting Diode Weather Identifier (LEDWI) and the Freezing Rain Sensor. Beyond freezing rain and snow, the LEDWI and the Freezing Rain sensors are not capable of accurately detecting other types of freezing and frozen precipitation. An improved detection sensor called the Enhanced Precipitation Indicator (EPI) is needed and is currently undergoing a proof of concept by the NWS. When deployed, the EPI will be capable of accurately detecting all forms of precipitation.
There are presently two different sensors being used by ASOS for measurement of precipitation. At most FAA ASOS sites there is a Heated Tipping Bucket (HTB) rain gauge. The HTB measures precipitation by tipping and recording every .01 inch of accumulation. The HTB is designed to use a heated funnel to melt frozen and freezing precipitation but has been proven to be ineffective during winter precipitation events.
At NWS ASOS sites and 22 FAA ASOS sites, because of the inefficiencies of the HTB sensor, the HTB has
been replaced with a sensor called the All Weather Precipitation Accumulation Gauge (AWPAG). Research by NCAR has shown that measurement of a LWE rate gives the most accurate determination of the intensities of freezing/frozen precipitation. The implementation in ASOS to measure the most accurate intensity of all freezing/frozen precipitation will require the addition of a one minute LWE rate capability algorithm. To do this, ASOS will need software upgrades to the AWPAG and the ASOS Acquisition Control Unit (ACU). The AWPAG currently measures accumulation by collecting precipitation and weighing the total accumulation. It uses antifreeze to liquefy collected freezing/frozen precipitation and reports hourly in .01 inch increments in METAR. The AWPAG does not currently provide a one minute LWE rate. Also a wind-shield modification is currently being tested to reduce the effects of blowing snow on the accuracy of the AWPAG.
4.1.2 Windsheardetectionsystems
The terminal-area wind shear sensing requirements are some of the most critical observational tasks within the NAS. Microbursts along the paths of approach, landing, and departure are among the most treacherous weather phenomena for aviation. With
All Weather Precipitation Accumulation Gauge (AWPAG)
RightSizing Project NextGen IOC Sensor Assessment Summary
AJP-6830 25 of 64 December 1, 2009
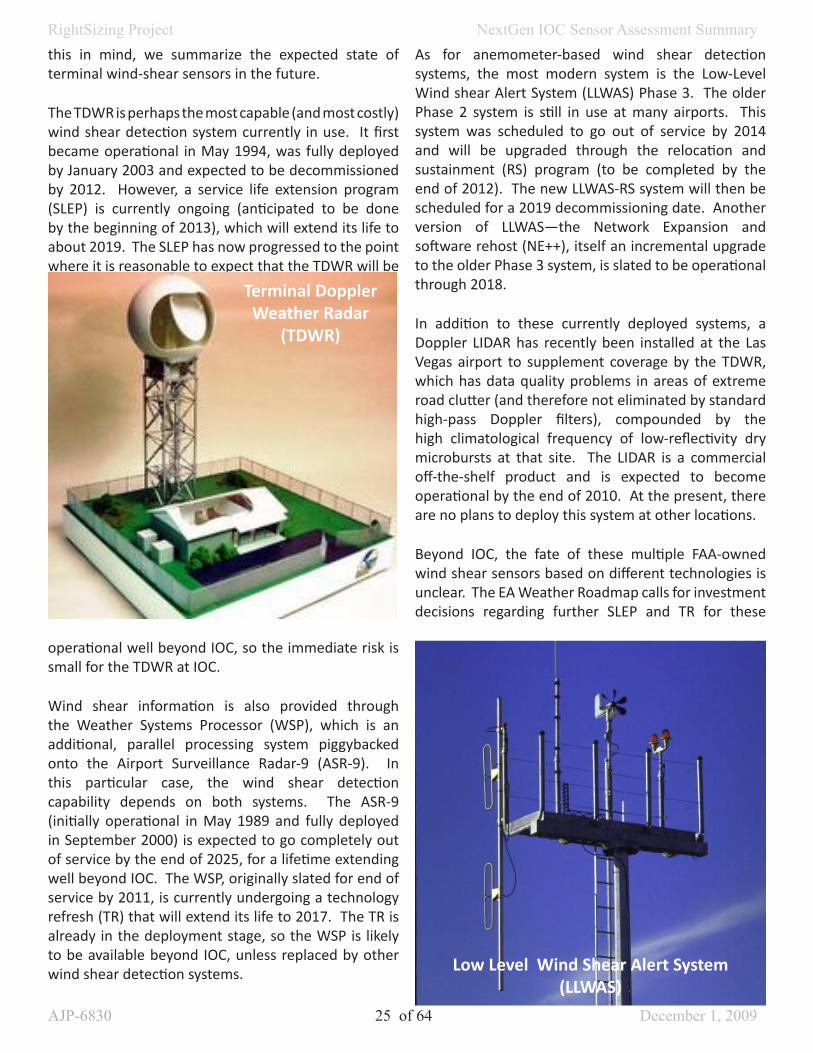
this in mind, we summarize the expected state of terminal wind-shear sensors in the future.
The TDWR is perhaps the most capable (and most costly) wind shear detection system currently in use. It first became operational in May 1994, was fully deployed by January 2003 and expected to be decommissioned by 2012. However, a service life extension program (SLEP) is currently ongoing (anticipated to be done by the beginning of 2013), which will extend its life to about 2019. The SLEP has now progressed to the point where it is reasonable to expect that the TDWR will be
operational well beyond IOC, so the immediate risk is small for the TDWR at IOC.
Wind shear information is also provided through the Weather Systems Processor (WSP), which is an additional, parallel processing system piggybacked onto the Airport Surveillance Radar-9 (ASR-9). In this particular case, the wind shear detection capability depends on both systems. The ASR-9 (initially operational in May 1989 and fully deployed in September 2000) is expected to go completely out of service by the end of 2025, for a lifetime extending well beyond IOC. The WSP, originally slated for end of service by 2011, is currently undergoing a technology refresh (TR) that will extend its life to 2017. The TR is already in the deployment stage, so the WSP is likely to be available beyond IOC, unless replaced by other wind shear detection systems.
As for anemometer-based wind shear detection systems, the most modern system is the Low-Level Wind shear Alert System (LLWAS) Phase 3. The older Phase 2 system is still in use at many airports. This system was scheduled to go out of service by 2014 and will be upgraded through the relocation and sustainment (RS) program (to be completed by the end of 2012). The new LLWAS-RS system will then be scheduled for a 2019 decommissioning date. Another version of LLWAS—the Network Expansion and software rehost (NE++), itself an incremental upgrade to the older Phase 3 system, is slated to be operational through 2018.
In addition to these currently deployed systems, a Doppler LIDAR has recently been installed at the Las Vegas airport to supplement coverage by the TDWR, which has data quality problems in areas of extreme road clutter (and therefore not eliminated by standard high-pass Doppler filters), compounded by the high climatological frequency of low-reflectivity dry microbursts at that site. The LIDAR is a commercial off-the-shelf product and is expected to become operational by the end of 2010. At the present, there are no plans to deploy this system at other locations.
Beyond IOC, the fate of these multiple FAA-owned wind shear sensors based on different technologies is unclear. The EA Weather Roadmap calls for investment decisions regarding further SLEP and TR for these
Terminal Doppler Weather Radar
(TDWR)
Low Level Wind Shear Alert System(LLWAS)

RightSizing Project NextGen IOC Sensor Assessment Summary
AJP-6830 26 of 64 December 1, 2009
sensors in 2010 (initial) and 2012 (final). An even bigger decision point looms in 2016, with a wider range of options such as the replacement of terminal wind shear detectors and all weather surveillance radars (including NEXRAD) with an MPAR. It is important to note that the multi-faceted performance capabilities of this radar system still have to be demonstrated. In addition, its success in meeting multiple functions will depend critically upon the successful siting of each radar.
Airborne wind shear detectors, operating on the data provided by the weather radar in the aircraft’s nose cone, are an important supplement to ground-based systems. These so-called predictive wind shear (PWS) radars, however, are not capable enough to replace their earth-bound counterparts (Hallowell et al. 2009). The equipage rate of commercial aircraft with PWS radars has been increasing over time (up to 67% in September 2007, Hallowell et al. 2009). PWS radar equipage for regional jets and most general aviation aircraft, however, is not expected to reach significant numbers.
4.1.3 Weatherradarsystems
The NEXRAD’s combination of spatial and temporal resolution across terminal and en route domains yields observing capabilities that are clearly essential to NAS operations. While the NEXRAD observations, extending to 143 mile radii around the radars, “cover” nearly the entire CONUS at 3-km AGL, 70% of the boundary layer is unobserved, because of earth curvature and blockage effects. Thus, while being an invaluable resource, there are also large coverage gaps, which, if closed, would provide valuable new information.
The NEXRAD is currently undergoing an upgrade. The initial phase of transforming NEXRAD signal processing and product generation platforms into open systems has been completed, and the systems are being upgraded to have dual-polarization capabilities. The current schedule calls for the dual-polarization system to be deployed nationwide by September 2012, and there are corresponding IOC observational requirements that depend upon dual-polarization radar products. Among these are the identification and differentiation of rain, hail, ice crystals, ice, graupel, and biological scatters, as well as potential applications for detecting ash plumes, forest fire plumes, tornado debris, and icing hazards.
Polarimetric radar information is also highly beneficial for data quality assurance (e.g., detection of ground clutter or rain-snow boundaries).
The dual-polarization applications outlined above are clearly at risk for IOC. The required hardware upgrades are not expected to be in place before late 2012, and the operational implementation of software builds that incorporate dual-polarization product algorithms will likely lag behind the hardware schedule. To accomplish these goals, future work must focus on 1) investment in signal processing, 2) data quality control and metrics, 3) availability of other data sources, and 4) verification studies.
Beyond IOC, NEXRAD is subject to the EA Weather Roadmap decision point in 2016.
4.1.4 Satelliteweatherobservingsystems
Satellite-based sensors provide a unique vantage point for monitoring the weather, with global coverage and ever increasing capabilities. Satellite observations are
NEXRAD Radome

RightSizing Project NextGen IOC Sensor Assessment Summary
AJP-6830 27 of 64 December 1, 2009
uniquely important for providing weather information for oceanic and polar flights, which are generally out of range of our normal networks of traditional meteorological sensors. The current dual geostationary satellites provide relatively rapidly updated, multi-spectral imagery that complements our national meteorological radar network.
At present, however, advanced aviation applications using satellite observations are limited by the spatial resolution, update rate, and coverage available today. Coverage is optimized over the CONUS, with normal update rates of 15 min. Outside of the CONUS, however, the update rate generally drops to 30 min, and once every three hours for a full disk scan. These capabilities will not change before IOC.
The Geostationary Operational Environmental Satellite-R (GOES-R) series of geostationary satellites currently being developed will vastly enhance earth observing capabilities, and significantly improve operational satellite capabilities for supporting aviation applications. The GOES-R Advanced Baseline Imager (ABI) will provide significantly enhanced spatial resolution, increased multi-spectral coverage, and faster update rates. Normal CONUS coverage will be available with 5 min updates (matching our current NEXRAD volume-scan update rate), and 15 min full-disk updates. This will provide true operational capabilities for monitoring storms in oceanic flight areas. The current estimated launch date for GOES-R is FY2015.
While the GOES-R family of satellites will provide significant enhancements over current systems, it will still be missing an advanced, multi-spectral sounding system that can provide significant advances in detecting volcanic ash, chemical constituents, stability profiles, and improved height assignment of tracked cloud and water vapor features used for mid and upper level wind analyses. The increased data rates from these satellites will also require streamlined procedures for the rapid dissemination of the real-time observations to aviation users.
The next generation of polar orbiting satellites, the National Polar-orbiting Operational Environmental Satellite System (NPOESS), will also provide significantly enhanced capabilities for supporting aviation, particularly for flights over polar regions. In particular, the enhanced visible and IR imager (VIIRS)
will provide very significantly higher resolution imagery with increased multi-spectral capabilities, and will be complemented by the Cross-track Infrared Sounder (CrIS). Like the GOES-R series of geostationary satellites, NPOESS operational satellites will not be available for IOC, with the first launch currently anticipated for 2014 (but with a prototype satellite anticipated to be launched in 2011).
Perhaps the most critical problem for using NPOESS satellites to support aviation will be the development of procedures and facilities for the rapid reception and dissemination of the satellites’ observations over polar regions. Considerable attention has been paid to optimizing the data collection and distribution in support of NOAA’s numerical modeling program, with an enhanced international network of receiving stations being created to collect and retransmit the observations to NCEP. For aviation applications, however, the data latency has to be even further reduced. Operationally this will require one or two additional direct reception facilities in northern polar regions with capabilities to rapidly transmit the observations to centralized aviation analysis centers, the 4D Weather Data Cube, or for the local generation of aviation products at the remote site with immediate retransmission to aircraft, ATC, and aviation support facilities.
4.1.5 Spaceweatherobservingsystems
Key platforms for the space weather requirements include the Advanced Composition Explorer (ACE), GOES, and the Solar and Heliospheric Observatory (SOHO). On the ACE satellite the Electron, Proton, and Alpha Monitor (EPAM), Magnetometer (MAG), Solar Isotope Spectrometer (SIS), and Solar Wind EPAM (SWEPAM) instruments that compose the Real-Time Solar Wind (RTSW) data stream are critical. These data are used to monitor and predict geomagnetic storm activity. The radiation and geomagnetic field sensors on the GOES satellites are critical. These sensors play a key role in monitoring radiation levels especially for solar radiation monitoring. The Large Angle and Spectrometric Coronagraph (LASCO) on SOHO is crucial for observing solar flares and coronal mass ejections. It is important to note that a fraction, including ACE and SOHO, of the sensors identified in this catalog are operated by the National Aeronautical

RightSizing Project NextGen IOC Sensor Assessment Summary
AJP-6830 28 of 64 December 1, 2009
and Space Administration (NASA) as scientific missions and as such are not guaranteed to be operational at IOC or beyond.
4.1.6 Aircraft-basedobservations
Most modern commercial aircraft have the ability to compute horizontal wind speed and direction, and measure outside air temperature. The WMO (World meteorlogical Organization)-sanctioned program for automated weather observing systems on aircraft is termed Aircraft Meteorological Data and Relay or AMDAR. The analogous US program, Meteorological Data Collection and Reporting System (MDCRS) currently includes more than 1500 aircraft from 7 participating airlines reporting wind and temperature during ascent, cruise, and descent. The rate at which the observations are made varies with airline as well as airframe. In addition, the rate varies during the course of a given flight, with a greater frequency occurring during ascent and decent portions. Airlines can either choose to downlink the observations individually, or may bundle several observations into one message. After the observations are downlinked, the ground communications provider processes and forwards them to NWS approximately every 15 minutes for inclusion into numerical weather prediction models.
These samples are raw, i.e., they are not averaged over time/space. At typical cruise speeds of large transport aircraft, three minutes (default) is approximately 40
kilometers and 15 min relates to approximately 200 km. As numerical weather prediction models begin to achieve the 10-15 km or less resolution, these widely spaced wind and temperature measurements may not provide the optimal input for these models – especially in their ability to locate frontal activity. Furthermore, it is not clear that a raw wind or temperature measurement provides the best representative data over the airspace. This is especially true for flights through frontal regions, crossing the jet stream, or encountering turbulence. On the other hand, in the terminal environment there may be some redundancy in ascent and descent reports, and so there is a potential to optimize reporting in this case.
Not only do these modern aircraft have the ability to measure and report wind and temperature, but with additional software, they have the ability to measure turbulence as well. As with the wind and temperature measurements discussed above, the turbulence metric (i.e., the eddy dissipation rate, or EDR) is an atmospheric measurement and thus aircraft independent. However, with additional information, an aircraft-dependent metric can be calculated. Through an ongoing program sponsored by the FAA, aircraft have been equipped with turbulence measurement and reporting software. The temporal resolution of these reports is 1 min, during all phases of flight. As of the time of this writing (Fall 2009), approximately 170 aircraft are reporting EDR, with >300 more to be deployed in CY10. Since turbulence can change rapidly in both space and time, many more aircraft can be

RightSizing Project NextGen IOC Sensor Assessment Summary
AJP-6830 29 of 64 December 1, 2009
TAMDAR Sensor
reporting before redundant information occurs.
A NWS-sponsored program is currently working with certain airlines to equip aircraft with water vapor sensors. Ascent and descent humidity measurements will be of great value (if they are of good quality) in producing better nowcasts and forecasts of weather-related hazards like convective weather. There are approximately 5 of these water vapor sensors currently deployed and the goal of NWS is to have 400 flying by 2016.
AirDat’s Tropospheric Airborne Meteorological Data Reporting (TAMDAR) program presents another ongoing effort to equip airlines’ regional aircraft with wind, temperature, turbulence, and humidity measurement and reporting capabilities. These data may provide very useful information in the altitude ranges or geographical regions below which most large commercial aircraft fly. In particular, TAMDAR observations are triggered on pressure (rather than time) intervals during the ascent and descent phases. Time defaults are provided for portions of the flight when the aircraft is not significantly ascending or descending. Typically, observations are made at 10 hPa (300 feet) pressure intervals up to 200 hPa (6000 feet) above ground level, and at 25 hPa intervals for altitudes above 200 hPa (6000 feet) above ground level. If an observation has not been made below 20,000 feet (465 hPa) for three minutes, then an observation is triggered by time default; if an observation has not been made above 20,000 feet (465 hPa) for seven minutes, then an observation is triggered by time default as well.
4.1.7 Externalrisks
A number of natural and man-made factors external to the sensors themselves affect sensor operational status and performance. Below we discuss some of the key external factors that may influence NextGen IOC capabilities.
Radio frequency interference (RFI)
Sensor systems that share operational bandwidth in the electromagnetic spectrum with other systems are always prone to experiencing interference. Due to the ever-expanding telecommunications sector, this problem has been growing worse with time. A concrete example is the increasing RFI encountered by C-band radars worldwide. After radio local area networks (RLANs) were authorized to operate in the 5-GHz range at the World Radio Communication Conference in 2003, C-band weather radars began to observe RFI with increasing frequency. Despite the fact that the RLAN devices are required to be equipped with a dynamic frequency selection (DFS) function that, in theory, would detect radars operating in the same channel and move to a different band, presently RLAN interferes with European weather radars in 12 countries, and in the U.S. more than half of all TDWRs see RFI from unlicensed national information infrastructure (U-NII) devices. Mitigating action is being taken in both cases, but there is no guarantee that the problem will be entirely solved for these radars, nor is there any guarantee that other sources of RFI will not crop up for other weather observing systems in the near future.
Wind turbines
Given the finite extent of Earth’s oil and gas supplies, and the negative consequences associated with greenhouse-gas-induced climate change, the thrust toward renewable energy sources has accelerated in recent years. One of the fastest growing sectors in this field has been wind power. The rotating blades of a wind turbine unfortunately present a vexing clutter target for surveillance radars. The strong signal returns are splashed across the Doppler velocity spectrum rendering the retrieval of weather returns within the same pulse volume virtually impossible. Thus, large clusters of turbines in wind farms can obscure weather information in significant spatial chunks in the boundary layer, and multipath echoes can sometimes

RightSizing Project NextGen IOC Sensor Assessment Summary
AJP-6830 30 of 64 December 1, 2009
extend the contamination to virtual ranges outside of the physical windmill locations. Wind turbine interferences are currently observed by both NEXRAD and TDWR at certain sites, and, as with RFI sources, are only expected to proliferate more in the near future.
Geomagnetic storms
Satellite sensors can be vulnerable to bombardment by high-energy particles such as experienced during a geomagnetic storm. As the next solar maximum is currently predicted to occur in 2013 (coinciding with NextGen IOC) the risk of satellite coverage interruption by a solar-terrestrial event will be correspondingly heightened at that time. Ground-based sensors could also be affected indirectly via damage to the power grid caused by magnetic field fluctuation induced loop currents.
4.2 Observing System Gaps
The sub-sections below first present a high-level summary of the observing system gaps identified through analysis of the NextGen Functional Requirements document. It must be noted that the Functional Requirements Document describes requirements in the 2025 time frame, and this effort is focused primarily on IOC in 2013. Some extrapolations and assumptions were necessary to provide a framework for organizing this effort. With this in mind one may then further discuss gaps associated with specific issues or phenomena affecting the NAS.
4.2.1 Gapoverviewtables
An overview of prominent observing system gaps is compiled in three tables below. These tables describe gaps associated with ground-based sensors (table 4.1), radar/LIDAR sensors (table 4.2), and airborne/spaceborne sensors (table 4.3). The tables provide a high-level survey of gap characteristics and represent a starting point for the more detailed analysis of gaps to begin in FY10.
4.2.2 Theroleofcost-effectivehumanobservationsinfillingcurrentandfuturegaps
Although the plan is for the NextGen NAS to rely
almost exclusively on automated solutions, many functions within current aviation operations rely upon human-based, visual observations. These include, for example, identification of dust/sand swirls or storms, funnel clouds and waterspouts, blowing spray, snow, sand and widespread dust in airport areas, airport, tower, and runway visibility, biological hazards such as birds and wildlife, and many others. For most of these phenomena, application of automated observing capability is technically feasible but could be costly and would require time to develop and implement. For these reasons, many uses of human observers will likely hold for IOC. However, those phenomena whose safety impacts result in greater need for uninterrupted monitoring will motivate the search for automated observing solutions. For example, the bird strike problem falls into this category, with radar-based monitoring solutions under assessment today.
4.2.3 Dataaccessandutilizationgaps
There are many potentially useful data collected today, but for a variety of reasons they may not be available in real time. Reasons include:
• Restrictions on use imposed by the data owner (e.g., Meteosat);
• Unavailability of network communications (e.g., many AWOS sites);
• Limited or costly communications bandwidth (e.g., satellite-based aircraft downlinks);
• Limitations on operationally defined data processing and distribution practices (e.g., ASOS 1-min data);
• Limited sensor quality, maintenance, calibration, or data quality control (e.g., some surface sensors in place to support agriculture or highway transportation).
NextGen will need to facilitate better access to existing platforms and sensors, including data from networks established to support other applications such as agriculture and surface transportation, and data from systems operated by other countries. In addition, investments toward improved data quality and/or metadata are needed for communications, networking,

RightSizing Project NextGen IOC Sensor Assessment Summary
AJP-6830 31 of 64 December 1, 2009
Table 4.1: Initial Functional Gaps Associated with NAS Ground Sensors (GS)
Gap # Gap Description Comments / ImpactsTerm. Impact
En Route Impact
Global Impact
GS-1
Airport surface environment: Large airports can lack sensor coverage sufficient to characterize variable cross-airport conditions. Status: Sensor expansion is under consideration at some airports.
Negative impact on safety and capacity of ter-minal operations. Local-scale effects such as fog, spatially vari-able precipitation rate or type, spatially vari-able winds, blowing/drifting snow and others are inadequately mapped across many large airports. As a result, airport conditions are inadequately resolved and short-term terminal forecasts are hampered. Product Impact: Terminal wx analysis/forecast, Ground Deicing, Ceiling &Visibilty (C&V).
- -
GS-2
Airport boundary layer environ-ment: The 3D boundary layer structure (T, RH, winds, including horizontal and vertical shear) is not adequately observed at criti-cal, larger airports. Status: No activity.
Negative impact on safety and capacity of ter-minal operations. In combination with GS-1, hampers forecast-ing of fog and fog clearing, monitoring/fore-casting of crosswinds and turbulence, wake vortex motion/dissipation. ACARS data are useful, but PBL structure and stability not well resolved at the needed vertical and temporal resolution. Product Impact: Terminal wx analysis/forecast, C&V, Ground Deicing, future RVR forecast, future wake vortex, future noise pollution.
- -
GS-3
Ground deicing environment: Sen-sors at larger airports can be unac-ceptably far from ground deicing locations. Status: Correction in progress at some airports.
It is important to derive ground deicing re-quirements and fluid holdover times based upon accurate reporting of the varying condi-tions that impact aircraft between deicing and takeoff. Need sensors for precipitation type and rate, LWE, winds, and state parameters positioned in sufficient number to character-ize the conditions at and between the deicing location and runway take-off points. Product Impact: Ground Deicing.
- -
GS-4
ASOS data frequency: Lack of real-time access to 1-min ASOS data. Status: Solution is in planning.
Hampers recognition of current weather, rapidly changing weather conditions, and 0-3 hour forecasting. Hampers development of improved short-term forecast techniques. Product Impact: Summer and winter CoSPA (CONUS Storm Prediction Algorithm), termi-nal wx analysis/forecast, C&V, In-flight Icing, Ground Deicing, future RVR forecast, future wake vortex, future noise pollution.
-

RightSizing Project NextGen IOC Sensor Assessment Summary
AJP-6830 32 of 64 December 1, 2009
Table 4.1: Initial Functional Gaps Associated with NAS Ground Sensors (GS)
GS-5
ASOS precipitation rate: Lack of an ASOS precipitation rate output parameter. Status: Solution is in planning.
Precipitation rate is important to a number of physical processes and weather products, particularly LWE. Determination of rate for inclusion in the ASOS data stream will help as-sure product accuracy and uniformity. Product Impact: Terminal Wx analysis/fore-cast, In-flight Icing, C&V, Ground Deicing.
-
GS-6
ASOS precipitation wind effects: Low accuracy of ASOS precipita-tion accumulation data in high winds. Status: Solution is in planning.
Lack of adequate gauge shielding results in inaccurate and under-measured precipitation data (especially snow) in windy conditions. Accurate precipitation rates and accumulations are needed, particularly for deriving correct LWE measurements for use in determining fluid holdover times. Product Impact: Terminal Wx analysis/fore-cast, Ground Deicing, In-flight Icing, C&V.
-
GS-7
ASOS freezing drizzle: Lack of freezing drizzle report from ASOS. Status: Solution is in planning. FAA and NWS are exploring op-tions for implementing the Ramsey FZDZ algorithm into ASOS.
Freezing drizzle is a significant icing threat to safety due to its impact on engines and airframes. Addition of automated reports of freezing drizzle to ASOS will help assure prod-uct accuracy and ensure timely reporting when freezing drizzle conditions are present. Product Impact: Terminal Wx analysis/fore-cast, Ground Deicing, National Ceiling and Visibility Analysis (NCVA), National Ceiling and Visibility Forecast (NCVF), Current Icing Prod-uct (CIP), Forecast Icing Product (FIP).
-
GS-8
AWOS data availability: Lack of real-time networked data from many AWOS stations. Status: Uncertain.
Negatively impacts reporting and forecasting of conditions at many hundreds of smaller airports. Negatively impacts reporting and forecasting of terminal and en route conditions due to unavailability of valuable surface data. Product Impact: Rapid Refresh (RR)/High Resolution Rapid refresh (HRRR) forecasts, summer and winter CoSPA, Ground Deicing, NCVA, NCVF, CIP, FIP.
-
GS-9
AWOS precipitation data: Lack of precipitation accumulation and type determination on AWOS sta-tions. Status: Uncertain
Negatively impacts usefulness of AWOS data, particularly for determination of conditions as-sociated with ground icing. Product Impact: RR/HRRR forecasts, summer and winter CoSPA, Ground Deicing, NCVA, NCVF, CIP, FIP.
-

RightSizing Project NextGen IOC Sensor Assessment Summary
AJP-6830 33 of 64 December 1, 2009
Table 4.1: Initial Functional Gaps Associated with NAS Ground Sensors (GS)
GS-10
OCONUS ground sensors: Consid-eration of OCONUS sensor needs in critical domains such as Alaska is needed. Status: Uncertain.
Ground deicing needs will not meet NextGen long-term requirements without explicit OCO-NUS planning. Product Impact: OCONUS winter weather & ground deicing, OCONUS analysis & forecasting of C&V and in-flight icing.
-
GS-11
Thunderstorm cloud base mini-mums: No operational detection system or data products are in place. Status: Feasible through fusion of data from surface observations, soundings, and satellites. Not cur-rently under development.
Negative impact on terminal and en route flight safety and traffic capacity. Product Impact: Terminal wx analysis/forecast.
-
GS-12
Lightning: A comprehensive decision support system for ramp closure using real-time lightning detection data is needed. Status: Currently, capabilities are provided by commercial providers with limitations on sharing data. No activity toward solution.
Procedures controlling ramp closure and re-opening due to lightning threats are not optimized to a realistic depiction of the space/time aspects of detected lightning and closures are not reported to ATC personnel. Prolonged closures can impact traffic flow and flight plan-ning. Negative impact on terminal and en route traf-fic capacity, and ramp safety. Product Impact: Future terminal lightning hazard support system.
-
GS-13
Inter/intra-cloud lightning: Lim-ited capability to detect inter/intra cloud lightning. Status: Feasible, but requiring a dense surface sensor network.
Inter/intra-cloud lightning events are more numerous than cloud-to-ground strokes, and normally precede such strokes. Can provide improved warnings of developing hazards to ramp operations. Negative impact on ramp safety and terminal traffic capacity. Product Impact: Future lightning hazard sup-port system.
- -
GS-14
Supercooled large drop (SLD) de-tection: Lack of automated detec-tion, characterization and spatial distribution of SLD. Status: Detection today is by hu-man observer. Automated detec-tion utilizing surface obs, radar, satellite, and model output is feasible and development is under way.
This gap addresses the occurrence of freezing rain and freezing drizzle, with particular atten-tion toward the terminal environment, where aircraft are especially vulnerable to in-flight icing impacts. Negative impact on terminal and en route safety and traffic capacity.Product Impact: Future SLD analysis/forecast capability associated with CIP and FIP.
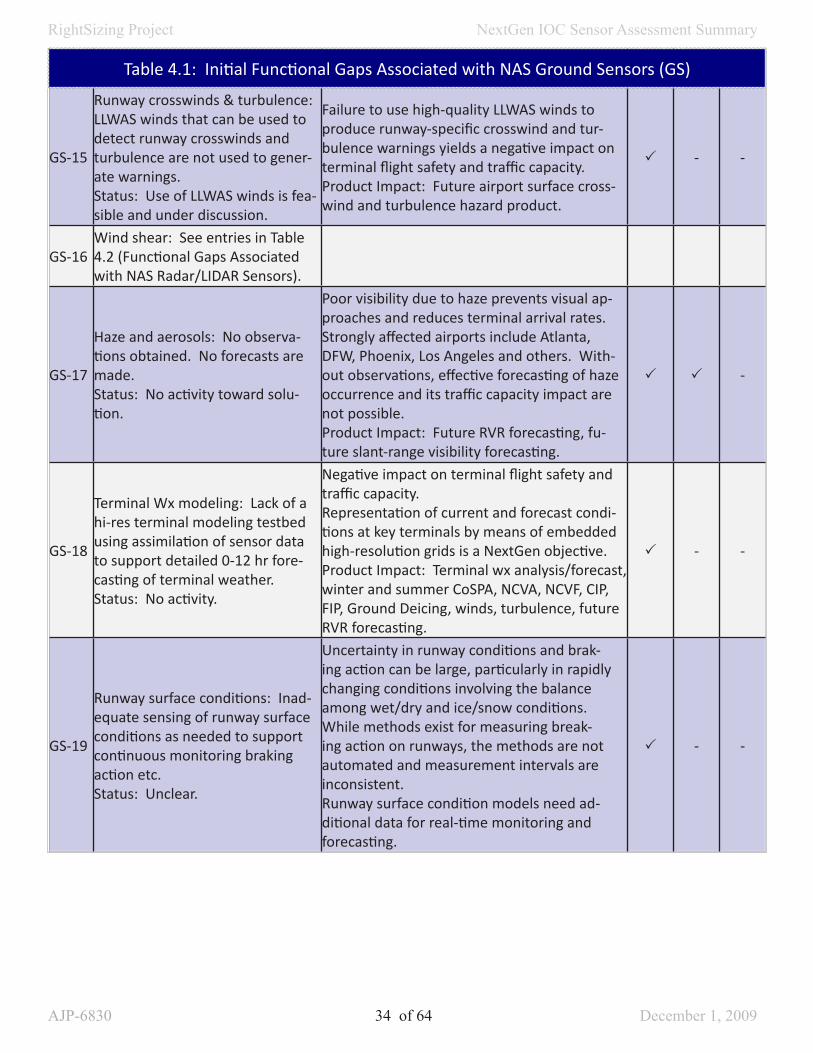
RightSizing Project NextGen IOC Sensor Assessment Summary
AJP-6830 34 of 64 December 1, 2009
Table 4.1: Initial Functional Gaps Associated with NAS Ground Sensors (GS)
GS-15
Runway crosswinds & turbulence: LLWAS winds that can be used to detect runway crosswinds and turbulence are not used to gener-ate warnings. Status: Use of LLWAS winds is fea-sible and under discussion.
Failure to use high-quality LLWAS winds to produce runway-specific crosswind and tur-bulence warnings yields a negative impact on terminal flight safety and traffic capacity. Product Impact: Future airport surface cross-wind and turbulence hazard product.
- -
GS-16Wind shear: See entries in Table 4.2 (Functional Gaps Associated with NAS Radar/LIDAR Sensors).
GS-17
Haze and aerosols: No observa-tions obtained. No forecasts are made. Status: No activity toward solu-tion.
Poor visibility due to haze prevents visual ap-proaches and reduces terminal arrival rates. Strongly affected airports include Atlanta, DFW, Phoenix, Los Angeles and others. With-out observations, effective forecasting of haze occurrence and its traffic capacity impact are not possible. Product Impact: Future RVR forecasting, fu-ture slant-range visibility forecasting.
-
GS-18
Terminal Wx modeling: Lack of a hi-res terminal modeling testbed using assimilation of sensor data to support detailed 0-12 hr fore-casting of terminal weather. Status: No activity.
Negative impact on terminal flight safety and traffic capacity. Representation of current and forecast condi-tions at key terminals by means of embedded high-resolution grids is a NextGen objective. Product Impact: Terminal wx analysis/forecast, winter and summer CoSPA, NCVA, NCVF, CIP, FIP, Ground Deicing, winds, turbulence, future RVR forecasting.
- -
GS-19
Runway surface conditions: Inad-equate sensing of runway surface conditions as needed to support continuous monitoring braking action etc. Status: Unclear.
Uncertainty in runway conditions and brak-ing action can be large, particularly in rapidly changing conditions involving the balance among wet/dry and ice/snow conditions. While methods exist for measuring break-ing action on runways, the methods are not automated and measurement intervals are inconsistent. Runway surface condition models need ad-ditional data for real-time monitoring and forecasting.
- -

RightSizing Project NextGen IOC Sensor Assessment Summary
AJP-6830 35 of 64 December 1, 2009
Table 4.2: Functional Gaps Associated with NAS Radar/LIDAR (RL) Sensors
Gap # Gap Description Comments / ImpactsTerm. Impact
En Route Impact
Global Impact
RL-1
Hydrometeor types across pre-cipitation areas: No operational detection systems or data products are in place. Status: Implementation of polari-metric capability on NEXRAD is in progress and due for completion by the end of FY12. Data products exist in prototype form and are under further development.
Inability to identify hydrometeor type (rain, aggregate snow, ice pellets, etc.) and inac-curacy in radar determination of precipitation rate, precipitation liquid water equivalent, and other properties limits the diagnosis of current conditions and the ability to forecast future conditions involving hydrometeors. Product Impact: RR/HRRR forecasts, summer and winter CoSPA, Ground Deicing, NCVA, NCVF, CIP, FIP, hail detection.
-
RL-2
TDWR convective turbulence: TDWR data are not used for con-vective turbulence detection in the terminal area. Status: Algorithms have been developed for WSR-88D radars. These algorithms can be adapted to work on the TDWR data stream.
Negative impact on terminal and en route flight safety and traffic capacity. Lost opportunity for effective use of existing TDWR data. New ground-based techniques (e.g., use of LIDAR, profiler data) need study to assess fea-sibility and utility. Product Impact: Terminal-area turbulence analysis/forecast products.
-
RL-3
Speed and direction of movement of microbursts & low-level wind shear: Stated as NextGen require-ments, but given related items, requirement intent here is unclear. Status: TDWR provides a graphical display indicating the movement of gust fronts and microbursts.
Impact on terminal flight safety and traffic capacity is uncertain. No forecast products are available, only real-time detection and warning systems (e.g. TDWR, LLWAS, ASR-9 WSP).
- -
RL-4
Low-level wind shear vertical extent: Technical feasibility is vari-able according to meteorological conditions. Status: Not currently in develop-ment.
Negative impact on terminal flight safety and traffic capacity. May require integrated radar/LIDAR approach to be successful across a range of meteorologi-cal conditions. May require additional sensors. Product Impact: Terminal wx analysis/forecast.
- -
RL-5
Wind shear: Dissemination of wind shear and microburst haz-ard detection reports should extend beyond current ATIS and tower communications to reach NAS system-wide availability and archiving, e.g., the NextGen 4D Cube. Status: Feasible, but no current activity.
Necessary for development and operation of NAS decision support systems. Product Impact: NAS decision support pro-cesses/systems.

RightSizing Project NextGen IOC Sensor Assessment Summary
AJP-6830 36 of 64 December 1, 2009
Table 4.2: Functional Gaps Associated with NAS Radar/LIDAR (RL) Sensors
RL-6
Wind shear: Lack of integration or data-sharing between ground-based and airborne detection systems. Status: No activity.
Negative impact on flight safety. Lost opportu-nity to make best use of available data. Product Impact: Terminal wx analysis/forecast.
- -
RL-7
Squall position, speed, and direc-tion: No operational data product or hazard analysis systems are in place. Status: Feasible but not currently in development.
Negative impact on flight safety and traffic capacity. Product Impact: Surface wx analysis/forecast.
RL-8
Wake vortex detection: No opera-tional detection systems or hazard analysis systems are in place. Status: Feasible. Related opera-tional tests are in progress.
Negative impact on terminal flight safety. Negative impact on terminal traffic capacity due to lack of precise information on spacing requirements as impacted by wake vortex oc-currence. Product Impact: Future wake vortex product.
- -
RL-9
Dust devil detection: Current de-tection relies upon human observ-ers. Status: Automated detection is feasible but not currently in devel-opment.
Visibility and/or wind effects can yield a lim-ited negative impact on terminal operations and traffic capacity. Automated detection may require an integrated and specialized radar/LIDAR approach.
RL-10
Dust and smoke obscuring termi-nal visibility: Current detection re-lies jointly upon human observers and ASOS/AWOS visibility sensors. Status: Automated detection is feasible but not currently in devel-opment.
The lack of effective automated detection can yield a limited negative impact on terminal traffic capacity. Product Impact: NCVA, NCVF.
- -
RL-11
Dust and smoke aloft: Current detection relies upon human observers at the surface and pilot reports. No automated detection systems or data products are in place. Status: Automated detection is feasible but not currently in devel-opment.
The lack of effective automated detection can yield a negative impact on en route and global traffic capacity.
-
RL-12
Blowing spray, blowing snow, blowing sand: No operational data products are in place. Status: Feasible but not currently in development.
Negative impact on terminal ground opera-tions and traffic capacity. Product Impact: NCVA, NCVF, Ground Deicing.
- -
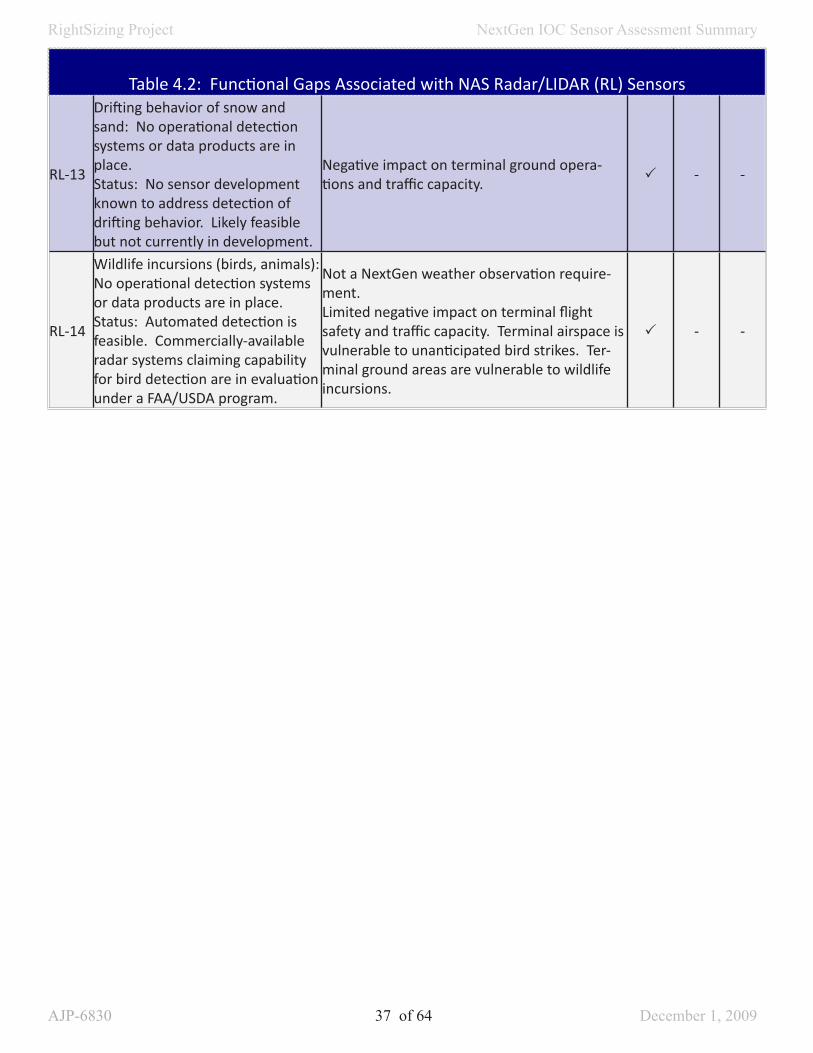
RightSizing Project NextGen IOC Sensor Assessment Summary
AJP-6830 37 of 64 December 1, 2009
Table 4.2: Functional Gaps Associated with NAS Radar/LIDAR (RL) Sensors
RL-13
Drifting behavior of snow and sand: No operational detection systems or data products are in place. Status: No sensor development known to address detection of drifting behavior. Likely feasible but not currently in development.
Negative impact on terminal ground opera-tions and traffic capacity.
- -
RL-14
Wildlife incursions (birds, animals): No operational detection systems or data products are in place. Status: Automated detection is feasible. Commercially-available radar systems claiming capability for bird detection are in evaluation under a FAA/USDA program.
Not a NextGen weather observation require-ment. Limited negative impact on terminal flight safety and traffic capacity. Terminal airspace is vulnerable to unanticipated bird strikes. Ter-minal ground areas are vulnerable to wildlife incursions.
- -

RightSizing Project NextGen IOC Sensor Assessment Summary
AJP-6830 38 of 64 December 1, 2009
Table 4.3: Functional Gaps Associated with NAS Airborne/Spaceborne (AB) Sensors
Gap # Gap Description Comments / ImpactsTe r m . Impact
En Route Impact
Global Impact
AB-1
Access to non-US Satellite Data: Current and potential restrictions prevent or limit real-time access to satellite obser-vations required to support US aircraft op-erating in data-sparse oceanic and remote regions not covered by US satellites. Status: Oceanic/remote data products are in development and can be supported only where US satellites provide coverage. Real-time access to Meteosat and MTSAT (The Multifunctional Transport Satellites) data is needed to support operational use in broader oceanic/remote domains.
NOAA has real-time access to Me-teosat data, but there are significant restrictions on the use and distribu-tion of these data. The Japanese MTSAT data is freely available, but may require special arrangements for reception and retransmission for FAA operational use. Unavailability of non-US satellite data yields a negative impact on global flight safety and traffic capacity.
- -
AB-2
GOES data refresh frequency: GOES data over the CONUS are routinely updated ev-ery 15 minutes, adjacent areas are gener-ally observed every half hour, and full disk imagery is only obtained once every three hours. These update rates are inadequate for many aviation applications. Status: Refresh frequency will be signifi-cantly improved with the GOES-R series of satellites available by 2015 or later.
The temporal gaps within routine GOES data today yield a negative im-pact on global flight safety and traffic capacity.
AB-3
Polar-orbiting satellite data latency: POESS, US DMSP and European Metop satellites provide coverage that is critical over polar regions and strongly comple-mentary to geostationary observations at lower latitudes. Due to high latency, data from polar-orbiters are generally unavailable for real-time operational use. Real-time access to these observations will require the installation of a number of direct-transmission receiving stations in the observing domains of greatest inter-est. Status: No plans are in place to establish these additional receiving stations.
High latency prevents real-time use of polar-orbiter data for aviation prod-ucts. Negative impact on global flight safety and traffic capacity.

RightSizing Project NextGen IOC Sensor Assessment Summary
AJP-6830 39 of 64 December 1, 2009
Table 4.3: Functional Gaps Associated with NAS Airborne/Spaceborne (AB) Sensors
AB-4
Volcanic ash: Observe and track horizon-tal and vertical extent. Status: A variety of observational and nu-merical methods exist and achieve partial operational capability. Significant issues such as sensitivity of detection, obscura-tion by cloud, determination of plume height, and accuracy of trajectory model-ing exist. Significant improvement using current approaches and new technologies is feasible.
Rapid response products to identify and track volcanic ash clouds are needed for aviation use and for other warning responsibilities carried by the international network of Volcanic Ash Advisory Centers (VAAC). Airborne FLIR devices can provide some capability. Under investigation by NASA. Negative impact on global, en route and terminal area flight safety and traffic capacity.
AB-5
Volcanic ash: Characterize ash content and density. Status: Techniques for remote sensing of the characteristics of an ash cloud and estimation of its hazard to aircraft are ex-tremely limited. Significant development is needed.
Beyond the problems of characterizing the properties of an ash cloud, there are significant unknowns in relating those observations to the severity of the hazard to aviation. Current prac-tice is for aircraft to avoid any known ash clouds. Negative impact on global, en route and terminal area flight safety and traffic capacity.
AB-6
Turbulence observations: Operational collection of EDR data for turbulence de-termination is in place, but many airborne platforms are not equipped with this capability, and new techniques (e.g., GPS occultation, airborne FLIR) need study to assess feasibility and utility. Status: EDR reporting from commercial aircraft is operational and in need of expansion, particularly over oceanic do-mains. EDR data should help the terminal area as well as enroute.
Negative impact on en route, and global flight safety and traffic capacity.
AB-7
Cloud coverage and cloud type identifica-tion: Many operational products require satellite-based observations of cloud coverage and cloud type identification. While there are many different algorithms being used to classify clouds, there is no single, routinely available product for aviation use. Status: No approved products are avail-able for operational use.
Negative impact on global, en route, and terminal flight safety and traffic capacity.

RightSizing Project NextGen IOC Sensor Assessment Summary
AJP-6830 40 of 64 December 1, 2009
Table 4.3: Functional Gaps Associated with NAS Airborne/Spaceborne (AB) Sensors
AB-8
Sea surface winds: Wind speed and direc-tion observations over the ocean are es-sential for forecasting storm development and motion, particularly tropical storms. The polar-orbiting QuikSCAT scatterom-eter is well past its design lifetime and needs replacement. Status: A number of replacements have been proposed, but none are currently scheduled for launch.
Negative impact on global, en route, and terminal flight safety and traffic capacity.
- -
AB-9
Cloud top height: High resolution cloud top height information is critical to many aviation applications. Current techniques give useful information, but require im-provement. Status: Current product capabilities have not undergone approval for operational use. No new products are in preparation.
Negative impact on global, en route, and terminal flight safety and traffic capacity.
AB-10
Global situational awareness – flight deck products: Lack of approved products pro-viding real-time situational awareness in the cockpit for operations in data-sparse regions outside the NAS. Status: Products are in development.
Negative impact on global flight safety and traffic capacity.
- -
AB-11
Global situational awareness – communi-cations: Limited operational communica-tions bandwidth and systems required to uplink weather products to the cockpit of US aircraft operating in data-sparse oce-anic regions outside the NAS. Status: Limited experimental uplink trials have been conducted.
Negative impact on global flight safety and traffic capacity.
- -
AB-12
Satellite product research-to-operations: While there has been considerable devel-opment of experimental satellite-based products intended for aviation applica-tions, there is uncertainty and limited support for transition of these products to operations.
Negative impact on global, en route and terminal flight safety and traffic capacity.
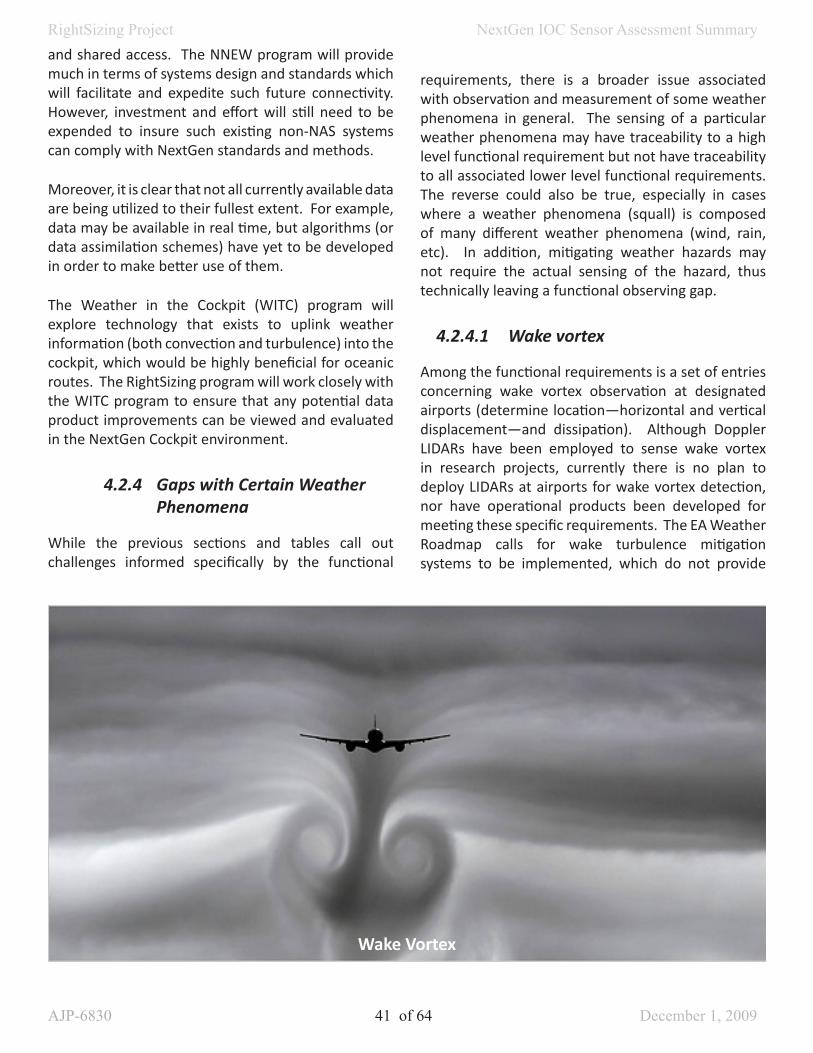
RightSizing Project NextGen IOC Sensor Assessment Summary
AJP-6830 41 of 64 December 1, 2009
and shared access. The NNEW program will provide much in terms of systems design and standards which will facilitate and expedite such future connectivity. However, investment and effort will still need to be expended to insure such existing non-NAS systems can comply with NextGen standards and methods.
Moreover, it is clear that not all currently available data are being utilized to their fullest extent. For example, data may be available in real time, but algorithms (or data assimilation schemes) have yet to be developed in order to make better use of them.
The Weather in the Cockpit (WITC) program will explore technology that exists to uplink weather information (both convection and turbulence) into the cockpit, which would be highly beneficial for oceanic routes. The RightSizing program will work closely with the WITC program to ensure that any potential data product improvements can be viewed and evaluated in the NextGen Cockpit environment.
4.2.4 GapswithCertainWeatherPhenomena
While the previous sections and tables call out challenges informed specifically by the functional
requirements, there is a broader issue associated with observation and measurement of some weather phenomena in general. The sensing of a particular weather phenomena may have traceability to a high level functional requirement but not have traceability to all associated lower level functional requirements. The reverse could also be true, especially in cases where a weather phenomena (squall) is composed of many different weather phenomena (wind, rain, etc). In addition, mitigating weather hazards may not require the actual sensing of the hazard, thus technically leaving a functional observing gap.
4.2.4.1 Wakevortex
Among the functional requirements is a set of entries concerning wake vortex observation at designated airports (determine location—horizontal and vertical displacement—and dissipation). Although Doppler LIDARs have been employed to sense wake vortex in research projects, currently there is no plan to deploy LIDARs at airports for wake vortex detection, nor have operational products been developed for meeting these specific requirements. The EA Weather Roadmap calls for wake turbulence mitigation systems to be implemented, which do not provide
Wake Vortex

RightSizing Project NextGen IOC Sensor Assessment Summary
AJP-6830 42 of 64 December 1, 2009
direct observations of wake vortices, but utilize wind forecasts to predict their average movement. In this instance the EA roadmap is not fully aligned with the NextGen observational requirements, thus leaving a gap.
Several FAA and NASA-sponsored research programs investigate wake vortex detection (using ground-based LIDAR) and forecasting. For the latter application, a vertical profile of winds, stability and turbulence (EDR
– Eddy Dissipation Rate) are needed. Meteorological Data Collection and Reporting System (MDCRS) data can provide this information, although the current turbulence downlinks may not have adequate vertical resolution for the vortex problem. In addition, boundary layer wind profilers (with radio acoustic sounders for temperature) could provide valuable information.
4.2.4.2 Microburstandlow-levelwindshearmotion
The requirement to determine the speed and direction of microburst advection (as well as the movement of low-level wind shears) is not currently met, nor are there plans to do so for IOC. It is, however, possible to develop such a capability utilizing radar-derived microburst detection and storm motion information.
4.2.4.3 Verticalextentoflow-levelwindshear
Radar observation of low-level wind shear is conducted
Microburst Event
Low Level Wind Shear

RightSizing Project NextGen IOC Sensor Assessment Summary
AJP-6830 43 of 64 December 1, 2009
using only the minimum elevation angle (surface) scan. Currently there is no attempt at determining the vertical extent of the wind shear. In principle, such a determination is possible by utilizing data from multiple elevation scans, but it would be limited by the radar antenna beamwidth and the viewing geometry. A Doppler LIDAR would have the desired vertical resolution, but it is strongly limited in range by precipitation and cloud attenuation. Low-level wind shear is most dangerous near the ground, where the current detection systems are already optimized.
4.2.4.4 Tornado,waterspout,andfunnelcloud
Tornadoes, waterspouts, and funnel clouds have separate observational requirements. A waterspout is a tornado over a body of water (as opposed to over land). A funnel cloud is a funnel-shaped condensation cloud associated with a violently rotating column of air that is not in contact with the Earth’s surface. It is the separation from the surface that distinguishes it from a tornado or waterspout. A radar-based product, the tornado vortex signature (TVS), does not distinguish between these three phenomena. Separating over-water vs. overland events is a simple matter, but determining if the spinning column is touching the ground (or water surface) is not a straightforward task. TVS also does not report intensity, which is a requirement.
4.2.4.5 Well-developeddust/sandwhirls
The American Meteorological Society definition of a sand whirl or well-developed dust whirl is a dust devil. Currently there is no sensor product for dust devil detection although there is a requirement to observe and locate these phenomena. A dust devil has diameter 3 to 30 m with an average height of about 200 m. In general, this is too small and low for resolution and coverage by the existing network of radars as well as satellites. A specialized, high-resolution (short wavelength) radar might be used for observation, as well as a Doppler LIDAR, but a product would need to be developed that distinguishes dust devils from other phenomena.
4.2.4.6 Virga
Falling shafts of hydrometeors that evaporate before reaching the ground are called virga. Weather radars
Dust Devil
Waterspouts off the Coast ofthe Bahamas

RightSizing Project NextGen IOC Sensor Assessment Summary
AJP-6830 44 of 64 December 1, 2009
can observe the precipitation aloft associated with virga, but due to the elevated minimum beam heights they may not be able to detect a precipitation-free zone beneath the precipitation aloft. There is presently no sensor product for virga identification. Such a product could be developed using weather radar data combined with high-density ground observation data of precipitation.
4.2.4.7 Squalls
A squall is a strong wind with a sudden onset, duration of the order of minutes, and a rather sudden decrease in speed. A squall line is a line of active thunderstorms, including contiguous precipitation areas due to the storms. The functional requirements have entries that refer to squall observations (JPDO 2008), while the preliminary portfolio requirements use the term squall line (Moy 2008). Thus, the intent of the official requirement is ambiguous. In either case, there is currently no specific sensor product that addresses the location and movement of squalls. However, there does not appear to be any significant technical obstacle to developing such a product. For example, in the case of a squall line, the convective weather forecast
algorithm in the Corridor Integrated Weather System (CIWS) internally classifies weather into line storms, different types of cells, and stratiform precipitation.
4.2.4.8 GravityWaves
Gravity waves (or buoyancy waves) are an additional aviation hazard not specifically covered by the functional requirements. Low-altitude wind shears due to these waves as well as clear-air turbulence generated by breaking waves at high altitude can represent a danger to aircraft. The NRC report on mesoscale meteorological sensing needs (NRC 2008) points out gravity waves as an important phenomenon for observation. While specific radar products are generated for low-level wind shear due to microbursts and gust fronts, no such product exists for gravity-wave induced wind shear; thus, aircraft may be exposed to this dangerous phenomenon even where there is coverage by appropriate radars (Bieringer et al. 2004). The most important aspect of gravity waves is that altitude and airspeed fluctuations induced by the waves (especially mountain waves) can cause aircraft to stall, rise, or descend into another active flight level. It is unclear how to measure gravity waves in flight.
Gravity Waves Formed in a Marine Stratus Layer

RightSizing Project NextGen IOC Sensor Assessment Summary
AJP-6830 45 of 64 December 1, 2009
Perhaps, in-situ (ACARS) reports could be expanded to include vertical velocity, or onboard LIDARs might become available. Incidentally, once the wave breaks it is no longer a coherent structure and thus belongs in the turbulence measurement category.
4.2.4.9 Birdstrikesandwildlifeincursions
Bird strikes have long been recognized as a critical hazard for aircraft. The January 15, 2009 multiple bird-strike event that brought down US Airways Flight 1549 into the Hudson River garnered widespread public attention and angst. Given the high rate of bird strikes and near misses, they are a clear threat to loss of life and property. Commercial bird detection radars are available, and research has shown that data from existing FAA radars can be effectively used for bird detection (Troxel 2002). And yet, there is no bird detection requirement. Although birds are not exactly an atmospheric phenomenon, the same sensors and techniques used to observe weather can be applied for bird detection, so it would be pragmatic to place this
aviation hazard under the aegis of weather observation.
The FAA and United States Department of Agriculture (USDA) have begun a sponsored program to evaluate the feasibility of commercial radar systems to detect and track birds in the airport environment. The FY09/10 efforts under this program are focused on the evaluation of one vendor’s system. Surface wildlife incursions ranging from turtles (JFK airport, July 9, 2009) through larger animals such as deer and farm stock are typically controlled through fencing and monitored by human observers and pilots. While a clear threat, these incursions are less amenable to direct observation by meteorologically oriented technologies such as radar, and are not addressed further in this report.
Although not part of the functional observational requirements, the detection of birds in the terminal area could lead to decreased incidences of hazardous bird strikes, given an effective concept of operations. The ASR-9, with the addition of a tailored image-processing algorithm, has been shown to be proficient at detecting and tracking birds (Troxel 2002).
Space Weather is Driven by Solar Activity

RightSizing Project NextGen IOC Sensor Assessment Summary
AJP-6830 46 of 64 December 1, 2009
Alternatively, relatively low cost commercial radar systems could be used for this purpose (currently under investigation by the FAA).
4.2.4.10 Spaceweather
Impacts of space weather on aviation is a relatively new field and therefore is likely to contain significant gaps in both knowledge and sensors. The specified requirements focused on geomagnetic activity and radiation levels, but neglected the space weather impacts on Global Navigation Satellite Systems (GNSS) as well as on communications. Currently the Space Weather Predication Center (SWPC) uses only one ground-based magnetometer as part of its operational monitoring of geomagnetic activity. This greatly limits the spatial extent of these activities.
There is a need to evaluate the potential benefit of using Global Positioning System (GPS) occultation (especially GPS/Low Earth Orbiting (LEO) links) to provide information regarding total electron content (TEC) in the ionosphere.
A significant early opportunity for space weather related sensor deployment is the Deep Space Climate Observatory (DSCOVR) platform that is currently being considered for operational deployment by NOAA after transferring the hardware from NASA. Maximal utility for NextGen needs would be gained if this platform contains both solar wind instruments as well as a coronagraph.
Space weather monitoring and prediction for aviation applications will benefit greatly from the deployment of dedicated sensors instead of relying on scientific NASA missions.
4.2.4.11 Volcanicash–notassessedinFY09
Volcanic eruptions may generate ash clouds that reach the tropopause within five minutes. Moreover, these ash plumes may persist for days to weeks and propagate around the globe. The Naval Research Laboratory (NRL) and the Air Force Weather Agency (AFWA) have developed capabilities to predict the dispersal of ash plumes. A comprehensive gap assessment for the ash cloud problem requires broader agency participation—i.e., with the United States Geological Survey (USGS)
and NOAA.
4.2.4.12 Environment–notassessedinFY09
Environmental impacts from aviation-related activities are found on scales ranging from local to global. NextGen will have to be concerned and deal with issues related to noise and emission pollution near airports, such as exhaust from airplanes taking off or deicing fluids getting into ground water systems. Moreover, contrails provide a non-negligible effect on the radiation balance and thus climate. Monitoring and prediction capabilities will have to be developed to quantify and minimize environmental impacts.
The observational requirements associated with research and development activities to understand and control environmental impacts will certainly be advanced by the systems being examined through current RightSizing plans. However, since environmental impacts reach well beyond the domain of weather to areas such as climate, noise, air pollution, runoff control, hydrology and others, the scope of the current study lays only a preliminary foundation toward understanding the associated observational requirements. Future work is needed to better define these requirements, taking into account the multi-scale, interdisciplinary nature of the challenges associated with assessing, forecasting, and controlling NextGen environmental impacts.
4.2.4.13 Boundarylayer
Current weather radars are large, powerful systems designed for long-range coverage. However, due to the Earth’s curvature and terrain blockage effects, observation of the lower layer of the atmosphere by these sensors is limited. For example, while the NEXRAD network “covers” nearly the entire CONUS at 3km AGL, 70% of the boundary layer is unobserved. Coverage in mountainous regions is especially poor. The resulting gaps cause low-lying phenomena such as winter precipitation, tornadoes, and convective initiation to be missed at times, the latter of which is an especially important input to numerical weather forecast models. An obvious remedy for this gap is

RightSizing Project NextGen IOC Sensor Assessment Summary
AJP-6830 47 of 64 December 1, 2009
to deploy a higher density of less powerful, cheaper radars. This is the basic premise of the Collaborative Adaptive Sensing of the Atmosphere (CASA) project, which is an ongoing effort initiated by the NSF to develop such a system. Whether the approach is the optimal solution will depend on many factors, including the balance between cost and benefit.
4.2.4.14 Oceanicweather
The atmosphere above the oceans is not observed with good resolution due to the dearth of ground-based sensing systems, especially radars. Transoceanic flights are mainly dependent on weather observation from satellites and their own onboard radar. However, satellite data lack vertical resolution (as well as fine-scale horizontal resolution), while the aircraft radars suffer from attenuation in heavy weather resulting in shortened range. The accuracy of numerical weather forecast models is also affected negatively by the sparseness of observational data above the oceans. Moreover, getting the latest weather information into the cockpit is currently limited and ineffective.
4.2.4.15 RunwayCrosswindandWindShear
Access to one-second LLWAS data (as opposed to the usual 10 second reports) could be very useful in determining runway hazards due to turbulent winds (gusts). These data exist on the sensors, but are not transmitted.
LLWAS data can be used to estimate runway crosswinds. The sensors and data exist, all that is needed is an algorithm to compute the crosswind, determine if the value is above what is deemed a hazardous level, and then generate a text message that can be displayed on the current LLWAS ribbon displays.
The NEXRAD is highly capable of detecting low-level wind shear. The implementation of the new algorithms in the radar product generator (RPG) could provide a solution at those facilities where the NEXRAD is located close enough to the runway. If a new volume coverage pattern (VCP) with a frequent revisit of the surface scan could be implemented, a microburst detection algorithm could also be added to the suite of NEXRAD products. This would be a cost-effective way to expand coverage of microburst detection to smaller airports
located near NEXRADs and to improve detection performance where there is overlapping coverage with LLWAS or ASR-9 WSP systems.
4.2.4.16 Turbulence
The Functional Performance Requirements state that turbulence is to be observed, located, and measured in Eddy Dissipation Rate (EDR). The International Civil Aviation Organization (ICAO) has already determined that EDR is the turbulence parameter that should be down-linked from commercial aircraft. Nevertheless, there is no consistency between what ICAO recommends (and what the FAA is deploying) and aircraft in the what World Meteorological Organization (WMO) Aircraft Meteorological Data Relay (AMDAR) and Aircraft to Satellite Data Relay (ASDAR) programs use. Increasing the number of aircraft that are reporting turbulence (EDR) over the CONUS, and deploying the EDR algorithm on aircraft types that fly oceanic routes would be a potential solution.
TDWR data may be used for convective turbulence detection in the terminal area. Algorithms have already been developed for NEXRAD—e.g., NEXRAD Turbulence Detection Algorithm (NTDA). These algorithms can be adapted to work on the TDWR data stream.
Although the NTDA algorithm is implemented on the NEXRAD, the data can’t be accessed at this time. Coordination between the FAA and NWS to facilitate access to the NTDA data would greatly enhance the turbulence monitoring and forecast product generation.
Airborne radars are being shipped that have convective turbulence detection capabilities; however, any alert information generated by these systems stays onboard. These data could be down-linked for integration into the Graphical Turbulence Guidance Nowcast (GTGN) product being developed for IOC.
NOAA is planning to deploy a number of ground-based GPS receivers. These data could be utilized to calculate turbulence information. (However, the methodology developed for use with GPS-LEO and GPS-aircraft links need to be evaluated for their effectiveness for GPS to ground-based receiver links.)

RightSizing Project NextGen IOC Sensor Assessment Summary
AJP-6830 48 of 64 December 1, 2009
4.2.4.17AircraftorRunwayDeicing
Large airports may not have enough sensors distributed across the airport. The spatial representation of a single snowfall rate or visibility measurement is likely not representative for the terminal area.
The ASOS system is currently only able to detect one freezing rain type – freezing rain. Freezing drizzle, freezing fog, and frost are only reported in human-augmented aviation routine weather reports (METARs). Algorithms have been developed for use on ASOS to detect these other freezing precipitation types, but these algorithms are largely untested and require further research before they can be put into operation.
The ASOS can currently detect one type of frozen precipitation accurately – snow. Ice pellets, snow pellets, and mixed precipitation types are currently reported by the ASOS automation in a METAR/SPECI as unknown precipitation (UP). To be reported as the correct type of frozen precipitation currently requires augmentation by a human observer.
The NWS is currently developing a proof of concept for an Enhanced Precipitation Indicator (EPI) that will replace the current ASOS precipitation identifier (LEDWI) and will be capable of detecting all types of freezing and frozen precipitation when operational.
Algorithms for the addition of a LWE rate capability in the ASOS All Weather Precipitation Accumulation Gauge (AWPAG) need to be developed and tested to provide the most accurate intensity readings for all freezing and frozen precipitation types.
(Note: The EPI and the AWPAG with LWE rate capability both need to be operational in order for the ASOS to automatically detect and accurately measure all freezing and frozen precipitation types.)
Aircraft Deicing Operation
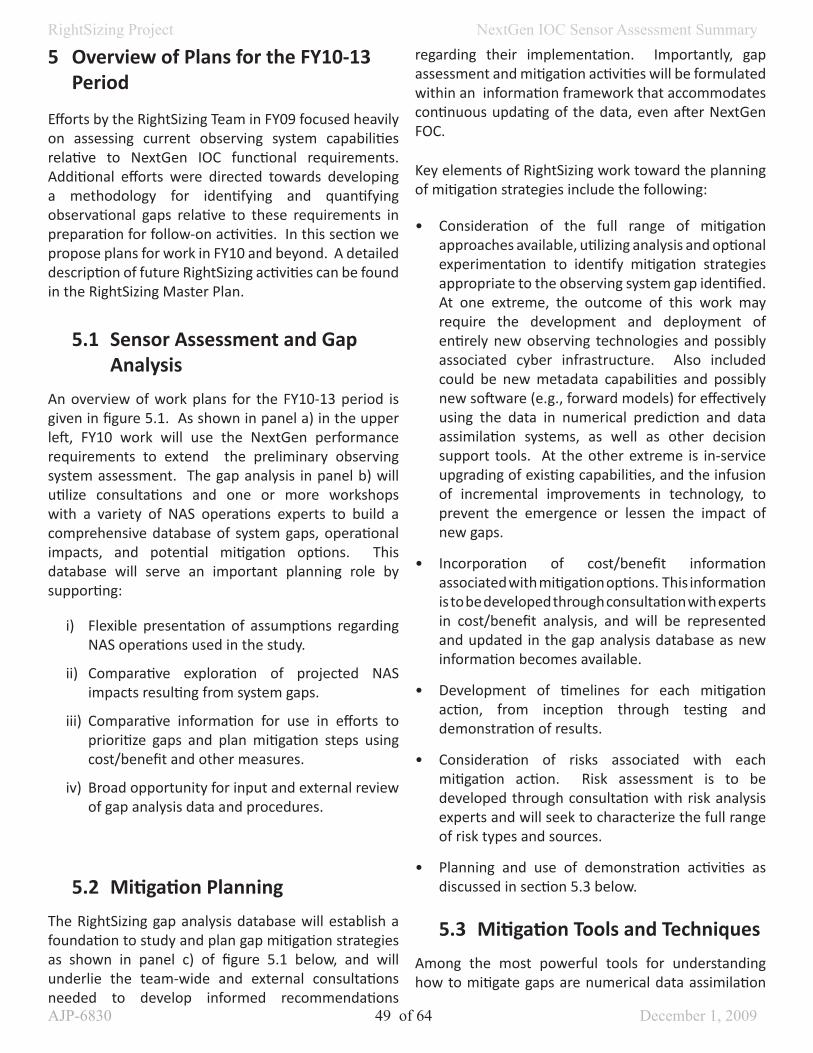
RightSizing Project NextGen IOC Sensor Assessment Summary
AJP-6830 49 of 64 December 1, 2009
5 Overview of Plans for the FY10-13 Period
Efforts by the RightSizing Team in FY09 focused heavily on assessing current observing system capabilities relative to NextGen IOC functional requirements. Additional efforts were directed towards developing a methodology for identifying and quantifying observational gaps relative to these requirements in preparation for follow-on activities. In this section we propose plans for work in FY10 and beyond. A detailed description of future RightSizing activities can be found in the RightSizing Master Plan.
5.1 Sensor Assessment and Gap Analysis
An overview of work plans for the FY10-13 period is given in figure 5.1. As shown in panel a) in the upper left, FY10 work will use the NextGen performance requirements to extend the preliminary observing system assessment. The gap analysis in panel b) will utilize consultations and one or more workshops with a variety of NAS operations experts to build a comprehensive database of system gaps, operational impacts, and potential mitigation options. This database will serve an important planning role by supporting:
i) Flexible presentation of assumptions regarding NAS operations used in the study.
ii) Comparative exploration of projected NAS impacts resulting from system gaps.
iii) Comparative information for use in efforts to prioritize gaps and plan mitigation steps using cost/benefit and other measures.
iv) Broad opportunity for input and external review of gap analysis data and procedures.
5.2 Mitigation Planning
The RightSizing gap analysis database will establish a foundation to study and plan gap mitigation strategies as shown in panel c) of figure 5.1 below, and will underlie the team-wide and external consultations needed to develop informed recommendations
regarding their implementation. Importantly, gap assessment and mitigation activities will be formulated within an information framework that accommodates continuous updating of the data, even after NextGen FOC.
Key elements of RightSizing work toward the planning of mitigation strategies include the following:
• Consideration of the full range of mitigation approaches available, utilizing analysis and optional experimentation to identify mitigation strategies appropriate to the observing system gap identified. At one extreme, the outcome of this work may require the development and deployment of entirely new observing technologies and possibly associated cyber infrastructure. Also included could be new metadata capabilities and possibly new software (e.g., forward models) for effectively using the data in numerical prediction and data assimilation systems, as well as other decision support tools. At the other extreme is in-service upgrading of existing capabilities, and the infusion of incremental improvements in technology, to prevent the emergence or lessen the impact of new gaps.
• Incorporation of cost/benefit information associated with mitigation options. This information is to be developed through consultation with experts in cost/benefit analysis, and will be represented and updated in the gap analysis database as new information becomes available.
• Development of timelines for each mitigation action, from inception through testing and demonstration of results.
• Consideration of risks associated with each mitigation action. Risk assessment is to be developed through consultation with risk analysis experts and will seek to characterize the full range of risk types and sources.
• Planning and use of demonstration activities as discussed in section 5.3 below.
5.3 Mitigation Tools and Techniques
Among the most powerful tools for understanding how to mitigate gaps are numerical data assimilation

RightSizing Project NextGen IOC Sensor Assessment Summary
AJP-6830 50 of 64 December 1, 2009
and weather prediction systems operated in either Observing System Simulation Experiment (OSSE) or Observing System Experiment (OSE) mode. These two approaches, appropriately applied (a very important caveat), can yield a wealth of information about potential benefits and drawbacks of observations from systems yet to be developed, as well as the same information from existing observing systems via data-denial and other experiments. It is important to note that this methodology can be used to test whether gaps can be “filled” (i.e., their impact mitigated) via data assimilation versus deployment of actual observing resources.
Both OSSE and OSE analysis will be used to quantify current temporal and spatial gaps within the NAS, determine optimal configurations of existing observing systems, determine the economically efficient numbers and types of observations necessary, and quantify the additional cost-benefit provided from new sensors. An ideal example study is presented by Morss and Battisti
(2004a, b) where the authors applied an OSSE to determine an optimal observing network for El Nino-Southern Oscillation (ENSO) analysis and prediction.
Another key goal in developing gap mitigation strategies is examination of the relative value of raw observations and assimilated data sets. Both of course are necessary, but advances in data assimilation techniques, and in computing power, make possible the provision of extremely fine-scale 4D analyses of all atmospheric quantities from which most any desired derived quantity can be obtained. As an example, the assimilation of radar reflectivity and temperature data yields quantitative information about a variety of frozen and liquid water species (e.g., cloud water, rain water, snow, hail, graupel) that, beyond the two variables from which they are derived, have tremendous value in decision support tools. These and other potentially valuable approaches for maximizing the use of observations will begin to be evaluated in FY11.
Workshops on Obs Use in the NAS
- FAA ATO-W- RWI & other FAA- Airport operators- Airline/pilots- Dispatchers- Others
Other Consultations- Cost/benefit experts- Risk assessment experts
Integrated Gap Analysis Database
- Gap type- Terminal / Enroute / Oceanic- Safety impact- Efficiency impact- Economic impact- Security impact- IOC / MOC / FOC- Cost/benefit information- Mitigation risk assessment- Agency/Entity responsible
FY09-10Sensor Survey
FY10-12 Gap Mitigation – Planning & Execution
FY10 Gap Analysis
a) b)
c)
CandidateMitigation Approaches
According to nature of gap.- Network expansion.- New sensor technology.- Model assimilation.- New training or tools- Others...
- Discussion -- Revision -
Cost / Benefit ofMitigation Options
- Benefit to IOC.- Benefit after IOC.- Cost/benefit comparison among mitigation options.
Risks
Potential Role of Demonstrations
- Value to gap mitigation. - Objective & scale of demo.- Select targeted users.- Timescale. - Role of OSSE or OSE?- Participants & collaborators.
Timeline ofMitigation Options
- Phased mitigation?- Readiness for IOC &
beyond. - Ample time for evaluation
of results?- Other questions.
NextGen ObservingSystem Requirements
- Functional – FY09- Performance – FY10- Are they technically
feasible?
Identify Current & Future Observing
System Gaps
FY10-13

RightSizing Project NextGen IOC Sensor Assessment Summary
AJP-6830 51 of 64 December 1, 2009
5.4 Demonstrations
A variety of approaches exist for meeting the aforementioned gap mitigation strategy goals. Although case studies are valuable, they must be chosen judiciously to avoid the sorts of extreme events for which operational decisions tend to pose less of a challenge (i.e., textbook examples). At perhaps the other extreme, real-time experimentation is valuable because it provides a framework in which one has no control over the atmospheric events being faced, and it also exposes nuances of data outages and other problems. Further, engagement of operational personnel in real time experimentation provides a valuable perspective unattainable in other ways. Unfortunately, real-time work requires considerable planning and resources.
We propose to utilize a mixture of case study, real-time, and other approaches toward understanding the nature and importance of gaps and developing associated mitigation strategies. For example, the Linked Environments for Atmospheric Discovery (LEAD) framework can be used to study the value
of dynamically adaptive observing and numerical prediction systems in both OSSE and OSE contexts, as well as in real-time experiments conducted perhaps in collaboration with the NCEP Storm Prediction (SPC) and Aviation Weather (AWC) Centers and their associated test beds. Decision support tools, such as those developed at NCAR and MIT LL, can be tested using both simulated and real observations. The goal is to evaluate not only how concepts associated with the particular tools can be used in the NextGen decision support environment, but also to use them to develop strategies for mitigating observing system gaps. Outcomes from these experiments also will be used to inform changes in both programmatic and functional requirements.
Some of the tools developed for gap analysis and reporting will also be important in demonstrating and visualizing geospatial coverage of complex sensors and sensor systems. Shown below is one potential example of such a tool, which allows the visualization of radar coverages in three dimensions.
RightSizing Project NextGen IOC Sensor Assessment Summary
AJP-6830 52 of 64 December 1, 2009
REFERENCES
Bieringer, P. E., B. Martin, B. Collins, and J. Shaw, 2004: Commercial aviation encounters with severe low altitude turbulence. Preprints, 11th Conference on Aviation, Range, and Aerospace Meteorology, Hyannis, MA, Amer. Meteor. Soc., 11.3.
Hallowell, R. G., J. Y. N. Cho, S. Huang, M. E. Weber, G. Paull, and T. Murphy, 2009: Wind-shear system cost benefit analysis update. Project Rep. ATC-341, MIT Lincoln Laboratory, Lexington, MA, 186 pp.
ISO, 1993: International Vocabulary of Basic and General Terms in Metrology, 2nd Ed., International Organization for Standardization, Geneva, Switzerland.
JPDO, 2006: Next Generation Air Transportation System Weather Concept of Operations, Version 1.0. Joint Program Development Office, Washington, DC, 60 pp.
JPDO, 2007: Concept of Operations for the Next Generation Air Transportation System, Version 2.0. Joint Program Development Office, Washington, DC, 219 pp.
JPDO, 2008: Four-Dimensional Weather Functional Requirements for NextGen Air Traffic Management. Joint Program Development Office, Washington, DC, 180 pp.
Morss, R.E., and D.S. Battisti, 2004a: Evaluating observing requirements for ENSO prediction: Experiments with an intermediate coupled model. J. Climate, 17, 3057–3073.
Morss, R.E., and D.S. Battisti, 2004b: Designing efficient observing networks for ENSO prediction. J. Climate, 17, 3074–3089.
Moy, R., 2008: NNEW/RWI Preliminary Portfolio Requirements. Aviation Weather Office, Federal Aviation Administration, Washington, DC, 120 pp.
NRC, 2008: Observing Weather and Climate from the Ground Up: A Nationwide Network of Networks. National Academies Press, Washington, DC, 250 pp.
Troxel, S. W., 2002: Progress report on development of a terminal area bird detection and monitoring system using the ASR-9. Preprints, 4th Joint Annual Meeting of Bird Strike Committee USA and Canada, Sacramento, CA.
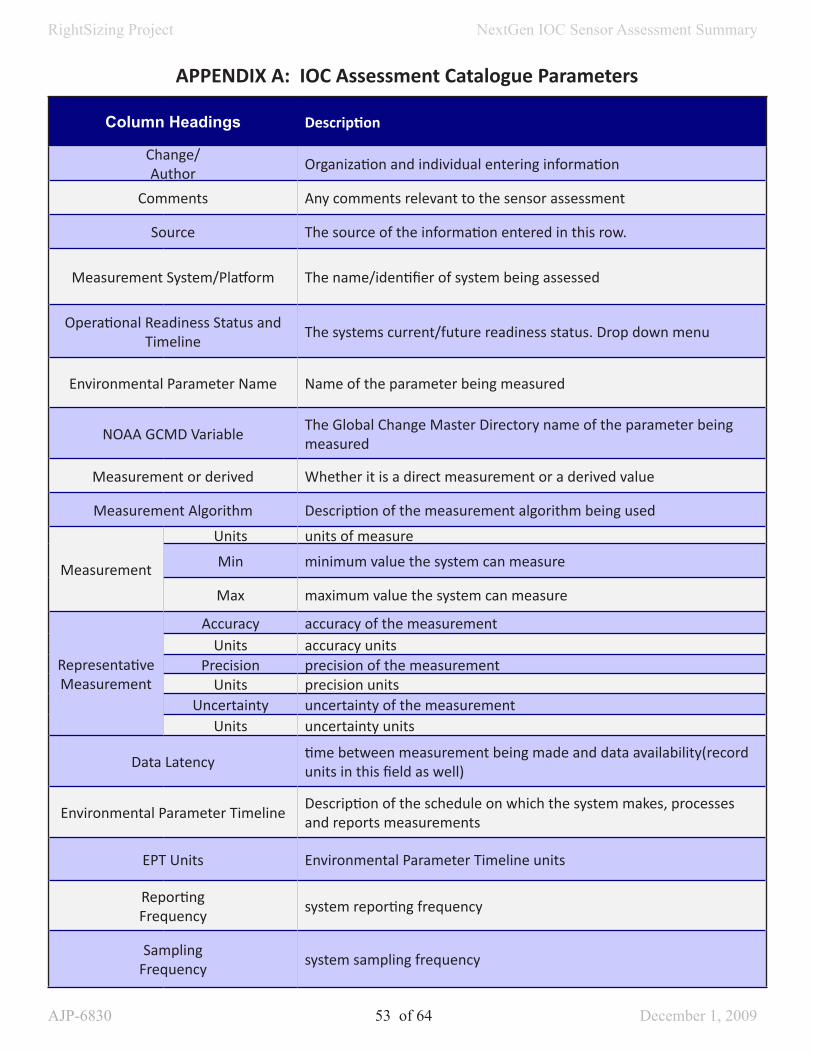
RightSizing Project NextGen IOC Sensor Assessment Summary
AJP-6830 53 of 64 December 1, 2009
APPENDIX A: IOC Assessment Catalogue Parameters
Column Headings Description
Change/ Author
Organization and individual entering information
Comments Any comments relevant to the sensor assessment
Source The source of the information entered in this row.
Measurement System/Platform The name/identifier of system being assessed
Operational Readiness Status and Timeline
The systems current/future readiness status. Drop down menu
Environmental Parameter Name Name of the parameter being measured
NOAA GCMD VariableThe Global Change Master Directory name of the parameter being measured
Measurement or derived Whether it is a direct measurement or a derived value
Measurement Algorithm Description of the measurement algorithm being used
Measurement
Units units of measure
Min minimum value the system can measure
Max maximum value the system can measure
Representative Measurement
Accuracy accuracy of the measurementUnits accuracy units
Precision precision of the measurementUnits precision units
Uncertainty uncertainty of the measurementUnits uncertainty units
Data Latencytime between measurement being made and data availability(record units in this field as well)
Environmental Parameter TimelineDescription of the schedule on which the system makes, processes and reports measurements
EPT Units Environmental Parameter Timeline units
Reporting Frequency
system reporting frequency
Sampling Frequency
system sampling frequency

RightSizing Project NextGen IOC Sensor Assessment Summary
AJP-6830 54 of 64 December 1, 2009
Column Headings Description
Sampling Duration
length of time for individual samples
Measurement Stability stability of the system
Measurement ExtentDescription of the spatial and temporal extent of a single measurement system element
Other Key Parameter Properties other important information about the measurement
Remote Sensing whether or not this is a remote or local measurement
User/Platform specific system operators and platforms
Geographic Coverage geographic area covered by the system (e.g. CONUS, EU, global, etc)
General Coverage Description description of the coverage characteristics
Horizontal Grid Spacing
Unitsunits of measure of the horizontal grid
Representative Horizontal
Grid Spacinghighest grid resolution that the measurement system can support
Vertical Resolution
Unitsunits of measure of the vertical resolution
Representative Vertical Spatial
Resolution
highest vertical resolution that the measurement system can support
Associated Spectral
Characteristicsspectral characteristics of the measurement. If any
Coverage in a GIS Formatted Geospatial Database
location of GIS formatted geospatial coverage database/files (if any)
Geographical Coverage Data location and or brief description of geographic coverage data (if any)
Coverage Description Web Page url of web page
Coverage Description Material location of material and access details
APPENDIX A: IOC Assessment Catalogue Parameters

RightSizing Project NextGen IOC Sensor Assessment Summary
AJP-6830 55 of 64 December 1, 2009
APPENDIX B: RightSizing Team Member Biographies
Jerry Brotzge
Dr. Brotzge is Director of NetRad Operations for the Engineering Research Center for Collaborative Adaptive Sensing of the Atmosphere (CASA), and Sr. Research Scientist for CAPS in the OU School of Meteorology. With a background in land surface and boundary layer instrumentation, mesoscale meteorology, and weather radar, his current work involves moving research to operations, namely applying adaptive weather radar systems, numerical analysis and forecast products to improving National Weather Service warning operations. Dr. Brotzge holds a bachelors degree in meteorology from Saint Louis University, and master and PhD degrees from the University of Oklahoma.
Frederick H. Carr
Dr. Carr is the Mark and Kandi McCasland Professor of Meteorology and the director of the School of Meteorology at the University of Oklahoma. He received his PhD in meteorology from Florida State University, followed by a post-doctoral appointment at SUNY-Albany. His research interests include synoptic, tropical and mesoscale meteorology, numerical weather prediction and data assimilation, and the use of new observing systems in diagnostic and numerical weather prediction studies. Dr. Carr has held visiting scientist positions at the National Centers for Environmental Prediction, the National Center for Atmospheric Research, and NOAA’s Forecast Systems Laboratory. He has served as the associate director of the Center for the Analysis and Prediction of Storms at the University of Oklahoma and also as an associate director of Collaborative Adaptive Sensing of the Atmosphere, an NSF Engineering Research Center. He served on the committee that authored the recent NRC report “Observing Weather and Climate from the Ground Up: A Nationwide Network of Networks”.
Larry Cornman
Mr. Cornman is a Project Scientist at the National Center for Atmospheric Research. His educational background includes undergraduate degrees in Mathematics and Physics from the University of California and a graduate degree in Physics from the University of Colorado. He started working at NCAR in 1983 in support of the FAA’s Low Level Windshear Alert System (LLWAS). From 1983 to 1990, Larry was involved in the development of the Phase II and Phase III LLWAS algorithms and the Terminal Doppler Weather Radar (TDWR) algorithms. In 1989, he developed the TDWR/LLWAS Integration algorithms, for which he holds numerous U.S. and International patents. Since 1990, Larry’s research focus has been on atmospheric turbulence. He has developed turbulence detection algorithms for remote sensors including ground-based and airborne Doppler radars, LIDARs and wind profilers; as well as developing a methodology for making in situ measurements of turbulence from commercial aircraft. Larry also has a significant amount of expertise in the development of signal and image processing algorithms. He holds four U.S. patents in these areas. He has twice been the recipient of an Aviation Week and Space Technology magazine Laurel Award, a recipient of a NASA “Turning Goals into Reality” award, and was named to the 2003 “Scientific American 50” list as “Research Leader in Aerospace.”

RightSizing Project NextGen IOC Sensor Assessment Summary
AJP-6830 56 of 64 December 1, 2009
John Y. N. Cho
Dr. Cho is a member of the Weather Sensing Group at MIT Lincoln Laboratory, where he works on various meteorological radar and air traffic management projects for the FAA. Before joining the Laboratory, he was a research scientist in the Department of Earth, Atmospheric, and Planetary Sciences at MIT, following a stint as a staff scientist at the National Astronomy and Ionosphere Center’s Arecibo Observatory in Puerto Rico. Dr. Cho has over forty refereed journal publications in the fields of atmospheric radar, waves and turbulence, noctilucent clouds, and meteors. He received the 1993 CEDAR Prize from the National Science Foundation and a 1996 Young Scientist Award from the International Union of Radio Science. He holds the B.S. and M.S. degrees from Stanford University, and a Ph.D. from Cornell University, all in electrical engineering.
Tammy Farrar
Ms. Farrar is a Research Meteorologist with the FAA’s Weather Policy and Requirements Team in the Aviation Weather Group and currently serves as the Turbulence Subject Matter Expert and airborne weather observations point of contact with the FAA’s RightSizing Sensor Network program. Prior to her time with the FAA, Ms. Farrar was a Weather Officer with the United States Air Force and an Editorial Assistant for the American Meteorological Society’s Journal of the Atmospheric Sciences. She holds a Masters of Science degree in Meteorology with an emphasis in Climatology from Florida State University and a Bachelors of Science degree in Atmospheric Sciences with a minor in Physics from the University of Arizona.
Kelvin K. Droegemeier
Dr. Droegemeier is Regents’ Professor of Meteorology and Vice President for Research at the University of Oklahoma. He co-founded and directed the NSF Science and Technology Center for the Analysis and Prediction of Storms, which pioneered the science of storm-scale numerical weather prediction via assimilation of Doppler radar and other observations. he also co-founded and was deputy director of the NSF Engineering Research Center for Collaborative Adaptive Sensing of the Atmosphere, which is revolutionizing the sampling of the lower part of the atmosphere using dynamically adaptive sensing techniques. Dr. Droegemeier has published extensively, is an aviation weather consultant, and was appointed to the National Science Board by President George W. Bush. He holds a BS degree in meteorology from the University of Oklahoma and MS and Ph.D. degrees in atmospheric science from the University of Illinois at Urbana-Champaign.
Chris Fiebrich
Dr. Fiebrich is the Manager of the Oklahoma Mesonet at the University of Oklahoma. He serves on the Science Review Panel for the Climate Reference Network (National Climatic Data Center), the Design Review Panel for the National Ecological Observing Network, the Committee on Measurements for the American Meteorological Society, and the Committee on Meteorology for the American Society for Testing and Materials. Dr. Fiebrich has managed successful projects funded by the U.S. Departments of Agriculture, Commerce, and Transportation; National Science Foundation; Oklahoma Water Resources Board; and Oklahoma Department of Environmental Quality. He holds B.S., M.S., and Ph. D. degrees in meteorology from the University of Oklahoma.

RightSizing Project NextGen IOC Sensor Assessment Summary
AJP-6830 57 of 64 December 1, 2009
Robert S. Frankel Dr. Frankel is a member of the technical staff in MIT Lincoln Laboratory’s Weather Sensing group. His work in this group has centered on the development of algorithms for wind-shear detection in radar-based systems, and on the design of such systems. Prior projects at the Laboratory and at Honeywell focused on the development of software tools for the design and laser-driven customization of integrated circuits. Earlier work included an assistant professorship of mathematics at the University of Massachusetts Boston. Dr. Frankel received a Ph.D. degree from the University of Wisconsin at Madison, and a B.A. degree from Harvard College, both in mathematics.
Paul Herzegh
Dr. Herzegh (NCAR Subteam Co-Lead) serves as a Project Scientist within the Research Applications Laboratory of the National Center for Atmospheric Research in Boulder, Colorado. In this role he leads the FAA-sponsored National Ceiling and Visibility Project Development Team (PDT). Before joining RAL, Dr. Herzegh served as Manager of NCAR’s Research Aviation Facility, and earlier roles as Manager of NCAR’s Research Data Program and Associate Manager of NCAR’s Field Observing Facility. Dr. Herzegh’s research publications include topics on the cloud processes of winter storms and the use of polarimetric radar and aircraft in storm research. He received a Ph.D. in Atmospheric Sciences from the University of Washington, and a B.S. in Geology from Case Western Reserve University.
John Hubbert
Dr. Hubbert is a Project Scientist/Engineer in NCAR’s EOL division. Since 2003, he has been the manager and lead scientist for NCAR’s NEXRAD Data Quality project, which is funded by the ROC (Radar Operations Center) of Norman, OK. He has also worked on data quality improvements for S-Pol, NCAR’s S-band polarimetric research radar. Dr. Hubbert received his Ph.D. from Colorado State University where he worked with Drs. Bringi and Chandrasekeron CSU-CHILL radar data and C-band polarimetric data from the German Aerospace (DLR) research radar POLDIRAD. Dr. Hubbert has 18 refereed journal publications and over 60 conference publications.
Scott Jensen
Mr. Jensen brings over a decade of experience in the software industry into his research, which is focused on collection and representation of observational and forecast generated metadata. Scott is in the final stages of completing his PhD in computer science at IU.
David Johnson
Dr. Johnson is a research meteorologist at the National Center for Atmospheric Research, working in broad areas of physical meteorology and remote sensing. He is the NCAR lead for participation in NASA’s Advanced Satellite Aviation-weather Products (ASAP) initiative and has served on the American Meteorological Society’s

RightSizing Project NextGen IOC Sensor Assessment Summary
AJP-6830 58 of 64 December 1, 2009
Committee on Satellite Oceanography and Meteorology. He has managed field programs for NCAR, and has advised foreign governments on meteorological radars and wind shear detection systems. He was recently the technical lead for a study of lightning detection systems for airports published by the National Academies’ Airport Cooperative Research Project (ACRP), and is a member of the NextGen Environmental Information (EI) Team. Dr. Johnson received his Ph.D. in Geophysical Sciences (Meteorology) from the University of Chicago.
Scott Landolt
Mr. Landolt is an Associate Scientist with the Research Applications Program at the National Center for Atmospheric Research. He is a resident expert on surface-based instrumentation, particularly with regard to precipitation sensors, and serves as an Adjunct Professor at Metropolitan State College of Denver where he teaches meteorological instrumentation. Mr. Landolt has earned a masters degree from the University of Colorado in Astrophysical, Atmospheric and Oceanic sciences, and also holds a bachelors degree in Meteorology from Metropolitan State College of Denver.
Frank Law
Mr. Law is a Senior Systems Engineer and Meteorologist with Data Transformation Corp (DTC), and is currently working on the FAA Reduce Weather Impact program and Sensors Network Right-Sizing project. He has supported aviation weather systems research, development, acquisition, and test for over 25 years while employed with DTC at the FAA William J. Hughes Technical Center. Mr. Law has provided systems engineering, meteorological, and test and evaluation support to various weather sensors and processors programs, including JAWS, AWRP, LLWAS, LIDAR, CIWS/RAPT, MWP, AWOS, and DUAT. Mr. Law carried out weather sensors and system performance assessments for JAWS, LLWAS–NE, and AWOS. Before working with DTC, he worked with the US Forest Service and Colorado State University (CSU) as a research assistant on two atmospheric boundary layer field studies. Mr. Law holds a M.S. degree in Civil Engineering, Fluid Mechanics and Wind Engineering Program, from CSU, and received his B.S. degree in Meteorology from the State University of New York, at Oswego.
Victor S. Passetti
Mr. Passetti is the FAA Aviation Weather Group’s (AWG) RightSizing Project Lead. He is a Senior Research Meteorologist with the AWG Operational Readiness and Impact Team at the William J. Hughes Technical Center (WJHTC). Besides leading the RightSizing Project, Mr. Passetti also serves as AWG Convective Weather Subject Matter Expert. Prior FAA experience includes providing operational support to the Weather and Radar Processor program, conducting meteorological evaluations of AWRP turbulence and icing products, and test and evaluation of the Operational and Supportability Implementation System. Prior to joining the FAA Mr. Passetti was a National Weather Service meteorologist that served in Flagstaff, AZ and Cleveland, Ohio. Mr. Passetti holds a Bachelors of Science degree in Meteorology with a minor in Geography from the Pennsylvania State University.

RightSizing Project NextGen IOC Sensor Assessment Summary
AJP-6830 59 of 64 December 1, 2009
Beth Plale
Dr. Plale is Director of the Center for Data and Search Informatics, Director of Data to Insight Center in the Pervasive Technologies Institute, and Associate Professor of Computer Science in the School of Informatics and Computing. Her research focus, which is highly interdisciplinary in nature and focused largely on earth and atmospheric science, is in data management and preservation, and high performance computing. Professor Plale began working with observational radar weather data while still in graduate school, and has been active ever since. Her expertise in data management in service oriented architectures led to significant contributions to the Linked Environments for Atmospheric Discovery (LEAD) SOA (www.leadportal.org) where she remains a PI and leader.
Andrew Reader
Mr. Reader is a research associate for the Office of Weather Programs and Projects (OWPP) at the University of Oklahoma. His duties include program management of multiple projects involving both domestic and international government agencies. Prior to working with OWPP, he served as program manager for the Oklahoma Mesonet’s public safety outreach programs, OK-First. OK-First provided education and decision support to emergency management and public safety officials across Oklahoma. He holds B.S. and M.S. degrees in meteorology from the University of Oklahoma.
Dino Rovito
Mr. Rovito is an Air Traffic Control Specialist in Weather Policy and Requirements for the FAA’s NextGen and Operations Planning, Aviation Weather Group and currently serves as the Liquid Water Equivalent (LWE) point-of-contact for the FAA’s Right-Sizing Sensor Network program. Mr. Rovito has worked for the FAA for more than 32 Years. Prior to working with the Weather Group, Mr. Rovito served as a Notice To Airmen (NOTAM) Specialist with the FAA’s Air Traffic Control System Command Center and also as an Air Traffic Control Specialist, Plans and Procedures Specialist, and Operations Supervisor in the FAA’s Flight Service Station option . He holds a Bachelor of Science Degree in Industrial Technology from Florida International University and an Associate in Science Degree in Aerospace Technology from Broward College.
Ernest Sessa
Mr. Sessa currently serves as a Senior Systems Engineer with SAIC and supports several NextGen efforts with the FAA’s Aviation Weather Group including RWI, NNEW, and NWEC. Mr. Sessa began his career in aviation weather as the Principle Design Engineer of the Automated Surface Observing System (ASOS) development and production contract for the FAA and NWS, and continued to support the program throughout its entire deployment. He is also responsible for the designs of many other weather systems and networks operational around the globe including AWOSs, RVRs, Road Weather Systems and the Saudi Arabian National Observing System. Throughout his tenure at All Weather Inc., Mr. Sessa served as Technical Director, Chief Scientist and finally VP of Engineering. More recently, he has been involved in commercial and consumer scale sensor and weather applications serving as the VP of Engineering and Operations for Gould Optronics, the VP of Technology for AWS Convergence Technologies (WeatherBug) and the Managing Director of Advanced Sensing and Reasoning. Mr. Sessa attained his Bachelors of Science in Electrical Engineering from Lehigh University, graduate studies in Applied Physics at Johns Hopkins University and is a certified Program Management Professional (PMP).

RightSizing Project NextGen IOC Sensor Assessment Summary
AJP-6830 60 of 64 December 1, 2009
Matthias Steiner
Dr. Steiner (NCAR Subteam Lead) is Deputy Director for the Hydrometeorological Applications Program (HAP) of the National Center for Atmospheric Research (NCAR) Research Applications Laboratory (RAL). He heads the storm prediction group and holds a tenured scientist appointment at NCAR. Before joining NCAR in 2006, Dr. Steiner was at Princeton University for more than a decade, researching a variety of topics that straddle the interface between atmospheric and hydrologic sciences. His professional interests reach across hydrometeorology, cloud and precipitation physics, mountain meteorology, radar and satellite meteorology, and more recently aviation weather. Dr. Steiner received his degrees from the Swiss Federal Institute of Technology (ETH) in Zurich, Switzerland. He has been contributing to several interdisciplinary, national and international field experiments and programs, such as the Mesoscale Alpine Program (MAP), the Tropical Rainfall Measuring Mission (TRMM), and the Tropical Ocean Global Atmosphere (TOGA) Coupled Ocean-Atmosphere Response Experiment (COARE). Dr. Steiner is a member of the AMS Committee on Aviation, Range, and Aerospace Meteorology (ARAM), a Fellow of the Royal Meteorological Society, and was the recipient of the 2002 Editor’s Award for the AMS Journal of Hydrometeorology.
Michael Wiltberger
Dr. Wiltberger is a scientist in the High Altitude Observatory (HAO) at the National Center for Atmospheric Research (NCAR) working primarily on numerical modeling of the highly coupled magnetosphere-ionosphere-thermosphere system. Prior to joining HAO Michael was a research professor at Dartmouth College and a graduate student in space plasma physics at the University of Maryland. He has a Ph.D in Physics from the University of Maryland and a bachelors degree in physics from Clarkson University.

RightSizing Project NextGen IOC Sensor Assessment Summary
AJP-6830 61 of 64 December 1, 2009
Appendix C- List of Acronyms
4-D Wx Data Cube Four-Dimensional Weather Data Cube 4-D Wx SAS Four-Dimensional Weather Single Authoritative Source ADDS Aviation Digital Display System ADF Airline Dispatchers Federation AK Alaska AMS American Meteorological Society ANSP Air Navigation Service Provider AOC Air and Space Operations Center AOPA Aircraft Owners and Pilots Association APA Allied Pilots Association ASOS Automated Surface Observing System ATA Air Transport Association ATA Arrival Transition Area ATC Air Traffic Control ATM Air Traffic Management ATO Air Traffic Organization (FAA) ATO-R Air Traffic Organization–System Operations Services BUFR Binary Universal Form for the Representation of Meteorological Data C&V Ceiling and Visibility CAT Clear Air Turbulence CIG Ceiling CIP/FIP Current/Forecast Icing Potential CIT Convective Induced Turbulence ConOps Concept of Operations CONUS Continental United States COP Common Operating Picture CPU Central Processing Unit CTAS Center-TRACON Automation System DOD Department of Defense DST Decision Support Tool DTA Departure Transition Time EA Enterprise Architecture EDR Eddy Dissipation Rate EMC Environmental Modeling Center (NCEP) ERAU Embry Riddle Aeronautical University FAA Federal Aviation Administration FCM Flow Contingency Management FIDO Forecast, Integration, Dissemination, Observation FIR United States Flight Information Region FL Flight Level

RightSizing Project NextGen IOC Sensor Assessment Summary
AJP-6830 62 of 64 December 1, 2009
Appendix C- List of Acronyms
FPAW Friends and Partners in Aviation Weather GA General Aviation GFS Global Forecast System GIG Global Information Grid GRIB2 General Regularly Distributed Information in Binary HDF5 Hierarchical Data Format HF Comms High-Frequency Communications ICAO International Civil Aviation Organization IFR Instrument Flight Rules IMC In Meteorological Conditions IOC Initial Operating Capability IWP Integrated Work Plan JSAT Joint Safety Analysis Team JSIT Joint Safety Implementation Team JPDO Joint Planning and Development Office METAR Aviation Routine Weather Report
METAR/SPECI Aviation Routine Weather Report/Aviation Selected Special Weather Report
MTBF Mean Time Between Failure MTTR Mean Time to Repair NAM North American Mesoscale NAS National Airspace System NASA National Aeronautics and Space Administration NATCA National Air Traffic Controllers Association NBAA National Business Aviation Association NCEP National Center For Environmental Prediction NCO NCEP Central Operations NCO O&M NCO Operations and Maintenance NEO Net Enabled Operations NEXRAD Next Generation Radar NextGen Next Generation Air Transportation System NOAA National Oceanic and Atmospheric Administration NWA Northwest Airlines NWS National Weather Service OEP Operational Evolution Partnership OI Operational Improvement PIREPS Pilot Reports PNT Position, Navigation, Timing Services R&D Research and Development RAA Regional Airline Association
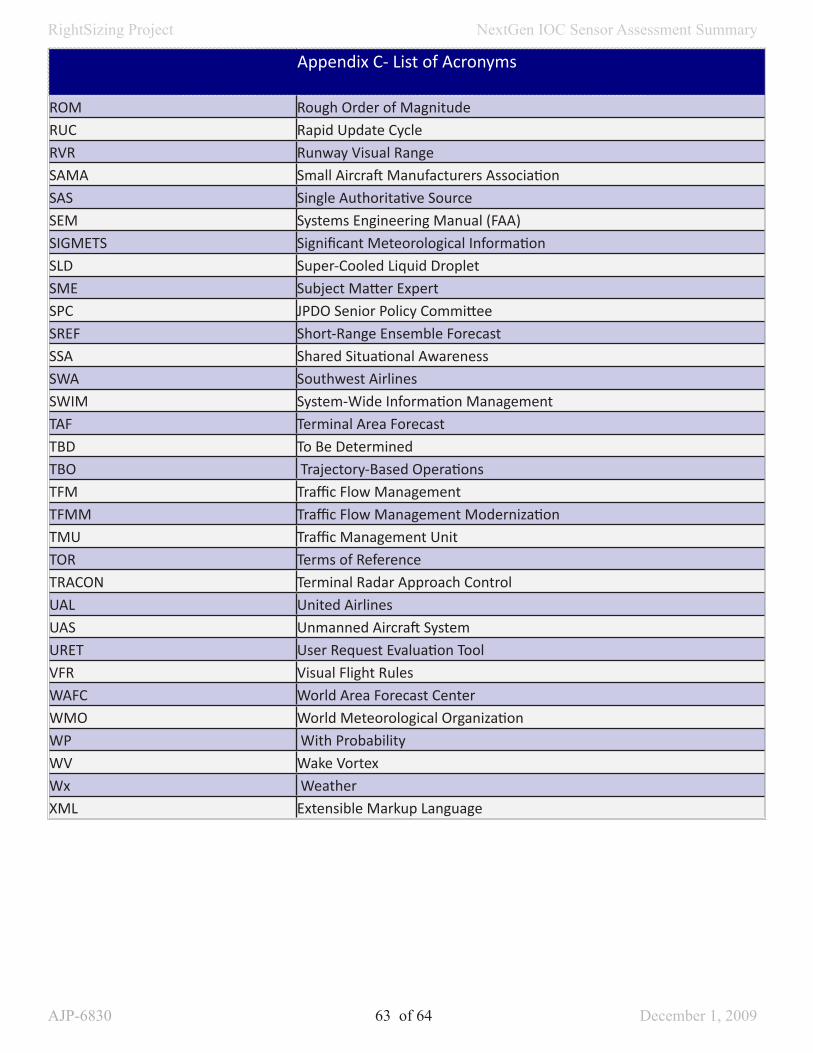
RightSizing Project NextGen IOC Sensor Assessment Summary
AJP-6830 63 of 64 December 1, 2009
Appendix C- List of Acronyms
ROM Rough Order of Magnitude RUC Rapid Update Cycle RVR Runway Visual Range SAMA Small Aircraft Manufacturers Association SAS Single Authoritative Source SEM Systems Engineering Manual (FAA) SIGMETS Significant Meteorological Information SLD Super-Cooled Liquid Droplet SME Subject Matter Expert SPC JPDO Senior Policy Committee SREF Short-Range Ensemble Forecast SSA Shared Situational Awareness SWA Southwest Airlines SWIM System-Wide Information Management TAF Terminal Area Forecast TBD To Be Determined TBO Trajectory-Based Operations TFM Traffic Flow Management TFMM Traffic Flow Management Modernization TMU Traffic Management Unit TOR Terms of Reference TRACON Terminal Radar Approach Control UAL United Airlines UAS Unmanned Aircraft System URET User Request Evaluation Tool VFR Visual Flight Rules WAFC World Area Forecast Center WMO World Meteorological Organization WP With Probability WV Wake Vortex Wx Weather XML Extensible Markup Language

RightSizing Project NextGen IOC Sensor Assessment Summary
AJP-6830 64 of 64 December 1, 2009