Embed Size (px)
Citation preview

1© 2019 Flexera. All rights reserved. This work by Flexera is licensed under a Creative Commons Attribution 4.0 International License.
2019As Cloud Use Grows, Organizations Focus on Cloud Costs and Governance
RightScale®
STATE OF THE CLOUD REPORT from Flexera™

2© 2019 Flexera. All rights reserved. This work by Flexera is licensed under a Creative Commons Attribution 4.0 International License.
Executive SummaryRightScale was recently acquired by Flexera, a provider of technology asset management solutions that help enterprises gain insights on how to optimize spend and reduce risk. The same RightScale cloud industry research team that has been producing the State of the Cloud Report for the past eight years has joined Flexera, and has again conducted the annual State of the Cloud Survey and prepared the resulting analysis for the RightScale 2019 State of the Cloud report from Flexera.
In January 2019, Flexera surveyed 786 technical professionals across a broad cross-section of organizations about their adoption of cloud computing.
The 2019 State of the Cloud Survey identified several key findings:
84 percent of respondents have a multi-cloud strategy. • 84 percent of enterprises have a multi-cloud strategy. • Enterprises with a hybrid strategy (combining public and private clouds)
grows to 58 percent in 2019 from 51 percent in 2018, while the number of organizations with a strategy of multiple public clouds or multiple private clouds declines slightly.
94 percent of respondents use cloud. • Public cloud adoption is 91 percent and private cloud adoption is
72 percent. • 69 percent of respondents use at least one public and one private cloud.
Enterprises are prioritizing a balance of public and private clouds. • Public cloud is the top priority of 31 percent of enterprises. • Many companies are taking a balanced approach, with 28 percent
prioritizing hybrid cloud and an additional 17 percent prioritizing public and private cloud equally.
As Cloud Use Grows, Organizations Focus on Cloud Costs and Governance
RIGHTSCALE 2019 STATE OF THE CLOUD REPORT FROM FLEXERA™

3© 2019 Flexera. All rights reserved. This work by Flexera is licensed under a Creative Commons Attribution 4.0 International License.
Organizations leverage almost 5 clouds on average. • Respondents are already running applications in a combination of 3.4
public and private clouds and experimenting with 1.5 more, for a total of 4.9 clouds.
• Among those using any public cloud, respondents are currently using 2.0 public clouds and experimenting with 1.8 more.
• Among those using any private cloud, respondents are currently using 2.7 private clouds and experimenting with 2.0 more.
Enterprise cloud spend is significant and growing quickly. • Companies plan to spend 24 percent more on public cloud in 2019
vs. 2018. • 13 percent of enterprises spend more than $12 million a year on public
cloud, while 50 percent spend more than $1.2 million annually. • Public cloud spend is growing 3 times faster than private cloud usage
(24 percent vs. 8 percent). • SMBs generally have fewer workloads overall and therefore smaller cloud
bills, but 11 percent of SMBs still exceed $1.2 million in annual spend.
Companies run a majority of workloads in cloud. • Respondents overall run 38 percent of workloads in public cloud and
41 percent in private cloud (which may include cloud-enabled virtual environments).
• Enterprises run 33 percent of workloads in public cloud and 46 percent in private cloud.
• SMBs run 43 percent of workloads in public cloud and 35 percent in private cloud.
Enterprise central IT focuses on managing and optimizing cloud costs. • 66 percent of enterprises already have a central cloud team or cloud
center of excellence, with another 21 percent planning one. • Among SMBs, only 31 percent have a central cloud team. • For enterprises, the top responsibilities of central IT are managing and
optimizing cloud services costs (68 percent), deciding or advising on which applications to run in which clouds (62 percent), and setting policies for cloud use (59 percent).
• Within the enterprise, most of the responsibility for governing and optimizing cloud costs is falling on the central cloud team and the infrastructure and operations team, while business units frequently own the cloud budget.

4© 2019 Flexera. All rights reserved. This work by Flexera is licensed under a Creative Commons Attribution 4.0 International License.
Managing cloud spend and cloud governance are the top challenges for enterprises. • Cloud cost management and cloud governance are top challenges
regardless of cloud maturity. • Among enterprises, optimizing cloud costs (84 percent in 2019 vs.
80 percent in 2018) and cloud governance (84 percent in 2019 vs. 77 percent in 2018) are growing challenges.
• Managing software licenses that are running in public cloud environments is also becoming a top-of-mind issue. Key challenges are understanding the cost implications of licensed software running in the cloud (52 percent), the complexity of license rules in public cloud (42 percent), and ensuring that they are following the rules (41 percent).
The #1 priority in 2019 is cloud cost optimization. • Optimizing existing cloud use for cost savings continues to be the top
initiative in 2019 for the third year in a row, increasing to 64 percent from 58 percent in 2018.
• The challenge of managing cloud spend grows as cloud use increases. While 64 percent of all respondents cite optimizing cloud spend as the top initiative, that number is even higher among intermediate and advanced cloud users at 70 percent and 76 percent, respectively.
• Other top initiatives include moving more workloads to cloud (58 percent), expanding the use of containers and adopting a cloud-first strategy (tied at 39 percent), and implementing automated policies for governance (35 percent).
Cloud users are not doing all they can to optimize costs. • Cloud users underestimate the amount of wasted cloud spend.
Respondents estimate 27 percent waste in 2019, while Flexera has measured actual waste at 35 percent.
• Despite an increased focus on cloud cost management, only a minority of companies have implemented automated policies to address this issue, such as shutting down unused workloads or rightsizing instances.
• Cloud users are not fully leveraging the various cloud provider discounting options. Among Amazon Web Services® (AWS) users only 47 percent use AWS Reserved Instances, while Microsoft Azure users leverage Reserved Instances only 23 percent of the time.

5© 2019 Flexera. All rights reserved. This work by Flexera is licensed under a Creative Commons Attribution 4.0 International License.
Container use is up, and Kubernetes use is skyrocketing. • The use of Docker® containers continues to grow, with adoption increasing
to 57 percent from 49 percent in 2018. • Kubernetes, a container orchestration tool that leverages Docker, achieved
faster growth, increasing from 27 percent to 48 percent adoption. • Enterprise adoption is even higher, with 66 percent using Docker and 60
percent leveraging Kubernetes. • The AWS container service (ECS/EKS) has 44 percent adoption in 2019 (flat
from 2018), while Azure Container Service adoption reaches 28 percent (up from 20 percent in 2018) and Google Container Engine grows slightly to reach adoption of 15 percent.
Ansible takes the top spot among configuration tools. • Among all respondents, Ansible has 41 percent adoption, followed by Chef
and Puppet at 37 percent adoption. • Ansible has an even higher adoption rate among enterprises (53 percent),
as do Chef and Puppet, tied with 50 percent adoption each. • Ansible leads among SMBs again this year with 26 percent adoption,
followed by Terraform and Chef. • Terraform shows the strongest growth since last year, up by 55 percent
from 20 to 31 percent adoption.
Azure continues to grow quickly and reduce the AWS lead, especially among enterprises. • Overall Azure adoption grew from 45 to 52 percent to narrow the gap
with AWS. As a result, Azure adoption has now reached 85 percent of AWS adoption, up from 70 percent last year.
• Azure continues to catch up with AWS overall especially among enterprises, where Azure adoption increases slightly from 58 percent to 60 percent, while AWS adoption in this group is relatively flat at 67 percent. This puts Azure with 89 percent of the AWS adoption level based on the overall number of respondents using each cloud.
• Google maintains its third-place position, increasing slightly from 18 to 19 percent adoption.
• In its second year of availability, VMware Cloud on AWS moves up to fourth position this year, increasing to 12 percent from 8 percent in 2018, a growth rate of 50 percent.
• Among other public cloud providers that were included in the survey last year, all saw increased adoption this year especially among enterprises, with Oracle growing from 10 to 16 percent (60 percent growth rate), IBM Cloud from 15 to 18 percent (20 percent growth rate), and Alibaba from 2 to 4 percent (100 percent growth rate).

6© 2019 Flexera. All rights reserved. This work by Flexera is licensed under a Creative Commons Attribution 4.0 International License.
• Enterprise respondents with future projects (the combination of experimenting and planning to use) show the most interest in Google (41 percent).
• Among earlier-stage cloud users, AWS and Azure are closer, with 52 percent of cloud beginners choosing AWS vs. 41 percent for Azure. Google sees significantly stronger adoption when users are advanced (24 percent) vs. beginner (9 percent adoption).
Use of PaaS services from public cloud providers is exploding. • Serverless is the top-growing extended cloud service for the second year in
a row, with a 50 percent growth over 2018 (24 to 36 percent adoption). • Stream processing is tied for first, increasing from 20 to 30
percent adoption. • Machine learning, container-as-a-service, and IoT are the next
fastest growing. • Among enterprises, relational DBaaS (60 percent), data warehouse
(50 percent), and push notifications (50 percent) are in the top three positions, while container-as-a-service is fourth (48 percent).
• Machine learning has the highest interest for future use, with 48 percent of all respondents experimenting with or planning to use it.
Private cloud adoption is increasing slowly. • In 2019, adoption of private cloud is increasing slowly across
most providers. • Overall, VMware vSphere continues to lead with 50 percent adoption, flat
from last year. • OpenStack (28 percent), VMware vCloud Director (27 percent), Microsoft
System Center (25 percent), and bare metal cloud (24 percent) all show small increases compared to 2018.
• Azure Stack is in the sixth slot, but shows the highest growth (22 percent in 2019 vs. 17 percent in 2018).
• AWS Outpost was announced in late 2018 and showed strong adoption out of the gate (12 percent) and strong interest for future use (29 percent).
Workloads in Azure are growing but lag AWS. • Among all respondents, 13 percent have more than 1,000+ VMs in vSphere,
as compared to 11 percent in AWS and 6 percent in Azure. • AWS leads in respondents with more than 100 VMs, (33 percent for AWS vs.
27 percent for VMware and 25 percent for Azure). • Year over year, Azure showed the largest increase in percentage of users,
with more than 100 VMs from 17 percent in 2018 to 25 percent in 2019.

7© 2019 Flexera. All rights reserved. This work by Flexera is licensed under a Creative Commons Attribution 4.0 International License.
MethodologyIn January 2019, Flexera conducted its annual State of the Cloud Survey. The survey questioned technical professionals across a broad cross-section of organizations about their adoption of cloud infrastructure. The 786 respondents range from technical executives to managers and practitioners and represent organizations of varying sizes across many industries. Respondents represent companies across the cloud spectrum, including both users (21 percent) and non-users (79 percent) of RightScale Cloud Management Platform from Flexera. Their answers provide a comprehensive perspective on the state of the cloud today.
Key Survey Stats:All respondents = 786 • Enterprise respondents (1,000+ employees) = 456 • SMB respondents (<1,000 employees) = 330
Margin of error = 3 percent
Use of Charts and Data in This ReportWe encourage the re-use of data, charts, and text published in this report under the terms of this Creative Commons Attribution 4.0 International License. You are free to share and make commercial use of this work as long as you attribute the RightScale 2019 State of the Cloud Report from Flexera as stipulated in the terms of the license.

8© 2019 Flexera. All rights reserved. This work by Flexera is licensed under a Creative Commons Attribution 4.0 International License.
Respondent Demographics
9© 2019 Flexera. All rights reserved. This work by Flexera is licensed under a Creative Commons Attribution 4.0 International License.
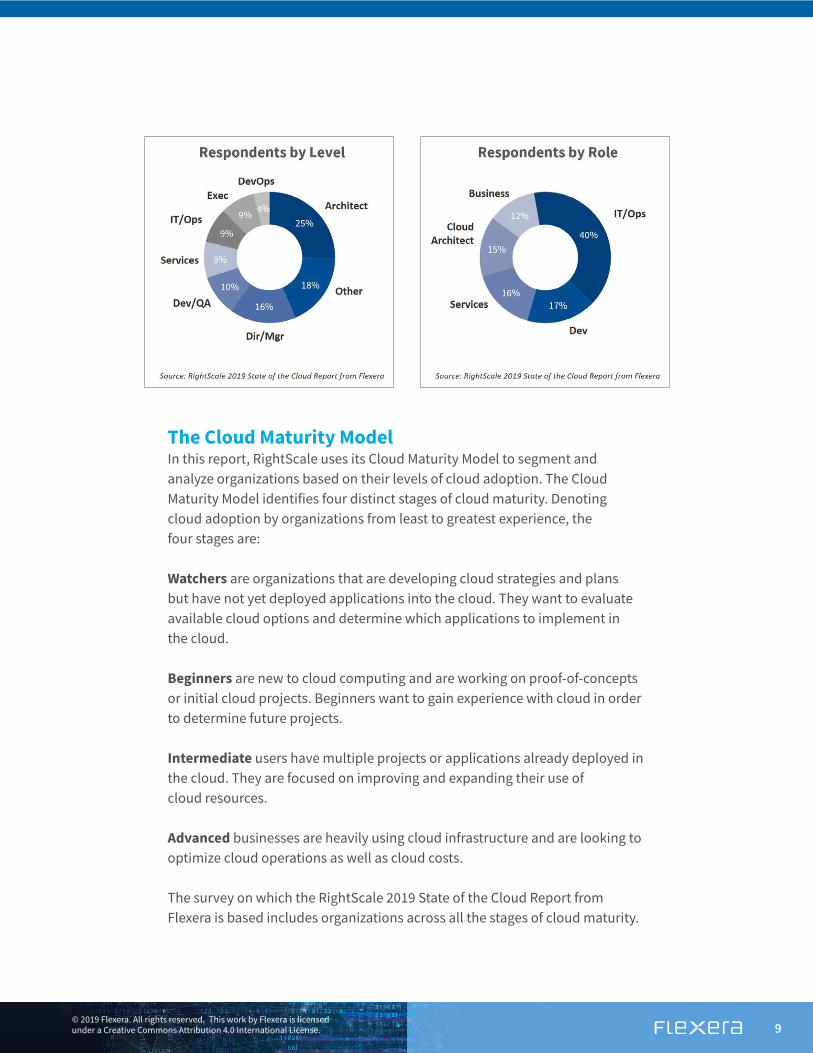
The Cloud Maturity ModelIn this report, RightScale uses its Cloud Maturity Model to segment and analyze organizations based on their levels of cloud adoption. The Cloud Maturity Model identifies four distinct stages of cloud maturity. Denoting cloud adoption by organizations from least to greatest experience, the four stages are:
Watchers are organizations that are developing cloud strategies and plans but have not yet deployed applications into the cloud. They want to evaluate available cloud options and determine which applications to implement in the cloud.
Beginners are new to cloud computing and are working on proof-of-concepts or initial cloud projects. Beginners want to gain experience with cloud in order to determine future projects.
Intermediate users have multiple projects or applications already deployed in the cloud. They are focused on improving and expanding their use of cloud resources.
Advanced businesses are heavily using cloud infrastructure and are looking to optimize cloud operations as well as cloud costs.
The survey on which the RightScale 2019 State of the Cloud Report from Flexera is based includes organizations across all the stages of cloud maturity.

10© 2019 Flexera. All rights reserved. This work by Flexera is licensed under a Creative Commons Attribution 4.0 International License.
When comparing cloud adoption in large and small companies, over two-thirds (68 percent) of enterprise respondents are now in the two most mature stages — Intermediate and Advanced.

11© 2019 Flexera. All rights reserved. This work by Flexera is licensed under a Creative Commons Attribution 4.0 International License.
In the last year, the proportion of enterprises in the Intermediate and Advanced stages has continued to increase — now representing 68 percent of respondents in 2019 vs. 66 percent in 2018.

12© 2019 Flexera. All rights reserved. This work by Flexera is licensed under a Creative Commons Attribution 4.0 International License.
Key Findings84 percent of enterprises have a multi-cloud strategy.The percentage of enterprises that have a strategy to use multiple clouds is 84 percent (vs. 81 percent in 2018), while those planning a hybrid cloud strategy grew to 58 percent (from 51 percent in 2018). There was a slight decrease in the number of enterprises with a strategy of multiple public clouds or multiple private clouds.

13© 2019 Flexera. All rights reserved. This work by Flexera is licensed under a Creative Commons Attribution 4.0 International License.
SMBs lean toward public cloud, with 44 percent preferring either single or multiple public clouds.

14© 2019 Flexera. All rights reserved. This work by Flexera is licensed under a Creative Commons Attribution 4.0 International License.
94 percent of respondents use cloud.The overall portion of respondents using at least one public or private cloud is 94 percent. The number of respondents adopting public cloud is 91 percent. The number of respondents now adopting private cloud is 72 percent.
Enterprises are prioritizing a balance of public and private clouds.Among enterprises, the central IT team is typically tasked with assembling a hybrid portfolio of clouds. This year, while 31 percent of enterprises see public cloud as their top priority, a combined 45 percent of enterprises see hybrid cloud or a balanced approach between public and private as the biggest focus.
Only 9 percent of enterprises are focusing on building a private cloud, and 6 percent see their top priority as using a hosted private cloud.

15© 2019 Flexera. All rights reserved. This work by Flexera is licensed under a Creative Commons Attribution 4.0 International License.
Organizations leverage almost 5 clouds on average.On average, survey respondents are using 4.9 clouds across both public and private. Respondents are already running applications in 3.4 clouds and experimenting with 1.5 more.
Among companies that use at least one public cloud, they are already running applications in an average of 2.0 public clouds and experimenting with another 1.8 public clouds. Although fewer companies are using private clouds, those that do use more, running applications in an average of 2.7 private clouds and experimenting with an additional 2.0 private clouds.
16© 2019 Flexera. All rights reserved. This work by Flexera is licensed under a Creative Commons Attribution 4.0 International License.
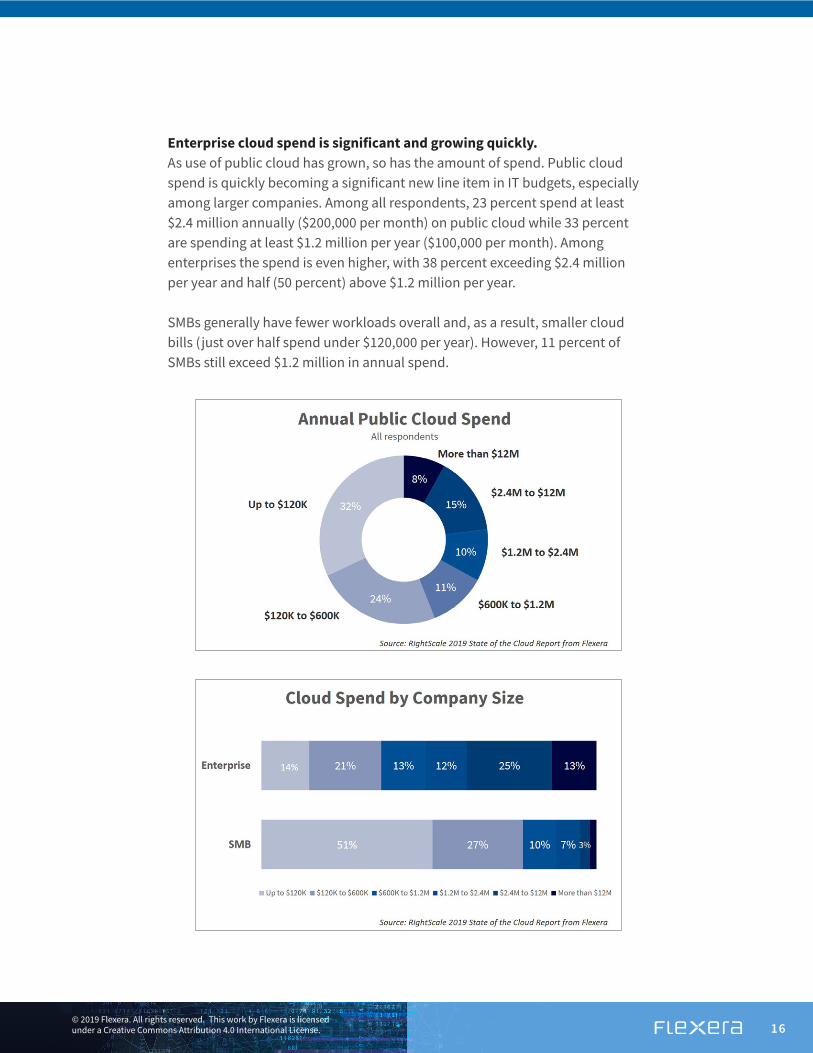
Enterprise cloud spend is significant and growing quickly.As use of public cloud has grown, so has the amount of spend. Public cloud spend is quickly becoming a significant new line item in IT budgets, especially among larger companies. Among all respondents, 23 percent spend at least $2.4 million annually ($200,000 per month) on public cloud while 33 percent are spending at least $1.2 million per year ($100,000 per month). Among enterprises the spend is even higher, with 38 percent exceeding $2.4 million per year and half (50 percent) above $1.2 million per year.
SMBs generally have fewer workloads overall and, as a result, smaller cloud bills (just over half spend under $120,000 per year). However, 11 percent of SMBs still exceed $1.2 million in annual spend.

17© 2019 Flexera. All rights reserved. This work by Flexera is licensed under a Creative Commons Attribution 4.0 International License.
Companies are not only using a lot of public cloud, but also planning to grow public cloud spend faster than private cloud use. On average, respondents plan to grow public cloud spend by 24 percent in 2019, while growing private cloud use by 8 percent.
Companies run a majority of workloads in cloud.Respondents run 79 percent of workloads in cloud, with 38 percent of workloads in public cloud and 41 percent in private cloud. It’s important to note that the workloads running in private cloud may include workloads running in existing virtualized environments or bare-metal environments that have been “cloudified.”

18© 2019 Flexera. All rights reserved. This work by Flexera is licensed under a Creative Commons Attribution 4.0 International License.
Enterprises run 79 percent of workloads in cloud, with more in private cloud (46 percent) vs. public cloud (33 percent). SMBs run 78 percent of workloads in cloud, with more in public cloud (43 percent) vs. private cloud (35 percent).

19© 2019 Flexera. All rights reserved. This work by Flexera is licensed under a Creative Commons Attribution 4.0 International License.
Most enterprises have a central cloud team.As companies adopt cloud-first strategies, they are increasingly creating a central cloud team or a “Cloud Center of Excellence.” These teams provide centralized controls, tools, and best practices to help accelerate the use of cloud while reducing costs and risk.
Overall, more than half of companies (51 percent) already have a central cloud team. Enterprises have an even stronger need for centralized governance within their larger organizations: 66 percent of enterprises already have a central cloud team, with another 21 percent planning one. Even among SMBs, 31 percent have a central cloud team, with 25 percent planning one.

20© 2019 Flexera. All rights reserved. This work by Flexera is licensed under a Creative Commons Attribution 4.0 International License.
Enterprise central IT focuses on managing and optimizing cloud costs.This year we saw the top responsibility of central cloud teams shift to managing cloud costs (68 percent in 2019 vs. 64 percent in 2018). Central IT teams also are focused on governance, including advising on applications appropriate for cloud (62 percent), setting policies (59 percent), and using automated cloud policies (57 percent).
However, there is now a significant gap between the view of central IT and that of the business units they support. Respondents in business units within the enterprise are less likely overall to delegate authority to central IT.

21© 2019 Flexera. All rights reserved. This work by Flexera is licensed under a Creative Commons Attribution 4.0 International License.
Central IT teams take on cloud costs, while business units own the budgets.Within the enterprise, we see that most of the responsibility to govern and optimize cloud costs is falling on the central cloud team as well as the infrastructure and operations team. Business units are more likely to own cloud budgets. IT finance is taking an equal role to chargeback cloud costs. The software asset management and vendor management teams are not yet taking a significant role in managing cloud spend.
Top cloud challenges in 2019 are governance, expertise, and spend.In 2019, the top 5 challenges are all very close in how often they are cited by respondents. Governance, expertise, spend, security, and compliance are a challenge for between 76 and 79 percent of respondents.
Overall, the complexity of larger enterprises translates into a higher level of challenges across the board, with cloud spend and cloud governance tied for the top challenge at 84 percent.

22© 2019 Flexera. All rights reserved. This work by Flexera is licensed under a Creative Commons Attribution 4.0 International License.
Enterprise cloud challenges grow year over year.Even though enterprises are becoming more experienced with cloud, the rise in cloud use is leading to an increase in enterprise cloud challenges around managing cloud spend (84 percent in 2019 vs. 80 percent in 2018), governance (84 percent in 2019 vs. 77 percent in 2018), compliance (79 percent in 2019 vs. 74 percent in 2018), and managing the use of multiple clouds (76 percent in 2019 vs. 68 percent in 2018).

23© 2019 Flexera. All rights reserved. This work by Flexera is licensed under a Creative Commons Attribution 4.0 International License.
As companies become more experienced with cloud, the top challenge shifts. While cloud spend and governance remain in the top three challenges for all maturity levels, expertise and cloud migration challenges decrease as companies gain more experience with cloud.
24© 2019 Flexera. All rights reserved. This work by Flexera is licensed under a Creative Commons Attribution 4.0 International License.
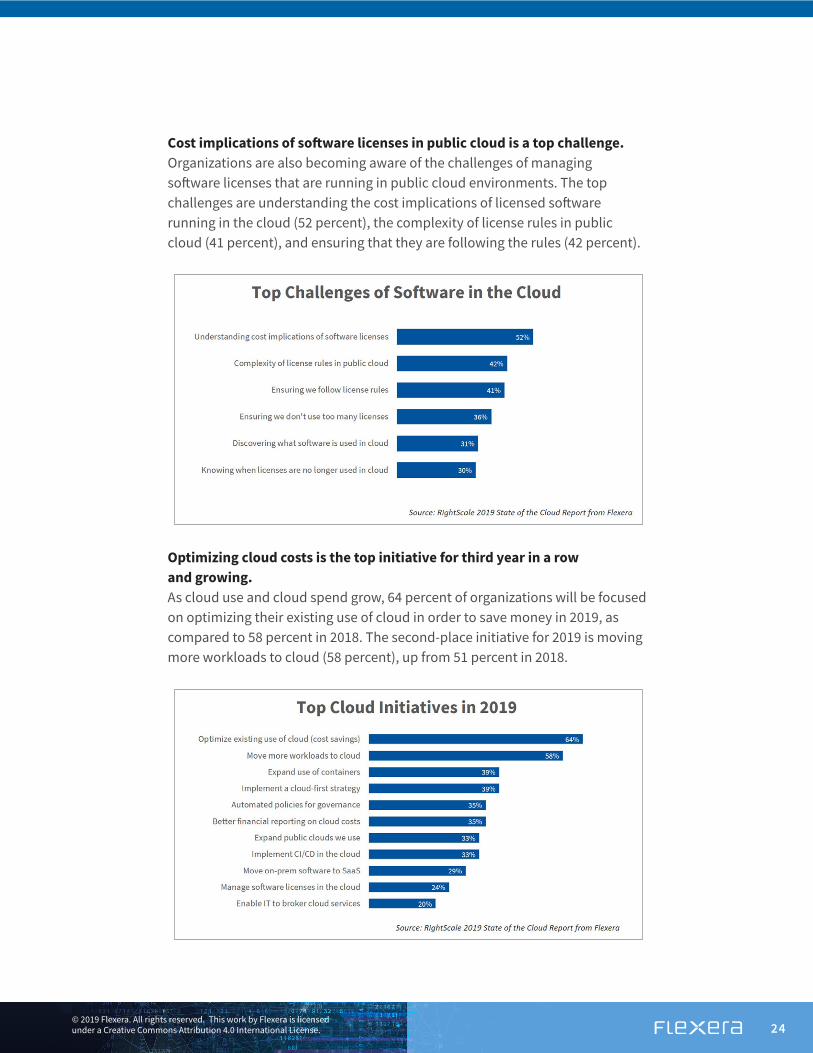
Optimizing cloud costs is the top initiative for third year in a row and growing.As cloud use and cloud spend grow, 64 percent of organizations will be focused on optimizing their existing use of cloud in order to save money in 2019, as compared to 58 percent in 2018. The second-place initiative for 2019 is moving more workloads to cloud (58 percent), up from 51 percent in 2018.
Cost implications of software licenses in public cloud is a top challenge.Organizations are also becoming aware of the challenges of managing software licenses that are running in public cloud environments. The top challenges are understanding the cost implications of licensed software running in the cloud (52 percent), the complexity of license rules in public cloud (41 percent), and ensuring that they are following the rules (42 percent).

25© 2019 Flexera. All rights reserved. This work by Flexera is licensed under a Creative Commons Attribution 4.0 International License.
As cloud users become more mature, optimizing cloud spend becomes even more important. It is cited by 53 percent of beginner, 70 percent of intermediate, and 76 percent of advanced respondents.

26© 2019 Flexera. All rights reserved. This work by Flexera is licensed under a Creative Commons Attribution 4.0 International License.
Cloud users are not doing all they can to optimize cloud spend.Despite an increased focus on cloud cost management, only a minority of companies have begun to implement automated policies to optimize cloud costs, such as shutting down unused workloads or rightsizing instances. In addition, very little progress has been made from 2018 to 2019 in increasing the use of automated policies. This represents an opportunity for increased efficiency and increased savings, since manual policies are difficult to monitor and enforce.
Cloud users underestimate their wasted cloud spend.Even though managing cloud costs is a top challenge and a top initiative, cloud users continue to underestimate the amount of wasted cloud spend. Respondents estimated 27 percent waste, while Flexera has measured actual waste at 35 percent.

27© 2019 Flexera. All rights reserved. This work by Flexera is licensed under a Creative Commons Attribution 4.0 International License.
In addition, cloud users are not taking advantage of all the available discounts from cloud providers. Fewer than half of AWS users (47 percent) leverage Reserved Instances, and only 23 percent of Azure users do so.
Container use is up, and Kubernetes use is skyrocketing.With the steep rise in the use of containers, Docker continues to show strong growth. Overall Docker adoption increased to 57 percent from 49 percent last year. Kubernetes, a container orchestration tool that leverages Docker, saw the fastest growth, growing from 27 percent to 48 percent adoption.
Many users also choose container-as-a-service offerings from the public cloud providers. The AWS container service (ECS/EKS) had 44 percent adoption in 2019 (flat from 2018). Azure Container Service adoption reached 28 percent (up from 20 percent in 2018), and Google Container Engine grew slightly to reach adoption of 15 percent.

28© 2019 Flexera. All rights reserved. This work by Flexera is licensed under a Creative Commons Attribution 4.0 International License.
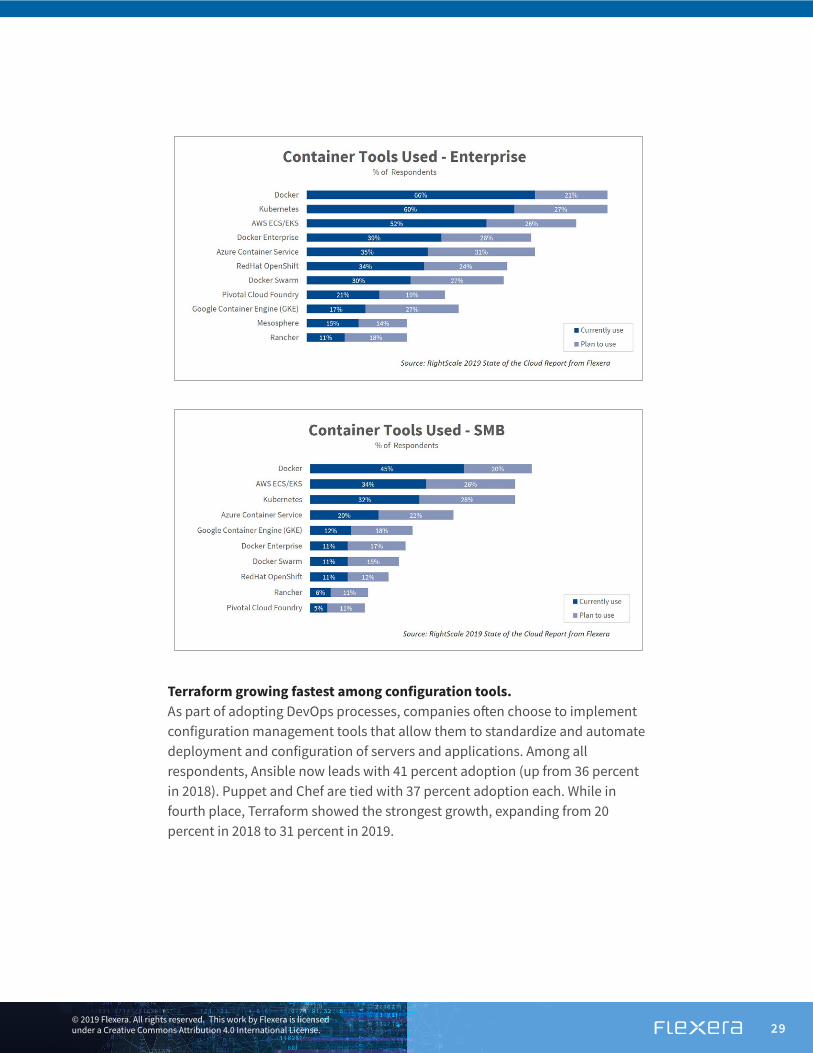
Enterprise use of containers and Kubernetes is becoming ubiquitous, with Docker reaching 66 percent adoption among larger companies and Kubernetes reaching 60 percent. SMB use of containers is lower, but they show strong interest in using Kubernetes in the future, with 28 percent planning to use it on top of the 32 percent using it today.
29© 2019 Flexera. All rights reserved. This work by Flexera is licensed under a Creative Commons Attribution 4.0 International License.
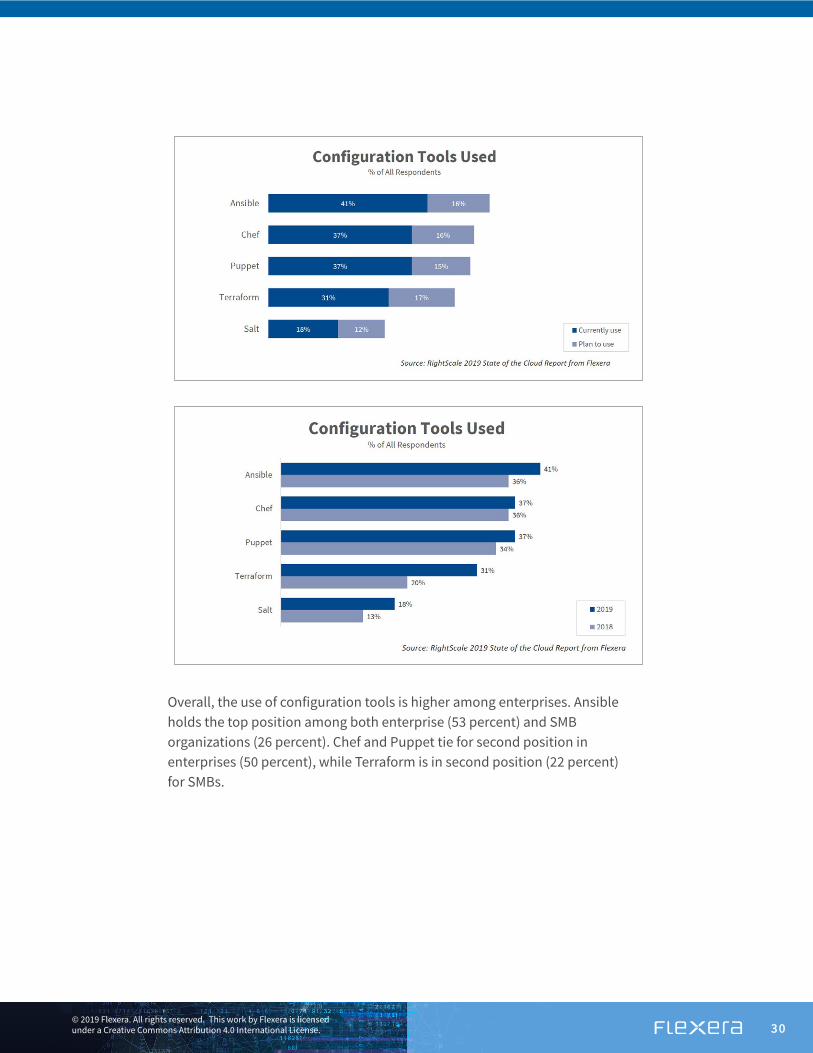
Terraform growing fastest among configuration tools.As part of adopting DevOps processes, companies often choose to implement configuration management tools that allow them to standardize and automate deployment and configuration of servers and applications. Among all respondents, Ansible now leads with 41 percent adoption (up from 36 percent in 2018). Puppet and Chef are tied with 37 percent adoption each. While in fourth place, Terraform showed the strongest growth, expanding from 20 percent in 2018 to 31 percent in 2019.
30© 2019 Flexera. All rights reserved. This work by Flexera is licensed under a Creative Commons Attribution 4.0 International License.
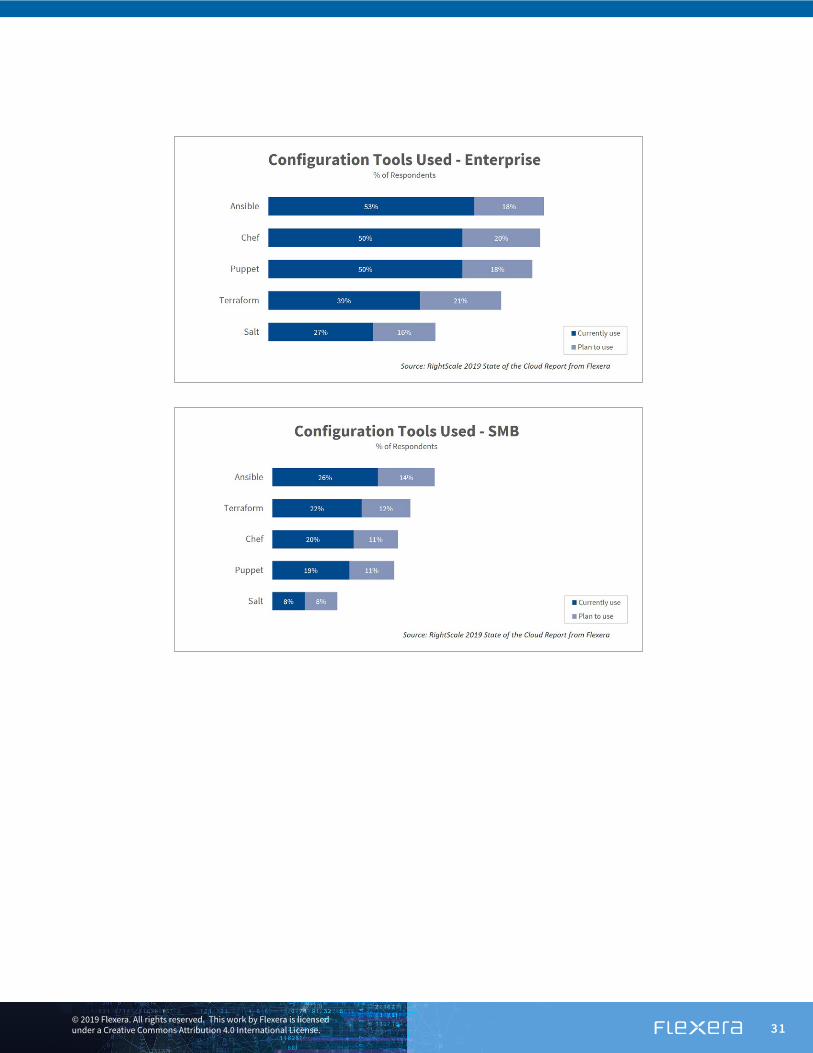
Overall, the use of configuration tools is higher among enterprises. Ansible holds the top position among both enterprise (53 percent) and SMB organizations (26 percent). Chef and Puppet tie for second position in enterprises (50 percent), while Terraform is in second position (22 percent) for SMBs.
31© 2019 Flexera. All rights reserved. This work by Flexera is licensed under a Creative Commons Attribution 4.0 International License.

32© 2019 Flexera. All rights reserved. This work by Flexera is licensed under a Creative Commons Attribution 4.0 International License.
Both Public and Private Cloud Adoption Grows
We asked respondents to tell us which clouds they were using and whether they were running applications in cloud, experimenting with cloud, planning to use cloud, or had no plans to use cloud. Most respondents are using more than one cloud, so totals will add up to more than 100 percent.
It’s important to note that adoption (the percentage of respondents who use a particular cloud) is only one of the factors that influences revenue growth for the cloud provider. Other factors include the number of VMs running as well as other cloud services being used.
Azure continues to grow quickly and reduce the AWS lead, especially among enterprises.In 2019, AWS continues to lead in public cloud adoption, but adoption of other public clouds is growing more quickly. Azure especially is now nipping at the heels of AWS, especially in larger companies.
Overall Azure adoption grew from 45 to 52 percent to narrow the gap with AWS. As a result, Azure adoption has now reached 85 percent of AWS adoption, up from 70 percent last year.
Google maintained its third-place position, increasing slightly from 18 to 19 percent adoption. VMware Cloud on AWS moved up to fourth position this year, increasing to 12 percent from 8 percent in 2018, a growth rate of 50 percent.
We can also gauge interest and potential for future adoption by measuring respondents who are experimenting or planning to use particular clouds. This year there was a higher percentage of respondents experimenting or planning to use Google (36 percent) versus other clouds. This indicates a potential for Google to accelerate adoption in future years as the respondents’ experiments and plans come to fruition.

33© 2019 Flexera. All rights reserved. This work by Flexera is licensed under a Creative Commons Attribution 4.0 International License.
Among enterprises, Azure increased adoption slightly from 58 percent to 60 percent, while AWS adoption in this group was relatively flat at 67 percent. This puts Azure with 89 percent of AWS’ adoption level based on the number of respondents using each cloud.
Among other cloud providers included in the survey last year, all saw increased adoption this year, with VMware Cloud on AWS growing from 12 to 18 percent (50 percent growth rate), Oracle growing from 10 to 16 percent (60 percent growth rate), IBM Cloud from 15 to 18 percent (20 percent growth rate), and Alibaba from 2 to 4 percent (100 percent growth rate).
Enterprise respondents with future projects (the combination of experimenting and planning to use) show the most interest in Google (41 percent).

34© 2019 Flexera. All rights reserved. This work by Flexera is licensed under a Creative Commons Attribution 4.0 International License.
Among SMBs, AWS adoption decreased from 60 to 53 percent, while Azure grew from 32 to 41 percent (28 percent growth rate). Azure is at just over three-quarters the adoption of AWS (77 percent) among these smaller companies.
Google and IBM were flat, while Oracle, Alibaba, and VMware Cloud on AWS grew among the smaller companies.
SMB respondents with future projects (the combination of experimenting and planning to use) show the most interest in Google (30 percent), followed closely by AWS (29 percent).

35© 2019 Flexera. All rights reserved. This work by Flexera is licensed under a Creative Commons Attribution 4.0 International License.
AWS and Google get stronger with more mature users.The cloud maturity of an organization typically correlates to the length of time it has been using cloud. That correlation is due to the time it takes to build cloud expertise and create processes and best practices across the organization. Because AWS was the first large-scale cloud provider, AWS is used more frequently by advanced (i.e., longer-term) cloud users. Across all respondents, 72 percent of advanced cloud users leverage AWS vs. 57 percent using Azure.
Google sees significantly stronger adoption when users are advanced (24 percent) versus beginner (9 percent adoption).

36© 2019 Flexera. All rights reserved. This work by Flexera is licensed under a Creative Commons Attribution 4.0 International License.

37© 2019 Flexera. All rights reserved. This work by Flexera is licensed under a Creative Commons Attribution 4.0 International License.
Serverless is the top-growing extended cloud service.A significant number of public cloud users are now leveraging services beyond just the basic compute, storage, and network services. Among the most popular extended services, relational DBaaS and push notifications continue to hold the top two positions in 2019, while data warehouse moved up significantly to the third position.
Future interest can be gauged by looking at the respondents who are experimenting with or plan to use a particular service. Machine learning garners the top scores for future interest. While only 26 percent currently use machine learning, 48 percent are considering it for the future. Just behind is IoT (41 percent) as well as container-as-a-service and serverless (39 percent).
Year over year, serverless was the top-growing extended cloud service for the second year in a row, with a 50 percent increase over 2018 (24 to 36 percent adoption). Stream processing was tied for fastest growing, with an increase from 20 to 30 percent adoption. Machine learning, container-as-a-service, and IoT were the next fastest growing.

38© 2019 Flexera. All rights reserved. This work by Flexera is licensed under a Creative Commons Attribution 4.0 International License.
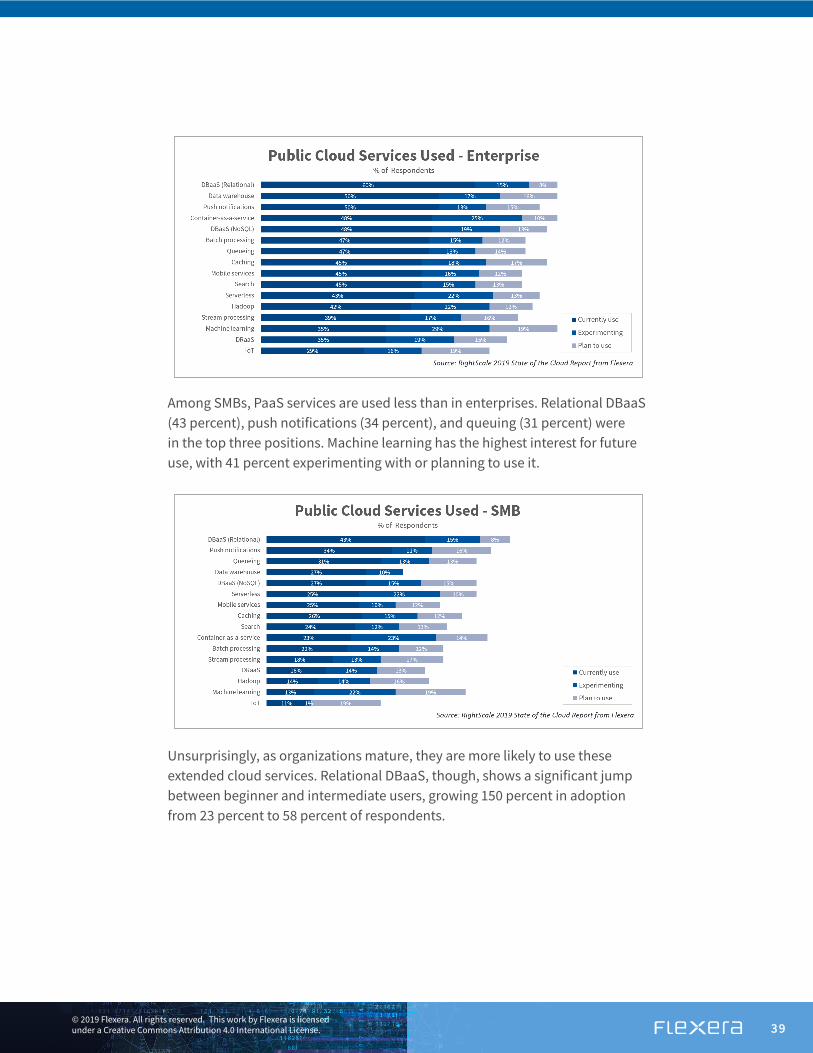
Among enterprises, relational DBaaS (60 percent), data warehouse (50 percent), and push notifications (50 percent) were also in the top three positions, while container-as-a-service was fourth (48 percent). Machine learning has the highest interest for future use, with 48 percent experimenting with or planning to use it.
39© 2019 Flexera. All rights reserved. This work by Flexera is licensed under a Creative Commons Attribution 4.0 International License.
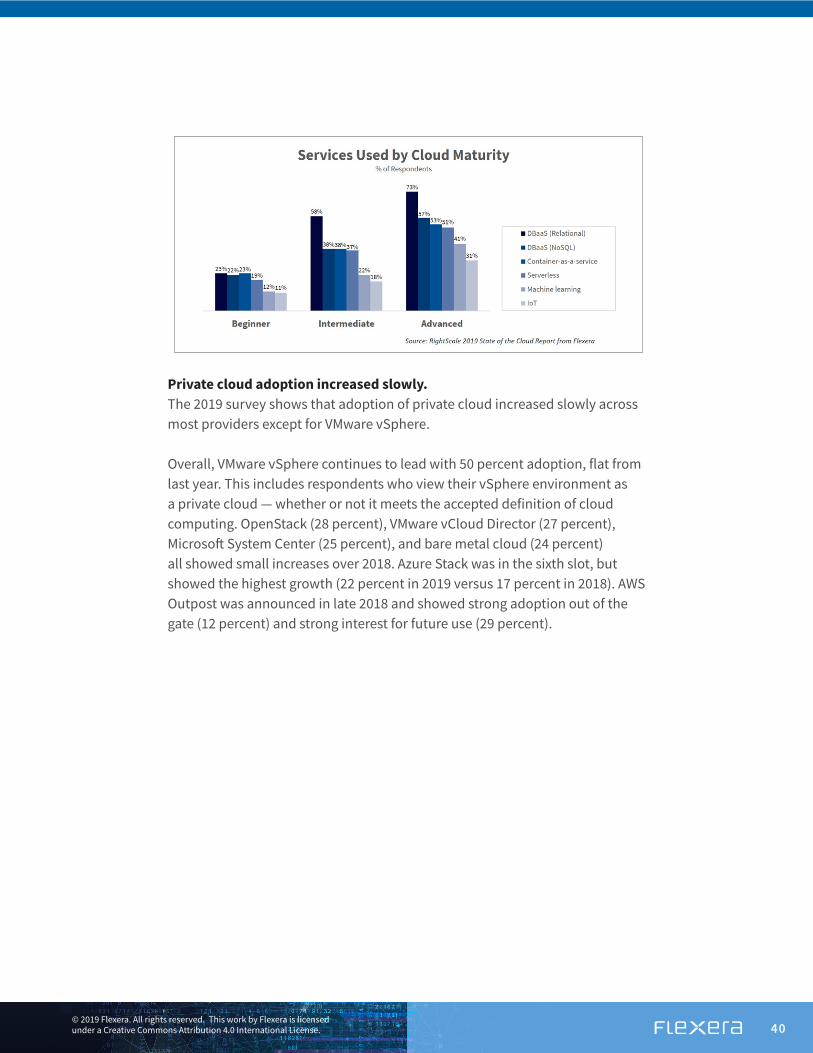
Unsurprisingly, as organizations mature, they are more likely to use these extended cloud services. Relational DBaaS, though, shows a significant jump between beginner and intermediate users, growing 150 percent in adoption from 23 percent to 58 percent of respondents.
Among SMBs, PaaS services are used less than in enterprises. Relational DBaaS (43 percent), push notifications (34 percent), and queuing (31 percent) were in the top three positions. Machine learning has the highest interest for future use, with 41 percent experimenting with or planning to use it.
40© 2019 Flexera. All rights reserved. This work by Flexera is licensed under a Creative Commons Attribution 4.0 International License.
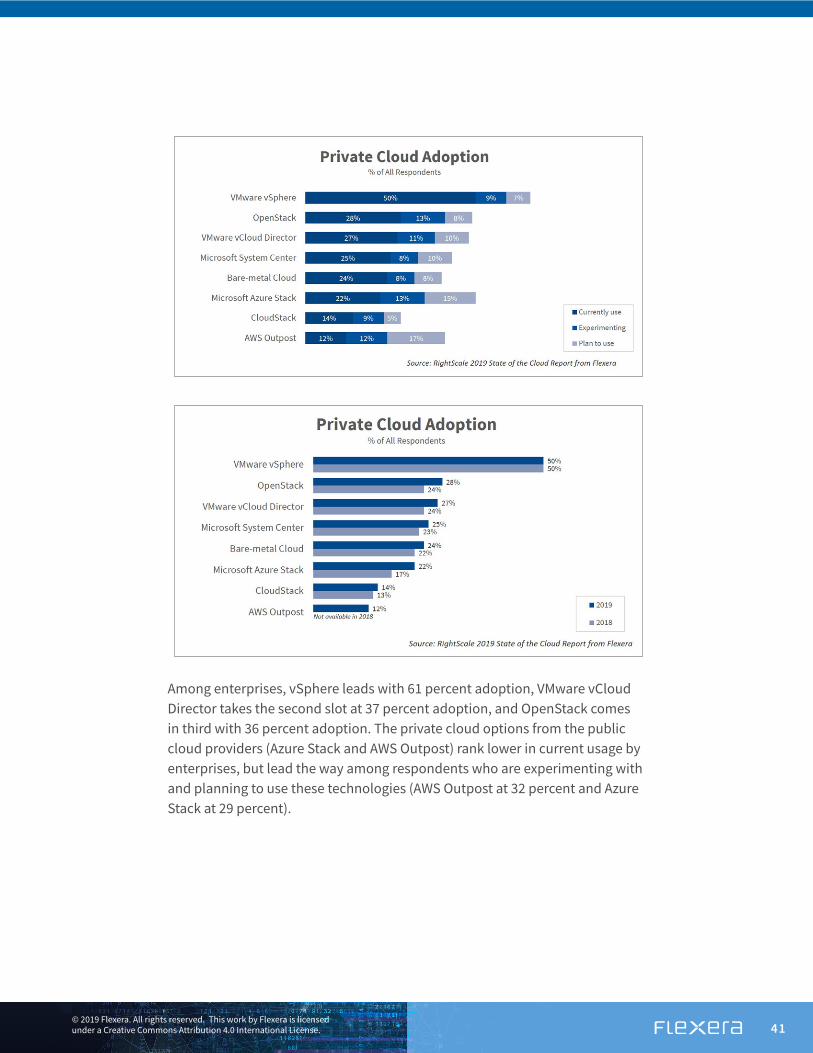
Private cloud adoption increased slowly. The 2019 survey shows that adoption of private cloud increased slowly across most providers except for VMware vSphere.
Overall, VMware vSphere continues to lead with 50 percent adoption, flat from last year. This includes respondents who view their vSphere environment as a private cloud — whether or not it meets the accepted definition of cloud computing. OpenStack (28 percent), VMware vCloud Director (27 percent), Microsoft System Center (25 percent), and bare metal cloud (24 percent) all showed small increases over 2018. Azure Stack was in the sixth slot, but showed the highest growth (22 percent in 2019 versus 17 percent in 2018). AWS Outpost was announced in late 2018 and showed strong adoption out of the gate (12 percent) and strong interest for future use (29 percent).
41© 2019 Flexera. All rights reserved. This work by Flexera is licensed under a Creative Commons Attribution 4.0 International License.
Among enterprises, vSphere leads with 61 percent adoption, VMware vCloud Director takes the second slot at 37 percent adoption, and OpenStack comes in third with 36 percent adoption. The private cloud options from the public cloud providers (Azure Stack and AWS Outpost) rank lower in current usage by enterprises, but lead the way among respondents who are experimenting with and planning to use these technologies (AWS Outpost at 32 percent and Azure Stack at 29 percent).

42© 2019 Flexera. All rights reserved. This work by Flexera is licensed under a Creative Commons Attribution 4.0 International License.
Private cloud adoption by smaller organizations is lower overall than for enterprises. While VMware vSphere (35 percent) is still the top option, OpenStack takes second place in this group, with 17 percent of respondents already running applications. This year Azure Stack and AWS Outpost continue to have mindshare, with 25 percent of SMBs experimenting or planning to use each of these technologies.
Year over year, Azure Stack showed the largest increase from 10 to 14 percent.

43© 2019 Flexera. All rights reserved. This work by Flexera is licensed under a Creative Commons Attribution 4.0 International License.
vSphere has most users with 1,000+ VMs, but AWS leads in 100+ VMs; Azure grows footprint faster.The adoption numbers above indicate the number of respondents that are running any workloads in a particular cloud. However, it’s also important to look at the number of workloads or VMs that are running in each cloud. The following charts show the number of VMs being run across the top public and private clouds.

44© 2019 Flexera. All rights reserved. This work by Flexera is licensed under a Creative Commons Attribution 4.0 International License.
Year over year, the number of workloads also grew for most cloud providers. Azure showed the largest increase in the percentage of users with more than 100 VMs, from 17 percent in 2018 to 25 percent in 2019. AWS grew the percentage of users with more than 100 VMs from 31 percent in 2018 to 33 percent in 2019. OpenStack, Google, and IBM all saw small increases in the number of respondents with more than 100 workloads.
Among all respondents, 13 percent have more than 1,000+ VMs in vSphere, as compared to 11 percent in AWS and 6 percent in Azure. However, AWS leads in respondents with more than 100 VMs, (33 percent for AWS vs. 27 percent for VMware and 25 percent for Azure).

45© 2019 Flexera. All rights reserved. This work by Flexera is licensed under a Creative Commons Attribution 4.0 International License.
Among SMBs, VMware vSphere led among those respondents with more than 1,000 VMs (4 percent). However, AWS led VMware vSphere in the number of respondents running more than 100 VMs (13 percent vs. 12 percent).
Among enterprises, which have larger numbers of workloads, 20 percent have more than 1,000 VMs in VMware vSphere, as compared to 17 percent in AWS and 10 percent in Azure. AWS had the highest percentage with 100+ VMs with 47 percent, compared to 38 percent for VMware vSphere and Azure.

46© 2019 Flexera. All rights reserved. This work by Flexera is licensed under a Creative Commons Attribution 4.0 International License.
Summary: As Public Cloud Grows, Organizations Focus on Governing Costs
The 2019 State of the Cloud Survey shows that multi-cloud remains the preferred strategy. Almost every organization is using cloud at some level, with both public and private cloud adoption growing. On average, companies are using or experimenting with nearly five public and private clouds, with a majority of workloads now running in cloud.
However, public cloud is increasingly becoming the top focus among enterprises and, as a result, public cloud use is growing more quickly — with spend growing at three times the rate of private cloud usage, an increasing number of cloud workloads, and an increase in the number of public cloud PaaS services used.
Cloud governance and costs were top challenges for cloud users of all maturity levels. As a result, optimizing existing cloud use for cost savings continues to be the top initiative in 2019 for the third year in a row as even more organizations are turning their efforts to cost optimization. There is still much room for improvement, as 35 percent of cloud bills are wasted due to inefficiencies, and few organizations have yet implemented automated policies to help address these issues.
Enterprise central IT teams are taking a stronger role in cloud adoption, creating central cloud teams or a Center of Excellence. The role of these central teams is focused on cost management and governance, as well as advising business units on workloads that should move to cloud. Cloud teams and infrastructure and operations groups are still shouldering the lion’s share of the work for managing cloud costs, but finance teams are taking a role in chargeback of cloud costs and business units are often owning cloud budgets.

47© 2019 Flexera. All rights reserved. This work by Flexera is licensed under a Creative Commons Attribution 4.0 International License.
The use of DevOps continues to increase, driving further adoption of container and configuration tools. Docker grew again this year, and Kubernetes use skyrocketed. Many users are also adopting container-as-a-service offerings from AWS, Azure, and Google.
AWS still leads in public cloud adoption but Azure continues to grow more quickly and gains ground, especially with enterprise customers. Google maintains the third position, and VMware Cloud on AWS moved into fourth position ahead of IBM. Adoption of Oracle Cloud is still small, but is growing well.
Cloud provider revenue is driven not just by adoption (percentage of companies using the cloud), but also the number of workloads (VMs) deployed, and the use of other extended cloud services. Respondents continue to run more VMs in AWS than in other public clouds. However, Azure is growing quickly here as well to reduce AWS’s lead.
VMware vSphere continues to lead as a private cloud option (both in adoption and number of VMs) followed by OpenStack and VMware vCloud Director. Two private cloud technologies from public cloud providers, Azure Stack and AWS Outpost, are growing more strongly and generate the strongest interest level for future use.

48© 2019 Flexera. All rights reserved. This work by Flexera is licensed under a Creative Commons Attribution 4.0 International License.
Gartner Magic Quadrant for Cloud Management Platforms 2019
Gartner conducted its first-ever Magic Quadrant evaluation of cloud management platforms (CMPs) in 2019. IT and infrastructure and operations leaders who need to provide automation, governance, and self-service brokering across multi-cloud resources as well as business unit leaders responsible for managing cloud costs often find CMPs to be an indispensable solution.
Gartner evaluates the top CMP vendors on a variety of criteria including:• Provisioning and orchestration.• Service request management.• Inventory and classification.• Monitoring and analytics.• Cost management and resource optimization.• Cloud migration and backup and disaster recovery.• Identity, security, and compliance.
flexera.com/2019-cloud-report
Download Report
49© 2019 Flexera. All rights reserved. This work by Flexera is licensed under a Creative Commons Attribution 4.0 International License.
About RightScale from FlexeraThe Flexera acquisition of RightScale is an investment in the continued development of RightScale’s proven multi-cloud management and cost optimization solutions, which complement Flexera’s software, hardware, and SaaS optimization suite that helps businesses maximize their technology investments and reduce risk. The RightScale Cloud Management Platform helps enterprises to accelerate delivery of cloud-based applications that engage customers and drive top-line revenue while optimizing cloud usage to reduce risk and costs. It is a comprehensive solution that enables IT organizations to deliver instant access to a portfolio of public, private, and hybrid cloud services across business units and development teams while maintaining enterprise control. RightScale Optima is a collaborative cloud cost management and optimization solution that enables organizations to take automated action to reduce cloud spend across the enterprise. In 2019, RightScale from Flexera was recognized as a leader in the Gartner Magic Quadrant for Cloud Management Platforms.
Contact us for more information or a demo:+1 800.809.5659 | +44 870.871.1111 [email protected]

50© 2019 Flexera. All rights reserved. This work by Flexera is licensed under a Creative Commons Attribution 4.0 International License.
Inform IT. Transform IT.


![[RightScale Webinar] Architecting Databases in the cloud: How RightScale Does It](https://img.dokumen.tips/doc/110x75/557d6036d8b42abf3d8b50ab/rightscale-webinar-architecting-databases-in-the-cloud-how-rightscale-does-it.jpg)