Embed Size (px)
Citation preview

Research Collection
Doctoral Thesis
Self-fertilization and marker-trait associations in sainfoin(Onobrychis viciifolia)
Author(s): Kempf, Katharina
Publication Date: 2016
Permanent Link: https://doi.org/10.3929/ethz-a-010852406
Rights / License: In Copyright - Non-Commercial Use Permitted
This page was generated automatically upon download from the ETH Zurich Research Collection. For moreinformation please consult the Terms of use.
ETH Library

DISS. ETH NO. 23568
SELF-FERTILIZATION AND MARKER-TRAIT
ASSOCIATIONS IN SAINFOIN (ONOBRYCHIS
VICIIFOLIA)
A thesis submitted to attain the degree of
DOCTOR OF SCIENCES of ETH ZURICH
(Dr. sc. ETH Zurich)
presented by
KATHARINA KEMPF
Dipl.-Agr.Biol., University of Hohenheim
born on 17.04.1985
citizen of Germany
accepted on the recommendation of
Prof. Dr. Achim Walter, examiner
Prof. Dr. Michael Kreuzer, co-examiner
Prof. Dr. Bruno Studer, co-examiner
Dr. Roland Kölliker, co-examiner
2016


i
Content
List of Tables .............................................................................................................. v
List of Figures ...................................................................................................... vii
List of Abbreviations ................................................................................................. ix
Summary .................................................................................................................... 1
Zusammenfassung ..................................................................................................... 5
Chapter 1: General Introduction ............................................................................... 9
1.1 Grassland production systems ....................................................................... 11
1.1.1 Importance of grassland........................................................................... 11
1.1.2 Use of legumes .......................................................................................... 12
1.2 Genetic improvement of plants: background information ............................ 13
1.2.1 Mating systems in plants ......................................................................... 13
1.2.2 Polyploidy in plants .................................................................................. 14
1.2.3 Breeding methods in forage plants .......................................................... 16
1.2.4 Genetic markers to assist plant breeding ............................................... 18
1.3 Sainfoin ........................................................................................................... 20
1.3.1 Taxonomy ................................................................................................. 20
1.3.2 Origin and historical distribution ............................................................ 21
1.4 Basic characteristics of sainfoin ..................................................................... 22
1.4.1 Morphology ............................................................................................... 22
1.4.2 Chemical properties of sainfoin ............................................................... 24
1.5 Cultivation and use ........................................................................................ 26
1.5.1 Nowadays distribution ............................................................................. 26
1.5.2 Cultivation ................................................................................................ 27
1.5.3 Usage ........................................................................................................ 29
1.6 Genetic improvement of sainfoin ................................................................... 30
1.6.1 Reproduction system ................................................................................ 30
1.6.2 Polyploidy ................................................................................................. 31
1.6.3 Breeding activities.................................................................................... 32
1.6.4 Breeding goals and genetic resources ...................................................... 33
1.7 Objectives of the thesis within the LegumePlus project ............................... 35

ii
Chapter 2: Evidence and consequences of self-fertilization in the predominantly
outbreeding forage legume Onobrychis viciifolia .................................................. 37
2.1 Abstract .......................................................................................................... 38
2.2 Background..................................................................................................... 39
2.3 Methods .......................................................................................................... 42
2.3.1 Plant material and field trial .................................................................. 42
2.3.2 Phenotyping of ADP populations ............................................................ 43
2.3.3 DNA extraction and marker genotyping ................................................ 44
2.3.4 Detection of self-fertilization ................................................................... 46
2.3.5 Statistical analysis .................................................................................. 46
2.4 Results ............................................................................................................ 47
2.4.1 Self-fertilization in ADP populations ...................................................... 47
2.4.2 Self-fertilization in NDP populations ..................................................... 49
2.4.3 Phenotypic characterization of ADP populations ................................... 50
2.5 Discussion ....................................................................................................... 53
2.5.1 High rates of self-fertilization can be induced ........................................ 53
2.5.2 Power to detect selfings ........................................................................... 54
2.5.3 Inbreeding depression dependent on trait .............................................. 55
2.6 Conclusions ..................................................................................................... 57
2.7 Authors’ contributions ................................................................................... 58
2.8 Acknowledgments .......................................................................................... 58
2.9 Supplementary Information .......................................................................... 59
Chapter 3: Characterization of novel SSR markers in diverse sainfoin
(Onobrychis viciifolia) germplasm ......................................................................... 63
3.1 Abstract .......................................................................................................... 64
3.2 Introduction .................................................................................................... 65
3.3 Material and Methods .................................................................................... 67
3.3.1 Plant material .......................................................................................... 67
3.3.2 DNA extraction ........................................................................................ 68
3.3.3 PCR and gel electrophoresis .................................................................... 68
3.3.4 M13 PCR capillary electrophoresis ......................................................... 69
3.3.5 Data analysis ........................................................................................... 72
3.4 Results ............................................................................................................ 73
3.4.1 SSR analysis ............................................................................................ 73

iii
3.4.2 Diversity of Onobrychis viciifolia individuals ......................................... 77
3.5 Discussion ....................................................................................................... 79
3.6 Conclusions ..................................................................................................... 82
3.7 Acknowledgments ........................................................................................... 83
3.8 Authors‘ contributions .................................................................................... 83
3.9 Supplementary Information ........................................................................... 84
Chapter 4: Marker-trait association analysis for agronomic and compositional
traits in sainfoin (Onobrychis viciifolia) ................................................................. 87
4.1 Abstract ........................................................................................................... 88
4.2 Introduction .................................................................................................... 89
4.3 Material and Methods .................................................................................... 92
4.3.1 Plant material .......................................................................................... 92
4.3.2 Phenotyping .............................................................................................. 92
4.3.3 Genotyping................................................................................................ 94
4.3.4 Statistical analysis ................................................................................... 94
4.4 Results ............................................................................................................. 96
4.4.1 Large variation in agronomic traits ........................................................ 96
4.4.2 Quantity and quality of condensed tannin varies among plants ........... 98
4.4.3 Strong correlation among vigor related traits ........................................ 99
4.4.4 Weak correlations between agronomic and compositional traits…….. .. 99
4.4.5 TAM were detected for three agronomic and one compositional trait . 100
4.5 Discussion ..................................................................................................... 105
4.5.1 Detected trait variation as a basis for selection .................................... 106
4.5.2 TAM detection and validation ............................................................... 107
4.5.3 Detected TAMs and potential benefits .................................................. 107
4.5.4 Accuracy of TAM to infer the presence of QTLs in sainfoin populations
.......................................................................................................................... 108
4.5.5 Future trends for sainfoin breeding and conclusions ........................... 109
4.6 Acknowledgements ....................................................................................... 110
4.7 Supplementary Material .............................................................................. 111
Chapter 5: A first linkage map for tetraploid sainfoin (Onobrychis viciifolia) ... 116
5.1 Introduction .................................................................................................. 117
5.1.1 Use and construction of linkage maps ................................................... 117

iv
5.1.2 Populations for creation of linkage maps ............................................. 118
5.1.3 Mapping software for polyploid species ................................................ 119
5.2 Material and Methods .................................................................................. 121
5.2.1 Plant material and marker genotyping ................................................ 121
5.2.2 Approaches for creation of linkage maps .............................................. 122
5.3 Results .......................................................................................................... 124
5.3.1 Grouping of markers with TetraploidMap............................................ 124
5.3.2 Grouping of markers with JoinMap ...................................................... 125
5.3.3 Linkage maps ......................................................................................... 126
5.4 Discussion ..................................................................................................... 129
Chapter 6: General Discussion ............................................................................. 134
6.1 Breeding opportunities in sainfoin .............................................................. 136
6.1.1 Self-fertilization and breeding systems ................................................ 136
6.1.2 Breeding for animal health ................................................................... 139
6.2 Future research tasks .................................................................................. 142
6.2.1 Origin of polyploidy ............................................................................... 142
6.2.2 DNA extraction and marker analysis in sainfoin................................. 145
6.2.3 Towards marker assisted breeding in sainfoin .................................... 147
6.3 Conclusions ................................................................................................... 148
References .............................................................................................................. 150
Acknowledgements ................................................................................................ 180
Curriculum vitae ................................................................................................... 182

v
List of Tables
Table 2.1 Overview of populations derived from artificially directed pollination
(ADP) and non-directed pollination (NDP) ............................................................ 42
Table 2.2 SRAP and SSR primers used to determine the rate of self-fertilization
.................................................................................................................................. 45
Table 2.3 Self- and cross-fertilizations in populations from artificially directed
pollination (ADP) determined by SRAP and SSR markers .................................. 48
Table 2.4 Self- and cross-fertilizations in populations from non-directed
pollination (NDP) determined by SRAP and SSR markers .................................. 50
Table 2.5 Analysis of variance (ANOVA) for traits in populations from artificially
directed pollination (ADP) ...................................................................................... 51
Table S2.1 SRAP primer combinations in populations of artificially directed
pollination (ADP) and in non-directed pollination (NDP) ...................................... 59
Table 3.1 Onobrychis viciifolia individuals used for marker characterization .... 67
Table 3.2 SSR primer sequences used for amplification in 32 Onobrychis viciifolia
individuals and characteristics of SSR motifs ...................................................... 70
Table 3.3 Characterization of the 101 polymorphic sainfoin markers ................. 74
Table 4.1 Summary of phenotypic data for F1 progenies of a biparental cross as
well as number of associated markers for each trait ............................................. 98
Table 4.2 Phenotypic correlations among agronomical traits in F1 progenies of a
biparental cross ....................................................................................................... 99
Table 4.3 Phenotypic correlations among compositional traits as well as between
compositional and agronomic traits in in F1 progenies of a biparental cross ... 100
Table 4.4 Summary of trait associated markers. ............................................... 101
Table S4.1. Forward and reverse primers of SSR and SRAP markers used to test
for marker trait associations ................................................................................ 113
Table S4.2. Pearson‘s correlation coefficients among phenotypic traits assessed in
offspring derived from self-fertilization of parent 1 ............................................ 114
Table S4.3. Pearson‘s correlation coefficients among phenotypic traits assessed in
offspring derived from self-fertilization of parent 2 ............................................ 115
Table 5.1 Distribution of number of markers per linkage group (LG) as dependent
on the number of linkage groups formed using the software TetraploidMap .... 125
Table 5.2 Number of linkage groups (LG) and distribution of markers among
them as dependent on the critical recombination frequency (RFCrit) and obtained
by the software JoinMap ..................................................................................... 126

vi

vii
List of Figures
Fig. 1.1 Chromosome formation in autotetraploids and allotetraploids in
metaphase during meiosis. .................................................................................. 16
Fig. 1.2 Taxonomy of sainfoin.................................................................................. 21
Fig. 1.3 Different growth types of sainfoin plants in the year of establishment... 23
Fig. 1.4 Flower morphology and seeds of sainfoin .................................................. 23
Fig. 1.5 chemical structure of condensed tannins and ellagitannins .................... 25
Fig. 1.6 Weed competition in sainfoin stands in the third growing season ........... 28
Fig. 2.1 Principal component analysis of offspring from ADP populations and
simulated data by SRAP marker data .................................................................... 48
Fig. 2.2 Differences of traits in populations from artificially directed pollination
(ADP) dependent on cross- and self-fertilization .................................................... 52
Fig. 3.1 Group separation of individuals as assessed by k-means partitioning for
k = 2 to 10 groups ..................................................................................................... 77
Fig. 3.2 Cluster Dendrogram of individuals based on the modified Rogers’
distance .................................................................................................................... 78
Fig. 3.3 Principal component analysis of 32 sainfoin individuals based on 1054
alleles of 101 SSR markers ...................................................................................... 79
Figure S3.1 Relationship between modified Roger’s Distance to Euclidian
Distance and to Nei’s Distance. .............................................................................. 84
Figure S3.2 Polymorphism Information Content (PIC) values for individual
alleles at SSR loci ..................................................................................................... 85
Fig. 4.1 Principal coordinate analysis based on 170 SRAP and 208 SSR marker
alleles for F1 progenies derived from a biparental cross and respective S1
progenies of the two parental plants ....................................................................... 95
Fig. 4.2 Frequency distribution of agronomic traits and concentration of phenolic
compounds in 122 F1 progenies ............................................................................... 97

viii
Fig. 4.3 Seed number per plant in F1 and S1 progenies dependent on presence and
absence of the marker allele of markers showing significant association with the
trait. ...................................................................................................................... 102
Fig. 4.4 Plant height in F1 and S1 progenies dependent on presence and absence
of the marker allele of markers showing significant association with the trait. 103
Fig. 4.5 Plant vigor in F1 and S1 progenies dependent on presence and absence of
the marker allele of markers showing significant association with the trait. ... 104
Fig. 4.6 Correlations among markers showing significant association to
phenotypic traits ................................................................................................... 105
Fig. S4.1 Frequency distribution of performance in agronomic traits and
concentration of phenolic compounds in 30 S1 progenies derived from parent 1
................................................................................................................................ 111
Fig. S4.2 Frequency distribution of performance in agronomic traits and
concentration of phenolic compounds in 85 S1 progenies derived from parent 2
................................................................................................................................ 112
Fig. 5.1 Linkage group 1 (LG1) to linkage group 8 (LG8) of parent 1 (P1) as
established with TetraploidMap software……….. ............................................... 127
Fig. 5.2 Linkage group 1 (LG1) to linkage group 4 (LG4) of parent 2 (P2), as
established with TetraploidMap software.. .. ....................................................... 128
Fig. 5.3 Linkage group 1 (LG1) to linkage group 5 (LG5) of parent 1 (P1), as
established with JoinMap software……… ........................................................... 128
Fig 5.4 Linkage group 1 (LG1) and linkage group 2 (LG2) of parent 2 (P2), as
established with JoinMap software ...................................................................... 129
Fig. 5.5 Schematic overview of bivalent and multivalent chromosome
arrangement for crossing over during meiosis ..................................................... 131
Fig 5.6 Illustration of information content for two dominant markers M1 and M2
(1 for presence, 0 for absence of allele) if both of them are in a) simplex, b) duplex
and c) triplex state…. ............................................................................................ 133
Fig. 6.1 Chromosome arrangement in sainfoin during metaphase 1 of meiosis in
immature sainfoin anthers ................................................................................... 143
Fig. 6.2 Gamete formation in allo- and autotetraploids ...................................... 144

ix
List of abbreviations
2n = zygotic number
BC = backcross
bp = base pairs
°C = celsius
CH4 = methane
cm = centimeter
cM = centimorgan
CP = cross pollinated
CT = condensed tannins
DNA = deoxyribonucleic acid
e.g. = for example
F1 = filial generation from crossings of individual plants
g = gram
GC rich = guanine - cytosine rich
GCA = general combining ability
H = hydrogen
h2 = heritability
i.e. = that is
MAS = marker assisted selection
MgCl2 = magnesium chloride
min = minute
mm = millimeter
mM = millimolar
N = nitrogen
ng = nanogram
NGS = next generation sequencing
OH = hydroxide
% = percent
PC = procyanidin
PCA = principal component analysis
PCO = principal coordinate analysis

x
PIC = polymorphism information content
PD = prodelphinidin
QTL = quantitative trait loci
RF = recombination frequency
RIL = recombinant inbred line
RNA = ribonucleic acid
s = second
SCL = single cross link
SIM = single interval mapping
SPAD = soil plant analysis development
TBE buffer = Tris/Borate/EDTA buffer
UPLC-MS/MS = ultra-performance liquid chromatography tandem mass-
spectrometry
U = unit
µL = mycroliter
µM = mycromol
UK = United Kingdom
U.S. = United States
UV = ultraviolet

1
Summary
An extension of ruminant husbandry to satisfy the growing demand of milk- and
meat products has negative consequences for the environment like e.g. increased
methane gas emissions and wastewater. Additionally, higher production levels in
animals are difficult to obtain because increased protein and energy levels must
be provided within the fodder ration. There is also a continuous risk of diseases
and parasite burdens in livestock due to resistance formation against
conventional anthelmintic drugs. These problems could be tackled by the use of
forage legumes with anthelmintic properties like sainfoin (Onobrychis viciifolia),
which has health promoting characteristic mainly caused by the presence of
polyphenols therein, especially condensed tannins. Condensed tannins are also
known to reduce bloat and methane gas emissions in ruminants and improve
protein absorption by protein-tannin-interactions in the rumen. Furthermore, the
ability of sainfoin to fix atmospheric nitrogen by rhizobia bacteria association
allows a reduction of nitrogen fertilizer input. However, sainfoin cultivation
decreased during the last century, presumably due to cheap prices for inorganic
fertilizer and competition from higher yielding forage crops. Consequently,
sainfoin breeding attempts were reduced to a minimum. Existing varieties show
poor and unstable biomass yields, reduced persistence and low seed yields.
Breeding new, high performing varieties is indispensable to make sainfoin
cultivation attractive to farmers.
Tetraploidy and, hence, complex inheritance patterns for traits are one important
aspect breeders have to deal with in breeding sainfoin. Moreover, contradictory
statements exist about the reproduction system in sainfoin, namely if sainfoin is
strongly cross-fertilized or also able to self-fertilize. Here, molecular markers
could help to unravel the breeding system in sainfoin and to clarify inheritance
patterns on a molecular level. Detection of associations between molecular
markers and traits would allow selection of individuals for desired traits on the
basis of marker assisted selection (MAS). Thereby, localization of loci explaining
variation in a quantitative trait (quantitative trait loci, QTL) within the genome
could be improved with the establishment of a genetic linkage map which does
not yet exist for sainfoin.

2
Due to the given necessity to assist sainfoin breeding, our study aimed to
elucidate the breeding system of sainfoin as well as its consequences on plant
performance (chapter 2), to test newly developed molecular markers which could
be, later on, applied in genetic studies (chapter 3), to apply these markers to F1
offspring of one biparental population to detect marker trait associations (chapter
4) and to establish a genetic linkage map based on this marker data (chapter 5).
The present study was part of the European Marie Curie Initial Training
Network ‘LegumePlus’ (PITN-GA-2011-289377) which aimed to conduct a holistic
research of sainfoin.
Our first aim was to detect possible self-fertilization in sainfoin. Generally,
sainfoin is described as mainly cross-fertilized, but few studies report high self-
fertilization rates based on results from manual self-pollination by hand or using
a recessive flower color marker as detection system. So far, information about
self-fertilization under natural conditions is missing, as well as possible factors
favoring self-fertilization. To address these questions, three biparental
populations were established with bumble bee (Bombus terrestris) pollination in
the greenhouse from five clones of two parental genotypes in each population.
Using this approach, self-fertilization as well as cross-fertilization was possible,
but the pollination was affected by the number of potential crossing partners and
bumble bee movements. In addition to this approach, self-fertilization was
assessed in three natural populations in the open field. For the first time, self-
fertilization was assessed on the basis of dominant sequence related amplified
polymorphism (SRAP) and co-dominant simple sequence repeat (SSR) molecular
markers. In the greenhouse populations, high self-fertilization rates of 48.5, 61.5
and 64.8% were detected. Contrastingly, 0.0, 1.8 and 3.9% self-fertilization was
detected in the three natural populations. The greenhouse populations were
phenotyped over a period of three years to quantify possible inbreeding
depression. It could be shown that seed yield per plant was highly affected (up to
79% reduction) by inbreeding depression, whereas plant height and vigor were
less affected with a reduction of 23.8 and 17.2%, respectively.
Another emphasis of the study was to test sainfoin specific co-dominant SSR
markers (chapter 3). Such markers are essential to realize genetic studies in
sainfoin or, further, could be used for marker assisted selection. For this reason,
3
newly developed SSR markers were tested on a set of 32 sainfoin individuals.
Thereby, 101 amplified markers showed allelic polymorphisms between the
individuals. The number of alleles per marker lay between two and 24 alleles,
whereby only five of total alleles were present in all individuals. Summarizing
marker data using multivariate statistics revealed two main clusters, the first
one containing individuals from Western Europe, whereas the second one
contained individuals from Southern- and Eastern Europe and the U.S. The
discovery of genetic differences by SSR markers indicates that those markers are
useful for further genetic studies in sainfoin.
A set of tested SSR, together with SRAP markers, was used to search for marker
trait associations (chapter 4) in 122 F1 offspring of one greenhouse population
developed within the framework of chapter 2. Finding such markers would allow
selecting promising individuals already in early stages of the breeding processes.
For this reason, all marker alleles were scored as present (1) / absent (0) in the
individuals and tested for trait associations via simple regression analysis. Trait
associated markers could be found for plant height, seed yield and vigor, whereby
a correlation analysis among associated markers indicates that these are linked
to at least two different QTL. Furthermore, one associated marker was found for
prodelphinidin-share of condensed tannins.
At last, a set of SSR and SRAP markers was used to create a genetic linkage map
of sainfoin based on 122 F1 offspring from the above mentioned populations
(chapter 5). JoinMap (for diploid and allopolyploid species) and TetraploidMap
(for autotetraploid species) software packages were used accounting for the
unknown origin of polyploidy in sainfoin. It could be shown that none of the
software produced a satisfactory linkage map, because most of the markers
grouped to only one linkage group. Partially, certain linkages between markers
could be found by both software, but, based on the used population, no definite
map could be developed and no preference for one of the two software packages
could be given.
The results of the present study showed high self-fertilization rates in sainfoin
with accompanied inbreeding depression. Consequently, a self-incompatibility
system can be excluded. These results are directly useable to optimize breeding
methods. Furthermore, the usability of newly developed markers for further

4
genetic studies was proven for sainfoin. The detected marker trait associations
for agronomic and compositional traits could be applied to select superior
individuals in plant breeding programs to bred new sainfoin varieties.

5
Zusammenfassung
Ein Ausbau der Wiederkäuerhaltung, aufgrund der wachsenden Nachfrage nach
Milch- und Fleischprodukten, belastet die Umwelt durch steigende
Methangaseinträge und anfallende Abwässer. Bezüglich der Tiergesundheit ist
es eine Herausforderung genug Energie und Protein über die Fütterung
zuzuführen um die Produktionsleistung zu steigern. In den Tierbeständen treten
zudem Krankheiten und Parasiten auf, welche mit Medikamenten chemischen
Ursprungs immer schwerer einzudämmen sind da z.B. Parasiten Resistenzen
gegen gebräuchliche Anthelminthika entwickelt haben. Eine Alternative ist die
Nutzung von Futterpflanzen mit anthelmintischen Eigenschaften wie die
ausdauernde Leguminose Esparsette (Onobrychis viciifolia). Die Esparsette
besitzt Polyphenole, darunter kondensierte Tannine, welche anthelminitisch
wirken und zudem Blähungen und den Methangasausstoss reduzieren.
Zusätzlich wird das in der Futterration enthaltene Protein durch Interaktion mit
diesen Tanninen besser vom Tier absorbiert.
Obwohl die Esparsette wertvoll für die Tierernährung ist und ihr Anbau
Ressourcen spart (aufgrund atmosphärischer Stickstofffixierung durch
assoziierte Knöllchenbakterien), ging der Anbau im letzten Jahrhundert stetig
zurück. Gründe hierfür sind günstige Preise für anorganischen Dünger und
Konkurrenz durch andere, ertragreichere Kulturarten. Die Esparsette wird in
Folge dessen kaum noch gezüchtet. Vorhandene Sorten haben oft geringe und
schwankende Biomasseerträge über die Anbaujahre, eine reduzierte Persistenz
und wenig Saatgutertrag. Die Zucht neuer, leistungsstarker Sorten ist
unabdingbar, um den Esparsettenanbau für Landwirte attraktiv zu machen. Die
züchterische Bearbeitung der Esparsette stellt nicht nur aufgrund der
Tetraploidie und daraus resultierender komplexer Vererbungsgänge von
Merkmalen eine Herausforderung dar. Des Weiteren existieren widersprüchliche
Aussagen darüber, ob die Esparsette ausschliesslich fremdbefruchtet wird. Die
Unterstützung der Züchtung mit Hilfe molekularer Marker würde es
ermöglichen, sowohl die Frage der Befruchtungsart in der Esparsette zu klären,
als auch Vererbungsgänge auf molekularer Ebene zu beschreiben. Durch
Nutzung dieser Marker für das Auffinden von Marker-Merkmalsassoziationen

6
könnte gezielt auf gewünschte Merkmale selektiert werden. Um die Effektivität
der Selektion zu verbessern ist die Erstellung einer genetischen Kopplungskarte
von Bedeutung, da es so möglich ist die Chromosomenregion welche für das
quantitative Merkmal (QTL) verantwortlich ist genauer zu lokalisieren.
Aufgrund der Notwendigkeit die Esparsetten Züchtung zu unterstützen, ergaben
sich folgende Ziele für unserer Studie: die Aufklärung des Befruchtungssystems
der Esparsette und dessen Auswirkung auf die Leistung der Pflanze (Kapitel 2),
molekulare Marker für genetische Studien zu testen (Kapitel 3), diese
molekularen Marker zum Auffinden von Merkmalsassoziationen in einer
Kreuzungspopulation anzuwenden (Kapitel 4) und eine genetische
Kopplungskarte der Esparsette zu erstellen (Kapitel 5). Die Studie wurde dabei
im Rahmen des europäischen Marie Curie Initial Training Network,
‘LegumePlus’ (PITN-GA-2011-289377) durchgeführt, welches sich mit der
ganzheitlich Erforschung der Esparsette befasst.
Die erste Fragestellung der Studie bezüglich des Befruchtungssystems (Kapitel
2) gründet sich auf widersprüchliche Angaben der Literatur zu diesem Thema.
Wird die Esparsette zumeist als überwiegend fremdbefruchtet beschrieben, so
finden sich wenige Studien die von geringen bis teilweise hohen
Selbstbefruchtungsraten sprechen. Diese Ergebnisse stützen sich dabei auf
morphologische Marker (Blütenfarbe) und Samenansatz durch gezielten
Handbestäubungen mit eigenem Pollen. Eine Erfassung der
Selbstbestäubungsrate unter natürlichen Bedingungen und unter
Berücksichtigung von Aspekten welche Fremd- oder Selbstbefruchtung fördern
wurde noch nicht erbracht. Um dieser Frage nachzugehen, wurden drei
Kreuzungen mit je zwei fünffach verklonten Elternpflanzen im Gewächshaus
mittels Hummelbestäubung (Bombus terrestris) durchgeführt. Hierbei war es
möglich, dass die Pflanzen mit dem eigenen oder fremden Pollen bestäubt
wurden. Der Bestäubungsvorgang war durch die Anzahl an vorhandenen
Bestäubungspartnern und Hummeln eingeschränkt. Zusätzlich wurde die
Bestäubungsrate auf drei natürlichen Flächen im Freiland ohne
Einschränkungen erfasst. Die Selbstbefruchtungsraten wurden in unserer Studie
erstmals anhand dominanter sequence related amplified polymorphism (SRAP)
und zwei co-dominanter simple sequence repeat (SSR) molekularer Marker

7
bestimmt. In den Gewächshauspopulationen konnten hohe
Selbstbefruchtungsraten von 48.5, 61.5 und 64.8% erzielt werden. Im Gegensatz
dazu waren die Selbstbefruchtungsraten auf den natürlichen Flächen
vernachlässigbar gering mit 0.0, 1.8 und 3.9%. Um eine mögliche
Inzuchtdepression in der Esparsette zu quantifizieren, wurden die drei
Gewächshauspopulationen über drei Jahre phenotypisiert. Es konnte dabei
gezeigt werden, dass die Saatguterträge pro Einzelpflanze in den
Selbstungsnachkommen stark zurückgehen (bis zu 79%), wobei die Pflanzenhöhe
und die allgemeine Wüchsigkeit von einer etwas geringeren Inzuchtdepression
betroffen waren (23.8% und 17.2%).
Der zweite Schwerpunkt der vorliegenden Studie befasste sich mit dem Testen
von spezifischen co-dominanten molekularen SSR Markern für die Esparsette
(Kapitel 3). Solche molekularen Marker sind für die Durchführung von
genetischen Studien in der Esparsette unerlässlich. Zudem können sie, falls sie
mit einem phänotypischen Merkmal assoziiert sind in der praktischen Züchtung
verwendet werden. Zu diesem Zweck wurden neue SSR Marker an einem Pool
aus 32 diversen Esparsetten Pflanzen verschiedener Herkunft angewendet.
Dabei konnten 101 amplifizierte Marker Polymorphismen zwischen den
Individuen aufzeigen. Die Anzahl von Allelen pro Marker reichte dabei von zwei
bis 24 über alle Individuen. Zudem fanden sich nur fünf Allele die in allen
Individuen vorkamen. Die genetische Charakterisierung der Individuen zeigte,
dass diese sich in zwei Gruppen aufspalten. Gruppe 1 beinhaltet Individuen aus
Westeuropa, wohingegen Gruppe 2 Individuen aus Süd- und Osteuropa und den
USA aufweist. Die durch die SSR Marker aufgezeigten genetischen Unterschiede
und Gemeinsamkeiten in den Individuen zeigen, dass sich diese Marker auch für
weitere genetische Studien in der Esparsette nutzen lassen
Die Nutzung eines Sets dieser charakterisierten SSR Marker und dominanter
SRAP Marker zur Erfassung von Marker-Merkmalassoziationen war ein weiteres
Teilziel unserer Studie (Kapitel 4). Das Auffinden solcher Marker würde es in
Zukunft erlauben, Individuen gezielt, schon in frühen Züchtungsstadien, nach
erwünschten Merkmalen zu selektieren. Für die Suche nach solchen
Assoziationen wurden 122 F1 Kreuzungsnachkommen aus einer der drei
Gewächshauspopulationen (Kapitel 2) untersucht. Zur Detektion dieser

8
Assoziationen wurden alle Marker Allele als anwesend (1) / abwesend (0) in den
Individuen erfasst und mittels einfacher Regressionsanalyse auf vorhandene
Assoziationen zu phenotypisierten Merkmalen getestet. Merkmalassoziierte
Marker konnten dabei für Pflanzenhöhe, Saatgutertrag und Wüchsigkeit
gefunden werden. Des Weiteren wurde ein assoziierter Marker für den
Prodelphinidin-Anteil in kondensierten Tanninen gefunden. Die Korrelation
unter den Markern deutet zudem darauf hin, dass mindestens zwei QTL mit
diesen Markern gekoppelt sind und sich für eine gezielte Merkmalsselektion
eignen.
In einem letzten Schritt sollte aus einem Set von SSR und SRAP Markern eine
genetische Kopplungskarte für 122 Kreuzungsnachkommen aus der oben
genannten Kreuzungspopulation erstellt werden (Kapitel 5). Aufgrund des
ungeklärten Ursprungs der Polyploidie in der Esparsette wurden die Software
JoinMap (für diploide und allopolyploide Arten) und TetraploidMap (für
autotetraploide Arten) angewandt. Es zeigte sich, dass mit keiner der beiden
Softwares eine umfassende Kopplungskarte für die Esparsette erstellt werden
konnte, da die meisten Marker Allele in eine Kopplungsgruppe gruppieren. Die
aufgezeigten Marker Kopplungen waren dabei nur teilweise in beiden Softwares
zu finden. Letztendlich liess sich auf Basis der verwendeten Population keine
definitive Kopplungskarte erstellen und keine Aussage konnte darüber getroffen
werden, welche Software die geeignete ist, um eine Kopplungskarte für die
Esparsette zu erstellen.
Die Resultate unserer Studie zeigen dass hohe Selbstbefruchtungsraten in der
Esparsette möglich sind und diese von einer Inzuchtdepression begleitet werden.
Somit lässt sich ein Selbstinkompatibilitätssystem ausschliessen. Diese
Erkenntnisse sind direkt nutzbar um praktische Züchtungsmethoden zu
optimieren. Des Weiteren konnte die Nutzbarkeit neu bereitgestellter Marker für
die Esparsette bewiesen werden, was zukünftige genetische Studien in der
Esparsette fördern könnte. Die Assoziation einzelner SSR Marker mit
agronomischen Merkmalen und Inhaltsstoffen kann zur Selektion von Individuen
für Pflanzenzuchtprogramme genutzt werden und somit die Züchtung neuer
Esparsettensorten unterstützen.

9
Chapter 1 General Introduction
„Ich habe niemals einen angenehmeren Anblick gesehen, als die
Hügel um Milden herum, die überall von dem Purpur der blühenden
Esparsette glänzen“.
„I have never seen a more pleasant view, as the hills around Milden,
which glow all over from the purple of flowering sainfoin”
(von Haller 1772)

10
Livestock production is increasing world-wide, raising the demand for animal
forage of high nutritional quality (Thornton 2010). To allow for a high level of
animal productivity, species-appropriate rations should combine adequate fiber
contents with high energy and protein concentrations. Grassland, which cover
33% of the agricultural area in Europe, presents a valuable source for locally
produced ruminant forage that is by far not completely exploited yet (Peeters
2009). The production of high quality roughage from grassland is cost-efficient
and could help to decrease the input of concentrated feed (Ivemeyer et al. 2014).
In addition, roughage rations composed of diverse grassland species positively
influence concentrations of valuable fatty acids and antioxidants, contributing to
improved quality of meat and milk products (Stypinski 2011; Girard et al. 2016).
By choosing plant species with specific adaptive capacities, grassland allow for
extending forage production to less favorable areas or to mitigate challenges such
as increasing temperatures or drought periods. Thereby, legume species are a
valuable option to complement grassland mixtures: with their ability to fix
atmospheric nitrogen via association with rhizobia, higher yields can be realized
with less input of nitrogen fertilizers (Lüscher et al. 2014). Besides the typical,
widely used grassland legumes such as red clover (Trifolium pratense) and alfalfa
(Medicago sativa), many other, partially neglected species exist, which could offer
some advantages over those traditional species. Sainfoin (Onobrychis viciifolia) is
an outstanding candidate, as it combines the possibility to produce protein with
equal quality as from alfalfa with secondary compounds that support animal
health in different ways (Kaldy et al. 1979; Aufrere et al. 2008). Such beneficial
effects for animal nutrition and husbandry were demonstrated in different
feeding trials, ranging from reduced bloat over increased live weight and reduced
worm burdens to decreased methane emissions. Contrastingly, from an
agronomical point of view, sainfoin exhibits several disadvantages which make it
less attractive for a wider distribution.
Despite its potential benefits, sainfoin is yet an underutilized crop and breeding
activities are at a very low level when compared to other forage species. However,
the development of new, superior varieties is essential for a wider distribution of
sainfoin. To advance breeding programs, more detailed knowledge on the genetic
basis of sainfoin, including the predominant type of fertilization (self- vs. cross-

11
fertilization), has to be provided. Furthermore, genetic markers need to be
developed to describe the genetic makeup (genotype) of different sainfoin plants
and to find possible marker-trait associations, that could be used to enhance
selection progress in breeding programs. Hence, the aims of the present thesis
were to (i) analyze the mode of reproduction in sainfoin with regard to cross- and
self-fertilization (chapter 2), (ii) to investigate the usability of newly developed co-
dominant molecular markers to assess genetic diversity (chapter 3), (iii) to test if
these co-dominant and other dominant markers are associated with different
agronomic and compositional traits (chapter 4), and (iv) to use these markers to
establish a first linkage maps for sainfoin (chapter 5).
1.1 Grassland production systems
1.1.1 Importance of grassland
Grasslands are a major class of ecosystems consisting of diverse species. They can
be divided into three groups: natural grassland formed by undisturbed ecological
succession, semi-natural grassland involving naturally occurring herbs and
grasses used for forage production, as well as intensive grassland consisting of
sown and highly productive grass and legume species (reviewed in Hejcman et al.
2013). The benefits from grasslands are manifold: they provide animal forage, are
habitat for several species, maintain biodiversity, contribute to the preservation
of clean water, prevent floods, and sequestrate and store carbon in the soil
(Scurlock and Hall 1998; O'Mara 2012). The total global value of such so-called
ecosystem services provided by grass- and rangeland reached US$ 232 ha-1 year-1
(reviewed in Gaujour et al. 2012). Grassland is also of high economic importance
for many farmers, for example in Switzerland, where the majority of the gross
income is based on milk production (Jeangros and Thomet 2004).
Species composition of grassland can be quiet diverse dependent on region,
climate and usage. Furthermore, management intensity is a major factor
defining grassland communities. For example, intensive production systems with
high fertilization favor grasses tolerable to frequent cutting such as perennial
ryegrass (Lolium perenne) or timothy (Phleum pratense), whereas legumes loose

12
their comparative advantage of symbiotic N-fixation and are generally reduced
(reviewed in Gaujour et al. 2012). In Switzerland, grasses are the dominant
element of intensive grassland, often accompanied by white clover (Trifolium
repens) as the legume component (Jeangros and Thomet 2004). The demands to
grassland communities are high: as forage source they should improve milk and
meat quality and stay productive with changing environmental conditions e.g.
due to climate change (Lüscher et al. 2014). A higher diversity of grassland
species is seen as favorable in order to stabilize and enhance productivity of the
system and improve the forage value (Kölliker and Boller 2010). The introduction
of minor species as well as wild relatives of cultivated plants is, therefore,
desirable.
1.1.2 Use of legumes
Legumes (Fabaceae) are a family which comprises 18’000 to 19’000 different
species within the order Fabales, including annual and perennial herbaceous
plants, shrubs and trees (reviewed in Graham and Vance 2003). For human
welfare, legumes have a unique position within the plant kingdom, as they are
the most important protein source for animal as well as human nutrition. For
example, soybean (Glycine max) is a major crop of worldwide economic
importance. Although soybean is associated with intensive agriculture and
monocultures, legumes are also candidates for sustainable agriculture due to
their ability to fix atmospheric nitrogen, which is driven via the association with
root nodule forming rhizobia bacteria (Drevon et al. 2015). Fixed atmospheric
nitrogen can also be furnished to non-leguminous companion species, reducing
the need for inorganic N fertilizers (Travis 1993; Peoples et al. 1995). In
grassland, legumes are, therefore, valued as partners for mixtures because
nitrogen is the nutrient limiting productivity the most (Frame et al. 1998).
Furthermore, legumes have been shown to restore soil nutrient levels in crop
rotations after intensive cultivation (Peoples et al. 1995).
Legumes are also an ideal source of proteins in roughage, i.e., forage rich in crude
fiber that usually includes fresh, ensiled or dried herbage, maize or beets.
Because the forage value of roughage is seldom meeting the protein demands of
highly productive farm animals, livestock farmers often complement rations with

13
concentrated feed on basis of soybean. However, concentrated feed is seldom
produced on farm and must be imported from regions where monocultures
dominate the landscapes, with severe impacts on the environment such as soil
degradation, pollution of ground water via intensive fertilizer and pesticide
application, as well as destruction of primary forests for provision of arable land.
The use of homegrown protein from legume species produced within grassland
communities or as part of rotation farming could drastically decrease the use of
concentrated feed and, hence, is economically and environmentally sustainable.
1.2. Genetic improvement of plants: background information
1.2.1 Mating systems in plants
In the plant kingdom, three types for reproduction via seeds are known: self-
fertilization (autogamy), cross-fertilization (allogamy) and rather seldom
occurring parthenogenesis (apomixis). The type of reproduction has a major
influence on the genetic composition of plants overall referred to as homozygosity
or heterozygosity. For given loci (position in the genome), heterozygosity
describes the presence of different alleles (possible state of a locus), whereas
homozygosity describes the presence of identical alleles. In self-fertilizing
individuals (self-pollinated; selfings) homozygosity is increased, whereas
heterozygosity is increased in cross-fertilizing individuals (cross pollinated;
crossings). The preference of plants for self- or cross-fertilization is not always
exclusive under the presence of both sexes in one plant (monoecious plants), but
mechanisms exist in some species to enhance one or the other. Self-fertilization
often occurs due to enclosed pistil and anthers, preventing foreign pollen from
entering the flower (cleistogamy). In contrast, cross-fertilization could be
guaranteed by physical or genetic barriers preventing self-fertilization with own
pollen or pollen from close relatives. Physical barriers consist of flower
architectural traits, like e.g. a stigma overtowering the anthers (heterostyly).
Genetic barriers include a shifted maturity of stigma and anthers (dichogamy;
protandry and protogyny) or plants with separated sexes (dioecious plants).
Furthermore, genetic self-incompatibility systems exist which prevent pollination

14
due to recognition of own or related pollen (sporophytic and gametophytic self-
incompatibility, Lloyd and Schoen 1992 a).
There are several reasons why cross-fertilization and, therefore, an increased
heterozygosity, is favored, like the plasticity of populations to withstand different
environmental conditions and the avoidance of inbreeding depression. Inbreeding
depression describes the decreased performance of plants for traits such as vigor
or fecundity with increased homozygosity after self-fertilization. Oppositely,
heterosis describes the supererogation of plants produced by cross-fertilization in
comparison to their inbred parents (Becker 1993; Birchler 2013). Species which
are predominantly cross-fertilizing tend to suffer severe from inbreeding
depression when subjected to self-fertilization. This is mainly due to the
accumulation of detrimental recessive alleles, which are initially unnoticed due
to presence of non-detrimental alleles in heterozygous plants. Inbreeding
depression occurs if plants get homozygous for detrimental recessive alleles, but
is also affected by the disturbance of other mechanisms like the loss of
overdominance at loci with heterozygote advantage and the loss of additive gene
actions (Lande et al. 1994; Charlesworth and Willis 2009). In species with
naturally higher proportion of self-fertilization, the effects of inbreeding are often
alleviated due to selection against deleterious alleles in earlier generations.
1.2.2 Polyploidy in plants
Reproduction is the key element for the sustainment of species, favoring those
individuals which are able to adapt to changing conditions. Polyploidy, the
genome wide multiplication of the chromosome number is one mechanism
enabling individuals to gain advantages over others. Several domesticated crops
are polyploids like wheat (Triticum aestivum, hexaploid), cotton (Gossypium
hirsutum, tetraploid) and potato (Solanum tuberosum, tetraploid). Polyploid
plants often have an advantage over diploids via increased plant growth and
vigor, larger flowers and larger seeds (Bretagnolle and Lumaret 1995).
Furthermore they may have altered physiology which allows adaption to
unfavorable climates as drought (reviewed in te Beest et al. 2012). Two different
types of polyploidy can be distinguished: autopolyploidy and allopolyploidy.
Autopolyploid plants own multiple copies of chromosomes from one and the same

15
diploid ancestor genome or of themselves as is the case for induced polyploids.
Allopolyploids are derived from the hybridization of different diploid ancestor
genomes. Auto- and allopolyploid plants vary in chromosome pairing behavior
during cell division in sexual reproduction (meiosis). Autopolyploids only possess
homologous chromosomes, i.e. sets of chromosomes owning the same genes and
originating from the same ancestral genome. In contrast, allopolyploids possess
homologous chromosomes as well as homeologous chromosomes, i.e. chromosomes
owning similar genes, but originating from different ancestor genomes.
Homologous chromosomes pair during prophase of meiosis, whereas homeologous
chromosomes will not pair. In autopolyploids, homologous chromosomes are
forming groups during metaphase, with pairs of two (bivalent), three (trivalent),
four (quadrivalent) or more chromosomes (multivalent formations), resulting in a
so-called polysomic inheritance. Contrastingly, in allopolyploids, only homologous
chromosomes are pairing together, resulting in exclusively bivalent formations
and a so-called disomic inheritance in case of an allotetraploid species (Ramsey
and Schemske 2002). Bivalent formation is similar to the behavior in diploids
with the two homeologous chromosomes being independent of each other. These
differences in chromosome pairing behavior have influence on chromosome
formation and, therefore gene inheritance and exchange (crossing over, Fig. 1.1).
The knowledge of gene inheritance patterns is essential for breeding species with
desired gene combinations, like e.g. combining resistance genes.

16
Fig. 1.1 Chromosome formation in autotetraploids and allotetraploids in metaphase during
meiosis. Taken from Comai (2005)
1.2.3 Breeding methods in forage plants
The major aims for breeding forage plants are improvement of the annual dry
matter yield, adaption to local environments, resistance against pests and
diseases, stress tolerance and increased digestibility (Humphreys 1997;
Humphreys 2005; Christoph Grieder, personal communication, 2016). Thereby,
the breeding method is determined by the mating system of the particular species
(Posselt 2010). Most forage species are cross-fertilized and need foreign pollen for
successful reproduction within genetically diverse populations (Rea and
Nasrallah 2008). For example, the most important grass species Italian ryegrass
(Lolium multiflourm) and perennial ryegrass are wind pollinated, whereas the
most important legumes red clover white clover and alfalfa are pollinated via
insect vectors, cross pollination in both groups being secured by self-
incompatibility (Cornish et al. 1979; Campbell 2000; Casey et al. 2010; Riday and
Krohn 2010a). Hence, open pollinated or synthetic variety breeding, aiming at

17
the preservation of heterozygosity within a breeding population, are the main
breeding methods employed for forage crops. In the past, forage varieties were
bred as open pollinated varieties, whereby a number of superior plants are
selected from a base population via mass selection, based on their phenotype
determined on spaced plants in the breeding nursery. The process could be
repeated several times (recurrent selection) and could also involve the
introduction of new plant material and genetic resources. The resulting varieties
represent a population of different genotypes, sufficiently large to avoid
inbreeding depression. In polycross schemes, which are often employed today,
selected individuals (each representing a different genotype) are vegetatively
propagated (cloned) and interplanted together for random mating among the
different genotypes. After separate harvest of seeds, progeny of each genotype
can be grown to determine the general combining ability (GCA), i.e. the relative
performance of the offspring of a parental genotype in relation to all other
offspring of the polycross. Based on GCA, the best parental plants can be
evaluated and clones or remaining seeds from these plants can be used to create
the new, so-called synthetic variety. Topcross schemes are similar to polycross
schemes, but involve crossing every plant genotype to a common pollinator
(tester) instead of random pollination among all genotypes.
Increasing the performance of forage plants from grassland species will remain
an ever ongoing process for forage plant breeders. A method frequently used in
breeding forage plants is chromosome doubling, mostly from a diploid to a
tetraploid set of chromosomes (induced autotetraploidy). This polyploidization is
achieved by treating plant seedlings with colchicine (Blakeslee and Avery 1937),
a metabolite of the autumn crocus (Colchicum autumnale) disturbing the cell
cycle during metaphase of mitosis. Thereby, the reduction division is aborted and
resulting cells exhibit a doubled chromosome set. In comparison to their diploid
origin, induced polyploid plants often show increased vigor and biomass yield,
larger seeds and higher digestibility, which is a consequence of higher cell-
content to cell-wall ratios due to larger cell size (reviewed in te Beest et al. 2012).
Another possibility to increase plant performance or to create new variations is
the induction of mutations via chemical treatment or ionizing radiation (Posselt
2010). However, this method is not always successful. Future research will also

18
focus on the development of hybrid varieties in forage grasses and legumes, as
synthetics do not strongly exploit heterosis (Aguirre et al. 2012). Hybrids, as
usually used in maize (Zea mays) breeding, are the crosses between inbred lines
of two different heterotic pools and express strong heterosis. Here, a prerequisite
is the possibility to develop inbred lines, what can be usually achieved via self-
fertilization. In this perspective, self-fertilization is a desired trait and will be
possible in forage plants after finding or creating plant genotypes with broken
self-incompatibility system (Riday and Krohn 2010b).
1.2.4. Genetic markers to assist plant breeding
Traditional plant breeding is a time consuming process with several years of
phenotyping, testing of breeding candidates and selection. Most forage species
require vernalization and only flower after the year of establishment. Therefore,
they have a long generation interval, which, in turn, results in a low breeding
progress. As part of long lasting meadows, forage species should exhibit a good
persistence, a trait of which the assessment is a process consuming years. The
knowledge of the plants’ pedigree as well as the heritability (h2, the share of
genetic variation to the phenotypic variation) of a trait can be used to predict the
performance of the offspring of selected plants. Here, traditional breeding is often
assisted by molecular markers. A direct use of molecular markers in plant science
is the designation of parentage (Kölliker et al. 2005). A more labor-intensive
approach is the identification of molecular markers which are associated with
quantitative trait, so-called quantitative trait loci (QTL, Kearsey and Farquhar
1998). QTL are sections on the plant chromosome harboring a gene regulating a
quantitative trait. Genetic markers linked to a QTL are, therefore, very likely
being inherited together with the regulating gene and indirect selection for the
trait is possible via selection for the marker phenotype. Thereby, molecular
markers have the advantage that they are not influenced by environmental
factors, can be assessed on young plants, and have a theoretical heritability of h2
= 1. Indirect selection of genotypes superior for a given trait via selection for
markers linked to a QTL is referred to as marker assisted selection (MAS). The
use of MAS was successfully established and used in several plant species such
as in potato for the presence of resistance genes against potato late blight

19
(Phytophtora infestans, Sliwka et al. 2010), in maize for earliness and grain yield
(Bouchez et al. 2002), and in rice (Oryza sativa) for resistance against bacterial
blight (Xanthomonas oryzae pv. oryzae, Singh et al. 2001).
In forage plants, most traits have a quantitative and polygenic (controlled by
many genes) character and their improvement is laborious and expensive.
Therefore, MAS could be a valuable tool, e.g. as proposed for the improvement of
nitrogen-use efficiency or crown rust (Puccinia coronate) tolerance in perennial
ryegrass (Dolstra et al. 2003; Pauly et al. 2012). For species like sainfoin that are
underutilized due to weaknesses in agronomic performance, MAS offers prospects
to improve such species and make them economically more attractive (chapter 4).
For detection and application of QTL in plant breeding, availability of numerous
and cheap genetic markers is a precondition. Several marker systems, broadly
divided in dominant and co-dominant markers, are available today: Restricted
Length Fragment Polymorphism (RFLP, co-dominant), Amplified Length
Polymorphisms (AFLP, dominant), Random Amplification of Polymorphic DNAs
(RAPDs, dominant), Sequence Tagged Sites (STS, co-dominant), Single
Nucleotide Polymorphisms (SNP, co-dominant) and Simple Sequence Repeats
(SSR, co-dominant). Dominant markers are widely distributed due to their easy
application in non-model organisms (Meudt and Clarke 2007), but bearing the
disadvantage of only showing the dominant allele and not being suitable to
measure heterozygosity. Co-dominant markers, in contrast, also show recessive
alleles and, therefore, the heterozygous state at a marker locus. The
identification of recessive alleles is important, as they could carry advantageous
or deleterious, rare properties. The development of co-dominant markers for non-
model species was elaborate and expensive, but the new next generation
genotyping-by-sequencing technologies (NGS) enabled the development of vast
amounts of co-dominant SSR and SNP markers by high-throughput sequencing
(Elshire et al. 2011; Zalapa et al. 2012). Different NGS platforms are available,
e.g. Illumina MiSeq and HiSeq, Roche 454 and Ion Torrent PGM. Parallel
handling of large sample amounts is possible, yielding billions of DNA bases.
Those NGS technologies are also attractive possibilities to create sainfoin specific
co-dominant markers.
20
1.3 Sainfoin
1.3.1 Taxonomy
Sainfoin is a perennial legume from the tribe Hedysarae of the subfamiliy
Fabaoidae within the family Fabaceae. The taxonomy of the tribe Hedysarae
remains quite controversial with different ordering of sections (Yildiz et al. 1999;
Lewis et al. 2005; Kar et al. 2014). Summarizing available information, the most
likely taxonomic affiliation is that within the tribe Hedysarae, sainfoin belongs to
the genus Onobrychis Mill., therein to the subgenus Onobrychis and therein to
the section Onobrychis (Fig. 1.2, Woodgate et al. 1999). The confusion in the
taxonomy is also reflected by the number of synonyms listed for sainfoin which
are Hedysarum onobrychis L., Onobrychis onobrychis (L.) Karsten, Onobrychis
sativa Lam., Onobrychis viciifolia Scop. subsp. sativa (Lam.) Thell. and
Onobrychis vulgaris Güldenst. (Porcher 2004). This lack of clarity might also lead
to problems to differentiate between different species in the same section.
Within the species of sainfoin (Onobrychis viciifolia), two botanical types are
distinguished: common types (Onobrychis viciifolia Scop.var. communis Ahlef.)
and giant types (Onobrychis viciifolia Scop. var. bifera Hort.). Common types
have their origin in central Europe and are also referred to as single cut types,
due to the slow vegetative regrowth after the first cut (Badoux 1964). They show
a good persistence of up to eight years. The growth type remains more prostrate
at the beginning of cultivation and flowering starts in the year after
establishment. Giant types (Onobrychis viciifolia Scop. var. bifera Hort.) have
their origin in the Middle East (Badoux 1964). They are designated as double-cut
types due to their fast establishment and regrowth as well as a strong vigor.
Giant types flower up to three times per year, but are less persistent than the
common types (Bell 1948; Piano and Pecetti 2010). Modern sainfoin varieties are
often based on common and giant forms to combine benefits of the two groups.

21
Fig. 1.2 Taxonomic position of sainfoin (Onobrychis viciifolia, adapted from information reviewed
in Woodgate et al. 1999). The affiliation of section Laxiflorae (red) to either subgenus Onobrychis
or subgenus Sisyrosema has not yet been clarified
1.3.2. Origin and historical distribution
Sainfoin is already being cultivated for several decades in temperate Asia and
Europe (Goplen et al. 1991; Frame et al. 1998; Hybner 2013). Yet, its origin has
not been fully clarified, but the majority of the literature refers to the Middle
East and Asia as a center of origin (Smith 2007; Azuhnwi et al. 2012; Hayot
Carbonero et al. 2012; Toluei et al. 2013). In Armenia, cultivation started as early
as in the 10th century (Akopian 2009). It seems likely that sainfoin thence spread
to neighboring countries such as Russia and Turkey, as an introduction for

22
cultivation in Russia took place in the mid-14th century (Dzyubenko and
Dzyubenko 2009). Its first appearance in western Europe was in southern France
during the 15th century (Piper 1914). Later, sainfoin gained high importance in
France until the beginning of the 18th century, also reaching its peak distribution
in whole Europe (Chorley 1981; Hanelt 2001). Around the 17th century, sainfoin
cultivation activities started in the UK and Germany (Piper 1914; Doyle et al.
1984; Liu 2006) and around the 18th century in Italy (Piper 1914). The Swiss
botanist Albrecht von Haller reported cultivation of sainfoin in Germany in one of
his writings (von Haller 1772), and as he was open-minded to new agricultural
plants, he possibly introduced this species to Switzerland: in 1759, he received
larger amounts of seeds from the French Charles Bonnet, who sent them over the
lake of Geneva to Vevey (Switzerland). Beyond Europe, the introduction of
sainfoin to the United States of America is controversially discussed, with Goplen
(1991) dating the beginning of its cultivation to the 1900s, whereas Roseberg
(1993) specified it to 1786. However, sainfoin has never became a major forage
crop in the USA, neither with the introduction of the “Cooper Mix” in 1970, a
pasture mix with sainfoin as the seed base.
1.4. Basic characteristics of sainfoin
1.4.1 Morphology
Sainfoin is an herbaceous plant growing in a prostrate or erect manner (Fig. 1.3a
and b). The biomass comprises stems and multifoliate leafs with ten to 28 pairs of
pinnately leaflets and one single terminal leaflet arising from the middle of the
vegetation disk. The leaf to stem ratio can be highly variable, with smaller plants
tending to have a higher leaf to stem ratio (Malisch et al. 2015). The appearance
of the stem varies with genotype, ranging from fine and soft to thick and stiff and
from green to completely red (Fig. 1.3c). Also, the shape and color of the leaflets
vary between genotypes.
The root system of sainfoin comprises a deep tap root, which reaches depths of
110 to 200 centimeters in the soil, allowing the acquisition of substantial
amounts of subsoil water and nutrients and mediating a good tolerance to

23
drought spells with drying upper soil layers (Fleischmann 1932; Agrarökonomie
2006).
Fig. 1.3 Sainfoin plants in the year of establishment showing a) prostrate and b) erect growth, as
well as c) red stems (Photos: Katharina Kempf).
The pink flowers stands, consisting of about 80 small florets, are an axillary
raceme (grape-like) in conical shape (Fig. 1.4a-c). White flowers are also possible,
but occur very seldom (Hayot Carbonero 2011). Flowering starts at the base of
the flower stand, reaching its top after some days. The time of flowering can be
highly variable among different genotypes. After pollination by insects, green
oval to kidney shaped seeds develop, containing one true seed (0.5 x 0.3 cm) that
is much smaller than the coated seed (0.8 cm x 0.5 cm, Fig 1.4d). Seed ripening
starts from the base to the top of the flower stand with browning of the seeds
(Langer and Hill 1991).
Fig. 1.4 a) partially mature sainfoin flower, b) single floret closed, c) open floret with anthers,
pollen and stigma visible, d) mature coated sainfoin seeds (Photos: Katharina Kempf).

24
1.4.2. Chemical properties of sainfoin
Sainfoin is known to be rich in condensed tannins (synonym: proanthocyanidins),
which belong to the group of secondary plant metabolites. In contrast to primary
plant metabolites that are responsible for growth promotion, secondary plant
metabolites are often involved in plant defense (Heil et al. 2002; Min et al. 2003;
Volf et al. 2015), while they are mostly water soluble and bind to proteins and
other macromolecules in aqueous solutions (Bate-Smith 1962, Haslam 1989 cited
in Serrano et al. 2009). Tannins in general are polyhydroxyflavan oligomers or
polymers. Four groups are defined based on their chemical structures:
phlorotannins (occur mainly in marine organisms), condensed tannins (CTs),
hydrolysable tannins (HTs) and complex tannins (Serrano et al. 2009). CTs are
the most diverse group of tannins and are built of procyanidin (PC) and
prodelphinidin (PD) subunits. PCs consists of two or more monomeric (+)-
catechin or (-)-epicatechin units, whereas the PDs consist of (+)-gallocatechin or (-
)-epigallocatechin units (Fig. 1.5a). The HTs (gallic acid derivates, gallotannins
and ellagitannins) are, in view of their structure, the most complex tannins
(Salminen and Karonen 2011). Salminen and Karonen (2011) suspected that
ellagitannin (Fig. 1.5b, c, a class of hydrolysable tannins) oxidation might form a
major chemical defense against herbivores, what is against the previous opinion
that the protein binding activity in CTs alone is responsible for plant defense
mechanisms.
CTs, as present in sainfoin, are associated with several benefits if fed to animals.
The protein utilization in ruminants fed with diets enriched with CTs is
improved, leading to faster growth rates, increased milk production and quality
(Girard et al. 2016). The better utilization is caused by a reduced protein
digestion by microorganisms in the rumen when proteins are bound to tannins.
Complexation of proteins is assumed to happen at pH of 6 – 7, as present in the
rumen. With changing pH in the abomasum (pH < 3.5) and the small intestine
(pH > 7), proteins unbind from the complex again, leading to increased protein
availability for gastric or pancreatic digestion (reviewed in Mueller-Harvey 2006).
From these so-called ruminal escape proteins, more dietary amino acids can be
absorbed and utilized by the animal.

25
Fig. 1.5 a) condensed tannin (CT, as present in forage plants) R = H procyanidins; R=OH:
prodelphinidins; b) ellagitannin (as present in chestnut) R1 = OH, R2 = H: castalagin; R1 = H, R2 =
OH: vescalagin; c) ellagitannin (as present in chestnut), R1 = OH, R2 = H: castallin; R1 = H, R2 =
OH: vescalin. Taken from Mueller-Harvey (2006)
The presence of CTs has also direct impact on animal health by preventing bloat.
Bloat is a severe problem in ruminants causing the impairment of the digestive
and respiratory function and, not rarely, the death of the animal due to cardiac or
respiratory arrest. Bloats are caused by gas accumulated in the rumen and
reticulum after the ingestion of readily digestible feed with intensive
fermentation, e.g. from alfalfa and white clover (Sottie 2014). Frequently, stable
foams generated by bacterial slime and plant leaf protein hinder the release of
fermentation gas via eructation, leading to froathy-bloat (Wang et al. 2012).
Condensed tannins are able to inhibit rumen microorganisms and foam
formation via binding and precipitation of proteins (Waghorn and Jones 1989).
Another positive aspect of the presence of CTs is the reduction of greenhouse gas
emissions by reducing ruminal degradability of fiber (McMahon et al. 1999;
Bueno et al. 2015). Thereby, the chemical structure of CTs seems to affect the
total CH4 reductions (Hatew et al. 2015; Saminathan et al. 2015).
CTs also play a role in the control of gastrointestinal parasites in animal
production systems. Because increasing formation of resistance in parasite
populations to synthetic anthelminthic drugs, CTs are a desired alternative
nutraceutical, impairing the development of nematodes. CTs decrease the
development of infectious larval stages and egg excretions, also reducing
26
contamination of pastures. Different hypotheses on the anthelmintic mode of
action of CTs exist. One hypothesis is that CT directly influences the worm
biology by reducing fecundity, whereas another hypothesis supposes that the host
immune response is improved after ingestion of CT rich forage (Tzamaloukas et
al. 2006; Hoste et al. 2012). Though the mode of action is not completely known
yet, the susceptibility of parasites varies depending on structural variations in
CTs (Quijada et al. 2015).
Despite their many advantages, the use of tannins in animal science is a
tightrope. The binding of proteins, carbohydrates and lipids bears also the risk
that the availability of these nutrients might get too low (Butler 1992). The
source of tannins as well as an adequate dose is, therefore, fundamental to
enhance the positive effects. The differentiation of beneficial and non-beneficial
tannins seems dependent on several aspects and is yet not fully examined. The
group of tannins surely has an impact, whereby PCs, PDs and ellagitannins are
considered as predominantly animal health promoting. The ratio of PCs to PDs in
CTs might also play a role, as well as presence of other plant compounds, binding
strength of CTs and their molecular weight (Mueller-Harvey 2006).
1.5. Cultivation and use
1.5.1 Nowadays distribution
Sainfoin is nowadays commonly cultivated in Turkey with an area of about
94,000 ha in 2001, whereby the plant is mainly produced in middle and eastern
Anatolia (Eken et al. 2004; Tufenkci et al. 2006). There, ecotypes, i.e., populations
locally evolved in the respective regions and adapted to the environmental
conditions, are of high importance (Tan and Dumlu 2009). In Russia, sainfoin is
mainly cultivated in forests, steppe and mountainous areas, where it is under use
for light grazing, but moreover for hay production (Dzyubenko and Dzyubenko
2009). In Switzerland, sainfoin is recommended as a minor component for dry to
fresh fertile meadows, yellow oat grassland, bromegrass meadows and on
ecological compensation areas which are useful to connect isolated habitats
(Agroscope 2009). Wild grown sainfoin plants were found all over Switzerland

27
with more frequent findings in areas bordering Germany and France (info-flora
2015). In Germany, the abundance is highest in Baden-Württemberg and
Franconia, with the majority of plants growing naturally rather than being under
cultivation (BfN 2013; Meyer 2015). In France, sainfoin covered 24% of the total
cultivated legume area during the last centuries (Huyghe 2007), but has been
largely replaced by alfalfa nowadays. In general, the situation for France and
Germany with decreasing importance of sainfoin since the middle of the 20th
century seems to be reflective for the whole of Europe, including the UK, where
the crop almost disappeared (Doyle et al. 1984). In the U.S., sainfoin is gaining
more and more interest as a forage plant in Montana and New Mexico, what
could also be achieved thanks to the development of site specific adapted
varieties. There, sainfoin stands are used for direct grazing and cutting for hay
production and they are also appreciated as parts of crop rotations (Smith 2007;
Roesler 2015). The cultivation of sainfoin is nowadays also considered as a
valuable option for Australia and New Zealand, because of its health promoting
benefits by preventing bloat in ruminant production and resistance to aphids
which cause severe losses in alfalfa (Fortune 1985; Rumball and Claydon 2005).
1.5.2 Cultivation
The weak persistence and, hence, performance of this perennial plant is probably
the main reason why farmers have not widely adopted sainfoin. Here, the poor
competitive ability of sainfoin against weeds and other plants, as well as the
missing adaption to diverse conditions are the driving force for the loss of plants
(Burke 1840). Pure sainfoin stands usually persist three to four years (Tan and
Dumlu 2009). Conditions favoring the competitive ability of sainfoin and,
therefore, its cultivation, are dry and warm climates with fair irrigation.
Contrastingly, high salt contents, waterlogging and frost are disadvantageous for
its persistence and cultivation (Doyle et al. 1984; Goplen et al. 1991; Neuhoff
2009). Sainfoin grows preferentially on calcareous loam, marly chalk and sandy
or oolitic soils with pH >6.5 (Burke 1840). Under warm and dry climate and
chalky soil conditions, sainfoin could even outperform red clover and alfalfa due
to its higher drought resistance when compared to red clover and lower demands
for deep soils when compared to alfalfa (Doyle et al. 1984; Neuhoff 2009).

28
Sainfoin as a legume forms symbiosis with rhizobia (Scott Hill 1980). Artificial
inoculation is sometimes recommended, but not necessary for regions with
abundant legume cultivation and wide distribution of different related strains of
rhizobia bacteria in the soils (Carsten Malisch, personal communication, 2015).
Only under insufficient N status, either due to missing rhizobia association in
some regions or poor soil conditions, application of nitrogen fertilizers is needed,
as the low N status would otherwise result in stunted growth (Goplen et al.
1991).
Fig. 1.6 Weed competition in sainfoin stands in the third growing season (2014) without plant
protection (Photo: Katharina Kempf).
Recommended sowing rates for sainfoin range between 120 to 200 kg per hectare
with 15 cm distance between single seeds (Agrarökonomie 2006; Neuhoff and
Bücking 2006; ufasamen 2015). Severe weed pressure during the establishment
phase can reduce the density of sainfoin stands. Under organic farming with
restricted plant protection, weed occurrence (Fig. 1.6) in established stands
reached up to 42.7% (Neuhoff and Bücking 2006). As alternative to pure stands,
the cultivation of sainfoin in mixtures bears the advantage that weeds could be
suppressed by companion plants, which are not too aggressive against sainfoin
itself. Sainfoin mixtures are cheaper in production and the dry matter yield could
rise by 15% compared to pure stands (Doyle et al. 1984). The climatic conditions
and the site play an important role in finding the optimal mixture partner for

29
sainfoin. In Switzerland, optimal partners were found to be perennial ryegrass
and meadow fescue (Festuca pratensis), both suppressing weeds but not
decreasing sainfoin yield, whereas chicory (Cichorium intybus) and white clover
tended to be too suppressive (Carsten Malisch, personal communication, 2015).
Contrary, chicory seemed to be the optimal partner in the U. K. (Mora Ortiz and
Smith 2016).
Pests and diseases and their influence on sainfoin persistence cannot be
generalized for all regions of cultivation. In the U.S. and Canada, root- and crown
rot diseases are important (Goplen et al. 1991). For Western Europe, clover rot
(Sclerotinia trifoliorum) and brown spots (Stemphylium sarciniforme) are
considered being relevant diseases of sainfoin (Schubiger 2015).
1.5.3. Usage
Sainfoin is used as forage source for ruminants, mostly served fresh, as hay or
pellets, whereas preservation as silage presents difficulties due to its low
carbohydrate content (Agridea 2012). Direct grazing is restricted to dry areas
with moderate irrigation (Goplen et al. 1991; Agridea 2012). Dry matter yield
varies dependent on variety, environmental conditions and cultivation conditions
(Wilman and Asiedu 1983). Generally, production levels are highest for the first
cut in the year after establishment and decreases in the following years. For
Switzerland 60 to 100 dt/ha dry matter yield were reported for the first cut under
conventional conditions (Agridea 2012). Similar yield levels were also reported
under organic farming conditions for Germany with 75 dt/ha (Neuhoff and
Bücking 2006), whereas yields in the U.S. seem to be somewhat lower with 40
dt/ha (Killen 2012).
Besides its usage as animal forage, sainfoin is a valuable plant in rotation
farming as catch crop to restore soil nutrient resources via acquisition of
atmospheric nitrogen for subsequent cultures (Agrarökonomie 2006).
Furthermore, humus development and soil aeration are improved via the deep
soil penetration of the extensive root system, reducing the need for ploughing
(KÖL 2012). Sainfoin is also mentioned as promising species for use in wildlife
habitat restoration or mine land reclamation (Gray and Koch 2008). Its
characteristic as good insect forage source supporting development of different,
30
even non-specialized, bee species, make it a valuable species to support natural
insect communities (Haider et al. 2014).
1.6. Genetic improvement of sainfoin
1.6.1. Reproduction system
Sainfoin is considered being mainly cross-fertilized, with self-fertilization being
supposed to occur seldom. The existence of a self-incompatibility system was
suspected, but no conclusive evidence was provided (Tasei 1984). The
architecture of the flower hampers spontaneous self-fertilization because the
stigma overtowers the anthers (Knuth 1906; Demdoum 2012). So far, only few
studies were conducted to estimate the rate of self-fertilization in sainfoin
(Thomson 1938; Knipe and Carleton 1972; Knipe 1972; Demdoum 2012). Self-
fertilization in general could be achieved by human interference via hand
pollination in emasculated plants and by wind or insect pollination. Using hand
pollination in different studies, only low rates of seed set of 5.11, 5.0 and 15.5%
could be reached (Thomson 1938; Knipe 1972; Demdoum 2012). In a trial of
Knipe and Carlton (1972), white flowering sainfoin plants were planted in a foil
tent together with pink flowering plants and bumble bees ensuring pollination.
From the offspring of these white flowering plants, 72 to 92% showed white
flowers, verifying a high degree of self-fertilization, as the white flower color
shows a recessive inheritance. Thus, the visit of insects such as honey or bumble
bees seems to be the driving force for successful pollination, either with own or
foreign pollen. This result showed that insect pollination could overcome
difficulties in producing selfed sainfoin plants. To verify these results and
possibly use insect pollination for production of inbred lines in breeding
programs, an efficient detection system other than the flower color marker use by
Knipe (1972) is needed. Here, molecular markers would be an excellent choice to
distinguish offspring originating from self- and cross-fertilization.

31
1.6.2. Polyploidy
Besides the mode of reproduction, information on the origin of tetraploidy in
sainfoin is also scarce. This is a relevant issue for breeding sainfoin because the
likelihood of trait inheritance to offspring is different for alleles or genes under
autotetraploid or allotetraploid gene segregation. This likelihood influences
success and time needed for breeding steps. For example, an autotetraploid
genotype AaAa can produce three different types of gametes (Aa, AA and aa),
whereas an allotetraploid genotype AaAa can produce four types of gametes (AA,
Aa, aA and aa, Comai 2005). The possibly oldest study on polyploidy in sainfoin
proved the tetraploid chromosome number 2n = 28 and considered sainfoin being
of the Primula kewensis type without evidence for allo- or autotetraploidy (Fyfe
1946). The Primula kewensis type describes the observation of the first fertile
hybrid derived from crosses of two diploid ancestor plants, in which restoration of
fertility occurs after spontaneous chromosome doubling, resulting in offspring
which is able to reproduce genetically stable offspring (Upcott 1939). However,
more recent studies found indications for autotetraploidy, based on an
autotetraploid-like arrangement of chromosomes during metaphase 1 of meiosis
as observed by microscopy, and a tetraploid inheritance pattern of isoenzymes
(Sacristan 1965; De Vicente and Arus 1996). Besides gene segregation studies,
the inheritance of phenotypic traits represents another way to unravel the origin
of polyploidy. Selfing heterozygous sainfoin individuals with stigma mutations by
hand pollination resulted in gene segregation ratios suggesting allotetraploidy
(Knipe 1972).
Problems to clearly identify the type of tetraploidy might occur due to the
possible common occurrence of polysomic (expected for autotetraploids) and
disomic (expected for allotetraploids) segregation and inheritance patterns of
chromosomes and genes in plants. At the one hand, quadrivalent chromosome
pairing as occurring in autotetraploids could also arise in allotetraploid species
due to a higher numbers of homologous segments in closely related ancestors or
mutations in genetic mechanisms preventing non-homologous chromosome
pairing (Stebbins 1950; Sybenga 1996). At the other hand, an autotetraploid
species could direct to diploid-like bivalent chromosome pairing to stabilize the

32
polyploidy or due to genotypes with preferential bivalent formation (Kuckuck et
al. 1972; Comai 2005).
1.6.3 Breeding activities
Nowadays, sainfoin breeding activities are marginal and only few varieties are
available worldwide. The European Commission listed 22 sainfoin varieties
registered in the section “Agricultural plant species” in the “plant variety
catalogue and databases” of 2015 (European Commission 2015). The origin of
those varieties spans only a few countries, with the majority coming from Italy,
Switzerland and Eastern and Southern Europe. The admission dates lead back to
the 1940s and 1960s, followed by a gap of twenty years in which no variety was
registered, and starts again in the 1990s. This gap might reflect political reforms
supporting more intensive agriculture during the 1980s (Hayot Carbonero 2011).
New varieties are often re-admissions from older varieties. For example, the
varieties Vinovsk, Visnovsky, Višňovský might all lead back to the same original
cultivar Visnovsky. The Swiss variety Perdix, released in 2011, originates
directly from the older Swiss variety Perly (Beat Boller, personal communication,
2012). The amount of sainfoin accessions available as genetic resources in gene
banks is also limited, with only 79 accessions listed until 2012 (Feuerstein 2012).
In Germany, no seed multiplication was performed in 2010, and the amount of
imported seeds accounted only for 120 tons (Feuerstein 2012).
Contrastingly to the situation in Europe, research and variety development in
Western U.S. and Canada was most progressive during the 1970s, when sainfoin
was promoted as an alternative to alfalfa (Cash et al. 2010). In the U.S., the
variety “Shoshone”, released 2005, was developed from sainfoin plants surviving
infestations with the northern root-knot nematode (Meloidogyne hapla, Gray and
Koch 2008). Three years later in 2008, the variety “Delaney” was released in the
U.S. as multi-cut variety with improved regrowth and yield (Hybner 2013). In
Canada, the new variety “ACC Mountainview” was promoted which matures
earlier than the standard varieties and performing well in mixed stands with
alfalfa (Acharya 2015).

33
1.6.4. Breeding goals and genetic resources
The overall goal in breeding sainfoin is the creation of new varieties showing
high biomass yields and improved persistence. Persistence itself is related to the
susceptibility to different pests and diseases, as well as the competitive strength
against weeds and adaption to regional climatic conditions.
So far, the demand for genotypes adapted to dry and warm areas was served by
genotypes native to the Soviet Union and Turkey, which performed well in dry
regions of the U.S. compared to Western European varieties (Goplen et al. 1991;
Gray and Koch 2008). For western Canada, adapted varieties exist showing
winter hardiness and exhibiting a strong spring vigor (Goplen et al. 1991).
Furthermore, Canadian sainfoin varieties should perform well under
intercropping with alfalfa in order to reduce bloat potential of the forage,
wherefore improved sainfoin populations are also selected under mixed cropping
with alfalfa (Sottie 2014). Contrary, cultivation trials in New Zealand showed
that varieties from other countries do not perform well and less genetic variation
for adaption to cool season conditions could be found (Rumball 1982).
Furthermore, the slow autumn growth resulted in poor annual yields, a problem
New Zealand sainfoin breeding programs have to deal with besides improved
winter growth (Percival and Cranshaw 1986). These genetic limitations might be
another reason why sainfoin has difficulties to gain agronomic importance in
New Zealand (Rumball and Claydon 2005). In Europe, the problems are
equivalent to New Zealand, with genotypes lacking adaption to wet and cold
climates, whereas the development for drought regions was satisfactory. For
example, Spanish sainfoin cultivars showed poorer performance for
morphological and productive parameters grown in rainfed than under irrigated
conditions (Delgado et al. 2008). A lack of genetic variability for adaption to
moderate temperatures and abundant humidity could also be demonstrated in
trials of Liu (2006) in the U.K., analyzing biomass yield in eight sainfoin
varieties.
Besides the climatic adaption, resistance to different diseases and pests is
desired dependent on area of cultivation. The existing variation in worldwide
genetic pools of sainfoin for resistance traits seemed low or barely tapped. In the
U.S., resistance to the alfalfa weevil, nematodes and root-rot knot nematode

34
Meloidogyne hapla is desired (Wofford and Gray 1987; Ruckman 2008). The
available resistance in common varieties against the northern root-knot
nematode showed low levels of resistance (Wofford and Gray 1987). Testing
different accessions for resistance against Fusarium solani, a pathogen causing
root and crown rot, control varieties showed higher resistance than non-
cultivated individuals, indicating a co-occurrence of resistance and better
agronomic performance (Auld et al. 1977) and highlighting the need for constant
improvement of disease resistances.
Furthermore, given the suitability of sainfoin for animal nutrition, the
improvement of tannin content and composition will gain importance in the
future. Breeding for a generally high CT concentration might result in a
drawback, as it is, so far, not clarified which composition of tannins are the most
effective. For example, species with higher total tannins compared to sainfoin
showed adverse effects for protein utilization in animals (reviewed in Mueller-
Harvey 2006). Nevertheless, it seems reasonable to breed for high leaf to stem
proportions, as leaves make up the biggest share of tannins in sainfoin and are
the palatable part in the forage ration (Haering et al. 2007; Malisch et al. 2015).
The possibility of influencing tannin content and composition via breeding is
feasible, as significant variation could be found in 27 distinct sainfoin accessions
grown under equal conditions (Malisch et al. 2015).
Summarizing available information, there is a lack of varieties for adaption to
cold and wet climates, as well as resistance to pests. The existing sainfoin
resources have to be screened worldwide for plants that could close these gaps.
Furthermore, it will be useful to describe such individuals genetically in order to
identify genes corresponding to the better adaption. Using the knowledge and
genetic marker resources created during this process will be crucial to further
advance breeding programs.

35
1.7 Objectives of the thesis within the LegumePlus project
The present thesis was embedded in the European project “LegumePlus” (PITN-
GA-2011-289377). The project was funded by the Marie Curie Initial Training
Network within EU’s the 7th framework program. The focus of this project was on
interdisciplinary research on the forage legume sainfoin. Within the project, the
disciplines of chemistry, animal nutrition, parasitology, agronomy and plant
breeding were covered. The objectives of the present thesis were to provide basic
knowledge for breeding sainfoin on the basis of molecular markers.
Chapter 2 deals with a fundamental information gap about the ability of self-
fertilization in sainfoin. Sainfoin is considered to be an outbreeding species.
However, the rare data on self-fertilization and different speculative hypotheses
still impose a problem. For developing new breeding strategies, it is essential to
know the possible amount of self-fertilization in sainfoin. The aim of this study
was the analysis of self-fertilization in sainfoin under different pollination set-
ups:
1. Insect pollination by bumble bees (Bombus terrestris) in the greenhouse
with the amount of plants, and thus pollen, restricted to two pairs of five
clones.
2. Open-pollination in three fields grown with populations of sainfoin without
restrictions in the number of plant.
The amount of self-fertilization was then measured using dominant sequence
related amplified polymorphisms (SRAP) and two new, co-dominant simple
sequence repeat (SSR) genetic markers
Chapter 3 is about the characterization of sainfoin specific SSR markers. The
SSR markers were newly discovered by NIAB Cambridge (United Kingdom) via
RNA sequencing. The SSR markers were characterized in collaboration with
NIAB and Aberystwyth University (United Kingdom) for amplification and
polymorphisms in a panel of 32 diverse individuals, to assess their potential to
measure genetic diversity in sainfoin.
36
Chapter 4 builds on the work performed in the previous chapter. A selection of 53
co-dominant SSR markers and 16 dominant SRAP marker combinations were
used for the molecular characterization of a biparental F1 population originating
from cross-fertilization of the pollination trials performed within the framework
of chapter 2. The genetic marker data were combined with information on the
phenotypic performance of the population from a field trial to find marker trait
associations for several agronomic and compositional traits.
Chapter 5 describes a first approach to establish a genetic linkage map for
sainfoin in one biparental F1 population (see chapter 2) on the basis of 48 co-
dominant SSR markers and dominant 16 SRAP marker combinations.
Chapter 6 gives a discussion and overview of the results. Furthermore, possible
future approaches and application of our findings for sainfoin breeding will be
highlighted.

37
Chapter 2 Evidence and consequences of self-fertilization
in the predominantly outbreeding forage
legume Onobrychis viciifolia
Katharina Kempf, Christoph Grieder, Achim Walter, Franco Widmer,
Sonja Reinhard and Roland Kölliker
Published in BMC Genetics 2015, 16:117, doi:10.1186/s12863-015-0275-z

38
2.1 Abstract
Background: Sainfoin (Onobrychis viciifolia) is a promising alternative forage
plant of good quality, moderate nutrient demand and a high content of
polyphenolic compounds. Its poor adoption is caused by the limited availability of
well performing varieties. Sainfoin is characterized as tetraploid and mainly
outcrossing, but the extent of self-fertilization and its consequences was not
investigated so far. This study aimed at assessing the rate of self-fertilization in
sainfoin under different pollination regimes and at analyzing the consequences
on plant performance in order to assist future breeding efforts.
Results: The self-fertilization rate was assessed in three sainfoin populations
with artificially directed pollination (ADP) and in three populations with non-
directed pollination (NDP). Dominant SRAP (sequence-related amplified
polymorphism) and co-dominant SSR (simple sequence repeats) markers were
used to detect self-fertilization in sainfoin for the first time based on molecular
marker data. High rates of self-fertilization of up to 64.8% were observed for ADP
populations in contrast to only up to 3.9% for NDP populations. Self-fertilization
in ADP populations led to a reduction in plant height, plant vigor and, most
severely, for seed yield.
Conclusions: Although sainfoin is predominantly outcrossing, self-fertilization
can occur to a high degree under conditions of limited pollen availability. These
results will influence future breeding efforts because precautions have to be
taken when crossing breeding material. The resulting inbreeding depression can
lead to reduced performance in self-fertilized offspring. Nevertheless the
possibility of self-fertilization also offers new ways for hybrid breeding based on
the development of homogenous inbred lines.

39
2.2 Background
Legumes are particularly valuable component of permanent and temporary
grasslands, as they increase forage yield and quality and simultaneously
decrease the need for nitrogen fertilization through symbiotic N2 fixation
(Lüscher et al. 2014). The perennial legume sainfoin (Onobrychis viciifolia)
combines a multitude of positive characteristics of grassland legumes. It is
adapted to drought prone areas and few important pests and pathogens are
reported for this species (Hayot Carbonero 2011). The name sainfoin is derived
from the French words “sain” and “foin” which means “healthy hay” and implies
the health- promoting features of this species. Sainfoin is characterized by high
contents of condensed tannins which, at a moderate level, support protein
digestion and help to reduce bloat in sheep (Theodoridou et al. 2012; Dentinho et
al. 2014) or cattle (Mezzomo et al. 2011). Tannins are also valued for their anti-
parasitological effects against gut parasites (Paolini et al. 2003). Feeding sainfoin
may help to reduce the use of medications in animal husbandry.
The use of sainfoin in ruminant nutrition is focused on roughage production in
pure or mixed stands. For this, predominantly tetraploid varieties (2n=4x=28)
are used, but diploid populations (2n=2x=14) also exist in natural grasslands.
Based on comparative cytological studies, an autopolyploid inheritance was
suggested for sainfoin (Sacristan 1965). This was verified by a preponderance of
tetrasomic gene segregation, which is characteristic for autotetraploid species, as
shown in a study based on isozyme variation (De Vicente and Arus 1996).
However, the latter study also found some evidence for disomic segregation and
some authors have suggested an allopolyploid condition of sainfoin, although no
direct evidence was given (Zarrabian et al. 2013). Sainfoin is insect-pollinated
with six insect species acting as pollinators (Richards and Edwards 1988), i.e.
bumble bees (Bombus huntii¸ Bombus occidentalis, Bombus rufocinctus and
Bombus fervidus), honey bees (Apis mellifera) and alfalfa leafcutter bees
(Megachile rotundata). Sainfoin was described to be mainly cross-fertilizing
(Tasei 1984; Bennett et al. 2001), but a gametophytic or sporophytic self-
incompatibility has not been described. Cross-pollination may be mediated by the
architecture of the flower, where the position of pistil and anthers could prevent

40
self-pollination (Knuth 1906; Özbek 2011; Demdoum 2012). However, self-
fertilization has been observed to a certain extent (Thomson 1938; Knipe and
Carleton 1972; Negri 1984; Demdoum 2012). Demdoum (2012) verified that
pollen tube growth occurred after self-pollination, but directed self-pollination by
hand resulted in only small numbers of seeds.
Sainfoin was traditionally widely used in monoculture for hay production and is
nowadays mostly used as a component of mixed meadows in extensive
agriculture. Although forage yield and quality as well as animal health
supporting properties make sainfoin an ideal choice for ruminant forage
production, sainfoin is not widely adopted in today’s agriculture. The poor
adoption is mainly due to lower forage yield compared to other legumes (Sheehy
and Popple 1981), a low persistency mostly due to a poor adaptation to wet areas
and cold winters (Simonnet and Carlen 2011), and a weak competitive ability
against other species (Liu et al. 2010). These disadvantages lowered the interest
in sainfoin and breeding efforts have been reduced in the last 30 years to a
minimum. Consequently, there is a general lack of well adapted varieties. In the
plant variety catalogues & databases of the EU (European Commission 2015)
only 22 sainfoin varieties are listed, compared to 218 and 385 varieties for red
clover (Trifolium pratense) and alfalfa (Medicago sativa), respectively. In
addition, seed of sainfoin varieties is often scarce due to low seed yield, which
impairs seed multiplication. Another reason for the low breeding progress in
sainfoin might be the still limited knowledge on the genetics of this species
(Hayot Carbonero 2011). The majority of sainfoin varieties are developed as
population or synthetic varieties and hence comprise a wide range of different
heterozygous genotypes. The amount of gene heterogeneity in such populations
allows on the one hand adaptation to diverse environmental conditions. On the
other hand, deleterious alleles are hidden in such populations and could emerge
after some generations. In other species such as maize (Zea mays), sugar beet
(Beta vulgaris) and rye (Secale cereale), breeding success was accelerated by the
development of hybrid varieties, which exploit heterosis (Moll et al. 1962;
Helmerick et al. 1963; Geiger and Wahle 1978). Hybrid varieties are based on a
pair-cross between two homozygous plants with different genetic background.
The combination of favorable alleles in the offspring leads to increased

41
performance known as hybrid vigor. Hybrid breeding is so far not considered for
sainfoin due to the outbreeding fertilization system and the resulting difficulties
of producing homozygous parental plants. Assessing the rate of self-fertilization
and its consequences in sainfoin will indicate, whether the development of inbred
lines for hybrid breeding is feasible.
The rate of self-fertilization may be directly influenced by pollen availability
through crossing partners, mainly depending on the amount of simultaneously
flowering individuals of the same species (Jain 1976). Pollen availability may be
markedly different in natural conditions in the field than under controlled
conditions such as in breeding nurseries or pollination cages. However, detailed
information on self-pollination rates under different conditions is not available
for sainfoin, partially due to the lack of large scale availability of sequence
specific molecular markers. Marker systems not relying on a priori sequence
information are applicable to a wide range of species and, therefore, may offer a
means to study self-fertilization in sainfoin. The sequence-related amplified
polymorphism (SRAP) marker technique relies on the amplification of GC rich
regions of the genome and produces dominant markers that can be distinguished
based on different amplicon lengths (Li and Quiros 2001).
A major limitation associated with self-pollination in predominantly outbreeding
species is the decrease in plant performance and fitness associated with
inbreeding depression, i.e., the accumulation of deleterious alleles in the progeny.
Knowledge on the extent of inbreeding depression following self-fertilization in a
species is important for breeding decisions such as the selection of parental
plants for bi- or multiparental crosses or the development of homozygous lines for
hybrid breeding.
The main objective of this study was to increase the knowledge on the extent of
self-fertilization in sainfoin and its consequences on plant performance and
fitness in order to provide the basis to optimize breeding strategies for the
development of better varieties and to promote a wider adoption of sainfoin
cultivation. In particular, we aimed at developing a method to assess self-
fertilization in sainfoin with dominant SRAP (sequence-related amplified
polymorphism) and co-dominant SSR (simple sequence repeats) markers. This
method will be used to compare the extent of self-fertilization under two

42
pollination regimes, i.e., artificial directed and natural non-directed pollination.
Based on the knowledge of self-fertilized offspring and non-self-fertilized
offspring the effect of inbreeding on agronomic traits such as plant height, plant
vigor, flowering time and seed development will be analyzed.
2.3 Methods
2.3.1 Plant material and field trial
Three populations of sainfoin (Onobrchis viciifolia) generated through artificially
directed pollination in the greenhouse (ADP) and three populations generated
under non-directed pollination (NDP) in the field were examined for rates of self-
fertilization. For generation of ADP populations, plants from the four varieties
Onobrychis viciifolia 'Visnovsky', 'Brunner', 'Perly' and 'Perdix', which differ for
origin, flowering time, growth habit and mean vigor, were selected (Boller and
Günter 2009; Azuhnwi et al. 2011). All varieties were of the multiple flowering
type bifera, which shows a fast development with flower emergence in the year of
sowing and restart of flowering after cutting (Badoux 1964). Five clones were
established from each of six sainfoin plants via stem cuttings, which were placed
in wet soil without adding growth promoting substances. Cuttings were covered
with plastic foil for two weeks to preserve humidity and established plants were
grouped pairwise in separate greenhouse chambers for seed production (Table
2.1).
Table 2.1 Overview of populations derived from artificially directed pollination (ADP) and non-
directed pollination (NDP).
ADP population Plants (Total) Parent 1 Parent 2 NDP population Plants (Total) Maternal parent
ADP 1 145 Visnovsky_1a Perly_1
c NDP 1 103 Perly
c
ADP 2 218 Visnovsky_2a Perly_2
c NDP 2 109 Perdix
c
ADP 3 237 Brunner_1b Perdix_1
c NDP 3 110 Perly
c
a Agrogen, spol. s.r.o., Troubsko, Czech Republic
b Agroscope, Zurich, Switzerland
c Agroscope, Nyon, Switzerland

43
Artificially directed pollination were conducted in January 2012 by placing
bumble bee (Bombus terrestri) hives (“Bombus Maxi Hummeln”, Andermatt
Biocontrol, Switzerland) into each chamber for three weeks. Seeds from
successful pollinations were germinated in May 2012 on moistened filter paper in
petri dishes at 20°C under normal daylight (ISTA 2009). The final number of
offspring per ADP population varied from 145 to 237 (Table 2.1). The seedlings
were transferred to turf pots and nursed in the greenhouse for two months. In
July 2012, the plants were planted at the field site in Delley (Delley, Fribourg,
Switzerland) with a distance of 50 cm between plants. Plants were arranged in
two rectangular blocks, both with an equal proportion of plants originating from
each cross to balance potential environmental effects. Within blocks, plants were
randomly arranged in rows each consisting of ten offspring of the same maternal
plant.
Populations based on naturally non-directed pollination (NDP) were selected
from three different field sites of rectangular shape. The site of NDP 1 was a
mixed meadow containing the sainfoin variety Perly located in an urban area in
Zurich (Zurich, Switzerland). Sites of NDP 2 and NDP 3 were seed multiplication
trials for the Onobrychis viciifolia varieties Perdix and Perly, both located in a
rural area in Delley (Delley, Fribourg, Switzerland). Maternal plants were
identified at eight positions in each field, which were chosen at the corners and in
the middle of the field for NDP 2 and NDP 3. Plant material was sampled from
these plants for DNA extraction and seeds were harvested and germinated in the
greenhouse to build up the three NDP populations (Table 2.1).
Sites for the field trial and for sampling plant material were provided by DSP
Delley seeds and plants Ltd (Delley, Fribourg, Switzerland; ADP1-3, NDP2-3)
and Agroscope, ISS (Zurich, Switzerland; NDP1).
2.3.2 Phenotyping of ADP populations
Traits associated with agronomic performance were assessed in the first main
season in 2013 on a single plant basis. Plant height was measured in summer
2013 (length of stretched plants from base to the last leaflet). The Plant vigor,
was visually scored on a scale from 1 (weak) to 9 (strong) in summer 2013.
Flowering time was determined in days after first of May 2013 when a plant

44
showed at least three open flowers (Azuhnwi et al. 2011). In the first main
season, seed number and weight were assessed by destructive harvest. As
sainfoin seeds ripen time-delayed from the base to the top of the inflorescence,
the risk to loose seeds before full maturity of all seeds is high (Curtis 1829). To
reduce possible loss of seeds, tillers carrying seeds were cut 10 cm above ground
in July 2013 and directly put into cotton bags. After drying at 30 °C for two days,
plants were threshed manually to avoid seed damage that might interfere with
seed counting. Seeds were separated from the plant material by rough sieving (5
mm grid size), followed by cleaning with an air separator (Kurt Pelz
Maschinenbau, Bonn, Germany) and fine sieving (1.6 mm grid size). Cleaned
seeds were then counted and weighed on a single plant basis.
2.3.3 DNA extraction and marker genotyping
Fresh leaf material from ADP was sampled in October 2012 and from NDP in
July 2013. Afterwards the plant material was freeze dried over a period of 48 h.
The dried plant material was then ground with a ball mill (Cell tissue Analyzer
2, Quiagen, Hilden, Germany) for subsequent DNA extraction using the
illustraTM DNA Extraction Kit PHYTOPURE (GE Healthcare, Little Chalfont
Buckinghamshire, United Kingdom) following the manufacturer’s instructions.
The DNA concentration was determined by gel electrophoresis with a mass
standard (High DNA Mass Ladder, InvitrogenTM, Life Technologies, Carlsbad,
USA). Marker genotyping was performed using dominant sequence-related
amplified polymorphism (SRAP) markers (Li and Quiros 2001) and two co-
dominant SSR markers (Marina Mora Ortiz, personal communication, 2014).
Four fluorescently labelled forward and reverse primers (me1 to me4 and em1 to
em4; Table 2.2; Li and Quiros 2001) were used in 16 combinations in the parental
plants and offspring of the ADP populations and in eight combinations in the
maternal plant and offspring of the NDP populations (Table S2.1). The PCR
reactions were performed using an iCyler (Biorad, Hercules, USA) with a sample
volume of 20 µL, each containing 10 ng DNA template, 1 x Go Taqflexi buffer
(Promega, Madison, USA), 1 mM MgCl2 (Promega), 0.2 mM dNTPs (Promega),
0.6 mg/ml BSA, 0.2 µM fluorescently labelled forward primer, 0.2 µM reverse
primer and 0.5 U polymerase G2 (Promega). The PCR conditions consisted of 5

45
min at 94° C, followed by 5 cycles of 94 °C for 1 min, 35 °C for 1 min and 72 °C for
1 min, followed by 35 cycles at 94 °C for 1 min, 50 °C for 1 min and 72 °C for 1
min. The reaction ended with 7 min at 72 °C (Li and Quiros 2001). For fragment
analysis, 1 µL of the undiluted PCR product was mixed with 0.5 µL LIZ 600
(GeneScanTM-600LIZ® Size Standard; AB applied biosystems, Forster City, USA)
and 10 µL Formamide (Hi-DiTM Formamide; AB, applied biosystems) in a 384
well plate and heated for 5 min at 94 °C. After cooling down, samples were
analyzed with an Applied Biosystems 3500/3500XL Genetic Analyzer. Resulting
SRAP fragments were scored for presence or absence of marker alleles using
GeneMarker (Softgenetics, V2.4.0 Inc., State College, USA). To allow for the
distinction between cross- and self-fertilization in ADP populations, only marker
alleles present in one parent and absent in the other parent (nulliplex alleles)
were recorded. For NDP populations, only fragments which were absent in the
maternal plant and present in at least one of the offspring were scored. In
addition to the SRAP markers, two previously developed unpublished co-
dominant SSR markers were used with the same DNA samples (Table 2.2). PCR
reactions were conducted in a volume of 20 µL, containing 10 ng DNA, 1 x Go
Taqflexi buffer (Promega, Madison, USA), 2.5 mM MgCl2 (Promega), 0.2 mM
dNTPs (Promega), 0.2 µM fluorescently labelled forward primer, 0.2 µM reverse
primer and 0.5 U Polymerase G2 (Promega), using conditions as for a touchdown
PCR with 4 min at 94° C, 12 cycles of 30 s at 66° C with - 1°C decrease at each
cycle plus 30 s at 72° C, and 30 cycles of 30 s at 94° C, 30 s at 54°C plus 30 s at
72°C, followed by 7 min at 72°C. Fragment analysis was performed as described
for SRAP markers.
Table 2.2 SRAP and SSR primers used to determine the rate of self-fertilization
Marker Forward primer (5`-3`) Reverse primer (3`- 5`) Reference
SRAP me1 TGAGTCCAAACCGGATA em1 GACTGCGTACGAATTAAT Li and Quiros, 2001
SRAP me2 TGAGTCCAAACCGGAGC em2 GACTGCGTACGAATTTGC Li and Quiros, 2001
SRAP me3 TGAGTCCAAACCGGAAT em3 GACTGCGTACGAATTGAC Li and Quiros, 2001
SRAP me4 TGAGTCCAAACCGGACC em4 GACTGCGTACGAATTTGA Li and Quiros, 2001
SSR OVLegPl17_F GGGTGTTAGTTATCCATTTCC OVLegPl17_R ACATACTAGCCTTCTGGGGTA Mora Ortiz, “pers. comm“
SSR OVLegPl27_F AATGGAATCTCGGAGACAG OVLegPl27_R GGAAGAAGACGAAGTAGTAGGA Mora Ortiz, “pers. comm“

46
2.3.4 Detection of self-fertilization
In ADP populations, an offspring was considered the result of a self-fertilization
(selfing) when all marker alleles scored as absent in one parent (nulliplex) were
also absent in the offspring. All remaining offspring were classified as the
product of a cross-fertilization (crossings). The SRAP marker data were
additionally used for a principal component analysis (PCA) to visualize a
clustering dependent on origin of cross- or self-fertilization. For comparison, PCA
was also performed on simulated data representing 200 dominant marker scores
for two heterozygous parents and 50 self-fertilized and 50 cross-fertilized progeny
per parental plant (Sheet S2.1). For SSR markers, all offspring containing
marker alleles that were unique to the pollen donor plant (i.e. not present in the
maternal plant) were classified as crossings. SSR data was used to complement
the results from the SRAP analysis. In NDP populations, offspring with SRAP
and SSR marker alleles not present in the maternal plant were classified as
crossings, whereas the remaining offspring were considered as putative selfings.
2.3.5 Statistical analysis
Phenotypic data of ADP populations were analyzed on a single plant basis using
general linear models to assess the effect of population, parental plant and
breeding type of offspring (selfing vs. crossing) on plant height, seed yield, plant
vigor and flowering time:
ikjikjijikiikj epgbpbpgpy ,
where µ is the general intercept, pi is the effect of the ith ADP population, pgij the
effect of the kth parent and pbij the effect of the jth breeding type, both nested
within the ith ADP population, pgbijk the effect of the jth breeding type nested
within the kth parent and ith population, and eikj is the residual error.
Effects of NDP population and sampling position on the self-fertilization rate
were analyzed with generalized linear models using the following logistic
regression model

47
logit[P(Self-Fert)] = µ + pi + sij,
where logit[P(Self-Fert)] is the logit of the self-fertilization rate, µ is the general
intercept, pi is the effect of the ith population and sij is the effect of the jth
sampling position within the ith population. Because sampling positions “corner”
and “middle” were only applied for NDP 2 and NDP 3, NDP 1 was excluded from
this analysis and a further model, reduced by the sampling position term (pi),
was applied on total numbers per population only to test for differences among
the three populations.
All statistical analyses and calculations were performed within the R-
environment (R Core Team 2014), using functions prcomp() for principal
components analysis of SRAP marker data, lm() for general linear models for
analysis of phenotypic data and glm() for generalized linear models.
2.4 Results
2.4.1 Self-fertilization in ADP populations
For the three ADP populations (Table 2.1), the number of markers obtained from
SRAP analysis ranged from 80 to 195 (Table 2.3). Using these markers, high self-
fertilization rates could be identified for all three ADP populations (51.0 to
66.2%), which were largely verified by SSR analysis (Table 2.3). Combined
analysis using both marker systems revealed slightly lower self-fertilization rates
(48.5 to 64.8%), because some offspring identified as selfings by SRAP markers
were clearly identified as crossings based on SSR markers. Self-fertilization rates
varied within populations dependent on the maternal parent (Table 2.3).

48
Table 2.3 Self- and cross-fertilizations in populations from artificially directed pollination (ADP)
determined by SRAP and SSR markers.
ADP populations Maternal subpopulationsa No. SRAP marker Number of plants/ selfings (selfings %)
SRAP SRAP/SSR
ADP 1
195 145/96 (66.2 %) 145/94 (64.8 %)
Visnovsky_1 104 141/95 (67.4 %) 141/93 (66.0 %)
Perly_1 91 4/1 (25.0 %) 4/1 (25.0 %)
ADP 2
188 218/134 (61.5 %) 218/134 (61.5 %)
Visnovsky_2 81 110/49 (44.5 %) 110/49 (44.5 %)
Perly_2 107 108/85 (78.7 %) 108/85 (78.7 %)
ADP 3
166 237/121 (51.0 %) 237/115 (48.5 %)
Brunner_1 86 126/34 (27.0 %) 126/30 (23.8 %)
Perdix_1 80 111/87 (78.4 %) 111/85 (76.6 %) a Maternal subpopulations originated from five clones of one single maternal plant
Fig. 2.1 Principal component analysis of offspring from ADP populations and simulated data by
SRAP marker data. Letters in brackets denote the populations: a) ADP 1, b) ADP 2, c) ADP 3 and
d) simulated data. Large circles and triangles represent the two parents, small grey
circles/triangles the offspring from self-fertilization of the respective parents and small black
circles/triangles the offspring from cross-fertilization between the two parents.

49
Principal component analysis (PCA) based on SRAP data revealed distinct
grouping of offspring depending on breeding type (Fig. 2.1, a-c). The first
principal component (29.6 to 52.1% explained variance) mainly differentiated
between crossings (black symbols) and selfings (grey symbols) with the latter
clustering mostly around the respective parent (Fig. 2.1). The second principal
component (5.8 to 6.9% explained variance) mainly separated crossings based on
their parent. For all ADP populations, some of the identified crossings clustered
close to the respective selfings. This may be due to the one sided nulliplex-marker
evaluation for each maternal plant. We checked for non-maternal alleles at
positions where the maternal plant carries the nulliplex allele, which
characterize the offspring individual as crossing. Offspring with only few non-
maternal alleles would be also considered as crossing, if these individuals
additionally show high similarity in the non-nulliplex alleles they group closely to
selfings of the respective maternal parent. However, the grouping observed was
largely congruent with the one based on simulated data with 200 individuals and
200 marker loci (Fig. 2.1, d).
2.4.2 Self-fertilization in NDP populations
For the three NDP populations (Table 2.1), the number of SRAP markers ranged
from 40 to 122 (Table 2.4). In these populations, generally low rates of self-
fertilization (i.e. 5.8, 0.9 and 4.5%) were observed. After excluding possible false
classifications using SSR markers, the rate of self-fertilization decreased to 3.9%
for NDP 1, to 0.0% for NDP 2 and to 1.8% for NDP 3 (Table 2.4).
NDP 1 showed the highest self-fertilization rate characterized by SRAP markers
only and combined with SSR. The self-fertilization rate was not significantly
different among NDP populations. Furthermore, no significant effect of the
sampling site (corner vs. center of the field) could be detected within NDP 2 or
NDP 3.

50
Table 2.4 Self- and cross-fertilizations in populations from non-directed pollination (NDP)
determined by SRAP and SSR markers.
NDP populations Maternal subpopulationsa No. SRAP markers Number of plants/ selfings (selfings %)
SRAP SRAP/SSR
NDP 1
635 103/6 (5.8 %) 103/4 (3.9 %)
NDP 1_1 86 12/0 (0.0 %) 12/0 (0.0 %)
NDP 1_2 83 11/0 (0.0 %) 11/0 (0.0 %)
NDP 1_3 93 13/0 (0.0 %) 13/0 (0.0 %)
NDP 1_4 84 12/1 (8.3 %) 12/1 (8.3 %)
NDP 1_5 62 13/1 (7.7 %) 13/0 (0.0 %)
NDP 1_6 76 13/3 (23.1 %) 13/3 (23.1 %)
NDP 1_7 106 15/1 (6.7 %) 15/0 (0.0 %)
NDP 1_8 45 14/0 (0.0 %) 14/0 (0.0 %)
NDP 2
688 109/1 (0.9 %) 109/0 (0.0 %)
NDP 2_C1 100 15/0 (0.0 %) 15/0 (0.0 %)
NDP 2_C2 65 13/0 (0.0 %) 13/0 (0.0 %)
NDP 2_C3 89 13/0 (0.0 %) 13/0 (0.0 %)
NDP 2_C4 79 13/0 (0.0 %) 13/0 (0.0 %)
NDP 2_M1 122 14/0 (0.0 %) 14/0 (0.0 %)
NDP 2_M2 77 13/0 (0.0 %) 13/0 (0.0 %)
NDP 2_M3 116 15/1 (6.7 %) 15/0 (0.0 %)
NDP 2_M4 40 13/0 (0.0 %) 13/0 (0.0 %)
NDP 3
676 110/5 (4.5 %) 110/2 (1.8 %)
NDP 3_C1 116 13/0 (0.0 %) 13/0 (0.0 %)
NDP 3_C2 51 10/1 (10.0 %) 10/0 (0.0 %)
NDP 3_C3 64 14/1 (7.1 %) 14/1 (7.1 %)
NDP 3_C4 100 13/1 (7.7 %) 13/0 (0.0 %)
NDP 3_M1 78 15/1 (6.7 %) 15/0 (0.0 %)
NDP 3_M2 116 15/0 (0.0 %) 15/0 (0.0 %)
NDP 3_M3 79 15/0 (0.0 %) 15/0 (0.0 %)
NDP 3_M4 72 15/1 (6.7 %) 15/1 (6.7 %) aMaternal subpopulations originated from one single maternal plant.
NDP _C sampled at the corners and _M sampled in the middle of the field site.
2.4.3 Phenotypic characterization of ADP populations
The number of days until flowering for individual plants ranged from 17 days to
65 days (Fig. 2.2). On average, selfings of Perly_1 (28 days), Perly_2 (34 days)
and Perdix_1 (33 days) showed earlier flowering than selfings from Visnovsky_1
(47 days), Visnovsky_2 (48 days) and Brunner_1 (50 days). The average flowering
time for crossings ranged from 35 days to 44 days and showed less variation
when compared to selfings. Overall, significant differences for flowering time
were only observed between crossings from Brunner_1 and Perdix_1 and for
selfings from Visnovsky_2 and Perly_2 as well as from Brunner_1 and Perdix_1.
Significant differences between crossings and corresponding selfings were found
for Visnovsky_1, Visnovsky_2 and Brunner_1 (Fig. 2.2).

51
Seed yield ranged from 0.0 g (plants without seed set) to 121.5 g and was mostly
lower for selfings compared to crossings. For ADP 1, mean seed yield in crossings
of Visnovsky_1 was significantly reduced by 67% in corresponding selfings. In
ADP 2, selfings showed seed yields reduced by 69.4 and 70.3% compared to
crossings for Visnovsky_2 and Perly_2, respectively, the latter difference not
being significant. In ADP 3, selfings showed seed yields reduced by 79.1 and
37.6% compared to crossings for Brunner_1 and Perdix_1, the latter difference
not being significant.
Table 2.5 Analysis of variance (ANOVA) for traits in populations from artificially directed
pollination (ADP)
Phenotypic trait Modela Df MS F value Pr (>F)
Flowering time Population 2 1096.6 19.2 8.3e -9***
Population : breeding type 3 1639.2 28.7 < 2.2e -16***
Population : parent 3 3158.2 53.4 < 2.2e -16***
Population : breeding type : parent 3 1079.9 18.9 1.0e -11***
Residual 567 57.0
Seed yield Population 2 20072.0 67.7 < 2.2e -16***
Population : breeding type 3 40508.0 136.7 < 2.2e -16***
Population : parent 3 8457.0 28.5 < 2.2e -16***
Population : breeding type : parent 3 3273.0 11.0 4.7e -7***
Residual 561 296.0
Plant height Population 2 3814.8 20.7 2.1e -9***
Population : breeding type 3 10760.5 58.5 < 2.2e -16***
Population : parent 3 4119.3 22.4 1.0e -13***
Population : breeding type : parent 3 3940.9 21.4 3.7e -13***
Residual 569 184.0
Plant vigor Population 2 60.6 31.0 1.6e -14***
Population : breeding type 3 61.7 31.6 < 2.2e -16***
Population : parent 3 11.7 5.9 5.2e -16***
Population : breeding type : parent 3 6.1 3.1 0.03*
Residual 567 1.9 a Complete model = Population + Population: Breeding Type + Population: Breeding Type: Parent
Breeding type = crossing or selfing. MS = Mean squares. * = P < 0.05; ** = P < 0.01; *** = P < 0.001

52
Fig. 2.2 Differences of traits in populations from artificially directed pollination (ADP) dependent
on cross- and self-fertilization. C_ = offspring from cross-fertilization; S_ = offspring from self-
fertilization. Numbers in brackets refer to the total number of plants in this group. Different
letters state significant differences.

53
Overall plant height ranged from 17 to 131 cm. Average plant height was
significantly lower for selfings of Visnovsky_1, Visnovsky_2 and Brunner_1 when
compared to corresponding crossings (Fig. 2.2). In ADP 1, plant height of selfings
was significantly reduced by 20.4% for Visnovsky_1. In ADP 2, plant height of
selfings was significantly reduced by 23.8% for Visnovsky_2, but (non-
significantly) increased by 10.1% for Perly_2. In ADP 3, reductions in plant
height of selfings compared to crossings ranged from 7% to 12.8% for Perdix_1
and Brunner_1, respectively. Vigor scores, reflecting the overall performance of
plants, were also affected by self-fertilization. The scores were significantly
higher in crossings with 8.1 compared to 6.7 for selfings of Visnovsky_1 and with
8.3 compared to 7 of Visnovsky_2. Across all ADP populations, breeding type,
population and maternal parent, as well as their interactions had a significant
influence on flowering time, seed yield, plant vigor and plant height (Table 2.5).
2.5 Discussion
2.5.1 High rates of self-fertilization can be induced
To the best of our knowledge, this is the first report on self-fertilization rates in
sainfoin under different pollination regimes and based on molecular genetic
marker data. The high rates of self-fertilization detected under artificially
directed pollination (ADP) of up to 64.8% allow for the conclusion that a strict
self-incompatibility system is not functional in this species. Previous reports
(Thomson 1938; Demdoum 2012) on self-fertilization in sainfoin reported clearly
lower self-fertilization rates than those observed with ADP in this study, which
might be mainly attributed to the different experimental conditions, such as
plant isolation, manual or insect pollination and plant material. Under plant
isolation, self-fertilization rates of 0.98% (Thomson 1938) and 1.1% (Demdoum
2012) were observed, which was clearly lower than the rates observed for ADP
populations in this study, but comparable to rates found in non-directed
pollination (NDP) populations. Following strict manual self-pollination, seed set
rates of only 5.1% (Demdoum 2012) to 15.5% (Thomson 1938) were observed,
reflecting the low rates of successful self-fertilizations. In these studies, manual

54
pollination may have been hindered by morphological barriers to self-pollination
in sainfoin flowers. Open-pollination by insects in a tent with two clones of two
genotypes resulted in self-fertilization rates from 72 to 92%, as detected using
flower color as marker (Knipe 1972). This is more comparable to our findings in
ADP populations. In our study, rates of self-fertilization showed strong
dependency on the maternal genotype. This could be due to a potential difference
in flowering time between the two genotypes, which may have favored self-
fertilization in earlier flowering genotypes. This is in congruence with the
observation that genotypes with higher selfing rates such as Perly_2 or Perdix_1
showed earlier flowering in the field. In contrast to the ADP populations, we
found very low rates of self-fertilization in NDP populations (0 to 3.9%), which
might be caused by the large number of mature flowers on the three field sites
and the ample availability of pollen from neighboring plants. In addition, the
presence of different pollinator species and their diverse activity patterns lead to
a more constant pollen supply over the day, potentially decreasing the rate of
self-fertilization (Richards and Edwards 1988). In order to assess whether the
number of neighboring plants influences the self-fertilization rate, we tested for
differences among sampling positions located at corners or in the middle of the
fields for NDP 2 and 3, but no significant effect of the field position was found.
However, self-fertilization rates were higher in NDP 1, which was a mixed
meadow with a sainfoin proportion of approximately 20% when compared to NDP
2 and 3, which were pure stands.
2.5.2 Power to detect selfings
Up to now, few sequence specific markers have been developed for sainfoin and
the transferability from other species is limited (Demdoum et al. 2012).
Therefore, we used sequence-related amplified polymorphism (SRAP) analysis
allowing to generate a large number of anonymous, dominant markers (Li and
Quiros 2001). Dominant markers have been successfully used to detect self-
fertilization if marker alleles were unique in each parent (Brazeau et al. 1998;
Clegg et al. 1999). Unique parental alleles can be tracked in the offspring and
used for the detection of cross- or self-fertilization. The disadvantage of dominant
markers is the loss of information about the genotype of an individual shown by

55
the higher variance of estimates obtained from dominant loci compared with co-
dominant loci (Milligan and McMurry 1993). Consequently, the dominant nature
of SRAP markers makes a characterization of self-fertilization or cross-
fertilization ambiguous, since nulliplex genotypes can also arise from a cross of
two tetraploids that are not both nulliplex, e.g. 0 0 0 0 and 1 0 0 0 (0 = allele
absent, 1 = allele present) leading to false positives in the classification of self-
fertilization. However the probability of a nulliplex state after crossing two
markers (0 0 0 0 x 1 0 0 0) with a probability of 0.5 for each marker locus
decreases rapidly with increasing marker numbers and converges to zero with
marker numbers larger than 50. In comparable studies with Caribbean corals
(Favia fragum and Porites astreoides) it has been shown that 30 dominant
marker were sufficient to detect all crossings (Brazeau et al. 1998). Those marker
numbers were lower than the marker numbers used in our study. Supplementary
analysis with co-dominant SSR markers largely supported the accuracy of SRAP
marker results (Table 2.3). A general limitation of marker fragment analysis
could arise from miss-scoring fragments. However, repeated independent scoring
and a large number of markers help to minimize this problem (Milligan and
McMurry 1993). Therefore, SRAP markers demonstrated highly efficient for
distinguishing offspring resulting from self- or cross fertilizations.
2.5.3 Inbreeding depression dependent on trait
Plants which mainly rely on cross-fertilization often suffer from strong decline in
performance after self-fertilization. This inbreeding depression is particularly
pronounced in grassland species such as ryegrass (Lolium perenne, Bean and
Yok-Hwa 1972; Pauly et al. 2012) or red clover (Taylor and Anderson 1980) with
a strong self-incompatibility system. Existence and extent of inbreeding
depression for sainfoin could crucially influence breeding decisions since care
would have to be taken to select for genetically diverse crossing partners.
Alternatively, a low inbreeding depression would allow for the development of
inbred lines as a basis for hybrid breeding. Nevertheless, until now, no detailed
data on inbreeding depression on plant performance was available for sainfoin. In
our study, plant height and plant vigor were affected by self-fertilization in all
three ADP populations (Fig. 2.2). One generation of inbreeding had lowered

56
height and vigor of selfings when compared to crossings. On the other hand, the
better performance of crossings may also have been due to heterosis (Shull 1914).
In our study, the decrease in performance was surprisingly strong for a
potentially heterozygous tetraploid plant. In autotetraploids, recessive
homozygous genotypes will be less frequent than in diploids, and inbreeding
depression is expected to be lower (Posselt 2010). For example, with two alleles at
a frequency of 0.5 each, homozygous recessive genotypes will be present at a rate
of 0.25 in diploids, but only of 0.0625 in tetraploids. Severe inbreeding depression
in autotetraploids was explained by a loss of complementary gene interactions in
the first few generations of inbreeding (Bingham et al. 1994). Sainfoin is a
natural tetraploid, for which tri- and tetraallelic interactions are of higher
importance than for artificially induced tetraploids, where diallelic interactions
are predominant (Gallais 2003). Such higher order interactions will be quickly
lost through inbreeding, partly explaining the observed inbreeding depression for
traits in the ADP populations. In addition, the high copy number in polyploids
and the large genome size allow mild deleterious mutations to accumulate which
can also lead to increased inbreeding depression (Ozimec and Husband 2011). In
our study, we found that not only the breeding type significantly determined the
plant height, seed yield, flowering time and vigor in all populations, but also the
maternal plant influenced the plant performance (Fig. 2.2, Table 2.5), what might
be attributed to different levels of heterozygosity in the maternal genotypes.
The difference in flowering time observed among plants is unlikely to influence
the total seed yield, because earlier flowering does not extend the generative
phase (Galloway and Etterson 2007). For ADP populations, a reduction in seed
yield of up to 79.1% (Fig. 2.2) was observed for selfings. This is remarkably high
when compared to species such as alfalfa, where seed yield reductions of 55%
after one generation of inbreeding were observed (Gallais 1984). Two factors
could play a major role for inbreeding depression of seed yield in sainfoin. On the
one hand, the fitness of the maternal plant plays an important role as seeds acts
as sinks for nutrients and assimilates (Alonso-Blanco et al. 1999) and a good
overall fitness of the maternal plant is indispensable for high seed yield. On the
other hand, the possibly changed genetic composition after selfing, e.g. loss of
genes or interactions and the accumulation of deleterious alleles, might have

57
contributed to inbreeding depression. Environmental conditions may also play an
important role for total seed production (Dechaine et al. 2014). Our experimental
setup did not allow for assessment of genotype x environment interactions, but
selfings and crossings were randomly distributed across the experimental field.
For flowering time, no significant difference between crossings and selfings, but a
significant influence of the maternal genotype was observed (Fig. 2.2). Selfings
from the maternal genotype Visnonsky showed the tendency of later flowering
than the corresponding crossings and selfings of Perly. Selfings of Perdix showed
also the same trend to earlier flowering which could be attributed to the fact that
the variety Perdix originated from the variety Perly (Beat Boller, personal
communication, 2012). Crossings showed an intermediate time of flowering
reflecting the combination of genes from early and late flowering parents. This
pattern of flowering time indicates additive inheritance of this trait and is in
accordance with earlier studies in maize or chickpea (Buckler et al. 2009; Kumar
et al. 2009).
2.6 Conclusions
This study clearly showed that a high degree of self-fertilization could be
achieved in sainfoin under controlled conditions and using insect pollination. The
selfings showed significant inbreeding depression for plant height, plant vigor
and seed yield. Although the dominant reproduction mechanism seems to be
outbreeding, a higher rate of inbreeding can be observed under selective
conditions, as they are also often present in pair- or polycross breeding schemes,
i.e., open pollination within a limited set of selected elite parents. Hence, creating
polycrosses composed of a sufficiently large number of parents that are strictly
homogenous in flowering time is of highest importance to avoid inbreeding of the
earliest genotypes. For maintenance breeding of varieties, large numbers of
genotypes may help to reduce the risk of inbreeding. For targeted pair-crosses, it
might become necessary to emasculate the plants which were selected as
maternal parents to avoid self-fertilization or at least to carefully check the
progeny for potential selfings using genetic markers.

58
On the other hand, if self-fertilization is easily accomplished, superior sainfoin
varieties may be developed through hybrid breeding. For this, homogenous
inbred lines from well performing and good combining genotypes have to be
established and will be crossed to create a superior hybrid offspring. Therefore,
our results provide a valuable basis to define strategies for the implementation of
hybrid breeding in sainfoin.
The assessment of self-fertilization in sainfoin fills a gap in knowledge of this
species and the results could be applied for developing novel breeding schemes.
Finally, improving underestimated species like sainfoin and integrating those
plants in practical cultivation may help to enhance biodiversity in future
agriculture.
2.7 Authors’ contributions
KK established the field trial for this study, carried out the molecular analysis
using SRAP and SSR marker, performed the genetic data analysis and drafted
the manuscript. CG carried out the statistical data analysis and participated in
writing the manuscript. AW and FW discussed the results and participated in
writing the manuscript. SR participated in the molecular analysis and
contributed to the data interpretation. RK supervised the project, assisted in the
data analysis, discussed the results and contributed to draft the manuscript. All
authors read and approved the final manuscript.
2.8 Acknowledgments
This work was supported by grants from the European Commission through the
Marie Curie Initial Training Network LegumePlus (PITN-GA-2011-289377;
http://legumeplus.eu/).
We thank Delley seeds and plants Ltd. for providing the field site and assisting
in the field trial. We would also like to thank Beat Boller (Agroscope), for
providing the plant material and Marina Mora Ortiz (NIAB, Cambridge, UK) for
providing the SSR markers used in this study. Finally, we thank the group of

59
Molecular Ecology at Agroscope, Stefan Oberlin and Robert Spiess for their
support in the lab and in the field.
2.9 Supplementary Information
Table S2.1 SRAP primer combinations in populations of artificially directed pollination (ADP) and
in non-directed pollination (NDP)
SRAP combinations Forward primer (5`-3`) Reverse primer (3`- 5`) ADP populations NDP populations Reference
me1em1 TGAGTCCAAACCGGATA GACTGCGTACGAATTAAT
Li and Quiros, 2001
me2em2 TGAGTCCAAACCGGAGC GACTGCGTACGAATTTGC
me3em3 TGAGTCCAAACCGGAAT GACTGCGTACGAATTGAC
me4em4 TGAGTCCAAACCGGACC GACTGCGTACGAATTTGA
me1em2 TGAGTCCAAACCGGATA GACTGCGTACGAATTTGC
me2em3 TGAGTCCAAACCGGAGC GACTGCGTACGAATTGAC
me3em4 TGAGTCCAAACCGGAAT GACTGCGTACGAATTTGA
me4em1 TGAGTCCAAACCGGACC GACTGCGTACGAATTAAT
me1em4 TGAGTCCAAACCGGATA GACTGCGTACGAATTTGA -
me2em1 TGAGTCCAAACCGGAGC GACTGCGTACGAATTAAT -
me3em2 TGAGTCCAAACCGGAAT GACTGCGTACGAATTTGC -
me4em3 TGAGTCCAAACCGGACC GACTGCGTACGAATTGAC -
me1em3 TGAGTCCAAACCGGATA GACTGCGTACGAATTGAC -
me2em4 TGAGTCCAAACCGGAGC GACTGCGTACGAATTTGA -
me3em1 TGAGTCCAAACCGGAAT GACTGCGTACGAATTAAT -
me4em2 TGAGTCCAAACCGGACC GACTGCGTACGAATTTGC -
Sheet S2.1
R-code for simulation Roland Kölliker
June 4, 2015
##Simulation of dominant marker data for offspring of two tetraploid hetereozygous ##plants under cross- and self-fertilization ##Written by Roland Kölliker ([email protected]), 4.6.15 ##Arguments: ##nl=number of loci ##t.bal=proportion of zeros in parental genotype ##ncross=number of crossings ##nself1=number of selfings for parent1 ##nself2=number of selfings for parent2 ##nco=number of recombinations, ##maxco=max number of markers per co ffselfsim <- function(nl=200, t.bal=0.5, ncross=100, nself1=50, nself2=50, nco=1, maxco=nl/28, ...){

60
#Parental marker-phenotypes p1 <- sample(c(0,1), nl, replace=T, prob=c(t.bal, 1-t.bal)) p2 <- 1-p1 #parental genotypes pi1 <- NULL pi2 <- NULL #table with possible allele combinations (1,1,1,1 is not an option since this does #not segregate in the progeny) all <- as.matrix(expand.grid (rep(list(c(0,1)), 4))) #create index vector for (i in 1:nl){ pi1[i] <- ifelse(p1[i]==0,1, sample(2:16,1)) pi2[i] <- ifelse(p2[i]==0,1, sample(2:16,1)) } #create parental genotypes pa1 <- all[pi1,] pa2 <- all[pi2,] cbind(p1,pa1) cbind(p2,pa2) #function to create gametes with recombination #(t.x <- matrix(rep(c("A","B","C","D"), each=nl), ncol=4)) #test to see whether this works ffgam <- function(x) { t.g1 <- x[, sample(1:4,4)] tt.g1 <- t.g1 for (i in 1:nco){ anco1 <- sample(maxco,1) #number of markers concerned loco1 <- sample(1:(nl-anco1),1) #locatin of co anco2 <- sample(maxco,1) #number of markers concerned loco2 <- sample(1:(nl-anco2),1) #locatin of co tt.g1[loco1:(loco1+anco1),1] <- t.g1[loco1:(loco1+anco1),2] tt.g1[loco1:(loco1+anco1),2] <- t.g1[loco1:(loco1+anco1),1] tt.g1[loco2:(loco2+anco2),3] <- t.g1[loco2:(loco2+anco2),4] tt.g1[loco2:(loco2+anco2),4] <- t.g1[loco2:(loco2+anco2),3] ga1 <- cbind(tt.g1[,sample(1:2,1)], tt.g1[,sample(3:4,1)]) } return(ga1) } ##create genotypes of crossings for autopolyploids ntot <- ncross+nself1+nself2 d.prog <- matrix(nrow=ntot, ncol=nl) for (i in 1:ncross){

61
c.auto <- cbind(ffgam(pa1), ffgam(pa2)) d.prog[i,] <- apply(c.auto,1, function(x) ifelse(any(x==1),1,0)) } #selfings parent 1 for (i in (ncross+1):(ncross+nself1)){ c.auto <- cbind(ffgam(pa1), ffgam(pa1)) d.prog[i,] <- apply(c.auto,1, function(x) ifelse(any(x==1),1,0)) } #selfings parent2 for (i in (ncross+nself1+1):ntot){ c.auto <- cbind(ffgam(pa2), ffgam(pa2)) d.prog[i,] <- apply(c.auto,1, function(x) ifelse(any(x==1),1,0)) } d.prog <- data.frame(d.prog) rownames(d.prog) <- c(paste0("C",1:ncross), paste0("SA",(ncross+1):(ncross+nself1)), paste0("SB",(ncross+nself1+1):ntot)) head(d.prog) d.final <- rbind(p1, p2,d.prog) head(d.final) r.pca <- prcomp(d.final) plot(r.pca$x, pch=c(21,22,rep(23,ncross),rep(21,nself1), rep(22,nself2)), bg=c(2,3,rep(1,ncross), rep(2,nself1), rep(3,nself2)), cex=c(3,3,rep(1.3,ntot)), ...) } set.seed(1895) ffselfsim(main="Simulated data for 200 markers,\n 200 individuals and 50 selfings each", xlim=c(-8,8), ylim=c(-8,8))

62

63
Chapter 3 Characterization of novel SSR markers in
diverse sainfoin (Onobrychis viciifolia)
germplasm
Katharina Kempf, Marina Mora Ortiz, Lydia M.J. Smith, Roland
Kölliker, Leif Skøt
Published in BMC Genetics 2016, 17:124 doi:10.1186/s12863-016-0431-0

64
3.1 Abstract
Background: Sainfoin is a perennial forage legume with beneficial properties for
animal husbandry due to the presence of secondary metabolites. However,
worldwide cultivation of sainfoin is marginal due to the lack of varieties with
good agronomic performance, adapted to a broad range of environmental
conditions. Little is known about the genetics of sainfoin and only few genetic
markers are available to assist breeding and genetic investigations. The objective
of this study was to develop a set of SSR markers useful for genetic studies in
sainfoin and their characterization in diverse germplasm.
Methods: A set of 400 SSR primer combinations were tested for amplification and
their ability to detect polymorphisms in a set of 32 sainfoin individuals,
representing distinct varieties or landraces. Alleles were scored for presence or
absence and polymorphism information content of each SSR locus was calculated
with an adapted formula taking into account the tetraploid character of sainfoin.
Relationships among individuals were visualized using cluster and principal
components analysis
Results: Of the 400 primer combinations tested, 101 reliably detected
polymorphisms among the 32 sainfoin individuals. Among the 1154 alleles
amplified, 250 private alleles were observed. The number of alleles per locus
ranged from two to 24 with an average of 11.4 alleles. The average polymorphism
information content reached values of 0.14 to 0.36. The clustering of the 32
individuals suggested a separation into two groups depending on the origin of the
accessions.
Conclusions: The SSR markers characterized and tested in this study provide a
valuable tool to detect polymorphisms in sainfoin for future genetic studies and
breeding programs. As a proof of concept, we showed that these markers can be
used to separate sainfoin individuals based on their origin.

65
3.2 Introduction
Onobrychis viciifolia, commonly known as sainfoin, belongs to the tribe
Hedysareae and the family Fabaceae. It is a tetraploid (2n = 4x = 28) perennial
forage legume, rich in proteins and secondary plant metabolites. Its center of
origin is attributed to the Middle East and Central Asia. It was introduced into
Europe in the 15th century and was rapidly adopted by farmers due to its high
fodder value, especially for working horses (Koivisto and Lane 2001). Nowadays,
sainfoin is cultivated only in small areas for fodder production and on ecological
compensation areas. Its cultivation steadily declined since the 1950’s, due to the
expanding availability of inorganic fertilizers and the preference for higher
yielding legume crops such as alfalfa (Medicago sativa) or red clover (Trifolium
pratense, Burton and Curley 1970; Sheehy and Popple 1981; Frame et al. 1998).
In the last few years, however, sainfoin has gained renewed interest due to its
animal health promoting properties associated with the presence of condensed
tannins (CT) and other complex phytochemicals in the foliage. Benefits include
anthelminthic properties and prevention of potentially lethal bloat associated
with most other forage legumes (Marais et al. 2000; Min et al. 2003; Ramirez-
Restrepo 2005; Hoste et al. 2006; Mueller-Harvey 2006). In addition, sainfoin
shows a range of beneficial agronomic features. As a legume, it is able to fix
atmospheric nitrogen in root nodules by rhizobia, reducing the need for nitrogen
fertilizers (Goplen et al. 1991; Koivisto and Lane 2001). Furthermore, soil
fertility is improved by increased humus development through its deep rooting
capability and low input requirements once established (KÖL 2012). Used as a
component of permanent grassland, sainfoin is a valuable alternative for areas
suffering from intensification, as it increases soil fertility and has become a
popular addition to non-cropped environmental planting; sainfoin provides good
resources for native insects and high quality fodder for livestock (KÖL 2012).
Despite its advantages, a wide distribution of sainfoin is hampered by the often
poor agronomic performance and the lack of sainfoin varieties adapted to
different environmental conditions. The main weaknesses of sainfoin lie in its low
tolerance to waterlogging and frost as well as in its poor competitive ability in the
early stages of development. Therefore, targeted breeding activities are needed to

66
select for sainfoin individuals better adapted to a broad range of environmental
conditions. Breeding activities have also been impaired by the lack of knowledge
of the genetic diversity of the species and its mode of inheritance. Further
investigation and development of tools for marker assisted breeding has been
hampered by the limited availability of species-specific molecular markers. So
far, most studies have focused on the use of cross-amplifiable EST-SSRs, mainly
from Medicago and Glycine species; ITS markers based on nuclear internal
transcribed spacer regions and dominant SRAP markers (Demdoum et al. 2012;
Hayot Carbonero et al. 2012; Lewke Bandara et al. 2013; Kempf et al. 2015). The
use of co-dominant SSR markers developed in other species yielded only a low
number of alleles per locus in sainfoin (from five to seven in bulks of ten
individual plants, Demdoum et al. 2012). The development of highly informative,
specific markers for sainfoin is indispensable to create a genetic knowledge base
and assist breeding by marker assisted selection (MAS, Sorrells and Wilson
1997).
Simple Sequence Repeats (SSRs) or Microsatellites (Litt and Luty 1989) are
composed of tandemly repeated sections of DNA (Powell et al. 1996). SSR
markers show co-dominance of alleles and are randomly distributed along the
genome, particularly in low-copy regions (Morgante et al. 2002; Kumar et al.
2009). Considering the complex tetraploid sainfoin genome and the lack of
knowledge about its genetics, SSRs are the markers of choice. SSRs are multi-
allelic in contrast to next generation high-throughput sequencing (NGS) derived
SNP marker which are bi-allelic. This makes SSR markers highly variable and
useful for distinguishing even between closely related populations or varieties
(Smith and Devey 1994). Furthermore, SSR are easily detected using standard
PCR methods and are transferable to related taxa (Chen et al. 2015). The
development of NGS has recently enabled the identification of a large set of set of
SSR sequences from sainfoin (Mora Ortiz et al. 2016).
In this study, our aim was to develop and characterize a comprehensive set of
markers based on recently identified SSR sequences in a panel of 32 sainfoin
individuals of different origin (Mora Ortiz et al. 2016).

67
3.3 Material and Methods
3.3.1 Plant material
In order to include a large range of genetic diversity, we selected a set of 32
individual sainfoin plants from 29 different accessions (Table 3.1), originating
from a range of geographical regions and showing differences for tannin content
and composition (Demdoum et al. 2012; Hayot Carbonero et al. 2012; Lewke
Bandara et al. 2013; Malisch et al. 2015). These accessions were grown in the
glasshouse at NIAB (Cambridge, UK) and in the field at Agroscope (Zurich,
Switzerland). Young leaf material was collected from each single plant, ground in
liquid nitrogen and stored at -80°C until subsequent DNA extraction.
Table 3.1 Onobrychis viciifolia individuals used for marker characterization in this study.
Individual Variety Status Origin Source
ID_01 247 NA Morocco GRIN
ID_02 Buceanskij NA Romania GRIN
ID_03 CPI 63750 NA Turkey GRIN
ID_04 CPI 63764 wild Turkey GRIN
ID_05 CPI 63820 NA Spain GRIN
ID_06 CPI 63826 NA Spain GRIN
ID_07 NA / RCAT028437 NA Hungary GRIN
ID_08 Ökotyp Wiedlisbach ecotype Switzerland ISS
ID_09 Premier landrace Switzerland ISS
ID_10 Rees A cultivar UK GRIN
ID_11 TU86-43-03 cultivated Turkey GRIN
ID_12 Nova cultivar Canada GRIN
ID_13 Visnovsky cultivar Czech Republik ISS
ID_14 Perly cultivar Switzerland ISS
ID_15 Brunner landrace Austria ISS
ID_16 Perdix cultivar Switzerland ISS
ID_17 Cotswold Common cultivar UK RAU
ID_18 Perly cultivar Switzerland RAU
ID_19 Somborne cultivar UK RAU
ID_20 Ibaneti/ RCAT028292 NA Romania RCAH
ID_21 Bivolari/RCAT028294 cultivar Romania RCAH
ID_22 NA/170582 NA Hungary RCAH
ID_23 CPI 637554/ 192995 NA Turkey GRIN
ID_24 CPI 63767 / 212241 cultivar USA GRIN
68
ID_25 Na/228352 wild Iran GRIN
ID_26 CPI 63781/ 236486 NA Turkey GRIN
ID_27 Cholderton Hamshire Common cultivar UK GRIN
ID_28 Visnovsky cultivar Czech Republic GRIN
ID_29 Zeus cultivar Italy Cotswold Seeds Ltd
ID_30 Zeus cultivar Italy Cotswold Seeds Ltd
ID_31 Ambra cultivar Italy private
ID_32 Esparcette cultivar UK private
RAU: Royal Agricultural University, Gloucestershire, UK; RCAH: Research Centre for Agrobotany, Tápiószele; Hungary; GRIN:
Germplasm Resources Information Network, Washington, USA; ISS: Agroscope Institute for sustainability science, Zurich,
Switzerland
3.3.2 DNA extraction
DNA was extracted using the Nucleon Phytopure Genomic DNA extraction kit
(GE Healthcare, Little Chalfont Buckinghamshire, U.K.) following the
manufacturer’s instructions. This method has been shown to be suitable for
extraction of high quality DNA from Onobrychis viciifolia, in which high levels of
polyphenol and condensed tannins have been reported to interfere with a
successful DNA extraction using other approaches (Hayot Carbonero 2011). DNA
quality and quantity was assessed using gel electrophoresis and
spectrophotometry.
3.3.3 PCR and gel electrophoresis
A total of 400 SSR primers designed from Onobrychis viciifolia transcriptome
data (Mora-Ortiz et al. 2016), were tested with unlabeled primers for
amplification in the 32 plants using an iCyler (Biorad, Hercules, USA) in a
volume of 10 µL, with 10 ng DNA, 1 x Go Taqflexi buffer (Promega, Madison,
USA), 2.5 mM MgCl2 (Promega), 0.2 mM dNTPs (Promega), 0.2 µM forward
primer, 0.2 µM reverse primer and 0.5 U Polymerase G2 (Promega). The
conditions followed a touchdown PCR approach with 4 min at 94 °C, 12 cycles of
30 s at 66 °C with -1 °C decrease at each cycle plus 30 s at 72 °C, and 30 cycles of
30 s at 94 °C, 30 s at 54 °C plus 30 s at 72 °C, followed by 7 min at 72 °C. PCR
products were separated by gel electrophoresis. Amplicons were separated on 1%

69
agarose in 1x TBE buffer, stained with ethidium bromide and visualized under
UV light.
3.3.4 M13 PCR and capillary electrophoresis
Those 101 primer pairs that successfully amplified fragments in the 32
individuals (Table 3.2) were further characterized for polymorphisms using the
M13 (-21) tail primer genotyping protocol (Schuelke 2000). The PCR reactions
were conducted in an iCycler (Biorad) in a sample volume of 10 µL, each
containing 20 ng DNA template, 1x Go Taqflexi buffer (Promega), 1.5 mM MgCl2,
(Promega), 0.2 mM dNTPs (Promega), 0.16 µM forward primer carrying the M13-
tail, 0.04 µM reverse primer and 0.16 µM fluorescently labelled M13-primer, 0.5
U polymerase GoTaq G2 (Promega).
PCR conditions were 2 min at 94 °C, 30 cycles of 30 s at 94 °C, 45 s at 56 °C and
45 s at 72 °C, followed by 8 cycles of 30 s at 94 °C, 45 s at 53 °C and 45 s at 72 °C.
The final extension step was conducted at 72 °C for 10 minutes. An aliquot of 1 µl
of the PCR product was diluted in 10 μl HiDi™ formamide (Applied Biosystems®,
Thermo Fisher Scientific, Waltham, MA, USA) and 0.2 µl Rox 500™
oligonucleotide ‘size ladder’ (Applied Biosystems®) for capillary electrophoresis
on the Genetic Analyzer 3730 (Life Technologies, Carlsbad, CA). Alleles were
scored using the GeneMarker software (Softgenetics, V2.4.0 Inc., State College,
USA).

70
Table 3.2 SSR primer sequences used for amplification in 32 Onobrychis viciifolia individuals and
characteristics of SSR motifs
Marker Motif Repeats Predicted size Forward primer (5`-3`) Reverse primer (5`- 3`)
OVK002 AG 9 164 CCCACCAGACAAAAAGAATA GCTTTCCCCTTCATCAACTAT
OVK003 TA 8 122 GATAGAATTCGTTTGTTGGTG ATCTTTGTAACTGTTCGCTCA
OVK017 AC 8 158 GGGTGTTAGTTATCCATTTCC ACATACTAGCCTTCTGGGGTA
OVK027 CTCG 6 129 AATGGAATCTCGGAGACAG GGAAGAAGACGAAGTAGTAGGA
OVK034 GCT 6 150 GTGAGATGAGCTTGGACATT AGATAACTAACTGCAGGCAAG
OVK036 AGGT 6 150 GTGTTAAAGGGGTGAAAACAT CATTTTGACAAACCAGTATCC
OVK038 ATT 6 166 CCACATACGAGACAGAATAGG CTGAAAATTGATCGATACTGG
OVK042 GTT 6 144 GGAACGGTTAATTTCTGATTT AGAATTCCGTACAAGTCGAG
OVK045 AGA 6 148 CCAAAAATCATCAATCAACAC TTGAACAAGGGTTAGGGTTAT
OVK046 AGTG 6 151 TCAACCACATTATAAAACCTCA CGCGAAATCATAGTTCACTT
OVK054 GAA 6 201 TTGCAGAGATAACACTCACCT TCCTGAAAAACCTAATCACAA
OVK055 GAT 6 189 GAAGATATTTCAAAGCAGCAA CATGCTACCACTAGCAGAAGT
OVK063 TTG 6 188 AATTGCAACTGAAACTGAAAC ACTGCTACCCTCTCCATAAAT
OVK068 GGA 6 195 GACCACCCGCAGCTCAAC GTCTTCTTCCCCCATATTTAG
OVK072 ACC 7 199 TTGCCTTAGTCAGTTACCTTG GTGGAGAGAATGAGAGAACCT
OVK073 GAC 6 200 GTAGACAACCGTATCTGGACA AAGATGGAAGGTTCTAGTTCG
OVK077 TTA 6 249 GTCCCTCTCTCTCAAATTGTT AGGTTAATGGAGCTTAGTGGT
OVK089 CAT 6 257 CAAAGTCATACCAATCACCAT TCTTGGAAGCACTTGTTACTC
OVK093 CCA 6 259 CCAAGTGTTTGAAAGTCTCAG TGAGAGTTCGTTCAAGGTAGA
OVK094 TTGCG 5 255 ACCGATCTTAGGATAGATGGA ACTTTTGGTTGCTTAGTCGAT
OVK096 TCA 6 249 GAGCGTTGCATTTACATTTAC CATCCTCCTTTACACCCTAAT
OVK097 GTGA 6 252 TCTATAGAGATGAGGCGACAA CGCCCCTAACTAACCTACTAC
OVK099 TGAG 6 247 AGAAAATGGAAGCAACAGAGT ACAAATAGCAGCTCCCTTC
OVK101 CTAA 6 254 GTTGAGTTTCAGACACAGAGC AATAGCTCCCACAATAACTCC
OVK102 TGT 6 249 CCAAAGGGTGTTTTATTTTCT GGAAGAAATTAAGCAAATGGT
OVK107 AG 8 193 AAGTTAAAACTTTGCGTTGTG GACGTTGTTCTGGATTTCTTC
OVK111 GGT 7 206 TATAGACCTTCTCCTCCCAGA GTGAAAGTCACAAATCCAAAG
OVK119 CAG 6 199 ACCCTCCTTCTCTCCTTATTT GACGAGAGAACTCGTTTATGA
OVK122 TC 9 211 GCAGATAGCACAGTTATCGAC GAACCACACACACAGAATCA
OVK123 ACA 9 200 CACCCATTAACTATCATGGTC CAAGCCCTTTGTGAGATACTA
OVK124 TGA 9 211 GCCTTTTCTGTGACTCGTAA GCTCCATTCCCATTTATAGTT
OVK125 CATTT 5 193 AAATTTAAGCACCGGAATAAC AAAGCAAAAGGGCTACTAAAG
OVK126 TC 8 197 CGACAAAACTATTTAGGCAAA GGGAAGAGATCATAAACCCTA
OVK127 AT 8 200 GCCCAAAATGTATTATCCTTC AGAACAGACAGATATGCAAGC
OVK131 TA 8 200 TCTATCTGGGTGTTGTTTTGT CTGTTTGAATATCGATTACCAC
OVK133 TG 8 196 TGCTTCAGCATTATTGTAACAT TGCACTTCTCCATACTTCCTA
OVK138 CTAA 6 250 TAATATGGTGCAAGTTCCAAT TTCTACGCTTAGCTCAAACC
OVK141 CACG 6 239 GAGGAGGTACATACAGCACAG CAACCTCCTCGTTATCTTTTT
OVK142 GT 8 243 AACATGACTACTGTGAACAAGG CGAACATGTAATTGATCCAAG
OVK155 GTG 6 251 CAGGTTTGAAGTAGCAGAGAA GTAGACCACGCATACTGAATC

71
OVK158 GACT 6 257 TCAGAGTGTGTTGTGTTGTGT AGTGAAGCAAATGTGTGATTT
OVK159 TG 8 251 CATTATTGCCTAGCATTGTTC ATTTCACCATCAAGTATGCAC
OVK161 TTCC 6 249 AAAGCTTTCTACACGTTGGTA TGGGTTTTTACACTCTGTGAT
OVK165 ACA 6 267 TTTCAAACACTCACTCACTCC TCGGATTTGTGACCTAACTC
OVK168 TGA 6 253 AATTATCACCCACTGCTATGA GGTTTCCATCACTGTTTGTTA
OVK172 AGC 6 256 TTATTAAACCTGCGTCTTCTG GTAGAGCTGTGGGCTTTATCT
OVK173 CT 8 253 TCGTTCTCGTGATTATTCTGT CCTCTATTCAAATAGGGCAAT
OVK174 GGCCC 5 246 ACATGATCGTGAATATGAAGC CAGCAGCAATCAATATATCATC
OVK175 CA 9 250 GTAAAATATCAAGCAGGAGCA AAACTATGCAGACACCCTGTA
OVK177 CTG 7 257 TCTGTTGATTTAAGGAGACGA CTCTTGCTCATATTTTCCTCA
OVK181 AAG 6 257 AGGAAGAAGAAGAAGAAGCAG TTCTCCTTTAACCACAACCTT
OVK183 TGAT 6 256 GAGGGTAAGAGAGAGTGGAAG CTTGCCTGATATCTTCTCAAA
OVK196 AGC 6 286 TTTTGAGAGTGTGGAAGGTTA AGTATGAGCCTGATGATGATG
OVM003 TC 9 297 CCGTCTGTTTAATCATTCACT GAAAGGAAAGGTTATTGGAGA
OVM004 ATTT 5 290 GGGAATTCTTAAATCTCATGG ATGCATGGTACTGGGTCGT
OVM025 CAA 6 297 TTCTGAACAACAACAACAACA GTCCAGGAGCTAAGTAACCAT
OVM031 TGA 6 306 ATTGGTTTCTAAGGAGGACTG GCAATACTCCTCTGCCTAGTT
OVM033 CTC 6 300 CAAGGCTTATTTGGTTAACAG ATACTATTTCCCATGCCTACC
OVM034 TTC 6 308 GCATTTCATCAAACACTTTTC TTGGTTTGAATCTGTGAGACT
OVM035 TTC 7 303 TCATCAAACACTTTTCGTTCT TTGGTTTGAATCTGTGAGACT
OVM038 GAAG 6 297 CACAGGACAAGAGTGAGAGAG TCATGATACCACGAATTTTTC
OVM043 GAG 7 167 TAGTATGGCTGAAATCAAAGG ATATCATAAGGGCAACAGTGA
OVM048 AT 9 157 GACATTGAAATCAAACAATCC AACACTTGTCATGTTTCCAAG
OVM049 TGA 7 150 AACAAACAAGAGGAAAAGGAG TATGTGCTTATCAGGCATTTT
OVM050 ATCC 6 161 ATGAGCATGAAGAGTTTCAGA ACACATCTACGACTTCTTTCG
OVM053 GTGGA 5 149 CACCAAAAGCATAGCAATAGT GCTTGAATTGAATGAGAAATG
OVM057 TTG 6 153 CCTTGAGGAGGAATAATAGGA GACATCATCATCACCTTCACT
OVM058 AT 9 150 GTCAAGTCATACCCATACGAG CAGTGTAACCATATGCACAAA
OVM059 AGA 6 149 ACTCCAACTCCAACTCAGAAC AAGCGAAGAAGAGAGTGAGAT
OVM060 CT 8 159 ATGTAATCAAAAGGTGCAGAA AGCTTCCAAAACAGTGTATGA
OVM061 GTA 6 150 TTAACACACGTACGTACCACA TTTGTCGTTGATCGTTAAGTT
OVM062 AG 8 139 GGAAAAAGGTTTGGATAGATG AAGTTTTCCCCACACTATTCT
OVM064 AT 8 353 GCATGCACAGAATTAAGTTTC AGAAGGTCCTTTGAAAATCAG
OVM065 CT 8 352 AAGACAGCGAGTTACCAATCT GATTGAAACTGAGTAGCGATG
OVM067 CTT 6 352 CAACCTTAATACCAACCTTCC AAAAGTAGCCAGAGAGCAAAT
OVM068 CCT 6 333 CTACAACTCACCGAAACTCAC CGATTTCTGCCTCTTTATTCT
OVM069 AATG 6 357 ATGTTGTACAGATGAGCTTCG TAGTGAGCAAACCTATTTTGG
OVM072 GAA 6 350 TTGATGTGGTTGATCCTATTC GATGTCAACATCTTGGTCATTA
OVM073 ACA 6 346 GTTCTCAAACGCACTATCAAC AAAATCTTGTAGGGATTCGAT
OVM076 AAC 7 348 CCCATTCTTCATCTTTCTCTC TGCTTCCATAATCAGTGAAAT
OVM081 GT 9 350 TCTAGCACAATGTTTTGGATT TATTGAGTTGAAGCAGACCAT
OVM083 CT 8 347 CACACAAACACAAAACTCACA GATCGGAGAAAAGAAGAAGAG
OVM086 GAA 6 350 TCATACAAAGTTCCTTCCGTA ATTGCCAATAACAGTGAAGAG

72
OVM090 CCA 6 151 AATCAATGGAGGAGGATAAAC GAAGGTTGAAAAGGGAATAAA
OVM091 ATC 6 188 AACCACCCTTAATTCCATAAG AGATAAAAGCCGCAAAAGTAT
OVM092 CAC 6 157 GGACCAACAAAGAGGATTATT CCCTTGCTTGAAGTGTTACTA
OVM094 GTTT 5 163 ATTCATGGGGACAATAAATTC CAAGAGAATGAATGAATCAGC
OVM099 GA 9 149 TATGTATTGCAGAATCACAGC TATTACCCTTTTCCATCTTCC
OVM100 AAG 6 151 GAACTAGATTTGCGGCATT CCCACACCCTTATCCTTATTA
OVM110 AT 8 154 CTGGACGAAAACAACATATTC GTTGGCTTTGGTACTGACATA
OVM116 GAT 7 151 AACTACACGCACGTAATGAAT TGGTTTGATAAACACCTCAAG
OVM120 TTC 6 152 TTCAGTGTCACTTTCCTCATT AGAAGTTGTCATGTCAAGGAA
OVM122 TGG 6 156 ATGAATCTTGTACGGAATCTG GAAGAAAAAGCCATAAACACC
OVM125 AAATT 5 151 ATTCTTTCAACAAGCAAGTGA CTGCAATTCCATCCTATTTTA
OVM126 TCC 6 188 ACTAAGAACCACCCAAAACAT TGAGAAGATGGAGAAGATGTG
OVM128 TGTT 6 155 GAGAAGCATAACCAAAATCCT TGGAAGAAAAGAAACTTCTGA
OVM129 TG 8 133 AATTGGATTCATGTGTTAGGA GAAGTGGAGCCAAAACCT
OVM130 AG 9 154 GCAAATTATCACCATGCAC CGTGAAGAAAATCGGTACTTA
OVM131 AGA 6 153 GAAATAACGCAGGCAGATAC AATTAGAGGCTTCGACTTGTT
OVM132 GAC 6 142 ACGGTAATCAGTAGTGACAGC GTGTGACAGAAAATGGGATTA
OVM133 TTTC 5 171 TAGCATCAAGGTTGGAAATAG CTAGGCTACCTGAATCAAACA
3.3.5 Data analysis
All statistical analyses and calculations were performed using R statistical
software (R Core Team 2014). The polymorphism information content (PIC) of
SSR markers was calculated as the mean of the PIC of each allele, using the
formula for dominant markers from Roldan-Ruiz et al. (2000) as;
PICi = 2fi (1 - fi),
where PICi is the polymorphism information content of allele i and fi is the
frequency of occurrence of allele i (fragment present) in the 32 individuals. From
single alleles, average (PICAv), minimum (PICMin) and maximum (PICMax) PIC
values were calculated for each SSR marker.
In order to calculate genetic distance measures, SSR alleles were coded as
individual markers with 1 for presence and 0 for absence of the allele as binary
data. Pairwise genetic distances between individuals were calculated as modified
Rogers’ distance Dw (Wright 1978) which shows the extent of genetic diversity

73
between two individuals (Lee et al. 1989) ranging from 0 (no diversity between
individuals) and 1 (maximum diversity).
Genetic relationships were visualized using cluster analysis and the R-function
pvclust() (Suzuki and Shimodaira 2006) based on Euclidean distance that was
rescaled to Dw for plotting purposes (Dw and Euclidean distance show a linear
relationship, Fig. S3.1). Probability values (p-values) were calculated for each
cluster using multiscale bootstrap resampling (Shimodaira 2002, 2004) to
calculate approximately unbiased (AU) p-values (Efron 1979). The k-means
clustering algorithm (MacQueen 1967) was applied to the Dw values using a
sequence of k = 2 clusters to 32 clusters. The Calinsky criterion (Calinski and
Harabasz 1974) was then calculated for each number of k as implemented in the
R function cascadeKM() and the optimum number of clusters was determined at
the maximal value. Population structure was further investigated by principal
component analysis performed on binary raw data of individual alleles.
3.4 Results
3.4.1 SSR analysis
SSR markers showed a high degree of polymorphism and overall, 1154 alleles
were found with an average of 11.4 alleles per marker locus (Table 3.3). Among
those 1154 alleles, only five alleles (from SSR OVK042, OVK172, OVM031,
OVM072 and OVM100) were non-polymorphic, and hence, present in all
individuals studied.
With only two alleles in the 32 individuals, SSR OVK042 had the lowest number
of alleles, whereas OVK158 had the highest number with 24 amplified alleles.
The minimum rate of allele occurrence was 0.03125, corresponding to occurrence
in only one genotype (i.e. a private allele of an individual genotype). In total, 250
private alleles were detected and these were equally distributed across the
examined set of individuals and markers. With regard to individuals, the highest
number of private alleles over all markers was found for individual ID_08 (14
private alleles) and the lowest number was found for ID_17 (three private
alleles). The origin of the individual did not appear to affect the occurrence of

74
private alleles. With regard to markers, the most private alleles were observed in
OVM064 (eight private alleles), whereas 16 markers (15.8%) had no private
alleles at all.
The average polymorphism information content (PICAv) ranged from 0.14
(OVK141) to 0.36 (OVK101, Table 3.3). A detailed look at the PIC values of
individual alleles in the different markers exhibited minimum PIC values per
SSR (PICMin) between 0, (OVK042, OVK172, OVM031, OVM072, OVM100) and
0.17 (OVK131) and maximum PIC values per SSR (PICMax) between 0.3 (OVK
172) and 0.5 (16 different markers, Fig. S3.2).
Table 3.3 Characterization of the 101 polymorphic sainfoin markers. PICAv, PICMin and PICMax
give the average, minimum and maximum allele-wise polymorphism information content values,
NoATot the total number of alleles, NoAPriv the number of private alleles, MinAF the minimum
allele frequency and MaxAF the maximum allele frequency value
Marker PICAv PICMin PICMax NoA NoAPriv MinAF MaxAF Size
OVK002 0.22 0.06 0.47 9 3 0.03 0.63 154 - 175
OVK003 0.23 0.06 0.47 11 2 0.03 0.38 92 - 124
OVK017 0.22 0.06 0.50 19 5 0.03 0.47 148 - 184
OVK027 0.28 0.06 0.50 9 2 0.03 0.59 120 - 140
OVK034 0.27 0.06 0.49 12 1 0.03 0.56 138 - 154
OVK036 0.35 0.17 0.50 7 0 0.09 0.69 133 - 154
OVK038 0.19 0.06 0.40 14 4 0.03 0.28 155 - 186
OVK042 0.25 0.00 0.50 2 0 0.50 1.00 183 - 186
OVK045 0.29 0.12 0.43 6 0 0.09 0.94 138 - 148
OVK046 0.31 0.06 0.49 12 1 0.03 0.56 138 - 157
OVK054 0.29 0.12 0.49 15 0 0.06 0.44 274 - 290
OVK055 0.20 0.06 0.38 8 2 0.03 0.84 135 - 159
OVK063 0.24 0.06 0.50 13 2 0.03 0.72 179 - 200
OVK068 0.25 0.06 0.43 9 3 0.03 0.31 186 - 213
OVK072 0.32 0.12 0.50 4 0 0.06 0.81 193 - 198
OVK073 0.29 0.06 0.50 11 1 0.03 0.53 186 - 210
OVK077 0.23 0.06 0.45 9 2 0.03 0.78 233 - 264
OVK089 0.27 0.06 0.49 9 2 0.03 0.44 279 - 299
OVK093 0.23 0.06 0.50 14 6 0.03 0.56 234 - 271
OVK094 0.24 0.06 0.48 14 4 0.03 0.66 208 - 244
OVK096 0.21 0.06 0.48 20 6 0.03 0.41 215 - 294
OVK097 0.22 0.06 0.38 3 0 0.13 0.97 240 - 248
OVK099 0.25 0.06 0.49 13 2 0.03 0.75 232 - 270
OVK101 0.36 0.06 0.50 7 1 0.03 0.72 339 - 352

75
OVK102 0.23 0.06 0.34 4 1 0.03 0.22 239 - 251
OVK107 0.29 0.06 0.45 15 1 0.03 0.72 206 - 234
OVK111 0.26 0.06 0.48 7 2 0.03 0.75 213 - 232
OVK119 0.30 0.06 0.47 10 1 0.03 0.72 216 - 252
OVK122 0.24 0.06 0.45 8 1 0.03 0.66 330 - 341
OVK123 0.26 0.06 0.50 10 3 0.03 0.75 208 - 237
OVK124 0.26 0.06 0.49 15 1 0.03 0.44 218 - 267
OVK125 0.29 0.06 0.50 9 1 0.03 0.72 197 - 222
OVK126 0.25 0.06 0.49 15 3 0.03 0.56 198 - 233
OVK127 0.28 0.06 0.49 6 1 0.03 0.44 204 - 222
OVK131 0.17 0.06 0.48 15 3 0.03 0.59 183 - 228
OVK133 0.25 0.06 0.50 13 3 0.03 0.63 205 - 239
OVK138 0.21 0.06 0.49 13 6 0.03 0.56 232 - 267
OVK141 0.14 0.06 0.47 15 7 0.03 0.38 242 - 269
OVK142 0.25 0.06 0.50 12 3 0.03 0.47 256 - 285
OVK155 0.24 0.06 0.49 14 3 0.03 0.56 234 - 282
OVK158 0.19 0.06 0.40 24 6 0.03 0.28 273 - 375
OVK159 0.23 0.06 0.50 14 4 0.03 0.81 268 - 290
OVK161 0.25 0.06 0.40 12 1 0.03 0.28 220 - 276
OVK165 0.19 0.06 0.50 20 6 0.03 0.50 273 - 311
OVK168 0.24 0.06 0.50 11 3 0.03 0.81 258 - 284
OVK172 0.16 0.00 0.30 5 0 0.06 1.00 268 - 279
OVK173 0.23 0.06 0.48 18 5 0.03 0.59 268 - 316
OVK174 0.23 0.06 0.48 5 2 0.03 0.75 245 - 266
OVK175 0.19 0.06 0.38 10 2 0.03 0.88 252 - 267
OVK177 0.27 0.06 0.49 7 2 0.03 0.59 267 - 286
OVK181 0.19 0.06 0.38 19 4 0.03 0.25 343 - 381
OVK183 0.24 0.06 0.49 17 1 0.03 0.44 266 - 289
OVK196 0.21 0.06 0.50 8 2 0.03 0.53 297 - 314
OVM003 0.31 0.12 0.47 10 0 0.06 0.69 299 - 321
OVM004 0.21 0.06 0.45 18 6 0.03 0.34 380 - 426
OVM025 0.33 0.17 0.49 7 0 0.09 0.84 306 - 324
OVM031 0.26 0.00 0.50 13 1 0.03 1.00 292 - 353
OVM033 0.29 0.06 0.50 8 1 0.03 0.69 308 - 330
OVM034 0.22 0.06 0.50 17 5 0.03 0.53 307 - 355
OVM035 0.22 0.06 0.50 17 5 0.03 0.53 301 - 350
OVM038 0.19 0.06 0.43 14 4 0.03 0.31 311 - 351
OVM043 0.30 0.06 0.49 10 2 0.03 0.66 173 - 203
OVM048 0.29 0.12 0.43 6 0 0.06 0.72 174 - 186
OVM049 0.31 0.06 0.50 9 1 0.03 0.50 162 - 198
OVM050 0.20 0.06 0.49 13 6 0.03 0.72 168 - 198
OVM053 0.32 0.06 0.50 11 1 0.03 0.50 134 - 182
OVM057 0.35 0.17 0.49 5 0 0.09 0.66 165 - 180

76
OVM058 0.23 0.06 0.49 15 3 0.03 0.44 135 - 178
OVM059 0.24 0.06 0.48 7 2 0.03 0.59 156 - 174
OVM060 0.23 0.06 0.50 21 4 0.03 0.50 172 - 219
OVM061 0.19 0.06 0.50 10 4 0.03 0.84 143 - 175
OVM062 0.30 0.06 0.49 12 2 0.03 0.59 151 - 170
OVM064 0.16 0.06 0.47 16 8 0.03 0.38 380 - 444
OVM065 0.25 0.06 0.49 14 4 0.03 0.69 360 - 391
OVM067 0.33 0.17 0.49 6 0 0.09 0.66 366 - 380
OVM068 0.26 0.12 0.43 8 0 0.06 0.88 343 - 368
OVM069 0.26 0.06 0.48 13 2 0.03 0.59 454 - 479
OVM072 0.28 0.00 0.50 7 1 0.03 1.00 365 - 387
OVM073 0.20 0.06 0.45 21 5 0.03 0.34 446 - 511
OVM076 0.22 0.06 0.48 17 3 0.03 0.41 347 - 376
OVM081 0.18 0.06 0.40 17 5 0.03 0.28 353 - 396
OVM083 0.30 0.06 0.50 11 2 0.03 0.63 365 - 384
OVM086 0.32 0.06 0.50 10 1 0.03 0.63 371 - 391
OVM090 0.30 0.06 0.49 8 2 0.03 0.84 158 - 180
OVM091 0.34 0.06 0.50 8 1 0.03 0.47 184 - 217
OVM092 0.23 0.06 0.43 7 2 0.03 0.81 163 - 185
OVM094 0.33 0.12 0.50 7 0 0.06 0.81 190 - 207
OVM099 0.18 0.06 0.50 11 5 0.03 0.50 165 - 198
OVM100 0.24 0.00 0.48 5 0 0.09 1.00 163 - 179
OVM110 0.21 0.06 0.49 18 5 0.03 0.44 163 - 185
OVM116 0.28 0.06 0.49 15 2 0.03 0.56 138 - 204
OVM120 0.34 0.06 0.50 6 1 0.03 0.88 169 - 187
OVM122 0.31 0.06 0.50 4 1 0.03 0.91 164 - 180
OVM125 0.26 0.06 0.50 10 3 0.03 0.47 161 - 180
OVM126 0.22 0.06 0.50 18 4 0.03 0.53 191 - 229
OVM128 0.26 0.06 0.47 9 1 0.03 0.81 173 - 190
OVM129 0.25 0.06 0.49 14 4 0.03 0.56 146 - 173
OVM130 0.20 0.06 0.47 20 7 0.03 0.38 152 - 187
OVM131 0.34 0.06 0.50 8 2 0.03 0.56 159 - 198
OVM132 0.30 0.06 0.47 8 2 0.03 0.78 157 - 176
OVM133 0.20 0.06 0.47 14 3 0.03 0.63 177 - 212
The overall length of SSR fragments detected ranged from 91 to 511base pairs
(bp). Markers with two base pair motifs had a slightly higher number of repeats
(eight to nine) when compared to markers with three to five bp motifs (five to
seven repetitions). The total fragment length observed did not differ between
motif lengths (data not shown). Contrastingly, the number of alleles found for

77
SSRs with two bp motifs was higher (13.5 alleles on average), compared to SSRs
with longer motifs (10.7 alleles). The average number of alleles per sainfoin
genotype was 230.1 over all SSR markers, leading to an average of 2.3 alleles per
SSR marker and genotype. The lowest number of alleles was found for genotype
ID_25 with 191 alleles, the highest for ID_07 with 268 alleles.
3.4.2 Diversity of Onobrychis viciifolia individuals
The allocation of individuals to groups by overall similarity of alleles was
assessed using k-means partition comparisons. Those k-means statistic (Fig. 3.1,
left) give the grouping of individuals (assigned by different colors) dependent on
number of groups chosen. Individuals were assigned into two to ten groups, with
a more homogenous grouping for two and three groups. The Calinski criterion
(Fig. 3.1, right), giving the most likely grouping by the highest value reached,
indicated a grouping of individuals into two groups by a value >3.
Fig. 3.1 Group separation of individuals as assessed by k-means partitioning for k = 2 to 10 with
colors indicating different groups (left). The optimum number of groups (k) according to maximum
Calinski criterion was determined to be two (right).
The cluster dendrogram based on the modified Roger’s distance (Fig. 3.2) also
displayed a partitioning of individuals in two main groups, which were separated
by a modified Roger’s distance value of 0.47. Individuals belonging to the same

78
variety located in the same main branch for the varieties Perly (ID_14, ID_18;
0.4), Visnovsky (ID_13, ID_28; 0.39) and Zeus (ID_29, ID_30; 0.48). The variety
Perdix is an advanced variety originating from the variety Perly and the Perdix
genotype (ID_16) clusters closely to one of the Perly individuals (ID_14).
The first, smaller branch of the cluster (Fig. 3.2, right hand side) consisted
mainly of individuals originating from Switzerland and the U.K, whereas the
majority of the second, larger branch was comprised of individuals from Southern
and Eastern Europe as well as individuals from USA, Morocco and Canada.
However, AU values showed no significance (values <95) for most branches.
Fig. 3.2 Cluster Dendrogram of individuals based on the modified Rogers’ distance. Values at
branches are AU p-values (blue). Different colors of genotype labels give the affiliation to the two
groups determined by k-means partitioning.
Principal component analysis (PCA; Fig. 3.3) showed a pattern comparable to
that observed from cluster analysis with individuals of the two main clusters
mainly being separated by the first principal component which explained 10.3%
of the total marker variation. The second principal component illustrates the
intragroup variation with 4.9%.

79
Fig. 3.3 Principal component analysis of 32 sainfoin (Onobrychis viciifolia) individuals based on
1054 alleles of 101 SSR markers. Different colors give the affiliation to the two groups as
determined by k-means partitioning.
3.5 Discussion
The 101 SSR markers newly developed from sainfoin revealed a high degree of
polymorphism. In addition to differences in multiples of the repeat motif, we also
found alleles differing by fractions of the multiple motif length. Such variations
could have arisen from insertions, deletions and translocations in the flanking
region of the SSR (Robinson et al. 2013). Such mutations in the flanking region
might also contribute to the high degree of polymorphism in our marker data set.
The SSR sizes predicted through sequencing and the actual size distribution
observed in the 32 individuals was consistent for most of the markers.
Discrepancies can largely be explained by the fact that SSR motifs were
developed from individuals not represented in the present study. In total, we
found 1154 alleles at 101 loci resulting in 11.4 amplified alleles per SSR on
average. This is twice the amount found by Demdoum et al. (2012), who found
5.83 alleles by transferring markers from barrel clover (Medicago truncatula) and

80
soybean (Glycine max) to sainfoin. Fragments were smaller for the specific
marker set in this study (92 to 511 bp) compared to markers adopted from other
species (79 to 865 bp, Demdoum et al. 2012). The larger sizes of alleles from
cross-species amplification could be attributed to interspecific differences to the
donor species due to repeat length variation within the SSR region and indels in
the flanking region (Peakall et al. 1998). Avci (2014) amplified 725 alleles from 18
SSR markers in diverse Onobrychis subspecies using markers from pea and
barrel clover. The higher number found by these authors could be explained by
the larger diversity of germplasm used, which originated from different
subspecies.
SSR marker studies with other tetraploid species using diverse panels of
individuals showed lower numbers of alleles per marker compared to the present
study, e.g., 7.2 alleles in sugar cane (Saccharum officinarum, Pinto et al. 2006),
6.7 alleles in switchgrass (Panicum virgatum, Narasimhamoorthy et al. 2008)
and 6 alleles in peanut (Arachis hypogaea, Hopkins et al. 1999).
A few markers were observed with less than five alleles among the 32
individuals. These may still be useful in future studies, since this study
represents an initial screening of single individuals and not an extensive
population survey. Additionally, using only the most polymorphic markers would
bias the overall genetic diversity e.g. in conservation studies (Vali et al. 2008).
The challenge in analyzing SSR alleles in tetraploids lies in determining the
dosage of each allele, which is often impossible using capillary electrophoresis for
individuals carrying less than four different alleles at a specific marker locus.
The PIC content gives an estimation of the information content of a marker and
is traditionally calculated by the formula of Botstein et al. (1980). This was
developed for diploid species, for which the allele frequency is either known or
can be inferred from the allele occurrence (presence/absence). For tetraploid
species, the allele frequency is difficult to derive from the allele occurrence due to
different allele doses (one to four alleles). Hence, the formula for diploids could
not be used for tetraploid sainfoin. Thus, the PIC was calculated separately for
each allele, on the basis of allele occurrence counts, using a formula adopted from
Roldan-Ruiz (2000) and averaging the PIC across all loci of one locus (Tehrani et
al. 2008). Here, the maximum value that can be reached is 0.5, which

81
corresponds to alleles found in 50% of the population. Small values, on the other
hand, correspond to very abundant or to very rare alleles. Deciding whether a
SSR marker is useful also depends upon the scientific issue. Taking into account
different allele-based PIC values of an SSR locus (Fig. S3.2), therefore, gives the
most holistic picture of the SSR marker. High PIC values of alleles (0.5 – 0.4) are
useful for inside population studies, e.g., to trace marker trait associations,
whereas low PIC values (0.0 – 0.1) of single alleles could be more useful for
studies of evolution or genetic drift (Silvertown and Doust 1993). The average
PIC values in this study indicated that most markers had alleles which could be
found in a group of individuals and are suitable for several approaches in future
studies. These PIC values were comparable to those found by Tehrani et al.
(2008), which were between 0.16 and 0.44 in Lolium persicum. The large number
of private alleles is a clear indication of genetic distinctness of the individuals,
which was anticipated in view of their diverse origins.
Genetic diversity is a prerequisite for selection in variety development. So far,
there is limited information on the genetic diversity of sainfoin available. Use of
AFLPs and SSR markers from other species were not able to reveal genetic
diversity in distinct Spanish sainfoin accessions (Sardaro et al. 2003; Demdoum
et al. 2012). The values of that study, given by Nei`s similarity values, which
represent the proportion of shared fragments on the basis of binary data and
corrected by the marker number (Lamboy 1994), reached values of 0.73 to 0.8
(Sardaro et al. 2003; Demdoum et al. 2012). A conversion of those values to
genetic distance values by the formula –ln (Nei`s similarity values, Frankham et
al. 2010) resulted in Nei`s genetic distance values of 0.31 and 0.22. In a study of
sainfoin genetic diversity using RAPD markers in ten landraces from East
Azerbaijan and in 36 Iranian sainfoin populations, Nei`s genetic distance values
of 0.32 and 0.25, respectively, were observed (Rasouli et al. 2013; Hejrankesh et
al. 2014). In our study, highest modified Roger`s distance of 0.48 corresponds to
alleles not shared between our two cluster groups, which is almost 50% (Fig. 3.2).
The smallest Roger`s distance values with 0.35, corresponds to an approximate
Nei`s distance value of 0.43 (Fig. S3.1), which is higher than the low values
observed in other studies (Sardaro et al. 2003; Demdoum et al. 2012; Hejrankesh
et al. 2014). The majority of among-genotype comparisons showed higher values.

82
The higher values of genetic diversity found in the present study may reflect the
high variability of the markers developed and the selection of 32 individuals of
contrasting origin. Despite the fact that individuals of the same cultivars in this
predominantly outbreeding species can show considerable variability (Posselt
2010), the individuals from the same cultivar grouped clearly together in the
present study (Fig. 3.2 and 3.3, Table 3.1).
The 32 individuals investigated separated into two clear groups based on
different multivariate analyses. The first main group comprised mainly
individuals from Switzerland and the U.K., whereas the second group contained
individuals originating from South and East Europe as well as USA, Canada and
Morocco. A similar grouping of accessions could be found in earlier studies
between sainfoin accessions from Western Europe and those from Eastern
Europe and Asia (Demdoum et al. 2012; Hayot Carbonero et al. 2012). This clear
genetic distinction between the individuals from Western Europe and those from
Eastern Europe and beyond could reflect adaptation to diverse climatic
conditions either naturally or as a result of local selection by growers (Silvertown
and Doust 1993). Under genetic isolation and limited gene exchange,
differentiation in the sainfoin germplasm with accompanied morphological
separation seems likely (Zarrabian et al. 2013).
3.6 Conclusions
This study reports the first characterization of specific co-dominant SSR markers
for sainfoin. The 101 SSR markers characterized in this study showed a high
degree of polymorphism and clearly demonstrated the differences between
sainfoin individuals with diverse origin, on a molecular genetic level. The genetic
differences found in our panel separated the individuals into two groups, with a
clear correlation to the geographical origin of those individuals. SSR markers,
such as those characterized here, will be very useful in future genetic analyses,
such as paternity or pedigree analysis in breeding programs, as well as more
detailed analysis of genetic diversity in this forage crop. Furthermore, the

83
development of new varieties could be crucially improved by choosing distinct
genepools and minimizing inbreeding depression.
3.7 Acknowledgements
The authors thank the European Commission for funding this research (Marie
Curie Initial Training Network, ‘LegumePlus’, PITN-GA-2011-289377).
3.8 Authors’ contributions
KK and MMO contributed equally to the publication. KK and MMO contributed
to the experimental design performed all analyses and lead the writing of the
manuscript. LMJS assisted in data collection, variety choice, structuring the
work program and helped to draft the manuscript. RK and LS conceived the
study and assisted with data collection, data analysis and drafting the
manuscript. All authors read and approved the final version of the manuscript.

84
3.9 Supplementary Information
Figure S3.1 Relationship between modified Roger’s Distance to Euclidian Distance and to Nei’s
Distance.

85
Fig
ure
S3.2
Poly
morp
his
m I
nfo
rmati
on
Con
ten
t (P
IC)
valu
es f
or
ind
ivid
ual
all
ele
s a
t S
SR
loci
. D
iffe
ren
t gre
y l
evels
are
use
d f
or
bett
er
vis
ual
dif
fere
nti
ati
on
am
on
g a
llele
s of
the d
iffe
ren
t S
SR
mark
ers
.

86

87
Chapter 4 Marker- trait association analysis for
agronomic and compositional traits in sainfoin
(Onobrychis viciifolia)
Katharina Kempf, Carsten S. Malisch, Christoph Grieder, Franco
Widmer, Roland Kölliker
Published in Genetics and Molecular Research
2017, 16 (1), doi:10.4238/gmr16019483

88
4.1 Abstract
Sainfoin (Onobrychis viciifolia) is a perennial forage legume with great potential
for use in sustainable agriculture due to its low input requirements, good drought
tolerance, and production of forage rich in polyphenolic compounds, which are
beneficial for animal health. However, its distribution and cultivation are limited
due to its moderate agronomic performance and a general lack of well adapted,
highly yielding cultivars. Faster progress in breeding is imperative, but is often
hampered by the complex inheritance of traits and limited knowledge on the
genetic composition of this tetraploid, outbreeding species. Molecular genetic
tools might aid phenotypic selection; however, to date no information on marker-
trait associations is available for sainfoin. Hence, the goal of the present study
was to detect marker-trait associations in a biparental F1 population. Single
plants were screened for recently developed genetic markers and phenotyped for
important agronomic traits and concentrations of different polyphenolic
compounds. Significant trait-associated markers (TAM) were detected for plant
height (11), plant vigor (1), and seed yield (7). These three traits were positively
correlated with each other and shared some TAMs. Correlations among markers
suggested that two independent loci control these three vigor-related traits. One
additional, independent TAM was detected for the share of prodelphinidins in
total condensed tannins. Our results provide insight into the genetic control of
important traits of sainfoin, and the TAMs reported here could assist selection in
combination with phenotypic assessment.

89
4.2 Introduction
The perennial, tetraploid legume sainfoin (Onobrychis viciifolia) has a long
tradition as a valued forage source for working horses and other farm animals in
Europe. With the cultivation of more productive species, application of inorganic
fertilizers and the use of automated harvest systems, its cultivation decreased
during the 20th century. Consequently, sainfoin has almost disappeared from
current agricultural landscapes. However, the recently increased interest in more
sustainable agricultural production makes this crop a valuable alternative for
various reasons. First, sainfoin shows high tolerance to drought and low nutrient
availability (Doyle et al., 1984), making it a valuable option for less favorable
sites, which are expected to increase due to larger climatic variability
accompanying climate change. Second, it is capable of fixing atmospheric
nitrogen via association with rhizobia, reducing the need for nitrogen fertilization
and improving soil quality (Hill, 1980). Third, as its most prominent feature,
sainfoin contains a high concentration of beneficial secondary metabolites such as
condensed tannins (CT, proanthocyanidins) and other polyphenolic compounds,
which have anthelmintic properties against gut parasites, increase protein
utilization, prevent bloating, and reduce methane emissions (McMahon et al.,
2000; Hoste et al., 2012). Hence, sainfoin has the potential to be a valuable
ruminant feed.
However, despite its advantages, the wide cultivation of sainfoin is hampered by
its often poor agronomic performance and the limited availability of varieties
adapted to temperate climates (Goplen et al., 1991). Major agronomic weaknesses
also include poor competitive ability against weeds or companion species, slow
establishment, low seed set, and weak persistence. Persistence is a complex trait
that depends on several factors, of which plant vigor (strong and healthy growth)
is a major determinant. In addition to plant vigor, plant height, leaf area, disease
resistance, and seed production are also indicators for strength and capacity to
survive and, consequently, to persist. Breeding improved varieties with regard to
these agronomic traits is indispensable to increase farmers’ acceptance of
sainfoin and to promote its cultivation. Furthermore, targeted breeding for
desired composition and concentrations of CT and other polyphenolic compounds

90
in sainfoin is also desirable, because nutraceutical properties are consistent with
the demands for future plant breeding to assist animal welfare and health
(Humphreys, 2005).
Sainfoin breeders have to contend with an allogamous (outbreeding) reproduction
system, as is common in most forage species, and is often secured through self-
incompatibility mechanisms (Humphreys, 2000; Posselt, 2010). Hence, under the
absence of efficient methods to induce self-fertilization or perform controlled
crosses between inbred individuals, varieties are classically bred as open
pollinated varieties or synthetics. Starting from selection of superior plants
within a base population, this process of developing a new variety takes at least
ten years (Posselt, 2010). The resultant varieties exhibit high levels of genetic
diversity, evoking a generally broad environmental adaptability. For sainfoin
breeding, this large diversity presents an opportunity to select for superior
genotypes improved for important traits such as persistence, seed yield and
concentrations of CT, and other polyphenolic compounds (flavonols and their
glycosides).
To date, information on the response of sainfoin to phenotypic selection and
inheritance patterns of traits is scarce. Additionally, measuring complex traits,
such as CT concentration and composition, is both complex and labor intensive
(Engström et al., 2014). In addition, determination of seed yield and plant vigor is
labor intensive and usually requires field experiments over several years.
Indirect selection can accelerate breeding, and can be performed using traits that
are easily determined and correlated with the target trait, or via genetic markers
linked to the trait of interest (marker assisted selection [MAS]). The basic
prerequisite for MAS is the availability of markers that are tightly linked to
genes or quantitative trait loci (QTL). Such markers could be used to select for
traits that are difficult to measure or dependent on the developmental stage, to
maintain recessive alleles, to pyramid monogenic traits, and to speed up the
breeding progress in general. In the case of polyploid species and traits subject to
polygenic inheritance, both factors impede the efficient selection of genotypes
based on their phenotype, and application of MAS would be especially valuable
(Barrett et al., 2009). Detection of potential QTLs in sainfoin would, therefore, be
particularly promising to improve breeding progress.
91
In other forage plant species, several QTLs suitable for MAS have been
identified, such as those for vigor and seed yield in white clover (Trifolium
repens; Faville et al., 2003), seed yield in red clover (T. pratense; Herrmann et
al., 2006), or height and regrowth in alfalfa (Medicago sativa; Robins et al., 2007).
In sainfoin, adequate numbers of markers are not yet available and,
consequently, no studies have been performed to detect marker-trait associations
or QTLs. Marker systems that do not rely on prior DNA sequence information
offer a valuable approach for the initial characterization of minor species that
generally lack available sequence information. Sequence-related amplified
polymorphism (SRAP), which preferentially amplify in gene rich regions (Li and
Quiros, 2001), have been successfully used for the molecular investigation of
allogamy and autogamy in sainfoin (Kempf et al., 2015). Recently, RNA
transcriptome sequencing, using next generation sequencing, has been
successfully used to develop comprehensive simple sequence repeats (SSR)
marker resources that can be applied to assess genetic diversity in sainfoin
(Kempf et al., 2016; Mora-Ortiz et al., 2016). In order to use these newly
developed marker resources to identify possible marker trait associations in
sainfoin, the objectives of the present study were to (i) phenotype a biparental F1
population of sainfoin for a wide range of traits under field conditions, (ii)
investigate correlations among agronomic and compositional traits, and (iii)
identify dominant SRAP and co-dominant SSR markers associated with
phenotypic traits. Hence, the present study provides a first step towards MAS in
sainfoin.

92
4.3 Material and Methods
4.3.1 Plant material
The plant material used in the present study consisted of a F1 population (n=122)
from a biparental cross between two plants of the varieties Brunner (parent 1;
Agroscope, Zurich, Switzerland) and Perdix (parent 2, Agroscope, Nyon,
Switzerland), and the first generation of plants resulting from self-fertilization
(S1 progenies) of the two parents (n=85 for parent 1, n=30 for parent 2). Crossings
(F1 progenies) and selfings (S1 progenies) have previously been identified using
SSR and SRAP markers (Kempf et al. 2015). The plant material was established
in January 2012 by placing two sets of five clones of each parent in a greenhouse
chamber for bumble bee pollinations (Bombus terrestris, “Bombus Maxi
Hummeln”, Andermatt Biocontrol, Switzerland). Seeds were harvested
separately for each parent. Plants from pre-germinated seeds were then kept in
the greenhouse for two months before being transplant as juvenile plants to the
field site (Delley, Fribourg, Switzerland) in July 2012. All plants were randomly
planted into rows of 10 plants, arranged in two rectangular blocks.
4.3.2 Phenotyping
Plants were grown in the field from 2012 to 2014, chemical composition was
determined in 2012, and phenotyping of agronomic traits was performed in 2013.
Due to a large loss of plants during the winter following the 2013 season, no
phenotyping could be performed in 2014. Plant height was determined as the
distance from the soil to the last leaflets of stretched plants in spring (HSp) and
summer (HSu). Plant vigor (Vigor) was scored visually on a scale from 1 (very
weak) to 9 (very strong). Susceptibility to rust disease (caused by Uromyces
onobrychidis) was also visually scored on a scale from 1 (non-susceptible, no
disease occurrence) to 9 (highly susceptible, high disease occurrence). Flowering
time (FT) was recorded as the number of days after May 1st, when a plant
showed three or more open flowers. Seed yield was measured as the total number
of seeds per plant in 2013 (SN), as described by Kempf et al. (2015).

93
In spring 2013, the chlorophyll content of leaves was measured non-destructively
using a SPAD chlorophyll meter (Konica Minolta SPAD 502Plus, Tokyo, Japan).
This device measures the transmittance of the leaf in the red and infrared
regions reporting a unit-less index, which correlates with the relative quantity of
chlorophyll in the leaf tissue (Castelli et al., 1996). SPAD values (SPAD) were
recorded on the uppermost fully developed leaf of each single plant, calculating
the average of three measurements taken on three different leaflets outside the
middle lamella. After taking SPAD measurements, the respective leaves were cut
and their area (LA, cm2) and length (LL, cm) were determined photographically:
leaves were laid planar on a white paper and photographed with a full-frame (21
megapixel) digital single-lens reflex (DSLR) camera (EOS 5D MkII, Canon Inc.,
Tokyo, Japan), which was converted to a three-band vegetative stress camera
(LDP LLD, Carlstadt, NJ, USA, www.maxmax.com), reporting normalized
difference vegetation index (NDVI) values. On the basis of NDVI values, the
image was separated into plant (high NDVI) and background (low NDVI) pixels,
using a custom script within the R-environment (R Development Core Team,
2014).
For chemical analysis, plant material (10 fully developed leafs per plant) was
sampled in 2012 and immediately freeze dried. The concentrations of
prodelphinidins and procyanidins, the flavonols quercetin, kaempferol, and
myricetin (including their glycosides), as well as the polyphenolic acids quinic
acid and gallic acid, were analyzed using ultra-performance liquid
chromatography tandem mass spectrometry (UPLC-MS/MS). The analysis was
performed on an Acquity UPLC system (Waters Corp., Milford, MA, USA)
coupled with a Xevo TQ triple-quadrupole mass spectrometer (Waters Corp.,
Milford, MA, USA) according to the methods described by Engström et al. (2014).
The concentration of total CTs was calculated as the sum of the concentrations of
its sub constituents, prodelphinidins and procyanidins. The share of
prodelphinidins in the total CT (PD-share) was calculated by dividing the
concentration of prodelphinidins by the concentration of total CT.

94
4.3.3 Genotyping
A subsample of the plant material used for chemical analysis was taken for DNA
analysis. The dried leaves were ground using a ball mill (Cell tissue Analyzer 2,
Qiagen, Hilden, Germany). DNA was extracted with the illustraTM DNA
Extraction Kit PHYTOPURE (GE Healthcare, Little Chalfont Buckinghamshire,
United Kingdom) according to the manufacturer instructions. DNA concentration
was measured by gel electrophoresis with a mass standard (High DNA Mass
Ladder, InvitrogenTM, Life Technologies, Carlsbad, USA). For genotyping, SRAP
markers and SSR markers were employed. For the SRAP marker system, four
fluorescently labeled forward [me1 to me4] and reverse [em1 to em4] primers
were applied in 16 combinations in all plants, while sainfoin specific primers
(Mora-Ortiz et al., 2016) were used for SSR analysis (Table S4.1). PCR and
fragment analysis were performed as described in Kempf et al. (2015) using an
iCycler (Biorad, Hercules, USA) and an ABI 3500 Genetic Analyzer (Applied
Biosystems, Forster City, USA). Allele counts for the SRAP markers were those
used previously to analyze self-fertilization (Kempf et al., 2015), and the
approach of counting alleles present in one parent and absent in the other was
followed. SSR marker data was analyzed de novo.
4.3.4 Statistical analysis
Trait-associated markers (TAM) were detected by marker regression within
crossings and selfings of parent 2 (due to the low number of plants [N = 30],
selfings of parent 1 were omitted from the analysis). For the analysis, all SRAP
and SSR alleles were coded based on their presence (1) or absence (0). P values of
marker-trait correlations were obtained with one degree of freedom score test as
implemented in the mmscore function of R-package GenABEL (Aulchenko et al.,
2007; Chen and Abecasis, 2007). To correct for multiple testing effects,
Benjamini-Hochberg q-values were calculated based on the P values obtained
using the function qvaluebh95 to obtain significance values for markers at a false
discovery rate of 5%. Additionally, population structure within crossings and
selfings was investigated. For this, pairwise genetic distances between
individuals were calculated based on all marker alleles using the modified
Rogers’ distance Dw (Wright, 1978), which shows the extent of genetic diversity

95
between two plants (Lee et al., 1989), ranging from 0 to 1. Principal coordinate
(PCO) analysis was then performed on Dw values using the R function cmdscale
(R Development Core Team, 2014). PCO analysis indicated the presence of
certain unexpected population structures in crossings (Figure 4.1a), which
demanded a correction during marker regression. For this, the kinship matrix
was calculated (only for crosses) as the proportion of shared alleles among plants
(Eding and Meuwissen, 2001) using the R function ibs and was considered as a
variance-covariance matrix to correct for random genotypic effects, using the
maximum likelihood implementation in the polygenic function of the GenABEL
package. No population structure was visible in neither selfing group (Figure
4.1b, c). Therefore, kinship was not corrected for during marker regression in
selfings of parent 2.
Fig. 4.1 Principal coordinate analysis for a) 122 F1 progenies derived from a cross between parent
1 and parent 2, b) 30 S1 progenies of parent 1, and c) 85 S1 progenies of parent 2, based on 170
SRAP and 208 SSR marker alleles
For traits with significant TAM, a one-way ANOVA was performed to determine
the proportion of explained variance and the effect of the TAM (difference
between plants showing the presence and absence of the respective TAM).
Correlations among phenotypic traits were calculated as Pearson’s correlation
coefficients. All statistical analyses and calculations were performed within the
R-environment (R Development Core Team, 2014).

96
4.4 Results
4.4.1 Large variation in agronomic traits
All agronomical traits showed clear segregation among the crossings (F1
progenies), with observed values following a nearly normal distribution except for
number of seeds (SN), which was positively skewed due to a large number of
plants having less than 500 seeds per plant (Figure 4.2). Therefore, a logarithmic
transformation was applied to SN (ln[SN]) when testing for TAM. To a lesser
extent, rust susceptibility also deviated from normal distribution, caused by
many plants showing a low rust susceptibility (score = 2). SN per plant ranged
from 0 to 4608 and large variation was also observed for vigor-related traits such
as Vigor, HSu, LA, and LL (Figure 4.2, Table 4.1). The difference between the
earliest and latest flowering plant, as assessed by FT, was 46 days. For
agronomic traits, the observed ranges of values were comparable between crosses
and selfings except for SN, where selfings (mean/max value of 316/1114 in
selfings of parent 1 and 447/1483 in selfings of parent 2) showed largely reduced
seed numbers per plant compared to crosses (mean/max values of 1265/4608;
Figure S4.1, S4.2).

97
Fig. 4.2 Frequency distribution of agronomic traits and concentration of phenolic compounds in
122 F1 progenies derived from a cross between parent 1 and parent 2. For abbreviations of traits
see Table 4.1.

98
Table 4.1 Minimum, mean, and maximum observed value as well as standard deviation (SD) and
number of plants with observations (# Ind) of agronomical and compositional traits examined in
F1 progenies derived from of a cross between parent 1 and parent 2. The number of SRAP and
SSR markers showing significant association to the traits are indicated. Agronomical traits are
time of flowering (FT), plant height in spring and summer (HSp, HSu), plant vigor (Vigor), seed
number per plant (SN), leaf area and length (LA, LL), SPAD and susceptibility to rust diseases
(Rust), all the traits being assessed in 2013 season. Among compositional traits, CT gives the
total concentration of condensed tannins and PD-share the share of prodelphinidines on total CT.
Range of observed values # sig Marker
Trait Min Mean Max SD # Ind SRAP SSR
FT (days of May) 19 41.9 65 9.5 116 0 0
HSp (cm) 8.0 14.9 24.5 3.8 118 0 0
HSu (cm) 46 86.6 129 18.4 118 5 6
Vigor 1.0 6.7 9.0 1.7 118 0 1
SN 0 1265 4608 1254 118 1 6
LA (cm2) 3.6 12.7 31.8 5.5 112 0 0
LL (cm) 3.8 10.8 16.8 2.3 112 0 0
SPAD 33 46.4 57.1 4.7 117 0 0
Rust 0.0 2.6 7.0 1.7 111 0 0
CT (mg/g) 9.7 27.0 47.2 7.0 122 0 0
PD-share 0.76 0.86 0.93 0.04 122 1 0
Quercetin (mg/g) 5.8 12.1 32.1 4.4 122 0 0
Kaempferol (mg/g) 0.25 1.8 5.59 0.86 122 0 0
Myricetin (mg/g) 0.3 1.15 4.3 0.54 122 0 0
Quinic acid (mg/g) 0.1 3.8 10.2 2.0 122 0 0
Gallic acid (mg/g) 0.09 0.16 0.33 0.05 122 0 0
4.4.2 Quantity and quality of condensed tannin varies among
plants
Concentrations of polyphenolic compounds observed for crossings also showed a
clear segregation, and were close to the normal distribution (Figure 4.2). For CT,
concentrations ranged from 9.7 to 47.2 mg/g plant material, with a mean value of
27.0 mg/g, while the PD-share ranged from 0.76 to 0.93. (Table 4.1).
Concentrations of polyphenolic compounds were also assessed in the parental
plants, whereby parent 1 (Brunner) showed a CT concentration of 22.3 mg/g with
PD-share of 0.88, while the corresponding values for parent 2 (Perdix) were 17.2
mg/g and 0.83, respectively (data not shown). The observed differences in the
concentrations of polyphenolic compounds between crossings of parent 1 and
parent 2 were also reflected by their respective selfings (Figure S4.1 and S4.2).

99
For all compounds except for quercetin, where the difference in the concentration
between parents was low, selfings of the parent with the higher concentration
also showed increased values compared to selfings of the parent with the lower
concentration (data not shown). Apart from that, the range of the compositional
traits was comparable between selfings and crosses.
4.4.3 Strong correlations among vigor related traits
Among agronomical traits, significant, positive correlations were observed among
Vigor, HSp, HSu, and SN, with the correlation being strongest between HSp and
HSu, (r = 0.76) and weakest between Vigor and HSp (r = 0.59; Table 4.2). These
vigor-related traits were also positively correlated to LA and LL, but to a lower
extent. FT was most strongly correlation with ln(SN) (r =-0.34), with later
flowering plants exhibiting a lower seed yield.
Table 4.2 Phenotypic correlations among agronomical traits in 122 crossings (F1 progenies)
derived from a cross between parent 1 and parent 2. For abbreviation of traits see Table 4.1.
Correlated trait
Trait HSp HSu FT ln(SN) Rust SPAD LA LL
Vigor 0.59** 0.62** -0.23* 0.75** 0.18 0.26** 0.26** 0.18
HSp
0.76** -0.15 0.47** 0.09 0.36** 0.28** 0.22*
Hsu
-0.02 0.61** 0.10 0.47** 0.25** 0.20*
FT
-0.34** 0.08 -0.09 0.20* 0.29**
ln(SN)
0.30** 0.22* 0.20* 0.14
Rust
0.14 0.23* 0.31**
SPAD
0.14 0.11
LA 0.78**
* = P < 0.05; ** = P <0.01
4.4.4 Weak correlations between agronomic and compositional
traits
Among polyphenolic compounds, CT concentration was positively correlated with
PD-share (r = 0.60), indicating that prodelphinidins were most important for
total CT concentration levels (Table 4.3). CT also showed weak, positive
correlations to the other compounds, with the exception of kaempferol, which,
together with myricetin, was negatively correlated to quinic acid. Correlations
between agronomic and compositional traits were only significant in a few

100
instances (Table 4.3). Flowering time showed weak-to-moderate correlations with
chemical composition, whereby later flowering was associated with higher
concentrations of CT, quinic acid, and gallic acid, and lower concentrations of
kaempferol and myricetin. Furthermore, Vigor, HSp, and SPAD showed weak,
negative correlations to gallic acid concentrations. Correlations between selfings
of parent 1 and parent 2 generally had lower significance levels due to the lower
number of plants used (Table S4.2 and S4.3). However, the patterns of
correlations observed were generally similar to those observed in crossings.
Table 4.3 Phenotypic correlations among compositional traits as well as between compositional
and agronomic traits in 122 crossings (F1 progenies) derived from a cross between parent 1 and
parent 2. For abbreviations of traits see Table 4.1.
Correlated trait
Trait CT PD-share Quercetin Kaempferol Myricetin Quinic acid Gallic acid
Vigor 0.12 0.12 0.01 0.09 0.02 0.03 -0.25**
HSp 0.21* 0.21* -0.10 0.07 -0.05 0.15 -0.33**
Hsu 0.17 0.00 -0.20* -0.06 -0.16 0.18 -0.17
FT 0.30** 0.04 -0.15 -0.34** -0.33** 0.27** 0.26**
ln(SN) 0.19* 0.13 0.04 0.13 0.18 -0.01 -0.05
Rust 0.20* 0.23* -0.06 0.05 -0.08 0.13 0.03
SPAD -0.04 -0.06 -0.17 0.04 -0.23* -0.07 -0.24*
LA 0.1 0.11 -0.10 -0.21* -0.02 0.11 0.05
LL 0.18 0.13 -0.21* -0.22* -0.07 0.17 0.09
CT
0.60** 0.33** 0.04 0.22* 0.26** 0.26**
PD-share
0.29** 0.32** 0.28** 0.18 0.21*
Quercetin
0.32** 0.52** -0.12 0.03
Kaempferol
0.32** -0.28** -0.15
Myricetin
-0.35** 0.07
Quinic acid 0.03
* = P < 0.05; ** = P <0.01
4.4.5 TAM were detected for three agronomic and one
compositional traits
Across all individuals, 173 and 189 alleles were detected for the 16 SRAP and 48
SSR markers, respectively. In crossings, TAMs were detected for SN (7 TAM),
HSu (11 TAM), Vigor (1 TAM,) and PD-share (1 TAM, Table 4.1, 4.4), whereas no
TAMs were found within selfings of parent 2 (data not shown). Analyses of
logarithmic- and non-transformed values of SN revealed significant values for the
same markers (data not shown), thus untransformed SN values are reported for
simplicity. Among the observed TAMs, SSR markers were more frequently found

101
to be linked to phenotypic traits (13 TAM) when compared to SRAP markers (7
TAM). TAMs associated to SN explained between 1.1 and 28.1% of the variation,
where the presence of the allele had a positive effect on all SSR marker alleles
+991 to 1448 seeds per plant) and a negative effect on the SRAP marker allele (-
261 seeds per plant; Table 4.4). For HSu, values of explained variance for the 11
TAMs ranged from 4.4 to 28.6%, with the presence of the allele always having a
positive effect and resulting in plants that were 7.9 to 25.6 cm taller. For
compositional traits, only one TAM could be found for PD-share, with the SRAP
marker allele explaining 12.3% of the observed phenotypic variance, and
resulting in a slightly higher share of prodelphinidins.
Table 4.4 P-value, proportion of explained phenotypic variance (% expl. Var.) and effect size
(Effect) of trait associated marker (TAM) alleles identified in F1 progenies derived from of a cross
between parent 1 and parent 2. For abbreviations of traits see Table 4.1.
Trait Marker Allele size p value % expl. Var. Effect
SN (seeds/plant)
OVK_183 274 1.0E-06*** 28.1 1447.93
OVK_141 251 3.0E-04*** 24.9 1352.43
OVK_073 204 4.4E-06*** 24.4 1333.25
OVK_133 205 1.0E-04*** 9.9 1025.61
OVK_155 255 1.0E-04*** 9.9 1025.61
OVK_111 223 6.2E-06*** 9.3 991.47
me4em3 356 1.0E-03*** 1.1 -260.66
HSu (cm)
OVK_111 223 4.7E-06*** 28.6 25.62
me1em1 299 1.0E-03*** 27.3 25.46
me1em1 175 6.0E-04*** 25.4 23.66
OVK_133 205 1.1E-03*** 24.0 23.43
OVK_155 255 1.1E-03*** 24.0 23.43
me4em1 104 4.0E-04*** 22.8 19.12
OVK_063 191 1.4E-03*** 21.3 20.99
me4em3 127 1.1E-03*** 20.0 19.81
OVK_183 274 2.0E-04*** 8.2 11.45
me1em1 217 1.0E-04*** 7.6 10.12
OVK_073 189 8.0E-04*** 4.4 7.87
Vigor OVK_183 274 4.5E-05*** 23.9 1.77
PD-share me4em4 525 1.0E-04*** 12.3 0.02
*** = P < 0.001
For the majority of TAMs detected in crossings, the marker allele was transferred
from one parental plant only (data not shown). This is also reflected by the
occurrence of the marker alleles in respective selfings, whereby almost all plants

102
derived from one parent generally possessed the allele and plants derived from
the other parent generally did not (Figures 4.3–5).
Fig. 4.3 Seed number per plant (SN) dependent on presence (P) and absence (NP) of the marker
allele of TAM significantly associated with the trait for 122 F1 progenies (Crossings) derived from
a cross between parent 1 and parent 2, 30 S1 progenies of parent 1 (Selfings P1) and 85 S1
progenies of parent 2 (Selfings P2). Stars represent mean values per group.

103
Fig. 4.4 Plant height during summer (HSu) in cm dependent on presence (P) and absence (NP) of
the marker allele of TAM significantly associated with the trait for 122 F1 progenies (Crossings)
derived from a cross between parent 1 and parent 2, 30 S1 progenies of parent 1 (Selfings P1) and
85 S1 progenies of parent 2 (Selfings P2). Stars represent mean values per group.

104
Fig. 4.5. Plant vigor (Vigor13) and share of prodelphinidin on total condensed tannins (PD-share)
dependent on presence (P) and absence (NP) of the marker allele of TAM significantly associated
with the trait for 122 F1 progenies (Crossings) derived from a cross between parent 1 and parent
2, 30 S1 progenies of parent 1 (Selfings P1) and 85 S1 progenies of parent 2 (Selfings P2). Stars
represent mean values per group.
In crossings, the presence of TAM marker alleles mostly had a positive effect on
plant performance, with only one SRAP marker-allele having a negative effect on
seed yield. Due to the fact that plants of one selfing group generally possessed or
lacked the respective marker-allele, the effects of alleles from TAM detected in
crossings could not be confirmed within selfings of the same parent.
Several TAMs showed associations with multiple, mainly vigor-related traits. For
example, OVK_183_274 was associated with SN, Vigor, and HSu, while
OVK_133_205, OVK_111_223 and OVK 155_255 were associated with HSu and
SN. Correlations among TAMs associated with vigor related traits (SN, Vigor,
and HSu) showed two main clusters of marker alleles with strong correlations
within and weak correlations outside the clusters (Figure 4.6). The TAMs
me4em3_356 (associated to SN) and me4em4_127 (associated to PD-share)
showed no clear affiliation to either of the two clusters.

105
Fig. 4.6 Absolute values of correlation coefficients among trait associated marker (TAM) alleles
showing significant association with at least one of the phenotypic traits plant height during
summer (HSu), seed number (SN), plant vigor (Vigor) and share of prodelphinidins on total
condensed tannins (PD-share). Black squares indicate significant associations of the TAM with
one of the respective traits, intensity of green color reflects the size of the correlation coefficient.
4.5 Discussion
The present study reports, for the first time, associations between genetic
markers and phenotypic traits in sainfoin, representing a preliminary, but
essential step towards MAS for this species. The information gained on TAMs,
and on correlations among phenotypic traits, could help to increase efficiency in
sainfoin breeding. For example, favorable marker alleles of TAM can be traced in
potential parental plants from new varieties to increase their performance.
Furthermore, the work effort required in the selection for complex traits such as
seed yield might be reduced by selection for correlated traits such as plant vigor
or height that can be more easily determined.
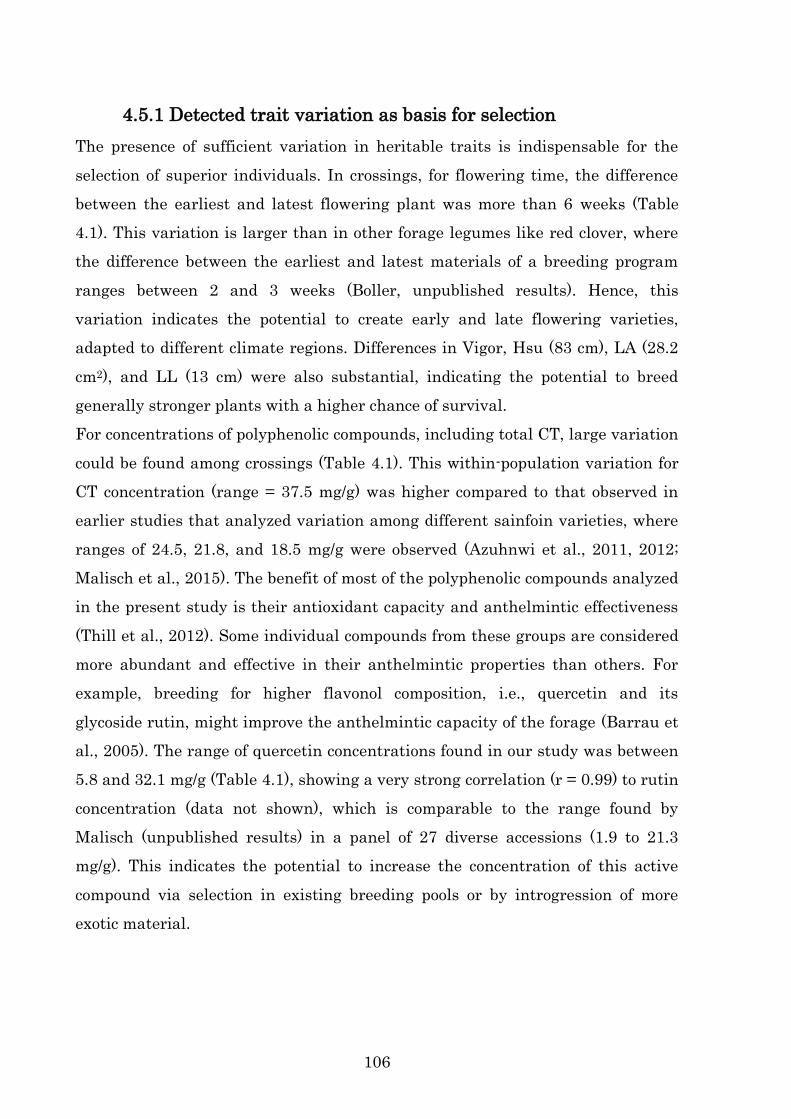
106
4.5.1 Detected trait variation as basis for selection
The presence of sufficient variation in heritable traits is indispensable for the
selection of superior individuals. In crossings, for flowering time, the difference
between the earliest and latest flowering plant was more than 6 weeks (Table
4.1). This variation is larger than in other forage legumes like red clover, where
the difference between the earliest and latest materials of a breeding program
ranges between 2 and 3 weeks (Boller, unpublished results). Hence, this
variation indicates the potential to create early and late flowering varieties,
adapted to different climate regions. Differences in Vigor, Hsu (83 cm), LA (28.2
cm2), and LL (13 cm) were also substantial, indicating the potential to breed
generally stronger plants with a higher chance of survival.
For concentrations of polyphenolic compounds, including total CT, large variation
could be found among crossings (Table 4.1). This within-population variation for
CT concentration (range = 37.5 mg/g) was higher compared to that observed in
earlier studies that analyzed variation among different sainfoin varieties, where
ranges of 24.5, 21.8, and 18.5 mg/g were observed (Azuhnwi et al., 2011, 2012;
Malisch et al., 2015). The benefit of most of the polyphenolic compounds analyzed
in the present study is their antioxidant capacity and anthelmintic effectiveness
(Thill et al., 2012). Some individual compounds from these groups are considered
more abundant and effective in their anthelmintic properties than others. For
example, breeding for higher flavonol composition, i.e., quercetin and its
glycoside rutin, might improve the anthelmintic capacity of the forage (Barrau et
al., 2005). The range of quercetin concentrations found in our study was between
5.8 and 32.1 mg/g (Table 4.1), showing a very strong correlation (r = 0.99) to rutin
concentration (data not shown), which is comparable to the range found by
Malisch (unpublished results) in a panel of 27 diverse accessions (1.9 to 21.3
mg/g). This indicates the potential to increase the concentration of this active
compound via selection in existing breeding pools or by introgression of more
exotic material.

107
4.5.2 TAM detection and validation
Principle coordinate analysis (Figure 4.1a) revealed the existence of population
structure, which would not be expected in traditional bi-parental mapping
populations, as was the case for our F1 progenies. This could be due to the fact
that samples were coded for the presence and absence of SRAP and SSR marker
alleles, resulting in two classes of marker phenotypes. Hence, the actual genotype
of plants could be biased by the negligence of the allele dose (simplex, 1000;
duplex, 1100; triplex, 1110; and quadruplex, 1111). Another possible explanation
could be preferential chromosome pairing, a phenomenon observed in
allohexaploid wheat and other species, which is caused by the presence of pairing
between control loci (Sears, 1976). In the present study, using the kinship matrix
as a variance-covariance matrix was a powerful tool to correct for such population
structure effects when performing marker regression.
4.5.3 Detected TAMs and potential benefits
The three agronomical traits for which significant TAMs were found (SN, HSu,
Vigor) are all related to general plant vigor, are moderately-to-strongly correlated
among each other, and share the same TAM (Table 4.2, Figure 4.6), indicating a
pleiotropic mode of action for the potential underlying gene loci. Increased seed
yield is crucial for sainfoin, and its selection via TAM would be highly effective.
This is because, to date, seed yield can only be assessed after the year of
establishment in the field, and is highly labor intensive. Furthermore, seed yield
is strongly influenced by the environment (Nowosad et al., 2016), reducing trait
heritability and, therefore, the response to selection. An efficient strategy to
increase seed yield might be to combine MAS using identified TAMs with indirect
selection via positively correlated traits that are simple to determine. In our
study, plant height (r = 0.47, 0.61) and vigor (r = 0.75) showed moderate-to-strong
correlations with seed yield, i.e., more vigorous plants had a higher seed
production potential, and could be used for the indirect selection of plants with
increased seed yield. To a lower extent, indirect selection for higher seed yield is
also possible by selecting genotypes with earlier flowering (r = -0.34).
For compositional traits, one significant TAM was identified for PD-share (Table
4.4). Our results show that it would not be possible to indirectly select for

108
chemical composition via simple agronomic traits due to the weak correlations
between these two groups of traits (Table 4.3). The single TAM found in our
study that was associated with higher PD-share could, therefore, be useful to
efficiently select plants with a higher PD concentration. This could be desirable,
because PDs are thought to be the most beneficial compound of total CTs with
the strongest antiparasitic activity (Mechineni et al., 2014). Due to the positive
correlation between the two traits (r = 0.60), MAS for PD-share would also
increase the total concentration of CT.
4.5.4 Accuracy of TAM to infer the presence of QTLs in sainfoin
populations
TAMs detected by simple marker regression are good indicators of the co-
occurrence of a marker with QTL (Collard et al., 2005). However, the exact
location of the marker within the genome, and the assignment of several TAMs to
the same or a different QTL remains unknown without verification in a linkage
map; to date, this is not available for sainfoin. However, patterns of correlations
among markers or marker alleles might provide an indication of the assignment
of TAMs to potential QTL. For example, in perennial ryegrass (Lolium perenne),
highly correlated markers (r = 0.95) linked to seed yield were found to be
associated with the same QTL (Studer et al., 2008). In our study, the two clusters
of correlated TAMs suggested the existence of two different potential QTL
regions for vigor-related traits, with five and eight associated TAMs, respectively
(Figure 4.6). One TAM (me4em3_356) associated with SN could not be assigned
to either one of the two clusters and might, therefore, describe a third potential
QTL region affecting seed yield (Figure 4.6). This was also the case for the TAM
associated with PD-share (me4em4_525), which likely belongs to a different,
independent QTL.
The number and effect size of TAMs or potential QTLs, respectively, detected in
our study was comparable to results reported for other forage species. For seed
yield, three QTLs were detected in red clover and two in perennial ryegrass,
explaining a maximum 15.3 and 32.8% phenotypic trait variation, respectively
(Herrmann et al., 2006; Studer et al., 2008). This is comparable to 28.1% of the
explained variance as observed in our study. For plant height, six QTLs were

109
reported for perennial ryegrass, and five QTLs were reported for switchgrass
(Panicum virgatum), explaining 27.9 and 17.4% of phenotypic variation,
respectively, which is consistent with the 28.6% found in the present study
(Studer et al., 2008; Serba et al., 2015). For plant vigor in alfalfa, four QTLs were
detected, explaining up to 23.3% of the phenotypic variance, which is close to the
23.9% found in the present study (McCord et al., 2014).
The precision with which a QTL can be localized by a genetic marker locus is
proportional to the number of sampled meiosis (each one providing the
opportunity for recombination between the marker and the trait locus) and,
therefore, depends on the type of population and its size (Mackay, 2001). TAMs
detected in our study are based on 122 F1 progenies derived from crossing two
non-inbred parental plants (parent 1, parent 2). Therefore, the number of meiotic
divisions was limited to one per parental plant and progeny. A larger population
size would have been desirable; however, due to the large number of self-
fertilizations (Kempf et al., 2015), and the generally low seed set, this could not
be accomplished. Hence, due to the limited number of crossing-over events, larger
parts of chromosome might be linked (and thus, always inherited together).
Therefore, distances of observed TAM to the true QTL might be large, and it is
likely that the association might be lost in the next generation of plants, when
crossing-over occurs between the QTL and observed TAM (Humphreys, 2005).
For this reason and the allelic marker diversity between populations, the
application of detected TAMs in other sainfoin populations might be challenging.
However, they may still be useful in populations derived from crosses of one of
the parents used in this study with other materials, e.g. for introgression of a
given trait.
4.5.5 Future trends for sainfoin breeding and conclusions
Generally, some of the disadvantages associated with sainfoin could be
compensated for by cultivation practices, e.g. by reducing competition from weeds
and choosing appropriate companion plants to increase persistence. However,
optimised cultivation practices cannot fully compensate the missing adaptation
capacity of available sainfoin cultivars to diverse environmental conditions.
Genetic improvement may, therefore, not be bypassed in the long term.

110
In this study, traits relevant for plant survival and reproduction were found to be
positively correlated, showing potential for their simultaneous improvement via
breeding. Furthermore, a subset of polymorphic SSR and SRAP markers showed
its usability for screening populations consisting of self- and cross-fertilized
progenies. Thereby, the identification of TAMs based on linear regression
methods was feasible for vigor traits, seed yield, and one chemical compound.
Those TAMs could be incorporated into sainfoin breeding programs.
In future studies on sainfoin breeding, more information on trait inheritance
must be provided. It will be necessary to apply our marker systems to several,
larger sainfoin populations with different genetic backgrounds. A further
important step will be the establishment of linkage maps to gain information
about the location of QTLs on the chromosome. The possibility of inbreeding,
which was recently confirmed (Kempf et al., 2015), could, thereby, enable the
development of experimental F2 mapping populations or recombinant inbred
lines. With a larger number of sampled meiotic divisions, linkage mapping in
such populations, in combination with an increased number of markers and
individuals, might allow a more precise determination of QTL positions than
would be currently possible with our F1 population.
4.6 Acknowledgements
This work was funded by the European Commission through the Marie Curie
Initial Training Network LegumePlus (PITN-GA-2011-289377; http://legumeplus.
eu/).
The authors thank Juha-Pekka Salminen and the natural chemistry research
group (University of Turku, Finland) for providing the laboratory and assisting in
data interpretation for the analysis of phenolic compounds. We thank Delley
Seeds and Plants Ltd. for providing the field site and assisting in the field trial.
Furthermore, we thank Sonja Reinhard, David Peditto, and Robert Spiess for
assistance in marker analysis.

111
4.7 Supplementary Material
Fig. S4.1 Frequency distribution of performance in agronomic traits and concentrations of
phenolic compounds in 30 S1 progenies derived from parent 1

112
Fig. S4.2 Frequency distribution of performance in agronomic traits and concentrations of
phenolic compounds in 85 S1 progenies derived from parent 2
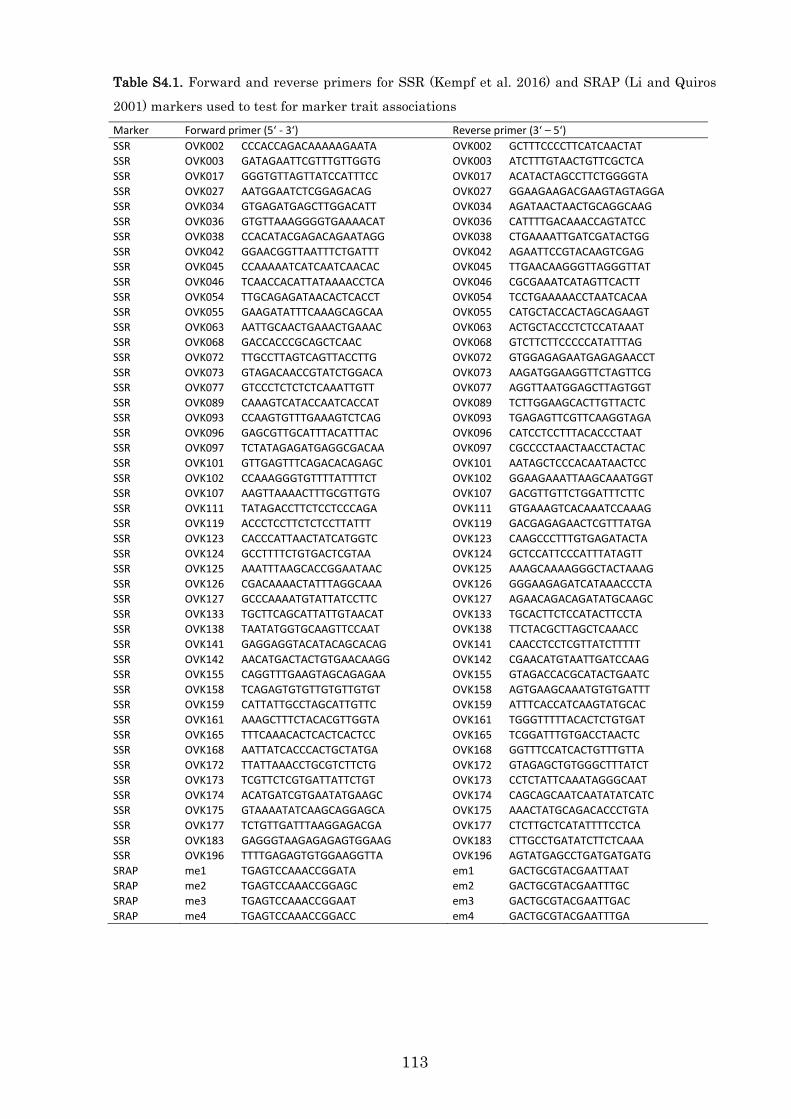
113
Table S4.1. Forward and reverse primers for SSR (Kempf et al. 2016) and SRAP (Li and Quiros
2001) markers used to test for marker trait associations
Marker Forward primer (5‘ - 3‘) Reverse primer (3‘ – 5‘)
SSR OVK002 CCCACCAGACAAAAAGAATA OVK002 GCTTTCCCCTTCATCAACTAT
SSR OVK003 GATAGAATTCGTTTGTTGGTG OVK003 ATCTTTGTAACTGTTCGCTCA
SSR OVK017 GGGTGTTAGTTATCCATTTCC OVK017 ACATACTAGCCTTCTGGGGTA
SSR OVK027 AATGGAATCTCGGAGACAG OVK027 GGAAGAAGACGAAGTAGTAGGA
SSR OVK034 GTGAGATGAGCTTGGACATT OVK034 AGATAACTAACTGCAGGCAAG
SSR OVK036 GTGTTAAAGGGGTGAAAACAT OVK036 CATTTTGACAAACCAGTATCC
SSR OVK038 CCACATACGAGACAGAATAGG OVK038 CTGAAAATTGATCGATACTGG
SSR OVK042 GGAACGGTTAATTTCTGATTT OVK042 AGAATTCCGTACAAGTCGAG
SSR OVK045 CCAAAAATCATCAATCAACAC OVK045 TTGAACAAGGGTTAGGGTTAT
SSR OVK046 TCAACCACATTATAAAACCTCA OVK046 CGCGAAATCATAGTTCACTT
SSR OVK054 TTGCAGAGATAACACTCACCT OVK054 TCCTGAAAAACCTAATCACAA
SSR OVK055 GAAGATATTTCAAAGCAGCAA OVK055 CATGCTACCACTAGCAGAAGT
SSR OVK063 AATTGCAACTGAAACTGAAAC OVK063 ACTGCTACCCTCTCCATAAAT
SSR OVK068 GACCACCCGCAGCTCAAC OVK068 GTCTTCTTCCCCCATATTTAG
SSR OVK072 TTGCCTTAGTCAGTTACCTTG OVK072 GTGGAGAGAATGAGAGAACCT
SSR OVK073 GTAGACAACCGTATCTGGACA OVK073 AAGATGGAAGGTTCTAGTTCG
SSR OVK077 GTCCCTCTCTCTCAAATTGTT OVK077 AGGTTAATGGAGCTTAGTGGT
SSR OVK089 CAAAGTCATACCAATCACCAT OVK089 TCTTGGAAGCACTTGTTACTC
SSR OVK093 CCAAGTGTTTGAAAGTCTCAG OVK093 TGAGAGTTCGTTCAAGGTAGA
SSR OVK096 GAGCGTTGCATTTACATTTAC OVK096 CATCCTCCTTTACACCCTAAT
SSR OVK097 TCTATAGAGATGAGGCGACAA OVK097 CGCCCCTAACTAACCTACTAC
SSR OVK101 GTTGAGTTTCAGACACAGAGC OVK101 AATAGCTCCCACAATAACTCC
SSR OVK102 CCAAAGGGTGTTTTATTTTCT OVK102 GGAAGAAATTAAGCAAATGGT
SSR OVK107 AAGTTAAAACTTTGCGTTGTG OVK107 GACGTTGTTCTGGATTTCTTC
SSR OVK111 TATAGACCTTCTCCTCCCAGA OVK111 GTGAAAGTCACAAATCCAAAG
SSR OVK119 ACCCTCCTTCTCTCCTTATTT OVK119 GACGAGAGAACTCGTTTATGA
SSR OVK123 CACCCATTAACTATCATGGTC OVK123 CAAGCCCTTTGTGAGATACTA
SSR OVK124 GCCTTTTCTGTGACTCGTAA OVK124 GCTCCATTCCCATTTATAGTT
SSR OVK125 AAATTTAAGCACCGGAATAAC OVK125 AAAGCAAAAGGGCTACTAAAG
SSR OVK126 CGACAAAACTATTTAGGCAAA OVK126 GGGAAGAGATCATAAACCCTA
SSR OVK127 GCCCAAAATGTATTATCCTTC OVK127 AGAACAGACAGATATGCAAGC
SSR OVK133 TGCTTCAGCATTATTGTAACAT OVK133 TGCACTTCTCCATACTTCCTA
SSR OVK138 TAATATGGTGCAAGTTCCAAT OVK138 TTCTACGCTTAGCTCAAACC
SSR OVK141 GAGGAGGTACATACAGCACAG OVK141 CAACCTCCTCGTTATCTTTTT
SSR OVK142 AACATGACTACTGTGAACAAGG OVK142 CGAACATGTAATTGATCCAAG
SSR OVK155 CAGGTTTGAAGTAGCAGAGAA OVK155 GTAGACCACGCATACTGAATC
SSR OVK158 TCAGAGTGTGTTGTGTTGTGT OVK158 AGTGAAGCAAATGTGTGATTT
SSR OVK159 CATTATTGCCTAGCATTGTTC OVK159 ATTTCACCATCAAGTATGCAC
SSR OVK161 AAAGCTTTCTACACGTTGGTA OVK161 TGGGTTTTTACACTCTGTGAT
SSR OVK165 TTTCAAACACTCACTCACTCC OVK165 TCGGATTTGTGACCTAACTC
SSR OVK168 AATTATCACCCACTGCTATGA OVK168 GGTTTCCATCACTGTTTGTTA
SSR OVK172 TTATTAAACCTGCGTCTTCTG OVK172 GTAGAGCTGTGGGCTTTATCT
SSR OVK173 TCGTTCTCGTGATTATTCTGT OVK173 CCTCTATTCAAATAGGGCAAT
SSR OVK174 ACATGATCGTGAATATGAAGC OVK174 CAGCAGCAATCAATATATCATC
SSR OVK175 GTAAAATATCAAGCAGGAGCA OVK175 AAACTATGCAGACACCCTGTA
SSR OVK177 TCTGTTGATTTAAGGAGACGA OVK177 CTCTTGCTCATATTTTCCTCA
SSR OVK183 GAGGGTAAGAGAGAGTGGAAG OVK183 CTTGCCTGATATCTTCTCAAA
SSR OVK196 TTTTGAGAGTGTGGAAGGTTA OVK196 AGTATGAGCCTGATGATGATG
SRAP me1 TGAGTCCAAACCGGATA em1 GACTGCGTACGAATTAAT
SRAP me2 TGAGTCCAAACCGGAGC em2 GACTGCGTACGAATTTGC
SRAP me3 TGAGTCCAAACCGGAAT em3 GACTGCGTACGAATTGAC
SRAP me4 TGAGTCCAAACCGGACC em4 GACTGCGTACGAATTTGA

114
C
orr
elat
ed T
rait
Trai
t H
Sp
HSu
FT
ln
(SN
) R
ust
SP
AD
LA
LL
C
T P
D-s
har
e
Qu
erce
tin
K
aem
pfe
rol
Myr
icet
in
Qu
inic
aci
d
Gal
lic a
cid
Vig
or
-0.1
4
0.6
7**
-0
.50
**
0.8
0**
0
.28
0
.21
0
.27
0
.24
-0
.14
0
.16
-0
.06
0
.03
-0
.09
-0
.58
**
0.3
8
HSp
0.1
0
-0.0
4
-0.2
3
0.1
1
-0.0
7
0.3
0
0.2
4
0.1
6
0.0
1
0.0
2
0.2
0
0.0
0
-0.2
1
0.0
7
HSu
-0
.31
0
.27
0
.21
0
.11
0
.41
* 0
.32
-0
.19
0
.01
-0
.03
-0
.08
0
.01
-0
.34
0
.29
FT
-0
.42
* -0
.45
* -0
.20
-0
.19
-0
.04
-0
.27
-0
.56
**
-0.1
8
-0.1
4
-0.2
6
0.1
9
-0.3
1
ln(S
N)
0.1
7
0.1
0
0.0
4
-0.0
6
-0.0
4
0.2
4
0.0
5
0.1
7
-0.1
6
-0.4
4*
0.2
7
Ru
st
-0
.15
0
.11
0
.16
-0
.26
0
.22
-0
.30
-0
.20
-0
.25
-0
.32
0
.02
SPA
D
0.1
2
0.0
7
'0.2
0 -0
.26
0
.22
-0
.46
* 0
.30
0
.02
-0
.08
LA
0
.87
**
-0.1
4
0.0
2
0.0
2
0.0
3
0.1
3
-0.1
8
0.0
9
LL
-0.1
8
-0.1
4
-0.1
0
-0.1
7
0.0
3
-0.1
8
-0.0
9
CT
0
.35
0
.65
**
0.0
1
0.5
3**
0
.17
-0
.17
PD
-sh
are
0
.14
0
.25
0
.34
-0
.05
0
.09
Qu
erce
tin
-0.0
2
0.3
9*
0.3
3
-0.1
8
Kae
mp
fero
l
-0
.23
0
.04
0
.28
Myr
icet
in
0
.21
-0
.14
Qu
inic
aci
d
-0.3
8*
Tab
le
S4.2
. P
ears
on
‘s
corr
ela
tion
co
eff
icie
nts
am
on
g
ph
en
oty
pic
tr
ait
s ass
ess
ed
in
off
spri
ng
deri
ved
fr
om
se
lf-f
ert
iliz
ati
on
of
pare
nt
1.
Agro
nom
ic t
rait
s a
sse
ssed
are
vig
or
(Vig
or)
, p
lan
t h
eig
ht
in s
pri
ng (
HS
p)
an
d s
um
mer
(HS
u),
flo
weri
ng t
ime (
FT
), s
eed
nu
mber
per
pla
nt
(SN
),
sen
siti
vit
y t
o r
ust
(Ru
st),
SP
AD
, le
af
are
a(L
A)
an
d l
eaf
len
gth
(L
L),
wit
h t
he n
um
ber
in s
ubsc
rip
t giv
ing t
he y
ear
of
measu
rem
en
t (2
012
, 201
3).
Qu
ali
ty tr
ait
s are
co
nce
ntr
ati
on
of
con
den
sed
ta
nn
ins
(CT
), sh
are
of
pro
delp
hin
idin
es
on
to
tal
CT
(P
D-s
hare
) a
s w
ell
as
con
cen
trati
on
of
qu
erc
eti
n,
kaem
pfe
rol,
m
yri
ceti
n,
qu
nin
ic
aci
d
an
d
gall
ic
aci
d.
Nu
mbers
h
igh
ligh
ted
in
gre
en
an
d
red
in
dic
ate
th
at
the
corr
esp
on
din
g
corr
ela
tion
coeff
icie
nt
in o
ffsp
rin
g d
eri
ved
fro
m c
ross
-fert
iliz
ati
on
betw
een
pare
nt
1 (
P1)
an
d p
are
nt
2 (
P2)
was
at
min
imu
m 0
.30 h
igh
er
or
low
er,
resp
ect
ively
.

115
C
orr
elat
ed T
rait
Trai
t H
Sp
HSu
FT
ln
(SN
) R
ust
SP
AD
LA
LL
C
T P
D-s
har
e
Qu
erce
tin
K
aem
pfe
rol
Myr
icet
in
Qu
inic
aci
d
Gal
lic a
cid
Vig
or
0.4
5**
0
.47
**
-0.1
7
0.7
3**
0
.18
0
.25
* 0
.33
**
0.3
2**
0
.15
0
.12
0
.07
-0
.06
-0
.04
-0
.08
0
.00
HSp
0.6
1**
-0
.12
0
.28
* 0
.34
**
0.1
5
0.0
9
0.1
2
0.2
0
0.2
6*
0.2
4*
0.1
1
0.1
5
-0.1
1
-0.0
7
Hsu
-0
.11
0
.28
* 0
.10
0
.33
**
0.1
6
0.1
9
0.2
1
0.0
6
0.2
9**
-0
.04
0
.09
0
.00
-0
.10
FT
-0
.34
**
-0.1
8
-0.1
7
-0.1
1
-0.0
9
-0.1
6
-0.2
0
-0.1
1
-0.0
1
-0.2
3*
0.0
3
0.1
5
ln(S
N)
0.2
3*
0.1
4
0.2
0
0.2
1
0.0
7
0.1
5
0.0
2
0.0
0
0.0
0
-0.1
5
0.0
1
Ru
st
0
.08
0
.17
0
.10
0
.34
**
0.3
7**
0
.29
* 0
.19
0
.30
**
-0.1
5
-0.0
6
SPA
D
0.1
0
0.0
6
-0.1
3
-0.1
0
0.0
6
0.0
3
-0.1
0
0.1
2
-0.2
4*
LA
0
.87
**
0.1
5
0.0
9
-0.0
8
-0.0
9
0.0
1
-0.0
5
-0.1
1
LL
0.1
7
0.0
6
0.0
0
-0.1
2
0.0
3
-0.1
0
-0.0
3
CT
0
.55
**
0.5
5**
-0
.17
0
.58
**
-0.0
4
-0.1
5
PD
-sh
are
0
.35
**
0.4
2**
0
.52
**
-0.0
5
-0.1
4
Qu
erce
tin
0.0
3
0.7
0**
-0
.04
-0
.13
Kae
mp
fero
l
0
.12
-0
.03
-0
.11
Myr
icet
in
-0
.07
-0
.16
Qu
inic
aci
d
-0.1
6
Tab
le
S4.3
. P
ears
on
‘s
corr
ela
tion
co
eff
icie
nts
am
on
g
ph
en
oty
pic
tr
ait
s ass
ess
ed
in
off
spri
ng
deri
ved
fr
om
se
lf-f
ert
iliz
ati
on
of
pare
nt
2.
Agro
nom
ic t
rait
s a
sse
ssed
are
vig
or
(Vig
or)
, p
lan
t h
eig
ht
in s
pri
ng (
HS
p)
an
d s
um
mer
(HS
u),
flo
weri
ng t
ime (
FT
), s
eed
nu
mber
per
pla
nt
(SN
),
sen
siti
vit
y t
o r
ust
(Ru
st),
SP
AD
, le
af
are
a(L
A)
an
d l
eaf
len
gth
(L
L),
wit
h t
he n
um
ber
in s
ubsc
rip
t giv
ing t
he y
ear
of
measu
rem
en
t (2
012
, 201
3).
Qu
ali
ty tr
ait
s are
co
nce
ntr
ati
on
of
con
den
sed
ta
nn
ins
(CT
), sh
are
of
pro
delp
hin
idin
es
on
to
tal
CT
(P
D-s
hare
) a
s w
ell
as
con
cen
trati
on
of
qu
erc
eti
n,
kaem
pfe
rol,
m
yri
ceti
n,
qu
nin
ic
aci
d
an
d
gall
ic
aci
d.
Nu
mbers
h
igh
ligh
ted
in
gre
en
an
d
red
in
dic
ate
th
at
the
corr
esp
on
din
g
corr
ela
tion
coeff
icie
nt
in o
ffsp
rin
g d
eri
ved
fro
m c
ross
-fert
iliz
ati
on
betw
een
pare
nt
1 (
P1)
an
d p
are
nt
2 (
P2)
was
at
min
imu
m 0
.30 h
igh
er
or
low
er,
resp
ect
ively
.

116
Chapter 5 A first linkage map for tetraploid sainfoin
(Onobrychis viciifolia)

117
5.1 Introduction
5.1.1 Use and construction of linkage maps
Availability of information on the position of different markers within the
genome is a prerequisite for the application of advanced quantitative trait loci
(QTL) mapping techniques like simple interval mapping (SIM, Marquez-Cedillo
et al. 2001) or composite interval mapping (Doligez et al. 2002). Such methods
allow precise determination of QTL locations, e.g., also between two observed
marker loci. Thereby it is also possible to infer if different markers showing
significant association to the same trait are associated with the same QTL or
different QTLs, what is not possible by simple marker regression as performed in
chapter 4. The sequence order and the actual positions of genetic loci and their
distances among each other can be identified if a reference genome, i.e., the
haploid representation of a genome as DNA sequence assembled from sequence
information from one (e.g. B73 reference genome “B73 RefGen_v3” of maize,
Andorf et al. 2016) or several donor genotypes (e.g. human reference genome,
http://www.ncbi.nlm.nih.gov/
projects/genome/assembly/grc/human/), is available. That information could be
transferred into a physical map of the chromosomes giving the actual distances of
genetic loci in base pairs (bp). However, with the absence of a reference genome
as the case for sainfoin, the establishment of physical maps is not feasible. Here,
genetic linkage maps are a good alternative to gain a first insight into the
structure of a genome, giving the positions and order of known genetic markers
and genes relative to each other on plant chromosomes. Ideally, the position of
the markers in a genetic linkage map reflects their actual physical position.
Linkage maps are built upon the theory that recombination events via crossing
over (gene exchange between homologous chromosomes) during meiosis occur
more frequently between genes or markers located distant to each other than
between genes or markers at closer distance on a chromosome (Sturtevant 1921).
This phenomenon of linkage between markers violates the second Mendelian law
of independent assortment of genes to offspring after crossing two heterozygous
parents (Mendel 1866). The order and distance of linked markers can be
118
estimated by the recombination frequency (RF), which gives the probability of
recombination between two markers. Linkage is indicated by RF < 0.5, with
smaller values indicating shorter distances between the marker loci. Unlinked
marker loci show RF of 0.5, meaning they are at the two ends of the same
chromosome or on two different chromosomes. Groups of markers with low RF
among each other are denoted as linkage groups. Ideally, each linkage group is
representative for a chromosome, with the total number of linkage groups
corresponding to the haploid chromosome number of the individual. The RF
among the different linkage groups corresponds to the maximum value of 0.5.
Positions of markers within a linkage group are usually given in the genetic map
distance (D) using the unit centimorgan (cM), where 1 cM corresponds to one
recombination event between two marker loci in 100 meiosis (1% recombination).
Double crossing over (two crossing over events occurring between two marker
loci), of which the chance increases with distance between markers, results in no
recombination between the two markers. Therefore, RF tends to underestimate
the distance between two linked genes, especially if they are at larger distance.
Hence, RF and D show a logarithmic relationship and the Haldane (D = 0.5 ×
ln(1-2×RF) (Haldane 1919) or Kosambi function (D = 0.25 × ln((1+2RF)/(1-2RF))
(Kosambi 1943) might be used to translate RF into D, correcting for effects of
double crossing over. A further common value to assess linkage is the logarithm
(base 10) of odds (LOD) score, which is a likelihood statistic for obtaining the
marker combinations by chance, or due to linkage. The critical LOD value for
indication of linkage is ≥ 3 (Page et al. 1998).
5.1.2 Populations for creation of linkage maps
A basic requirement to create a linkage map is the establishment of an
experimental mapping population with segregation of genes in the offspring.
Typical examples are F2 populations, backcross populations (BC) or recombinant
inbred lines (RIL) developed from the biparental cross of two inbred parents
(Armstead et al. 2002; Sindhu et al. 2014). These populations have to be
genotyped with a sufficient number of markers. Generally, the number of
markers required increases with the number of recombination events having
happened among the individuals of the mapping population, e.g., is larger for a

119
RIL population where several recombination events happened during repeated
self-fertilization starting from F2 progenies of the initial biparental cross,
compared to the F2 population itself.
However, all these populations rely on inbred parental plants, which are difficult
to obtain for outbreeding species where self-fertilization is often difficult or
impossible. Therefore, F1 full sib families, generated by crossing two
heterozygous parental plants, are often used in such species for linkage mapping
(Pereira et al. 2013). However, linkage analysis is more complicated in full sub
families from outbreeding species, due to different heterozygosity levels in the
parents, markers with varying number of segregating alleles and unknown
linkage phases of marker pairs (Maliepaard et al. 1997). Taking these problems
into account, the so-called pseudo-testcross approach is used in mapping F1
populations, only including markers segregating in a 1:1 ratio (Margarido et al.
2007) in the offspring. This refers to presence of the marker allele in one parent
(heterozygous for the allele) and to absence in the other parent (null allele). With
sainfoin being an outbreeding species, application of the pseudo-testcross
approach to F1 progenies of biparental crosses as determined in chapter 2 and
employing genetic markers described in chapter 3, segregating with a 1:1 ratio in
F1 progenies, would be the best approach to create a first linkage map for this
species.
5.1.3 Mapping software for polyploid species
For diploid species, linkage mapping is well-established with many mapping
software packages like Mapmaker (Lander et al. 2009), Joinmap (van Oijen 2006)
or OneMap, the latter being particularly developed to handle F1 populations
(Margarido et al. 2007). However, sainfoin is a tetraploid species of which the
allo- or autopolyploid origin yet has to be determined. Hence, special software
packages have to be employed, accounting either for the auto- or allotetraploid
case.
In case of allotetraploid species, i.e., polyploidy arisen from hybridization of two
different ancestor genomes (Leitch and Bennett 1997), chromosome pairing and
crossing over during meiosis mainly occurs between the two homologous
chromosomes (chromosomes from the same diploid ancestor species), resulting in

120
a so-called disomic behavior (Butruille and Boiteux 2000). In this case,
homeologous chromosomes (chromosomes from the different ancestor species)
could be treated like different chromosomes of a diploid species and the same
statistics and software packages could be applied. The applicability of this
approach has been shown by the successful use of MapMaker and JoinMap
software packages for mapping hexaploid wheat, an allotetraploid species
(Buerstmayr et al. 2002; Risser 2010). Ideally, the number of linkage groups
corresponds to the sum of the haploid chromosome numbers of the subgenomes in
allotetraploids.
In autotetraploids, like patato (Solanum tuberosum) where the polyploidy
developed by the combination of genomes within a diploid species (Otto and
Whitton 2000), TetraploidMap (Hackett et al. 2007) is the only software available
so far for this type of polyploids. Issues that have further to be taken into account
in autotetraploids are multivalent chromosome pairing (Fig. 5.5), double
reduction and homology discrepancies between chromosomes. Double reduction
can occur as consequence of multivalent chromosome pairing when crossing over
occurs between two sets of sister chromatids that subsequently migrate to the
same pole. Under this situation, it is possible for a chromatid and its recombinant
copy to end up in the same gamete, e.g., genotype A000 can produces the diploid
gamete AA in autotetraploids (Mather 1935; Bourke et al. 2015). Double
reduction is, hence, exclusive for autoteraploid species, whereby the outcome are
departures from supposed random pairing and distorted gene segregation ratios
(Gar et al. 2011), violating the biological assumptions that are the base for
linkage mapping statistics. TetraploidMap software indicates the likelihood for
double reduction, whereby markers showing significant double reduction have to
be rechecked for genotyping errors or must be discarded from the analysis. So far,
linkage maps have been successfully created in autotetraploid orchard grass
(Dactylis glomerata, Xie et al. 2012), chokecherry (Prunus virginiana, Wang et al.
2014), cut rose (Rosa hybrida, Gar et al. 2011), switchgrass (Panicum virgatum,
Liu et al. 2012) and potato (Hackett et al. 2013). The number of linkage groups in
autotetraploids refers to the sum of the haploid chromosome number of the single
ancestor genome.

121
In sainfoin, no linkage map has been created so far, mainly due to the limited
availability of genetic markers. Most investigations have been based on dominant
markers such as inter simple sequence repeat (ISSR) and randomly amplified
polymorphic DNA (RAPD) marker (Rasouli 2013; Zarrabian et al. 2013), which
have the disadvantage that heterozygous marker loci are not readily identified. A
few investigations used co-dominant SSR markers derived from other legume
species such as barrelclover (Medicago truncatula) and soybean (Glycine max,
Demdoum et al. 2012; Avci 2014). The adaptation and application of dominant
sequence related amplified polymorphism (SRAP) markers in sainfoin (Kempf et
al. 2015, chapter 2) as well as the recent development of sainfoin specific, co-
dominant SSR marker through Ilumina based next generation sequencing (Mora-
Ortiz et al. 2016) have opened the route for the creation of a first linkage map in
sainfoin. However, the origin of polyploidy is still not known and the unknown
segregation patterns of sainfoin chromosomes have to be kept in mind,
demanding the examination of different approaches. Hence, the aim of the
present research was the use of co-dominant SSR and dominant SRAP markers
in a first attempt for linkage mapping in sainfoin. Thereby, software designed for
autotetraploid as well as allotetraploid species was used due to the unknown
origin of polyploidy in sainfoin.
5.2 Material and Methods
5.2.1 Plant material and marker genotyping
For the creation of a linkage map, we used a F1 population (n=122) from a
biparental cross between two plants of the varieties Brunner (P1; Agroscope,
Zurich, Switzerland) and Perdix (P2; Agroscope, Nyon, Switzerland), respectively.
This corresponds to the same F1 population as used for simple marker regression
presented in chapter 4, excluding S1 progenies (originating from self-fertilization
of one of the two parental plants) from analysis. The population is expected to
show gene segregation due to heterozygosity in the parental plants. DNA of the
two parental plants and the 122 F1 individuals was extracted from freeze dried,
grounded leaf material using the illustraTM DNA Extraction Kit PHYTOPURE

122
(GE Healthcare, Little Chalfont Buckinghamshire, United Kingdom) according to
the manufacturer’s instructions. DNA concentration was measured by gel
electrophoresis with a mass standard (High DNA Mass Ladder, Invitrogen™,
Life Technologies, Carlsbad, USA). Marker resources comprised 16 SRAP primer
combinations based on four fluorescently labeled forward and reverse primers (Li
and Quiros 2001) as well as 48 fluorescently labeled, sainfoin specific SSR
markers (see Table S4.1). For both marker systems, 10 ng genomic DNA was
used for PCR as described in chapter 2.
PCR amplicons were analyzed with the fragment analysis function on the
Applied Biosystems 3500/3500XL Genetic Analyzer (AB applied biosystems,
Forster City, USA) using 1 μl of the undiluted PCR product, 0.5 μl LIZ 600
(GeneScanTM-600LIZ® Size Standard; AB, applied biosystems) and 10 μl
Formamide (Hi-Di™ Formamide; AB, applied biosystems). The mix was heated
at 94 °C for 5 min and subsequently cooled down before fragment analysis. The
resulting data were analyzed with GeneMarker software (Softgenetics, V2.4.0
Inc., State College, USA). SSR marker alleles found in the parental plants were
scored for presence (1) and absence (0) in the offspring. For SRAP markers, only
alleles present in one parent and absent in the other parent were scored in the
offspring.
5.2.2 Approaches for creation of linkage maps
Accounting for the missing knowledge on the origin of polyploidy in sainfoin, we
used TetraploidMap (Hackett et al. 2007) as a tool specifically developed for
autotetraploid species and JoinMap (van Oijen 2006), which was developed for
diploid organisms, to account for the allotetrapoid case. The procedures for
creation of linkage maps, separately for each parent, followed the developer’s
instructions in the corresponding manuals.
For analysis with TetraploidMap, all available markers were imported. The
software automatically infers the possible parental marker genotypes based on
the segregation ratios in the offspring. Only markers with a segregation ratio of
1:1 or 1:5 in the offspring, which refers to simplex (1000 x 0000) and duplex (1100
x 0000) crossings in the parents, respectively, were selected for further analysis

123
because crossing over events are only visible in these two marker classes
(Fig.5.6). Markers were distributed into groups after test for random segregation
using chi square test of independence. The number of groups was chosen
according to the haploid chromosome number of sainfoin (= 7) or according to the
most likely group formation as visualized by the cluster dendrograms, the
maximum number allowed by the software being 12 (the haploid chromosome
number of potato). Furthermore, suspicious markers showing outlying clustering
were excluded from the analysis and cluster analysis was repeated to reach more
homogenous grouping. Linkage groups (LG) were formed according to a critical
recombination frequency (RFCrit) of 0.35, 0.3 and 0.25 as advised by the
developers, with marker pairs showing RF < RFCrit belonging to the same and
marker pairs showing RF > RFCrit belonging to different LG. Ordering of markers
within independent LG was conducted following three steps: (1) initial ordering
with a seriation algorithm, (2) two-point analysis calculating the RF value and
(3) LOD score for each marker pair and ripple ordering. Before these steps,
markers with significant double reduction according to chisquare test-statistics
delivered by the program were discarded. Because TetraploidMap could only
handle 52 markers per LG, further markers had to be deleted before calculating
map distances for large LGs. In this case, markers with the lowest p-value from
chi-square tests for double-reduction were discarded.
JoinMap does not infer the possible parental marker genotypes based on the
segregation ratios in the offspring. Therefore, markers were previously tested for
their segregation ratio and only those showing a 1:1 ratio were imported into the
software. The population was classified as outbreeding full sib family (CP) and
mapping was conducted for each parent separately. Information on likelihood of
double reduction is not provided by JoinMap, but markers are tested for
deviation from the Mendelian segregation ratio. Grouping of the marker loci to
LGs was carried out based on RF, allowing a direct comparison to TetraploidMap,
which also uses RF for formation of linkage groups. RF should be smaller than
0.5 to suggest linkage of marker loci. No markers were removed from the
analysis. After determining the number of LG according to RF with the most
likely grouping, the linkage maps were calculated using the Monte Carlo
maximum likelihood (ML) mapping algorithm in a pseudo-testcross analysis (van

124
Ooijen 2011). After grouping, strongest cross link information (SCL) of each
marker was provided by the software, a parameter indicating linkage with
markers outside the respective LG. For JoinMap, all markers were included for
creation of linkage maps. Marker information, the corresponding LGs and genetic
distances as obtained by both software packages, were exported and linkage
maps were drawn using MapChart (Voorrips 2002) software.
5.3 Results
5.3.1 Grouping of markers with TetraploidMap
Preselection of markers with 1:1 and 1:5 segregation ratios yielded in 133
markers for parent 1 (P1) and 136 markers for parent 2 (P2). Double reduction
was indicated for 17 (12.8%) markers in P1 and 25 (18.4%) markers in P2. In P1,
initial clustering of markers into seven groups (the expected number according to
the haploid genome size) produced inhomogeneous groups with 107 markers in
one and the remaining 26 markers distributed over the other six groups (Table
5.1). Reducing the number of linkage groups to < 7 (what would correspond to
increasing RFCrit) led to an increased size of the largest group and decreased size
of the smaller groups. The average linkage cluster dendrogram indicated an
optimum number of eight LG (data not shown), which corresponds to an RFCrit of
0.3. If the number of LGs was increased to > 8, the largest group remained
unchanged, indicating certain stability of linkage relations within this group. In
P2, clustering of selected markers into seven LGs resulted in two large LGs (64
and 47 marker) and five small LGs (Table 5.1). The curve of the average linkage
clustering indicated an optimum grouping of markers into two groups (data not
shown), which corresponds to an RFCrit between 0.25 and 0.30 (TetraploidMap
does not report the actual RFCrit given a certain number of LGs). However, this
yielded one large group with 134 and a small group with two markers. The
deletion of these two markers of the second LG changed the grouping to 121
markers in LG1 and 13 markers in LG2.

125
Table 5.1 Distribution of number of markers per linkage group (LG) as dependent on the number
of linkage groups formed using the software TetraploidMap
Markers per linkage group
No. LGs LG1 LG2 LG3 LG4 LG5 LG6 LG7 LG8 LG9 LG10 LG11 LG12
Parent 1
1 133
2 127 6
3 118 6 9
4 113 6 9 5
5 113 6 5 5 4
6 110 6 5 5 4 3
7 107 6 5 5 4 3 3
8 78 6 5 5 4 3 3 29
9 78 3 5 5 4 3 3 29 3
10 73 3 5 5 4 3 3 29 3 5
11 73 3 5 5 4 3 3 17 3 5 12
12 73 3 5 5 4 3 3 17 3 3 12 2
Parent 2
1 136
2 134 2
3 121 2 13
4 64 57 9 4
5 64 59 9 4 2
6 64 47 9 4 2 10
7 64 47 9 4 2 8 2
8 64 27 9 4 2 8 2 20
9 64 20 9 4 2 8 2 20 7
10 64 20 9 4 2 5 2 20 7 3
11 59 20 9 4 2 5 2 20 7 3 5
12 54 20 9 4 2 5 2 20 7 3 5 5
5.3.2 Grouping of markers with JoinMap
Preselection of markers for a 1:1 segregation ratio to be used with JoinMap
yielded 83 markers for P1 and 95 markers for P2. Using an RFCrit value of 0.35,
the grouping tree function yielded only one LG for P1 (Table 5.2). Decreasing
RFCrit to 0.3, the large group dissociated into one large group with 70 markers, a
second LG with five markers and nine small LGs, each containing one marker.
With a further decrease of RFCrit, the same pattern of one large LG and an
increasing number of very small LGs, each one only harboring few markers
persisted. In P2 the grouping tree showed a similar grouping as for P1, with all
markers clustering into one large LG at RFCrit of 0.35 (Table 5.2). This single LG
dissociated into one large group containing 94 markers and one LG with only one
marker when lowering RFCrit to 0.3, or into one large LG comprising 85 markers
and eight small LGs of one to three markers when lowering RFCrit to 0.25.

126
Table 5.2 Number of linkage groups (LG) and distribution of markers among them as dependent
on the critical recombination frequency (RFCrit) and obtained by the software JoinMap
Markers per Linkage group
RFCrit LG1 LG2 LG3 LG4 LG5 LG6 LG7 LG8 LG9 LG10 LG11 LG12 LG 13-36
Parent 1
0.35 83
0.30 70 5 1 1 1 1 1 1 1 1
0.25 29 4 4 3 3 2 2 2 2 2 2 2 1-2
Parent 2
0.35 95
0.30 94 1
0.25 85 3 1 1 1 1 1 1 1
5.3.3 Linkage maps
Linkage maps are shown for specific situations in both software packages. In
TetraploidMap, the optimum number of LGs as indicated by the average linkage
cluster dendrogram was used, with eight LGs (corresponding to RFCrit of 0.3) for
P1 (Fig. 5.1) and four LGs (corresponding to RFCrit between 0.25 and 0.3) for P2
(Fig. 5.2). In JoinMap, final linkage maps are shown for an RFCrit of 0.25 in P1
(Fig. 5.3) and P2 (Fig 5.4), whereby LGs with less than three markers were
omitted. Observed clustering patterns were not comparable between JoinMap
and TetraploiMap. Over all LGs in P1, only 28% of markers grouped by
TetraploidMap were also grouped together by JoinMap, with the corresponding
number in P2 being 41.9% (data not shown). Linkage maps created by Tetraploid
map covered 613 cM for P1, ranging from 30.5 to 151.6 cM among the different
LGs, and 420 cM for P2, ranging from 72.1 to 142.2 cM. Linkage maps created by
JoinMap were considerable larger, with the four main LGs of P1 already covering
582.5 cM and the two LGs having more than one marker in P2 covering 1763.9
cM.

127
Fig. 5.1 Linkage group 1 (LG1) to linkage group 8 (LG8) of parent 1 (P1) as established with
TetraploidMap software.

128
Fig. 5.2 Linkage group 1 (LG1) to linkage group 4 (LG4) of parent 2 (P2), as established with
TetraploidMap software.
Fig. 5.3 Linkage group 1 (LG1) to linkage group 5 (LG5) of parent 1 (P1), as established with
JoinMap software. For better representability, maps of the remaining 31 linkage groups are not
shown.

129
Fig 5.4 Linkage group 1 (LG1) and linkage group 2 (LG2) of parent 2 (P2), as established with
JoinMap software. For better representability, maps of the remaining eight linkage groups are
not shown.
5.4 Discussion
The markers used in this study within a F1 full sib family derived from two non-
inbred, heterozygous parental plants, were all strongly linked with indications of
only one linkage group (LG). Different LGs could only be obtained using stringent
(i.e., low) RFCrit values, which resulted in potentially random or erroneous
separation into different linkage groups. This is supported by the fact that
marker clusters of one LG produced by TetraploidMap software showed a
separation into more than one linkage group in JoinMap and vice versa.
Furthermore, the LOD scores from the strongest cross linkage as calculated by
JoinMap indicate that the linkage between markers of different LGs was as high
as linkage between markers within the same LG. Hence, a final definition of LGs
and allocation of markers was not possible, with a large number of very small

130
LGs appearing. Manual rejection of markers showing such a deviant clustering
into small linkage groups, as it is also recommended by the software manuals,
did not improve the analysis, as the pattern of one large and several smaller LGs
persisted. The most likely number of LGs as indicated by both software packages
did not reflect the amount of haploid or two haploid chromosome numbers,
respectively. For sainfoin, a haploid chromosome number of seven has been
verified (Fyfe 1946) and, therefore, seven linkage groups would be expected for
TetraploidMap software and 14 linkage groups for JoinMap (according to the sum
of the haploid chromosome number in both subgenomes).
The weak grouping as obtained by both software can be multicausal. The
population size of 122 individuals might be too small, especially with regard to F1
populations. The precise identification of QTL in a population is dependent on the
size and kind of mapping population as well as the amount of recombination
events due to meiosis between marker and QTL (Mackay 2001). In F1
populations, only one meiosis event happening during gamete formation in each
parent is sampled per offspring plant, offering a limited number of crossing over
and, thus, recombination events to happen. Further, tracing the gene segregation
in F1 offspring is difficult with low numbers of individuals, and would be
improved with higher numbers of individuals. Hence, the intermixture of the
genome due to recombination was small and might lead to marker clustering into
one linkage group.
Under the assumption that sainfoin might be autotetraploid, multivalent pairing
of chromosomes during meiosis (Fig. 5.5, Otto 2007) occurs to a certain amount.
With multivalent pairing, double reduction could occur, which reduces the
number of markers in which recombination events (crossing over) can be
detected. The rate of possible double reduction identified by TetraploidMap in the
present study illustrated that multivalent pairing and double reduction is likely
in sainfoin. This consideration is supported by recent findings from chromosome
arrangements during meiosis, where multivalent as well as bivalent formation
was observed in sainfoin (Fig 5.1, David Kopecký, personal communication,
2015). This is also in line with the large amount of markers showing deviation
from Mendelian segregation ratios as found by JoinMap, what would be a
consequence of deviation from bivalent chromosome pairing and double

131
reduction. Hence, multivalent chromosome pairing might be even more
significant in sainfoin than in other autotetraploid species like potato, where
multivalent pairing is supposed to occur rather seldom compared to bivalent
pairing (Bourke et al. 2015), hampering the separation of markers into linkage
groups.
Fig. 5.5 Chromosome arrangement for crossing over during meiosis. In diploids, only bivalent
pairing of chromosomes is possible. In autotetraploids, all four homologue chromosomes can
combine for a multivalent pairing. Bivalent pairing would be predominantly observed between
homologue chromosomes of allotetraploids, but is also possible to occur in autotetraploids. Graph
taken from Otto (2007).
The accuracy of markers is reduced by the unknown allele dosage in co-dominant
markers, where only the quadruplex state (four different alleles at the locus)
would show the exact dosage. Loci showing three or less alleles could carry more
copies of the same alleles on homologous or homeologous chromosomes. This
aspect complicated the assessment of the segregation ratios for co-dominant
markers. TetraploidMap does infer possible dosages, but with small numbers of
individuals, the results are barely reliable. Furthermore, the software discards
co-dominant markers with odd segregation ratios, as these hinder conclusions
about parental marker genotypes and detection of linkage. If SSR markers were
coded as co-dominant, most were rejected by TetraploidMap software based on
segregation distortion. Therefore, every single SSR allele was coded as a
different, dominant marker as proposed by McCord (2014), thereby increasing the
number of usable markers. In JoinMap, only simplex marker alleles could be

132
used due to the 1:1 diploid like segregation behavior at a heterozygous locus
(1000 x 0000), whereas TetraploidMap could use 1:1 and 1:5 (i.e. duplex, 1100 x
0000) markers. This explains the larger number of markers used with
TetraploidMap compared to JoinMap (133 vs. 83 for P1 and 136 vs. 95 for P2,
Table 5.1). Simplex and, to a lower extent, also duplex markers are considered to
be the most informative ones because they allow the detection of crossing over
events (Fig 5.6). Markers with 3:1 segregation (1000 simplex state in both
parents) could only be used as anchor markers for a final merge of the two
parental maps into one map but, apart from that, are less informative (Julier et
al. 2003; Hackett et al. 2007; Stein et al. 2007).
The size of our F1 mapping population was comparably small due to a high
number of S1 progenies haven arisen from self-fertilization, an issue so far
unknown in sainfoin, and a relatively poor seed set. For future development of
linkage maps in sainfoin, it is advisable to drastically increase the size of the F1
mapping population for a better detection of recombination events, what might be
reached via synchronization of flowering time between parental plants.
Alternatively, it may be also considered to have multiple F1 full-sib families, so
that markers that do not segregate in one parent may be segregating in another
parent. This approach was aimed in our study, but had to be abandoned due to
the high amount of inbred offspring reducing the number of plants usable for
linkage mapping in other populations. Such maps could then be merged using
markers showing a 1:3 segregation ratio as explained above. The use of other
populations than F1 might be also promising, as these do regularly involve a
larger amount of crossing over events. For example, F2 populations may be
produced from (partially) inbred parental plants which is feasible in sainfoin
(Kempf et al. 2015), whereby the approach of multiple families could also be used
for this type of population. A further step could be the development of a physical
map after establishment of a reference genome. This would require a largely
increased input, but might be more successful in case of a high percentage of
multivalent pairing and other factors impeding genetic mapping in sainfoin.

133
Fig 5.6 Illustration of information content for two dominant markers M1 and M2 (1 for presence,
0 for absence of allele) if both of them are in a) simplex, b) duplex and c) triplex state. A
recombination event (crossing over, assuming bivalent chromosome pairing) might be effective
(e.g., 1 replaced by 0 or 0 replaced by 1) or non-effective (1 replaced by 1 or 0 replaced by 0),
whereby the proportion of effective recombinations differs dependent on the marker state (e.g.
50% for simplex and triplex, 66.6% for duplex). If an effective recombination between markers M1
and M2 has happened, the chance of detecting this effective recombination event in the offspring
from mating with a nulliplex (0000) parent also depends on the marker state (e.g., 66.6% for
simplex, 33.3% for duplex and 0% for triplex markers). The product of the chance of having an
effective recombination and the chance of detecting this effective recombination event is
representative for the information content, being highest for a) simplex markers (e.g. 50% x 66.6%
= 33.3%), intermediate for b) duplex markers (e.g. 66.6% x 33.3% = 22.2%) an zero for triplex
markers (e.g. 50% x 0% = 0%).

134
Chapter 6 General Discussion

135
Sainfoin is underrepresented in today’s agriculture, despite its undeniable value
as an animal health promoting forage crop and its suitability for environments
with low water and nutrient availability. This underrepresentation is also
noticeable in plant breeding, with only few varieties available and a stagnant
number of new ones coming to the market. The knowledge base for breeding
sainfoin is limited with only marginal information about its genetics and
inheritance of different traits available. The few genetic studies conducted so far
did not support an increase of sainfoin breeding activities and further efforts are
missing. However, a close interaction between research and applied breeding is
vital for the success in genetic progress and cultivation of an agricultural species.
Future studies must, thus, be aimed at answering questions and support
approaches related to sainfoin breeding. Therefore, the main aim of our study
was to fill knowledge gaps related to the mode of reproduction and to provide
molecular tools relevant for improvement of sainfoin.
The results of the present study delivered a valid proof of the possibility of self-
fertilization in sainfoin to high numbers and the co-occurrence of inbreeding
depression, namely for seed yield and plant vigor. In contrast to earlier studies
dealing with inbreeding in sainfoin (Knipe and Carleton 1972; Demdoum 2012),
these results are based on molecular markers of a dominant (sequence related
amplified polymorphism, SRAP) and co-dominant (single sequence repeat, SSR)
type that were applied in different populations established through insect
pollination. Thereby, conditions favoring self-fertilization, i.e., limited availability
of flowers from the same plant as present under artificially directed pollinations
(chapter 2), or reducing self-fertilization, i.e., abundant flowers as present under
non-directed pollinations, could be identified. This information completes earlier
studies dealing with self-fertilization in sainfoin and can be used to optimize
conventional breeding methods or to implement hybrid breeding systems that
require the development of inbred lines.
To boost genetic studies, 101 recently developed, species specific co-dominant
SSR markers were tested for their applicability in sainfoin by measuring allelic
diversity in a pool of sainfoin plants from different origins (chapter 3). These SSR
markers, together with dominant SRAP markers, proved also to be suitable for
the use in genetic association studies, as trait associated markers (TAM) were

136
detected for vigor related traits (seed yield, plant height, plant vigor) and one
relevant chemical compound in a biparental F1 mapping population of 122
individuals (chapter 4). Finally, creation of a linkage map was tackled using the
above mentioned F1 population and markers, whereby the two software programs
TetraploidMap and JoinMap were tested to account for an auto- and
allotetraploid character of sainfoin, respectively. However, due to a limited
statistical power of the single mapping population, no accurate linkage map could
be established, and no indication for the best software to be used of linkage
mapping in sainfoin can yet be given (chapter 5).
6.1 Breeding opportunities in sainfoin
6.1.1 Self-fertilization and breeding systems
The high numbers of self-fertilization (48.5 to 64.8%) in our three biparental
populations (populations derived from artificial derived pollination: ADP, chapter
2) suggested that inbreeding is not necessarily a rare event in sainfoin. The
presence of a self-incompatibility system as proposed by Tasei (1984) can,
therefore, be negated. The accompanied inbreeding depression in offspring
originating from self-fertilization (hereafter denoted as selfings) compared to
offspring origination from cross-fertilization (hereafter denoted as crossings) was
strongest for seed yield with reductions of up to 79.1%. This information is of
significance, because inbreeding has to be avoided in classical population
varieties in order to increase seed yield and performance of individuals. So far,
sainfoin was bred based on methods for outbreeding species with population or
synthetic varieties as the final product. Reducing self-fertilization and, hence,
inbreeding would especially be important when performing a polycross, i.e., the
isolated pollination among a limited number of clonally multiplied elite plants for
the production of base seeds of a synthetic variety (Posselt 2010). Our results
from inbreeding in naturally directed pollinations lead to the suggestion that,
with presence of a sufficiently large number of pollinators and mature flowers
from different plants, the rate of self-fertilization (up to 3.9%) is negligible.
Hence, if the size (number of different elite genotypes) of a polycross is not chosen
137
drastically small and flowering time is synchronous among the different
genotypes, efficient cross-fertilization can, although a strict self-incompatibility
system is missing, be assured. In classical polycrosses for forage plants, the
number of different genotypes is chosen from 4 to 10 genotypes in replicate
numbers of the same range (Humphreys 2000). However, taking into account low
seed yields and the limited potential to clonally propagate single genotypes, to
assure efficient cross-fertilization and harvest sufficient seeds it might be
necessary to slightly increase this number of genotypes per polycross in case of
sainfoin. This is crucial because avoiding inbreeding by emasculation of maternal
plants in sainfoin is less promising (De Vicente and Arus 1996) and a male
sterility system is not established.
Nevertheless, realization of self-fertilization in sainfoin can also be of advantage.
For example, it is a necessary prerequisite for the production of inbred lines,
enabling hybrid breeding systems where two distinct inbred lines of different
heterotic pools are crossed to benefit from the hybrid effect in the F1 progeny, also
known as heterosis (Becker 1993). For sainfoin, hybrid breeding was not
considered so far, but it is already aspired for other forage plants like perennial
ryegrass (Lolium perenne), switchgrass (Panicum virgatum) and red clover
(Trifolium pratense, Riday and Krohn 2010a; Aguirre et al. 2012). Self-
fertilization for inbred line development is impeded in most forage plants due to
the existence of a genetic self-incompatibility system (Posselt 2010). However,
based on our results, this does not apply for sainfoin. If self-fertilization and,
consequently, inbreeding is aimed for sainfoin, precautions as presented for ADP
populations (chapter 2) must be undertaken to technically enable a hybrid
system. If possible, plants designated for self-fertilization could be clonally
multiplied in order to increase the number of flowers and, therefore, the chance
of successful seed set. These clones would then be subjected to isolated
pollination by bumble bees, whereby this process could be repeated for several
generations. After production of partially or completely inbred lines, open
pollination among these ones with good combining ability among each other could
be performed, whereby the predominantly outcrossing fertilization pattern with
availability of abundant flowers as observed in NDP populations would
preferably results in a high proportion of F1 hybrid seeds.

138
Yet, we have proven that one generation of inbreeding can be performed without
problems, achieving viable S1 offspring. However, inbreeding depression might
hamper further advanced inbred generations. The observed inbreeding
depression in S1 plants observed for seed yield and general plant vigor in our
experiment was remarkable, especially considering that in autotetraploids, the
proportion of fully homozygous loci increases 2.8 to 3.9-fold (depending on
tetrasomic or disomic inheritance) slower than in diploids (Bever and Felber
1992), i.e., can be assumed to be still small in S1 plants. This early inbreeding
depression could be consequence of a very strong genetic load (accumulation of
deleterious alleles) and/or the loss of complementary gene interactions that is
more severe during early generations of inbreeding (Bingham et al. 1994). If the
later would have been the predominant cause of observed inbreeding depression
and taking into account that S1 plants with sufficiently large seed yield were
obtained in this study, production of advanced inbred generations would be a
feasible option. Furthermore, the problem of inbreeding depression could also be
mitigated by choosing different parental material, since we found significant
differences in inbreeding depression dependent on population and parent (P >
0.001). Overcoming inbreeding depression by careful selection of parental plants
is current practice for today’s economically important crops species like maize
and alfalfa by improving heterogenic groups, inbred lines and selection of
partners with best combining abilities (Argillier et al. 2000; Bhandari et al.
2007).
However, even if a hybrid breeding system would be technically possible, the
decision for its implementation in sainfoin must be weighed against its economic
gain. Due to the observed inbreeding depression for seed yield (chapter 2), seed
multiplication factors during production of parental lines of the potential F1
hybrid can be expected to be low. Hence, the consumer would have to pay even
higher prices than for the already expensive seeds of conventional varieties. The
market for sainfoin must increase considerably to justify the labor and costs
coherent with development of hybrid varieties, which could last 10 years or more
(Becker 1993). With sainfoin being a species being suitable for marginal areas,
this would barely be the case.

139
In addition to a hypothetical hybrid breeding system, the possibility of inbreeding
offers purging populations from deleterious alleles. The phenomenon of purging
was already discovered by Darwin (1876) when observing plant generations
suffering inbreeding depression for traits after initial cycles of inbreeding, but
with a re-improvement after continued inbreeding. During first cycles of
inbreeding, individual plants getting homozygous for deleterious alleles could die
or fail in reproduction, successively eradicating those alleles from the population
(Crnokrak and Barrett 2002). Differences in purging could be expected dependent
on the effect of the deleterious allele, whereby alleles with a large effect are
supposed to vanish faster in contrast to alleles with smaller effects (Wang et al.
1999). There is no information of targeted purging by repeated inbreeding in
breeding populations, but the results of inbreeding depression from comparisons
between self-compatible and self-incompatible natural populations of different
plant species showed that inbreeding depression is higher in self-incompatible
plants than in self-compatible plants, the latter already having experienced
eradicated of deleterious alleles to some degree (Busch 2005). Hence, purging
would be a valuable option for the predominantly outbreeding species sainfoin.
To the best of my knowledge, no information of successful purging using classical
self-fertilization is available for cultivated crops. However, examples of successful
purging are available from maize breeding programs using the so-called doubled
haploid technology, a method in which fully inbred offspring can be obtained in
vivo within one generation (Roeber et al. 2005; Strigens et al. 2013).
6.1.2. Breeding for animal health
The presence of secondary metabolites (thereunder polyphenolic compounds) in
sainfoin is a motivating factor to cultivate sainfoin for use as animal forage due
to its effectiveness supporting animal health and welfare (chapter 1). Our study
wanted to assist sainfoin breeding also by providing molecular tools for the
selection of desired chemical properties. Encouraging breeding activities to select
for chemical compounds raised the question if and how those beneficial
compounds could be influenced and changed by plant breeding. Breeding for
generally higher concentrations of supposedly beneficial compounds would be
injudicious without knowledge about the effectiveness of the single compounds,

140
their interactions and the optimum dose to obtain positive effects. Overall, the
phenolic profile of sainfoin is highly complex and wide variations for composition
and concentrations could be identified between individuals of the same variety
(Regos et al. 2009). The effects of those secondary metabolites of sainfoin with
respect to composition, concentration and structure were determined in animal
studies showing complex effects and interactions (reviewed in Mueller-Harvey
2006). In studies dealing with anthelmintic properties of sainfoin, it was
demonstrated that larger polymer sizes of condensed tannins and higher
amounts of prodelphinidins caused a reduction of one worm species (Haemonchus
contortus) in sheep, whereas another worm species (Trichostrongylus
colubriformis) responded only to higher prodelphinidin concentrations (Quijada
et al. 2015). Consequently, condensed tannins have different modes of action
against different parasites. A multicausal mode of action of tannins was also
reported for reduction of methane gas emissions in vitro, with no effect of
prodelphinidin concentration, but a linear reduction with increasing levels of
condensed tannins in total and, moreover, with increased molecule size of
condensed tannins (Saminathan et al. 2015; Hatew et al. 2016). Furthermore,
effects observed within one variety or species are not always transferable to other
varieties or species, respectively, underlining the highly complex and interactive
modes of action of the different compounds.
These results indicate that breeding exclusively for high condensed tannins
concentrations in sainfoin does not consequently exploit the full animal health
promoting potential of sainfoin. As synthesis from literature indicates, larger
molecule sizes and higher shares of prodelphinidins on total condensed tannins
are desirable. However, the respective effectiveness may vary dependent on area
of operation e.g. anthelmintic effect, methane gas reduction, bloat prevention and
better protein utilization.
Selection of parents for new varieties with higher prodelphinidin shares could be
supported by marker assisted selection, as we found one trait associated marker
(TAM) for prodelphinidin share. Total condensed tannin content is correlated to
prodelphinidin share and, therefore, could be improved simultaneously (chapter
4). However, this TAM has its limitations because its occurrence (by the presence
of the SRAP marker allele) is population dependent. Populations established with

141
the same genoytpes as used in the present study could feature this allele,
whereas other genotypes might miss it. Furthermore, the inheritance of tannins
has to be studied in detail, due to controversial information from the literature.
Dominant gene action for inheritance of tannins was suggested for birdsfoot
trefoil (Lotus corniculatus, Dalrymple et al. 1984), common bean (Phaseolus
vulgaris, Ma and Bliss 1977) and fababean (Vicia faba, Crofts et al. 1980).
Dominant inheritance pattern was also found for tannin composition, i.e., PD-
share and chain length of the molecule in F1 hybrids of poplar (Populus
angustifolia and Populus fremontii, Scioneaux et al. 2011). Contrastingly, other
authors reported predominantly additive gene action for inheritance of tannin
concentrations in birdsfoot trefoil (Miller and Ehlke 1997) and cotton (Gossypium
hirsutum, White 1982). Hence, trait inheritance seems to be dependent on the
plant material investigated, calling for further studies investigating inheritance
of tannin related traits in sainfoin.
Despite the proof of effectiveness of condensed tannins for animal health, also
non-tannin polyphenols have positive effects in sainfoin and, therefore, represent
potential breeding targets. Anthelmintic properties could be demonstrated at
relatively low concentrations of the two flavonol glyocosides rutin and narcissin
(Barrau et al. 2005). Rutin belongs to the polyphenolic compound group
quercetin, a flavonol, and was correlated to total quercetin concentrations in our
dataset with Pearson’s correlation coefficient of r = 0.99 (chapter 4, data not
shown). This relationship makes selection for higher total quercetin
concentrations a reasonable target. Generally, flavonols and their glycosides like
quercetin, myricetin and gallic acid are characterized as antioxidants, which
could be proven in several studies related to human nutrition (Noroozi et al.
1998; Liu 2004; Yao et al. 2004). However, information about the effectiveness of
those substances in sainfoin extracts and the optimum concentrations are scarce.
Therefore, future definition of breeding aims regarding sainfoin compounds is
only possible by tight collaboration with animal scientist.

142
6.2 Future research tasks
6.2.1 Origin of polyploidy
To understand further parameters influencing plant performance, it will be
necessary to clarify whether sainfoin is of allo- or autotetraploid origin. This
knowledge is far-reaching, because it provides information about the possibility
to retrieve desired gene combinations after crossing or selfing. The relevant
difference in parent to offspring gene transfer via gametes in allotetraploid
(polyploidy due to hybridization of two diploid ancestor genomes) and
autotetraploid (polyploidy arising from a diploid ancestor genome) species
happens in meiosis. During meiosis, gene recombination takes places due to non-
paternal chromosome combinations in newly formed gametes and by crossing
over events, i.e., the exchange of chromosome segments during metaphase. In
allotetraploids, bivalent chromosome pairing and crossing over only occurs
between the two homologous chromosomes (chromosomes from the same diploid
ancestor species) and barely between homeologous chromosomes (chromosomes
from different diploid ancestors), resulting in a so-called disomic behavior
(Butruille and Boiteux 2000). In autotetraploids, more than two homologous
chromosomes can pair at meisosis (multivalent chromosome pairing), resulting in
a so-called polysomic behavior, where more possibilities for gene recombination
exists (Otto 2007). For breeding a direct consequence would be that under
polysomic inheritance fewer homozygotes would be produced in one generation
than under disomic inheritance (Hancock 2012). This complicates the fixation of
desired genes in the genome under polysomic inheritance.
However, many plant species exhibit a mixture of polysomic and disomic
inheritance. The origin of ploidy and preponderance of disomic or polysomic
recombination patterns could be investigated using microscope observations of
chromosome arrangements during metaphase (Singh and Hymowitz 1985;
Jackson and Hauber 1994). This approach was conducted related to the present
study in immature anthers of single sainfoin individuals and revealed the
presence of bivalent (occurring in allo- and autotetraploids, disomic inheritance)

143
as well as quadrivalent (occurring in autotetraploids, polysomic inheritance)
formations (Fig.6.1, David Kopecký, personal communication, 2015).
Fig. 6.1 Chromosome arrangement in sainfoin during metaphase 1 of meiosis in immature
sainfoin anthers (David Kopecký, personal communication, 2015)
Nevertheless, a final determination of allo- or autotetraploidy in sainfoin is
difficult. Bivalent formation could also occur preferentially in autotetraploids as
shown for potato (Bourke et al. 2015). Contrastingly, quadrivalent formation also
exists in allotetraploids derived from two close ancestor species and due to strong
analogy of homeologous chromosomes (Sybenga 1996). Analyzing large panels of
individuals under the microscope would allow for an insight into potential
mechanisms of gene recombination in sainfoin. Alternatively to chromosome
observations, co-dominant marker genotypes from selfings of different sainfoin
individuals could be investigated according to proposed ratios for either disomic
or polysomic (tetrasomic in tetraploids) inheritance by De Vicente and Arus
(1996) due to allelic differences in gamete formation (Fig. 6.2, Comai 2005).

144
Fig. 6.2 Gamete formation in allo- and autotetraploids taken from Comai (2005)
Here, co-dominant markers have to be quadriallelic (ABCD), triallelic (e.g.
AABC) or diallelic (e.g. AABB) in the parental plant to be informative. SSR
markers characterized in the present study (Mora-Ortiz et al. 2016) could be a
valuable source for such marker genotype assessments in larger groups of
sainfoin individuals. The assessment of disomic or tetrasomic segregation by co-
dominant markers would also be possible in crossings from two parents sharing
no or only one allele at a gene locus (Pairon and Jacquemart 2005). Knowledge
about disomic or tetrasomic inheritance of the markers identified in our study
could also be directly used for selection of suitable markers for linkage mapping,
as marker loci showing disomic inheritance (bivalent pairing) will not exhibit
double reduction. Because allele dosages of co-dominant SSR markers could not
be estimated due to highly variable DNA concentrations and possible differences

145
between samples due to efficiency of the PCR (see below), inferences on the type
of segregation pattern could not be performed in this study.
6.2.2 DNA extraction and marker analysis in sainfoin
The present study demonstrated the usefulness of molecular marker assessments
in sainfoin to answer questions regarding parenthood, diversity patterns and to
identify trait associated markers (TAM). Extracting DNA for those studies from
sainfoin was sufficiently feasible with the commercial extraction Kit illustraTM
DNA Extraction Kit PHYTOPURE (GE Healthcare, Little Chalfont
Buckinghamshire, United Kingdom) as advised by Hayot Carbonero (2011) . In
the present thesis, DNA was extracted from freeze dried material stored in the
dark at room temperature with silica gel to prevent moistening. After grinding
freeze dried material, DNA extraction yielded highly variable DNA
concentrations, ranging from 1000 to 10 000 ng DNA in 20 mg plant material as
measured by gel band intensity. Up to 20 fold differences in DNA concentrations
were also found by Hayot Carbonero (2011). The reasons for this varying DNA
yields might be due to the presence of condensed tannins and other polyphenols
which are known to hamper DNA extraction in plants rich in these compounds
such as cotton (Katterman and Shattuck 1983). Despite varying DNA
concentrations, the DNA quality was sufficient for amplification of SRAP and
SSR marker loci during fragment analysis with distinguishable peak patterns. To
increase DNA yields and to simplify DNA extraction, it is advised to sample fresh
leaf material, freeze it immediately with liquid nitrogen followed by freeze drying
for 48h. The freeze dried material should be ground directly and be stored at
minus -20 °C until DNA extraction. Extraction from plant material stored under
this conditions over three years reached DNA yields which were more
homogenous with 3500 ng to 5500 ng in 20 mg freeze dried plant material.
SSR marker amplification provided reliable peak patterns in fragment analysis
in our study, but had to be repeated in some samples due to the occurrence of
stutter peaks. Stutter peaks (or stutter alleles) are peaks differing by one or more
repeat units to the original peak and occur due to polymerase slippage during
PCR elongation of the synthetized strand (Hauge and Litt 1993; Walsh et al.
1996). In such cases it is crucial to differentiate the stutter peak from the actual

146
peak to avoid false genotyping results, which would have fatal consequences if
allelic diversity has to be estimated. The intensity of such bands increases with
degradation of the DNA and the peak signal during fragment analysis could be
higher than the original signal. However, if several PCR are run on the same
sample, the mentioned problem does not necessarily affect every amplification
product (Schmerer 2003). In such cases, it is reasonable to repeat the analysis or,
alternatively, replicates should be incorporated for each sample. In some cases
sequencing of the loci might be also appropriate to know which allele could be
expected. The occurrence of signals with only one base pair difference to the
supposed repeat size also blurred the SSR fragment analysis in some of our
samples, especially in case of two base pair motifs. This occurred due to non-
templated addition of a nucleotide to the newly synthetized product, a problem
that could be solved in future studies by primers modified with a sequence
impeding base pair addition (PIG-tailing, Brownstein et al. 1996).
Improvement of DNA quality and quantity, together with optimized conditions
for PCR are also necessary to enhance confidence of peak patterns during
fragment analysis, what might allow identification of the different allele doses
amplified by dominant SRAP markers and co-dominant SSR markers by peak
size (Qiang et al. 2015). In the present study, allele dose could not be inferred, as
the peak sizes from fragment analysis were highly variable over all samples. For
inferring the allele dose by peak size intensity, the quality of the experimental
data must be high over all samples, e.g., by equal yields of the PCR product
overall samples, exclusive amplification of the target sequence and very few
errors by polymerase (Cha and Thilly 1995). The occurrence of stutter alleles also
hinders the inference of the allele dose (Esselink et al. 2004), what was the case
for some samples used in our study. Furthermore, incorporation of standard
samples with known allele doses would enable a better estimation of the allele
doses of non-characterized samples. Knowing the allele dose of SSR markers
would bear several advantages. Regarding diversity studies, polymorphism
information content (PIC) values could be calculated directly on inferred allele
frequencies for the complete marker instead of separate calculation for each
single dominant coded allele as performed in chapter 3. For linkage mapping,
availability of allele frequencies would allow to fully exploit the higher

147
information content of the co-dominant markers. In the case of autotetraploid
origin of sainfoin, the knowledge of the allele dose at a locus would allow for the
assignment of alleles to the different homologous chromosomes of each
chromosome (Hackett et al. 2007).
6.2.3 Towards marker assisted breeding in sainfoin
With testing and application of newly developed, sainfoin specific SSR marker
and the proof of usability of dominant SRAP markers in the present study, a door
has been opened for linkage mapping and QTL studies in sainfoin. Trait
associated markers (TAM) for vigor related traits, seed yield and prodelphinidin-
share have been identified in crossings of one biparental sainfoin population by
simple marker regression methods (chapter 4). These TAM display a first step
towards marker assisted selection (MAS) in sainfoin. Hereinafter, linkage
mapping was conducted using two software packages: JoinMap addressing a
potential allotetraploid character of sainfoin and TetraploidMap taking possible
autotetraploidy into account. 14 linkage groups were anticipated for JoinMap
(referring to the sum of haploid chromosomes of two diploid ancestor species) and
7 linkage groups for TetraploidMap (the number of haploid chromosomes in the
single diploid ancestor species). Linkage maps provided by both software showed
tendencies of marker assignments to single groups, but failed to reach the full
coverage of all possible linkage groups. However, tracing the TAM found in our
study (chapter 4) in the linkage maps established by JoinMap and TetraploidMap
software, showed that at least some could be recovered in single linkage groups
calculated with TetraploidMap. Five markers associated with plant height and
seed yield (Fig 4.6, OVK063_191, Me1Em1_175, OVK133_205, Me1Em1_299 and
OVK111_223) were identified in linkage group 2 of parent 1. The two of these
markers showing the largest distance were 4.9 cM apart from each other,
indicating that these markers are located actually on the same region of a
linkage group. Additionally, one single marker for share of prodelphinidins was
located on linkage group 2, but with a smallest distance of 22.5 cM to the closest
neighboring marker from the above mentioned group. The close distance of the
TAM on linkage group 2 of parent 1 could lead to the suggestion that those
markers are associated with the same single QTL. However, in red clover

148
(Trifolium pratense) it could be shown that up to five different QTL for seed yield
were located at a distance of 10 cM and QTL of highly correlated traits (r = 0.95)
were located at distances of 1 cM (Herrmann et al. 2006). For seed yield in
perennial ryegrass (Lolium perenne), two markers were considered being
associated with the same QTL at a distance of 0.4 cM (Studer et al. 2008). Yet,
due to the low confidence of our linkage map, it is difficult to deduce the
affiliation of different markers to certain QTL by comparing to results from other
studies that are based on more confident linkage maps. The establishment of a
more precise linkage map based on alternative populations as discussed within
chapter 5 will, therefore, be essential. Concluding, combining such proposed
approaches with optimized protocols for DNA handling and marker screening is
necessary to further advance breeding and breeding research in a non-model
species like sainfoin.
6.3 Conclusion
This thesis gave new insights in the biology of sainfoin by clarifying its
reproduction system that was formerly considered as strongly cross pollinated.
We confirmed the possibility of self-fertilization via insect pollination in
biparental populations established in the greenhouse and field-grown natural
sainfoin populations for the first time on the basis of dominant and co-dominant
molecular markers. The rates of inbreeding due to successful self-fertilization
were high in biparental populations, whereas they could be neglected in field-
grown natural populations (chapter 2). We concluded that high inbreeding rates
are possible by restriction of foreign pollen and reduced insect pollinators.
Inbreeding depression was visible in biparental populations by decreased
performance of seed yield, plant height and general plant vigor. These results
have to be kept in mind by planning new breeding strategies for sainfoin if
outbreeding or inbreeding is desired. Additionally, we were able to test sainfoin
specific co-dominant SSR marker which display allelic polymorphisms between
sainfoin plants of different origin (chapter 3). Those markers detected the
presence of two clusters of sainfoin plants dependent on its geographical origin

149
leading to the assumption of the existence of different genepools in sainfoin.
Thereafter, a set of these newly available SSR markers was amplified in offspring
from cross-pollination from one biparental population to detect marker trait
associations (chapter 4). Such marker trait associations were detected for plant
height, seed yield, vigor and one chemical compound. Additionally, correlations
between those markers might point to the existence of two QTL for those traits.
Furthermore, the establishment of a linkage map and localization of these QTLs
was limited due to clustering of most markers to only one linkage group (chapter
5).

150
References
Acharya SN (2015) ACC Mountainview sainfoin (Onobrychis viciifolia subsp.
Viciifolia). Can J Plant Sci 95:603-607
Agrarökonomie (2006) Feldfutterbau und Gründünung im Ökologischen
Landbau. Informationen für Praxis und Beratung. Sächsische
Landesanstalt für Landwirtschaft, Dresden, Germany
Agridea (2012) Esparsette reich an kondensierten Tanninen.1-3
Agroscope (2009) Zusammensetzung der von Agroscope empfohlenen
Samenmischungen für Brachen. http://www.agroscope.admin.ch/
oekologischer-ausgleich/index.html?lang=de. Accessed 10.05 2016
Aguirre AA, Studer B, Frei U, Luebberstedt T (2012) Prospects for Hybrid
Breeding in Bioenergy Grasses. Bioenerg Res 5 (1):10-19
Akopian JA (2009) On some wild relatives of cultivated sainfoin (Onobrychis L.)
from the flora of Armenia. Crop wild relative (7):17-18
Alonso-Blanco C, Blankestijn-de Vries H, Hanhart CJ, Koornneef M (1999)
Natural allelic variation at seed size loci in relation to other life history
traits of Arabidopsis thaliana. Proc Nat Acad Sci U S A 96 (8):4710-4717
Andorf CM, Cannon EK, Portwood JL, II, Gardiner JM, Harper LC, Schaeffer
ML, Braun BL, Campbell DA, Vinnakota AG, Sribalusu VV, Huerta M,
Cho KT, Wimalanathan K, Richter JD, Mauch ED, Rao BS, Birkett SM,
Sen TZ, Lawrence-Dill CJ (2016) MaizeGDB update: new tools, data and
interface for the maize model organism database. Nucl Acids Res 44
(D1):D1195-D1201
Argillier O, Mechin V, Barriere Y (2000) Inbred line evaluation and breeding for
digestibility-related traits in forage maize. Crop Sci 40 (6):1596-1600
Armstead IP, Turner LB, King IP, Cairns AJ, Humphreys MO (2002) Comparison
and integration of genetic maps generated from F2 and BC1-type mapping
populations in perennial ryegrass. Plant Breed 121 (6):501-507
Aufrere J, Dudilieu M, Poncet C (2008) In vivo and in situ measurements of the
digestive characteristics of sainfoin in comparison with lucerne fed to
sheep as fresh forages at two growth stages and as hay. Animal 2 (9):1331-
1339

151
Aulchenko YS, Ripke S, Isaacs A, Van Duijn CM (2007) GenABEL: an R library
for genome-wide association analysis. Bioinformatics 23 (10):1294-1296
Auld DL, Ditterline RL, Mathre DE (1977) Screening sainfoin for resistance to
root and crown rot caused by Fusarium solani (Mart.) Appel and Wr. Crop
Sci 17:69-73
Avci S (2014) Analysis of Onobrychis genetic diversity using SSR markers from
related legume species. J Anim Plant Sci 24 (2):11
Avci S, Cocu S, Aasim M, Sancak C, Ozcan S (2010) Effects of treating with auxin
solutions on rooting of cuttings of sainfoin (Onobrychis viciifolia). Trop
Grassl 44:123-127
Azuhnwi BN, Boller B, Martens M, Dohme-Meier F, Ampuero S, Guenter S,
Kreuzer M, Hess HD (2011) Morphology, tannin concentration and forage
value of 15 swiss accessions of sainfoin (Onobrychis viciifolia Scop.) as
influenced by harvest time and cultivation site. Grass Forage Sci 66
(4):474-487
Azuhnwi BN, Thomann B, Arrigo Y, Boller B, Hess HD, Kreuzer M, Dohme-
Meier F (2012) Ruminal dry matter and crude protein degradation kinetics
of five sainfoin (Onobrychis viciifolia Scop) accessions differing in
condensed tannin content and obtained from different harvests. Anim Feed
Sci Technol 177 (3-4):135-143
Badoux S (1964) Etude des caractères morphologiques, physiologiques et
agronomiques de populations d' esparcette (Onobrychis spp.). PhD thesis,
ETH Zurich, Zurich, Switzerland
Barrau E, Fabre N, Fouraste I, Hoste H (2005) Effect of bioactive compounds
from Sainfoin (Onobrychis viciifolia Scop.) on the in vitro larval migration
of Haemonchus contortus: role of tannins and flavonol glycosides.
Parasitology 131:531-538
Barrett B, Baird I, Woodfield D (2009) White clover seed yield: a case study in
marker-assisted selection. In: Yamada T, Spangenberg G (eds) Molecular
Breeding of Forage and Turf. Springer Science + Business Media, New
York, USA, pp 241-250
Bean EW, Yok-Hwa C (1972) An analysis of the growth of inbred progeny of
Lolium. J Agric Sci 79 (01):147-153

152
Becker H (1993) Pflanzenzüchtung. Eugen Ulmer Velag, Stuttgart, Germany
Bell GDH (1948) Cultivated plants of the farm. The University Press, New York,
USA
Bennett SJ, Francis C, Reid B (2001) Minor and Under-utilised Legumes. In:
Maxted N, Bennett SJ (eds) Plant Genetic Resources of Legumes in the
Mediterranean. Kluwer Academic Publishers, Dordrecht, The Netherlands,
pp 219-220
Bever JD, Felber F (1992) The theoretical population genetics of autopolyploidy.
In: Futuyma D, Antonovics (eds) Oxf Surv Evol Biol, vol 8. Oxford
University Press, NewYork, USA
BfN (2013) FloraWeb - Daten und Informationen zu Wildpflanzen und zur
Vegetation Deutschlands. Bundesamt für Naturschutz.
http://www.floraweb.de/webkarten/karte.html?taxnr=3912. Accessed 10.05
2016
Bhandari HS, Pierce CA, Murray LW, Ray IM (2007) Combining abilities and
heterosis for forage yield among high-yielding accessions of the alfalfa core
collection. Crop Sci 47 (2):665-673
Bingham ET, Groose RW, Woodfield DR, Kidwell KK (1994) Complementary
gene interactions in alfalfa are greater in autotetraploids than diploids.
Crop Sci 34 (4):823-829
Birchler JA (2013) Genetic Rules of Heterosis in Plants. In: Chen Z.J. and J.A.
Birchler (eds). Polyploid and Hybrid Genomics. John Wiley & Sons Imc,
Oxford, United Kingdom
Blakeslee AF, Avery AG (1937) Methods of inducing doubling of chromosomes in
plant. J Hered 28 (12):393-411
Boller B, Günter S (2009) Die Erhaltung der Esparsette (Onobrychis viciifolia)
NAP 03-38. Agroscope ISS, Eric Schweizer AG, Winterthur, Switzerland
Botstein D, White RL, Skolnick M, Davis RW (1980) Construction of a genetic
linkage map in man using restriction fragment length polymorphisms. The
Am J Hum Genet 32:314-331
Bouchez A, Hospital F, Causse M, Gallais A, Charcosset A (2002) Marker-
assisted introgression of favorable alleles at quantitative trait loci between
maize elite lines. Genetics 162 (4):1945-1959

153
Bourke PM, Voorrips RE, Visser RGF, Maliepaard C (2015) The Double-
Reduction Landscape in Tetraploid Potato as Revealed by a High-Density
Linkage Map. Genetics 201 (3):853-NIL_894
Brazeau DA, Gleason DF, Morgan ME (1998) Self-fertilization in brooding
hermaphroditic Caribbean corals: Evidence from molecular markers. J Exp
Mar Biol Ecol 231 (2):225-238
Bretagnolle F, Lumaret R (1995) Bilateral polyploidization in Dactylis glomerata
L. subsp. lusitanica: Occurrence, morphological and genetic characteristics
of first polyploids. Euphytica 84 (3):197-207
Brownstein MJ, Carpten JD, Smith JR (1996) Modulation of non-templated
nucleotide addition by taq DNA polymerase: Primer modifications that
facilitate genotyping. BioTechniques 20 (6):1004-1006
Buckler ES, Holland JB, Bradbury PJ, Acharya CB, Brown PJ, Browne C, Ersoz
E, Flint-Garcia S, Garcia A, Glaubitz JC, Goodman MM, Harjes C, Guill K,
Kroon DE, Larsson S, Lepak NK, Li H, Mitchell SE, Pressoir G, Peiffer JA,
Rosas MO, Rocheford TR, Cinta Romay M, Romero S, Salvo S, Sanchez
Villeda H, da Silva HS, Sun Q, Tian F, Upadyayula N, Ware D, Yates H,
Yu J, Zhang Z, Kresovich S, McMullen MD (2009) The Genetic
Architecture of Maize Flowering Time. Science 325 (5941):714-718
Bueno ICS, Brandi RA, Franzolin R, Benetel G, Fagundes GM, Abdalla AL,
Louvandini H, Muir JP (2015) In vitro methane production and tolerance
to condensedtannins in five ruminant species. Anim Feed Sci Technol
205:1-9
Buerstmayr H, Lemmens M, Hartl L, Doldi L, Steiner B, Stierschneider M,
Ruckenbauer P (2002) Molecular mapping of QTLs for Fusarium head
blight resistance in spring wheat. I. Resistance to fungal spread (type II
resistance). Theor Appl Genet 104 (1):84-91
Burke JF (1840) North Hampshire. In: Burke JF (ed) British husbandry;
exhibiting the farming practice in various parts of the United Kingdom, vol
3. London Baldwin and Cradock, London, United Kingdom, p 596
Burton JC, Curley RL (1970) Nodulation and nitrogen fixation in sainfoin
(Onobrychis sativa, Lam.) as influenced by strains of rhizobia. Mont AES
Bull 627:3-5

154
Busch JW (2005) Inbreeding depression in self-incompatible and self-compatible
populations of Leavenworthia alabamica. Heredity 94 (2):159-165
Butler LG (1992) Antinutritional effects of condensed and hydrolyzable tannins.
In: Hemingway RW, Laks PE (eds) Plant Polyphenols, vol 59. Springer,
New York, USA, pp 693-698
Butruille DV, Boiteux LS (2000) Selection-mutation balance in polysomic
tetraploids: Impact of double reduction and gametophytic selection on the
frequency and subchromosomal localization of deleterious mutations. Proc
Natl Acad Sci U S A 97 (12):6608-6613
Calinski T, Harabasz J (1974) A dendrite method for cluster analysis. Commun
Stat 3 (1):1-27
Campbell TA (2000) Molecular analysis of genetic relatedness among alfalfa
clones differing in levels of self-incompatibility. Can J Plant Sci 80 (3):559-
564
Casey NM, Milbourne D, Barth S, Febrer M, Jenkins G, Abberton MT, Jones C,
Thorogood D (2010) The genetic location of the self-incompatibility locus in
white clover (Trifolium repens L.). Theor Appl Genet 121 (3):567-576
Cash D, Wichman D, Ditterline R (2010) Sainfoin is Making a comeback in the
21st Century. Bozeman, MT, USA
Castelli F, Contillo R, Miceli F (1996) Non-destructive determination of leaf
chlorophyll content in four crop species. J Agron Crop Sci 177 (4):275-283
Cha RS, Thilly WG (1995) Specificity, efficiency, and fidelity of PCR. Genome Res
3:S18-S29
Charlesworth D, Willis JH (2009) Fundamental concepts in genetics. The
genetics of inbreeding depression. Nat Rev Genet 10 (11):783-796
Chen H, Liu L, Wang L, Wang S, Somta P, Cheng X (2015) Development and
Validation of EST-SSR Markers from the Transcriptome of Adzuki Bean
(Vigna angularis). PLoS One 10 (7):1-14
Chen W-M, Abecasis GR (2007) Family-based association tests for genomewide
association scans. Am J Hum Genet 81 (5):913-926
Chorley P (1981) Early evidence of sainfoin cultivation around Paris. The Agr
Hist Rev 29:118-124

155
Clegg MT, Kobayashi M, Lin JZ (1999) The use of molecular markers in the
management and improvement of avocado (Persea americana Mill.).
Revista Chapingo Serie Horticultura 5:227-233
Collard BCY, Jahufer MZZ, Brouwer JB and Pang ECK (2005). An introduction
to markers, quantitative trait loci (QTL) mapping and marker-assisted
selection for crop improvement: The basic concepts. Euphytica 142:169-196
Comai L (2005) The advantages and disadvantages of being polyploid. Nat Rev
Genet 6 (11):836-846
Cornish MA, Hayward MD, Lawrence MJ (1979) Self-incompatibility in ryegrass
- 1. Genetic control in diploid Lolium perenne. Heredity 43 (1):95-106
Crnokrak P, Barrett SCH (2002) Perspective: Purging the genetic load: A review
of the experimental evidence. Evolution 56 (12):2347-2358
Crofts HJ, Evans LE, McVetty PBE (1980) Inheritance, characterization and
selection of tannin-free fababeans (Vicia faba L.). Can J Plant Sci 60
(4):1135-1140
Curtis T (1829) Rural Economics. In: sch Gh (ed) The London encyclopaedia, or,
Universal dictionary of science, art, literature, and practical mechanics, vol
27. Islington, United Kingdom, pp 124-125
Dalrymple EJ, Goplen BP, Howarth RE (1984) Inheritance of tannins in birdsfoot
trefoil. Crop Sci 24:921-923
Darwin C (1876) The effects of cross and self-fertilisation in the vegetable
kingdom. John Murray, London, United Kingdom
De Vicente MC, Arus P (1996) Tetrasomic inheritance of isozymes in sainfoin
(Onobrychis viciaefolia Scop.). J Hered 87 (1):54-62
Dechaine JM, Brock MT, Weinig C (2014) QTL architecture of reproductive
fitness characters in Brassica rapa. BMC Plant Biol 14:66-78
Delgado I, Andrés C, Munoz F (2008) Effect of the environmental conditions on
different morphological and agronomical characteristics of sainfoin.
Options Méditerranéennes, Series A 79:199-202
Demdoum S (2012) Caracterización agronómica, genética y composición quimica
de una colección de variedades de esparceta. PhD thesis, University of
Lleida, Lleida, Spain

156
Demdoum S, Munoz F, Delgado I, Valderrabano J, Wuensch A (2012) EST-SSR
cross-amplification and genetic similarity in Onobrychis genus. Genet
Resour Crop Evol 59 (2):253-260
Dentinho MTP, Belo AT, Bessa RJB (2014) Digestion, ruminal fermentation and
microbial nitrogensupply in sheep fed soybean meal treated with Cistus
ladanifer L. tannins. Small Ruminant Res 119:57-64
Doligez A, Bouquet A, Danglot Y, Lahogue F, Riaz S, Meredith CP, Edwards KJ,
This P (2002) Genetic mapping of grapevine (Vitis vinifera L.) applied to
the detection of QTLs for seedlessness and berry weight. Theor Appl Genet
105 (5):780-795
Dolstra O, Denneboom C, de Vos A, van Loo EN (2003) Marker-assisted selection
in improving quantitative traits of forage crops. In: Guimarães EP, Ruane
J, Scherf BD, Sonnino A, Dargie JD (eds) Marker Assisted Selection: A fast
track to increase genetic gain in plant and animal breeding? Proceedings of
an International workshop, Turin, 2003. Food and Agriculture
Organization of the United Nations (FAO), pp 1-5
Doyle CJ, Thomson DJ, Sheehy JE (1984) The future of sainfoin in British
agriculture: an economic assessment. Grass Forage Sci 39:43-51
Drevon JJ, Alkama N, Bargaz A, Rodino AP, Sungthongwises K, Zaman-Allah M
(2015) The Legume-Rhizobia Symbiosis. In: De Ron AM (ed) Grain
Legumes, vol 10. Springer, New York, USA, pp 267-290
Dzyubenko NI, Dzyubenko EA (2009) Interactive Agricultural Ecological Atlas of
Russia and Neighbouring Countries. AgroAtlas. http://www.agroatlas.ru/
en/content/cultural/Onobrychis_viciifolia_K/. Accessed 10.05 2016
Eding H, Meuwissen THE (2001) Marker-based estimates of between and within
population kinships for the conservation of genetic diversity. J Anim Breed
Genet 118 (3):141-159
Efron B (1979) Bootstrap methods: another look at the jackknife. Ann Stat 7
(1):1-26
Eken C, Demiri E, Dane E (2004) Species of Fusarium on sainfoin in Erzurum,
Turkey. N Z J Agric Res 47 (2):261-263

157
Elshire RJ, Glaubitz JC, Sun Q, Poland JA, Kawamoto K, Buckler ES, Mitchell
SE (2011) A Robust, Simple Genotyping-by-Sequencing (GBS) Approach
for High Diversity Species. PLoS One 6 (5):1-10
Engström MT, Palijarvi M, Fryganas C, Grabber JH, Mueller-Harvey I, Salminen
J-P (2014) Rapid Qualitative and Quantitative Analyses of
Proanthocyanidin Oligomers and Polymers by UPLC-MS/MS. J Agric Food
Chem 62 (15):3390-3399
Esselink GD, Nybom H, Vosman B (2004) Assignment of allelic configuration in
polyploids using the MAC-PR (microsatellite DNA allele counting-peak
ratios) method. Theor Appl Genet 109 (2):402-408
European Commission (2015) Plant variety catalogues & databases.
http://ec.europa.eu/food/plant/plant_propagation_material/plant_variety_ca
talogues_databases/index_en.htm. Accessed 10.05 2016
Faville M, Barrett B, Griffiths A, Schreiber M, Mercier C, Baird I, Ellison N,
Bryan G, Woodfield D, Forster J, Ong B, Sawbridge T, Spangenberg G,
Easton HS (2003) Implementing molecular marker technology in forage
improvement. Proc New Zeal Grassl Assoc 65:229-238
Feuerstein U (2012) Feinsamige Leguminosen. Züchtertreffen - Leguminosen.
Fleischmann R (1932) Züchtung von zwei neuen Futterpflanzen für
Trockengebiete. Der Züchter 4 (9):219-225
Forneris NS, Legarra A, Vitezica ZG, Tsuruta S, Aguilar I, Misztal I, Cantet RJC
(2015) Quality Control of Genotypes Using Heritability Estimates of Gene
Content at the Marker. Genetics 199 (3):675-681
Fortune JA (1985) A study of growth and management of sainfoin (Onobrychis
viciifolia Scop.). PhD Thesis, Massey University, Palmerston North, New
Zealand
Frame J, Charlton JFL, Laidlaw AS (1998) Alsike clover and sainfoin. In: J.
Frame, J. F. L. Charlton, and A. S. Laidlaw (ed) Temperate forage
legumes. CAB International, University of Wisconsin, Madison, USA, pp
279-289
Frankham R, Ballou J, Briscoe DA (2010) Introduction to conservation genetics.
Cambridge University Press, Cambridge, United Kingdom
Fyfe JL (1946) Polyploidy in Sainfoin. Nature 158:418

158
Gallais A (1984) An analysis of heterosis vs. inbredding effects with an
autotetraploid cross-fertilized plant: Medicago sativa L. Genetics 106
(1):123-137
Gallais A (2003) Quantitative genetics and breeding methods in autopolyploid
plants. INRA Editions (ed), Paris, France
Galloway LF, Etterson JR (2007) Inbreeding depression in an autotetraploid
herb: a three cohort field study. New Phytol 173 (2):383-392
Gar O, Sargent DJ, Tsai C-J, Pleban T, Shalev G, Byrne DH, Zamir D (2011) An
Autotetraploid Linkage Map of Rose (Rosa hybrida) Validated Using the
Strawberry (Fragaria vesca) Genome Sequence. PLoS One 6 (5):1-13
Gaujour E, Amiaud B, Mignolet C, Plantureux S (2012) Factors and processes
affecting plant biodiversity in permanent grasslands. A review. Agron
Sustainable Dev 32 (1):133-160
Geiger HH, Wahle G (1978) Struktur der Heterosis von Komplexmerkmalen bei
Winterroggen-Einfachhybriden. Z Pflanzenzucht 80:198-210
Girard M, Dohme-Meier F, Wechsler D, Goy D, Kreuzer M, Bee G (2016) Ability
of 3 tanniferous forage legumes to modify quality of milk and Gruyère-type
cheese. J Dairy Sci 99:205-220
Goplen BP, Richards KW, Moyer JR (1991) Sainfoin for western Canada. In:
1470/E ACP (ed), Canada
Gowda SJM, Radhika P, Mhase LB, Jamadagni BM, Gupta VS, Kadoo NY (2011)
Mapping of QTLs governing agronomic and yield traits in chickpea. J Appl
Genet 52 (1):9-21
Graham PH, Vance CP (2003) Legumes: Importance and constraints to greater
use. Plant Physiol 131 (3):872-877
Gray FA, Koch DW (2008) Shoshone Sainfoin. University of Wyoming (ed) Plant
Sciences Timely Information Series, 2:1-4
Grieder C, Hund A, Walter A (2015) Image based phenotyping during winter: a
powerful tool to assess wheat genetic variation in growth response to
temperature. Funct Plant Biol 42 (4):387-396
Hackett CA, McLean K, Bryan GJ (2013) Linkage Analysis and QTL Mapping
Using SNP Dosage Data in a Tetraploid Potato Mapping Population. PLoS
One 8 (5):1-3

159
Hackett CA, Milne I, Bradshaw JE, Luo Z (2007) TetraploidMap for Windows:
Linkage map construction and QTL mapping in autotetraploid species. J
Hered 98 (7):727-729
Haering DA, Suter D, Amrhein N, Lueshcer A (2007) Biomass allocation is an
important determinant of the tannin concentration in growing plants. Ann
Bot 99 (1):111-120
Haider M, Dorn S, Mueller A (2014) Better safe than sorry? A Fabaceae species
exhibits unfavourable pollen properties for developing bee larvae despite
its hidden anthers. Arthropod-Plant Interactions 8 (3):221-231
Haldane JBS (1919) The combination of linkage values and the calculation of
distance between the loci of linked factors. J Genet 8:299-309
Hancock JF (2012) Polyploidy and gene duplication. In: Hancock JF (ed) Plant
evolution and the origin of crop species. 3 edn. CABI, Michigan, USA, p 64
Hanelt P (2001) Mansfeld`s Encyclopedia of Agricultural and Hortical Crops, vol
1. Springer Verlag, Gatersleben, Germany
Hatew B, Hayot Carbonero C, Strigano E, Sales LF, Smith LMJ, Mueller-Harvey
I, Hendriks WH, Pellikaan WF (2015) Diversity of condensed tannin
structures affects rumen in vitro methane production in sainfoin
(Onobrychis viciifolia) accessions. Grass Forage Sci 70:474-490
Hatew B, Stringano E, Mueller-Harvey I, Hendriks WH, Hayot Carbonero C,
Smith LMJ, Pellikaan WF (2016) Impact of variation in structure of
condensed tannins from sainfoin (Onobrychis viciifolia) on invitro ruminal
methane production and fermentation characteristics. J Anim Physiol
Anim Nutr 100 (2):348-360
Hauge XY, Litt M (1993) A study of the origin of `shadow bands´ seen when
typing dinucleotide repeat polymorphisms by the PCR. Hum Mol Genet 2
(4):411-415
Hayot Carbonero C (2011) Sainfoin (Onobrychis viciifolia), a forage legume with
great potential for sustainable agriculture, an insight on its morphological,
agronomical, cytological and genetic characterisation. PhD thesis,
University of Manchester, Manchester, United Kingdom

160
Hayot Carbonero C, Carbonero F, Smith LMJ, Brown TA (2012) Phylogenetic
characterisation of Onobrychis species with special focus on the forage crop
Onobrychis viciifolia Scop. Genet Resour Crop Evol 59 (8):1777-1788
Heil M, Baumann B, Andary C, Linsenmair KE, McKey D (2002) Extraction and
quantification of "condensed tannins" as a measure of plant anti-herbivore
defence? Revisiting an old problem. Naturwissenschaften 89 (11):519-524
Hejcman M, Hejcmanova P, Pavlu V, Benes J (2013) Origin and history of
grasslands in Central Europe - a review. Grass Forage Sci 68 (3):345-363
Hejrankesh N, Mousavizadeh SA, Haghighi AR, Rashidi V (2014) Evaluation of
genetic diversity of sainfoin (Onobrychis viciifolia Scop.) landraces using
RAPD markers. J Curr Res Sci 2 (6):739-748
Helmerick RH, Finkner RE, Doxtator CW (1963) Variety crosses in sugar beets
(Beta vulgaris L.) I . Expression of heterosis and combining ability.
Journal of the Am Soc Sugar Beet Tech 12:573-584
Herrmann D, Boller B, Studer B, Widmer F, Kölliker R (2008) Improving
persistence in red clover: Insights from QTL analysis and comparative
phenotypic evaluation. Crop Sci 48 (1):269-277
Herrmann D, Boller B, Studer B, Widmer F, Kölliker R (2006) QTL analysis of
seed yield components in red clover (Trifolium pratense L.). Theor Appl
Genet 112 (3):536-545
Hopkins MS, Casa AM, Wang T, Mitchell SE, Dean RE, Kochert GD, Kresovich S
(1999) Discovery and characterization of polymorphic simple sequence
repeats (SSRs) in peanut. Crop Sci 39 (4):1243-1247
Hoste H, Jackson F, Athanasiadou S, Thamsborg SM, Hoskin SO (2006) The
effects of tannin-rich plants on parasitic nematodes in ruminants. Trends
Parasitol 22 (6):253-261
Hoste H, Martinez-Ortiz-De-Montellano C, Manolaraki F, Brunet S, Ojeda-
Robertos N, Fourquaux I, Torres-Acosta JFJ, Sandoval-Castro CA (2012)
Direct and indirect effects of bioactive tannin-rich tropical and temperate
legumes against nematode infections. Vet Parasitol 186 (1-2):18-27
Humphreys MO (1997) The contribution of conventional plant breeding to forage
crop improvement. Paper presented at the 18th International Grassland
Congress, Saskatoon and Winnipeg, Canada

161
Humphreys MO (2000) Breeding methods for forage and amenity grasses. In:
Spangenberg G (ed) Molecular breeding of forage crops. Proceedings of the
2nd International Symposium, Molecular Breeding of Forage Crops,
Hamilton and Lorne, Australia, pp 41-50
Humphreys MO (2005) Genetic improvement of forage crops - past, present and
future. J Agric Sci 143:441-448
Huyghe C (2007) Place des prairies dans les territoires français: regard
historique. Fourrages 189:3-18
Hybner RM (2013) Sainfoin Onobrychis viciifolia Scop. An introduced legume for
conservation use in Montana and Wyoming. Plant Materials Technical
Note, vol MT-91. United States Departement of Agriculture, Montana,
USA
info-flora (2015) Das nationale Daten- und Informationszentrum der Schweizer
Flora. https://www.infoflora.ch/de/flora/1192-onobrychis-viciifolia.
html#map. Accessed 10.05 2016
ISTA (2009) Internationale Vorschriften für die Prüfung von Saatgut 2009.
Bassersdorf, Switzerland
Ivemeyer S, Walkenhorst M, Holinger M, Maeschli A, Klocke P, Neff AS, Staehli
P, Krieger M, Notz C (2014) Changes in herd health, fertility and
production under roughage based feeding conditions with reduced
concentrate input in Swiss organic dairy herds. Livest Sci 168:159-167
Jackson RC, Hauber DR (1994) Quantitative cytogenetic analyses of autoploid
and alloploid taxa in the Helianthus ciliaris Group (Compositae). Am J Bot
81 (8):1063-1069
Jain SK (1976) The evolution of inbreeding in plants. Annu Rev Ecol Evol Syst
7:469-495
Jeangros B, Thomet P (2004) Multi-functionality of grassland systems in
Switzerland. Paper presented at the EGF, Luzern, Switzerland
Julier B, Flajoulot S, Barre P, Cardinet G, Santoni S, Huguet T, Huyghe C (2003)
Construction of two genetic linkage maps in cultivated tetraploid alfalfa
(Medicago sativa) using microsatellite and AFLP markers. BMC Plant Biol
3:1-19

162
Kaldy MS, Hanna MR, Smoliak S (1979) Amino acid composition of sainfoin
forage. Grass Forage Sci 34:145-148
Kar SSC, Ghanavati F, Naghavi MR, Amirabadi-Zade H, Rabiee R (2014)
Molecular phylogenetics of the Onobrychis genus (Fabaceae:
Papilionoideae) using ITS and trnL-trnF DNA sequence data. Aust J Bot
62 (3):235-250
Katterman FRH, Shattuck VI (1983) An effective method of DNA isolation from
the mature leaves of Gossypium species that contain large amounts of
phenolic terpenoids and tannins. Prep Biochem 13 (4):347-359
Kearsey MJ, Farquhar AGL (1998) QTL analysis in plants; where are we now?
Heredity 80:137-142
Kempf K, Grieder C, Walter A, Widmer F, Reinhard S, Kölliker R (2015)
Evidence and consequences of self-fertilisation in the predominantly
outbreeding forage legume Onobrychis viciifolia. BMC Genet 16:1-12
Kempf K, Mora Ortiz M, Smith LMJ, Kölliker R, Skøt L (2016) Characterization
of novel SSR markers in diverse sainfoin (Onobrychis viciifolia)
germplasm. BMC Genet 17:1-14
Killen M (2012) Sainfoin_An Alternative Forage. University of Wyoming-Powell
Research and Extension Center, Wyoming, USA
Knipe JW (1972) Reproduction and genetics of sainfoin (Onobrychis viciaefolia
Scop.) as they relate to its breeding. PhD Thesis, Montana State
University, Bozeman, MT, USA
Knipe WJ, Carleton AE (1972) Estimates of the percentage of Self- and Cross-
Pollination in Sainfon (Onobrychis viciaefolia Scop.). Crop Sci 12:520-522
Knuth P (1906) Handbook of flower pollination, vol 2. Claredon Press, Oxford,
United Kingdom
Koivisto JM, Lane GPF (2001) Sainfoin - worth another look. Cirencester, United
Kingdom
KÖL (2012) Zwischenfruchtanbau mit neuen Mischungen im Öko-Landbau:
Erfahrungen mit Saatgutmischungen an verschiedenen Standorten in RLP
2012. Kompetenzzentrum Ökologischer Landbau, Rheinland Pfalz,
Rheinhessen-Nahe-Hunsrück, Germany

163
Kölliker R, Boller B (2010) The role of genetic resources for sustainable and
productive grassland agriculture. Paper presented at the EGF - Grassland
in a changing world, Kiel, Germany,
Kölliker R, Boller B, Widmer F (2005) Marker assisted polycross breeding to
increase diversity and yield in perennial ryegrass (Lolium perenne L.).
Euphytica 146 (1-2):55-65
Kosambi DD (1943) The estimation of map distances from recombination values.
Ann Eugenics 12:172-175
Kuckuck H, Kobabe G, Wenzel G (1972) Spezielle Züchtungs- und
Selektionstechniken. In: Kuckuck H, Kobabe G, Wenzel G (ed) Grundzüge
der Pflanzenzüchtung. De Gruyter, Berlin, Germany, p 254
Kumar P, Gupta VK, Misra AK, Modi DR, Pandey BK (2009) Potential of
Molecular Markers in Plant Biotechnology. Plant Omics 2 (4):141-162
Lamboy WF (1994) Computing genetic similarity coefficients from RAPD data:
the effects of PCR artifacts. PCR Methods Appl 4 (1):31-37
Lande R, Schemske DW, Schultz ST (1994) High inbreeding depression, selective
interference among loci, and the threshold selfing rate for purging
recessive lethal mutations. Evolution 48 (4):965-978
Lander ES, Green P, Abrahamson J, Barlow A, Daly MJ, Lincoln SE, Newberg
LA (2009) MAPMAKER: An interactive computer package for constructing
primary genetic linkage maps of experimental and natural populations (vol
1 pg 174, 1987). Genomics 93 (4):398-398
Langer RHM, Hill GD (1991) Agricultural Plants. 2 edn. Cambridge University
Press, Lincoln, New Zealand
Lee M, Godshalk EB, Lamkey KR, Woodman WW (1989) Association of
restriction fragment length polymorphisms among maize inbreds with
agronomic performance of their crosses. Crop Sci 29:1067-1071
Lehner B, Doll P, Alcamo J, Henrichs T, Kaspar F (2006) Estimating the impact
of global change on flood and drought risks in europe: A continental,
integrated analysis. Clim Change 75 (3):273-299
Leitch IJ, Bennett MD (1997) Polyploidy in angiosperms. Trends Plant Sci 2
(12):470-476

164
Lewis GP, Schrire B, Mackinder B, Lock M (2005) Legumes of the world. In:
Gwilym Peter Lewis (ed). Royal Botanic Gardens, Kew, United Kingdom
Lewke Bandara N, Papini A, Mosti S, Brown T, Smith LMJ (2013) A phylogenetic
analysis of genus Onobrychis and its relationships within the tribe
Hedysareae (Fabaceae). Turk J Bot 37 (6):981-992
Li G, Quiros CF (2001) Sequence-related amplified polymorphism (SRAP), a new
marker system based on a simple PCR reaction: its application to mapping
and gene tagging in Brassica. Theor Appl Genet 103 (2-3):455-461
Litt M, Luty JA (1989) A hypervariable microsatellite revealed by in vitro
amplification of a dinucleotide repeat within the cardiac muscle actin gene.
Am J Hum Gen 44:397-401
Liu L, Wu Y, Wang Y, Samuels T (2012) A High-Density Simple Sequence
Repeat-Based Genetic Linkage Map of Switchgrass. G3-Genes Genomes
Genetics 2 (3):357-370
Liu RH (2004) Potential synergy of phytochemicals in cancer prevention:
Mechanism of action. J Nutr 134 (12):3479S-3485S
Liu Z (2006) Developing a modern agronomy for sainfoin (Onobrychis viciifolia
Scop.). PhD Thesis, Conventry University, Cirencester, United Kingdom
Liu Z, Baines RN, Lane GPF, Davies WP (2010) Survival of plants of common
sainfoin (Onobrychis viciifolia Scop.) in competition with two companion
grass species. Grass Forage Sci 65 (1):11-14
Lloyd DG, Schoen DJ (1992 a) Self- and cross-fertilization in plants. I. Functional
dimensions. Int J Plant Sci 153 (3):358-369
Lüscher A, Mueller-Harvey I, Soussana JF, Rees RM, Peyraud JL (2014)
Potential of legume-based grassland-livestock systems in Europe: a review.
Grass Forage Sci 69 (2):206-228
Ma Y, Bliss FA (1977) Tannin content and inheritance in common bean. Crop Sci
18 (2):201-204
Mackay TFC (2001) The genetic architecture of quantitative traits. Annu Rev
Genet 35:303-339
MacQueen J (1967) Some methods for classification and analysis of multivariate
observations. In: Le Cam LM, Neyman J (ed) Fifth Berkeley Symposium

165
on Mathematical Statistics and Probability, University of California Press,
Berkeley, USA
Maliepaard C, Jansen J, Van Ooijen JW (1997) Linkage analysis in a full-sib
family of an outbreeding plant species: overview and consequences for
applications. Genetics Res 70 (3):237-250
Malisch CS, Luescher A, Baert N, Engstrom MT, Studer B, Fryganas C, Suter D,
Mueller-Harvey I, Salminen J-P (2015) Large Variability of
Proanthocyanidin Content and Composition in Sainfoin (Onobrychis
viciifolia). J Agr Food Chem 63 (47):10234-10242
Marais JPJ, Mueller-Harvey I, Brandt EV, Ferreira D (2000) Polyphenols,
condensed tannins, and other natural products in Onobrychis viciifolia
(Sainfoin). J Agric Food Chem 48 (8):3440-3447
Margarido GRA, Souza AP, Garcia AAF (2007) OneMap: software for genetic
mapping in outcrossing species. Hereditas (Lund) 144 (3):78-79
Marquez-Cedillo LA, Hayes PM, Kleinhofs A, Legge WG, Rossnagel BG, Sato K,
Ullrich SE, Wesenberg DM, Proj NABGM (2001) QTL analysis of
agronomic traits in barley based on the doubled haploid progeny of two
elite North American varieties representing different germplasm groups.
Theor Appl Genet 103 (4):625-637
Mather K (1935) Reductional and equational separation of the chromosomes in
bivalents and multivalents. J Genet 30:53-78
McCord P, Gordon V, Saha G, Hellinga J, Vandemark G, Larsen R, Smith M,
Miller D (2014) Detection of QTL for forage yield, lodging resistance and
spring vigor traits in alfalfa (Medicago sativa L.). Euphytica 200 (2):269-
279
McMahon LR, Majak W, McAllister TA, Hall JW, Jones GA, Popp JD, Cheng KJ
(1999) Effect of sainfoin on in vitro digestion of fresh alfalfa and bloat in
steers. Can J Anim Sci 79 (2):203-212
McMahon LR, McAllister TA, Berg BP, Majak W, Acharya SN, Popp JD,
Coulman BE, Wang Y, Cheng KJ (2000) A review of the effects of forage
condensed tannins on ruminal fermentation and bloat in grazing cattle.
Can J Plant Sci 80 (3):469-485

166
Mechineni A, Kommuru DS, Gujja S, Mosjidis JA, Miller JE, Burke JM, Ramsay
A, Mueller-Harvey I, Kannan G, Lee JH, Kouakou B, Terrill TH (2014)
Effect of fall-grazed sericea lespedeza (Lespedeza cuneata) on
gastrointestinal nematode infections of growing goats. Vet Parasitol 204
(3-4):221-228
Mendel G (1866) Versuche über Pflanzenhybriden. Oswald`s Klassiker der
exakten Wissenschaften 121:1-68
Meudt HM, Clarke AC (2007) Almost forgotten or latest practice? AFLP
applications, analyses and advances. Trends Plant Sci 12 (3):106-117
Meyer T (2015) Flora von Deutschland. http://www.blumeninschwaben.de/
Zweikeimblaettrige/Schmetterlingsbluetler/esparsette.htm. Accessed 10.05 2016
Mezzomo R, Paulino PVR, Detmann E, Valadares Filho SC, Paulino MF,
Monnerat JPIS, Duarte MS, Silva LHP, Moura LS (2011) Influence of
condensed tannin on intake, digestibility, and efficiency of protein
utilization in beef steers fed high concentrate diet. Livest Sci 141 (1):1-11
Miller PR, Ehlke NJ (1997) Inheritance of condensed tannins in birdsfoot trefoil.
Can J Plant Sci 77 (4):587-593
Milligan BG, McMurry CK (1993) Dominant vs. codominant genetic markers in
the estimation of male mating success. Mol Ecol 2:275-283
Min BR, Barry TN, Attwood GT, McNabb WC (2003) The effect of condensed
tannins on the nutrition and health of ruminants fed fresh temperate
forages: a review. Anim Feed Sci Technol 106 (1-4):3-19
Moll RH, Salhuana WS, Robinson HF (1962) Heterosis and genetic diversity in
variety crosses of maize. Crop Sci 2:197-198
Mora-Ortiz M, Swain M, Vickers M, Wood TA, Hegarty M, Kelly R, Smith LMJ,
Skøt L (2016) De-novo transcriptome assembly for gene identification,
analysis, annotation, and molecular marker discovery in Onobrychis
viciifolia. BMC Genom 17:1-13
Mora Ortiz M, Smith LMJ (2016) Sainfoin - surprising science behind a forgotten
forage. Cotswold Seeds Ltd, Moreton-in-Marsh, United Kingdom
Morgante M, Hanafey M, Powell W (2002) Microsatellites are preferentially
associated with nonrepetitive DNA in plant genomes. Nat Genet 30
(2):194-200

167
Mueller-Harvey I (2006) Unravelling the conundrum of tannins in animal
nutrition and health. J Sci Food Agric 86 (13):2010-2037
Narasimhamoorthy B, Saha MC, Swaller T, Bouton JH (2008) Genetic Diversity
in Switchgrass Collections Assessed by EST-SSR Markers. Bioenerg Res 1
(2):136-146
Negri V (1984) Caratteristiche fiorali e quota di allegagione in popolazioni di
ginestrino, lupinella e sulla in presenza e in assenza di pronubi. Sementi
Elette 30 (3):13-17
Neuhoff D (2009) Untersuchung zur Nutzung der Esparsette (Onobrychis
viciifolia) im Ökologischen Landbau. Universität Bonn, Bonn, Germany
Neuhoff D, Bücking K (2006) Möglichkeiten zur Integration der
Futterleguminose Esparsette (Onobrychis viciifolia) in Fruchtfolgen des
Ökologischen Landbaus. Institut für Organischen Landbau, Universität
Bonn, Germany
Noroozi M, Angerson WJ, Lean MEJ (1998) Effects of flavonoids and vitamin C
on oxidative DNA damage to human lymphocytes. Am J Clin Nutr 67
(6):1210-1218
Nowosad K, Liersch A, Poplawska W, Bocianowski J (2016) Genotype by
environment interaction for seed yield in rapeseed (Brassica napus L.)
using additive main effects and multiplicative interaction model.
Euphytica 208 (1):187-194
O'Mara FP (2012) The role of grasslands in food security and climate change.
Ann Bot 110 (6):1263-1270
Ookawa T, Hobo T, Yano M, Murata K, Ando T, Miura H, Asano K, Ochiai Y,
Ikeda M, Nishitani R, Ebitani T, Ozaki H, Angeles ER, Hirasawa T,
Matsuoka M (2010) New approach for rice improvement using a pleiotropic
QTL gene for lodging resistance and yield. Nat Commun 1:132-132
Otto SP (2007) The evolutionary consequences of polyploidy. Cell 131 (3):452-462
Otto SP, Whitton J (2000) Polyploid incidence and evolution. Annu Rev Genet
34:401-437
Özbek H (2011) Sainfoin, Onobrychis viciifolia Scop.: An important bee plant.
Uludag Bee Journal 11 (2):51-62

168
Ozimec B, Husband BC (2011) Effect of recurrent selfing on inbreeding
depression and mating system evolution in an autopolyploid plant.
Evolution 65 (7):2038-2049
Page GP, Amos CI, Boerwinkle E (1998) The quantitative LOD score: Test
statistic and sample size for exclusion and linkage of quantitative traits in
human sibships. Am J Hum Genet 62 (4):962-968
Pairon MC, Jacquemart AL (2005) Disomic segregation of microsatellites in the
tetraploid Prunus serotina Ehrh. (Rosaceae). J Am Soc Hortic Sci 130
(5):729-734
Paolini V, Frayssines A, De La Farge F, Dorchies P, Hoste H (2003) Effects of
condensed tannins on established populations and on incoming larvae of
Trichostrongylus colubriformis and Teladorsagia circumcincta in goats.
Vet Res 34 (3):331-339
Pauly L, Flajoulot S, Garon J, Julier B, Beguier V, Barre P (2012) Detection of
favorable alleles for plant height and crown rust tolerance in three
connected populations of perennial ryegrass (Lolium perenne L.). Theor
Appl Genet 124 (6):1139-1153
Peakall R, Gilmore S, Keys W, Morgante M, Rafalski A (1998) Cross-species
amplification of soybean (Glycine max) simple sequence repeats (SSRs)
within the genus and other legume genera: Implications for the
transferability of SSRs in plants. Mol Biol Evol 15 (10):1275-1287
Peeters A (2009) Importance, evolution, environmental impact and future
challenges of grasslands and grassland-based systems in Europe. Grassl
Sci 55 (3):113-125
Peoples MB, Herridge DF, Ladha JK (1995) Biological nitrogen fixation: An
efficient source of nitrogen for sustainable agricultural production? Plant
Soil 174 (1):3-28
Percival NS, Cranshaw LJ (1986) Evaluation of sainfoin cultivars on the central
plateau. Proc Agr Soc New Zeal 16:55-57
Pereira GS, Nunes ES, Laperuta LDC, Braga MF, Penha HA, Diniz AL, Munhoz
CF, Gazaffi R, Garcia AAF, Vieira MLC (2013) Molecular polymorphism
and linkage analysis in sweet passion fruit, an outcrossing species. Ann
Appl Biol 162 (3):347-361

169
Piano E, Pecetti L (2010) Fodder Crops and Amenity Grasses. Handbook of plant
breeding, vol 5, 1 edn. Springer, New York, USA
Pinto LR, Oliveira KM, Marconi T, Garcia AAF, Ulian EC, de Souza AP (2006)
Characterization of novel sugarcane expressed sequence tag
microsatellites and their comparison with genomic SSRs. Plant Breed 125
(4):378-384
Piper C (1914) Forage plants and their culture. The Rural Text-Book Series. The
Macmillan company, New York, USA
Porcher MH (2004) Sorting Onobrychis Names. Multilingual Multiscript Plant
Name Database - A Work in Progress. The University of Melbourne.
http://www.plantnames.unimelb.edu.au/Sorting/Onobrychis.html#viciifolia
. Accessed 10.05 2016
Posselt UK (2010) Breeding Methods in Cross-Pollinated Species. In: Boller B,
Posselt UK, Veronesi F (ed) Fodder Crops and Amenity Grasses. Springer,
New York, USA, pp 39-87
Powell W, Machray GC, Provan J (1996) Polymorphism revealed by simple
sequence repeats. Trends Plant Sci 1 (7):215-222
Qiang H, Chen Z, Zhang Z, Wang X, Gao H, Wang Z (2015) Molecular Diversity
and Population Structure of a Worldwide Collection of Cultivated
Tetraploid Alfalfa (Medicago sativa subsp sativa L.) Germplasm as
Revealed by Microsatellite Markers. PLoS One 10 (4):1-12
Quijada J, Fryganas C, Ropiak HM, Ramsay A, Mueller-Harvey I, Hoste H (2015)
Anthelmintic Activities against Haemonchus contortus or Trichostrongylus
colubriformis from Small Ruminants Are Influenced by Structural
Features of Condensed Tannins. J Agric Food Chem 63:6346-6354
R Core Team (2014) R: A language and environment for statistical computing. R
Foundation for Statistical Computing.
Ramirez-Restrepo CA, Barry TN (2005) Alternative temperate forages containing
secondary compounds for improving sustainable productivity in grazing
ruminants. Anim Feed Sci Technol 120 (3-4):179-201
Ramsey J, Schemske DW (2002) Neopolyploidy in flowering plants. Annu Rev
Ecol Syst 33:589-639

170
Rasouli M, Jafari AA, Tabaei-Aghdaei SR, Shanjani PS, Darvish F (2013)
Assessment of genetic variability of 36 populations of sainfoin (Onobrychis
sativa) based on RAPD markers. International Journal of Biosciences 3
(10):15-26
Rea AC, Nasrallah JB (2008) Self-incompatibility systems: barriers to self-
fertilization in flowering plants. Int J Dev Biol 52 (5-6):627-636
Regos I, Urbanella A, Treutter D (2009) Identification and Quantification of
Phenolic Compounds from the Forage Legume Sainfoin (Onobrychis
viciifolia). J Agric Food Chem 57 (13):5843-5852
Richards KW, Edwards PD (1988) Density, diversity, and efficiency of pollinators
of sainfoin, Onobrychis viciaefolia scop. Can Entomol 120 (12):1085-1100
Riday H, Krohn AL (2010a) Genetic map-based location of the red clover
(Trifolium pratense L.) gametophytic self-incompatibility locus. Theor Appl
Genet 121 (4):761-767
Riday H, Krohn AL (2010b) Increasing Population Hybridity by Restricting Self-
Incompatibility Alleles in Red Clover Populations. Crop Sci 50 (3):853-860
Risser P (2010) Mapping of quantitative‐trait loci (QTL) for adult‐plant
resistance to Septoria tritici in five wheat populations (Triticum aestivum
L.). PhD Thesis, University of Hohenheim, Stuttgart-Hohenheim,
Germany
Robins JG, Bauchan GR, Brummer EC (2007) Genetic mapping forage yield,
plant height, and regrowth at multiple harvests in tetraploid alfalfa
(Medicago sativa L.). Crop Sci 47 (1):11-18
Robins JG, Hansen JL, Viands DR, Brummer EC (2008) Genetic mapping of
persistence in tetraploid alfalfa. Crop Sci 48 (5):1780-1786
Robinson JD, Hall DW, Wares JP (2013) Approximate Bayesian estimation of
extinction rate in the Finnish Daphnia magna metapopulation. Mol Ecol
22 (10):2627-2639
Roeber FK, Gordillo GA, Geiger HH (2005) In vivo haploid induction in maize -
performance of new inducers and significance of doubled haploid lines in
hybrid breeding. Maydica 50 (3-4):275-283
Roesler S (2015) Pretty`n pink: High nutritious sainfoin helps cows cycle. The
Prairie Star. http://www.theprairiestar.com/news/special_section/pretty-n-

171
pink-high-nutritious-sainfoin-helps-cows-cycle/article_eb1c34b2-3c8e-11e5-
98f8-cfc3517d3c67.html. Accessed 10.05 2016
Roldan-Ruiz I, Dendauw J, Van Bockstaele E, Depicker A, De Loose M (2000)
AFLP markers reveal high polymorphic rates in ryegrasses (Lolium spp.).
Mol Breed 6 (2):125-134
Roseberg RJ (1993) Sainfoin Forage and Seed Production Trials: 1991-19931.
Oregon State University, Medford, USA
Ruckman S (2008) Sainfoin gains interest with improved varieties, disease
resistance. The Prairie Star. http://www.theprairiestar.com/news/crop/
sainfoin-gains-interest-with-improved-varieties-disease-resistance/article_
adebc8ee-2e13-564c-9d96-823fd44bd4e1.html. Accessed 10.05 2016
Rumball W (1982) Plant introduction trials - Performance of sainfoin (Onobrychis
viciifolia Scop.) and related species at Palmerston North. New Zeal J Exp
Agr 10:383-385
Rumball W, Claydon RB (2005) `G35´Sainfoin (Onobrychis viciifolia Scop.). N Z J
Agric Res 48:127-128
Sacristan MD (1965) Estudios citotaxonómicos sobre el género Onobrychis (L). In:
CSIC - Estación Experimental de Aula Dei (EEAD), editor. Adanson
conreferencia especial a la citogenética de la esparceta (O. viciifolia Scop.).
Annales de la estacion experimental de aula dei. Zaragoza, Spain
Salminen J-P, Karonen M (2011) Chemical ecology of tannins and other
phenolics: we need a change in approach. Funct Ecol 25 (2):325-338
Saminathan M, Sieo CC, Abdullah N, Wong CMVL, Ho YW (2015) Effects of
condensed tannin fractions of different molecular weights from a Leucaena
leucocephala hybrid on in vitro methane production and rumen
fermentation. J Sci Food Agric 95 (13):2742-2749
Sardaro S, Molinari L, Albertini E, Reosellini D, Negri V, Falcinelli M (2003)
Distinguibilità molecolare di poplazioni spontanee di Poa pratensis,
Lolium perenne e Onobrychis viciifolia. Sementi Elette 6:47-49
Schmerer WM (2003) Reduction of shadow band synthesis during PCR
amplification of repetitive sequences from modern and ancient DNA. In:
Bartlett JMS, Stirling D (eds) PCR Protocols, vol 226. Methods in
Molecular Biology. Humana Press, New York, USA, pp 309-313

172
Schubiger FX (2015) Esparsette. http://www.pflanzenkrankheiten.ch/de/
uebersicht-kulturpflanzen/futterleguminosen/esparsette. Accessed 10.05
2016
Schuelke M (2000) An economic method for the fluorescent labeling of PCR
fragments. Nat Biotechnol 18 (2):233-234
Scioneaux AN, Schmidt MA, Moore MA, Lindroth RL, Wooley SC, Hagerman AE
(2011) Qualitative Variation in Proanthocyanidin Composition of Populus
Species and Hybrids: Genetics is the Key. J Chem Ecol 37 (1):57-70
Scott Hill N (1980) An Evaluation of factors influenced by nitrogen fixation in
sainfoin (Onobrychis viciifolia Scop.). Master Thesis, Montana State
University, Bozeman, USA
Scurlock JMO, Hall DO (1998) The global carbon sink: a grassland perspective.
Global Change Biology 4 (2):229-233
Sears ER (1976) Genetic control of chromosome pairing in wheat. Annu Rev
Genet 10:31-51
Serba DD, Daverdin G, Bouton JH, Devos KM, Brummer EC, Saha MC (2015)
Quantitative Trait Loci (QTL) Underlying Biomass Yield and Plant Height
in Switchgrass. Bioenerg Res 8 (1):307-324
Serrano J, Puupponen-Pimia R, Dauer A, Aura A-M, Saura-Calixto F (2009)
Tannins: Current knowledge of food sources, intake, bioavailability and
biological effects. Mol Nutr Food Res 53:S310-S329
Sheehy JE, Popple SC (1981) Photoynthesis, water relations, temperature and
canopy structure as factors influencing the growth of sainfoin (Onobrychis
viciifolia Scop.) and lucerne (Medicago sativa L.). Ann Bot 48:113-128
Shimodaira H (2002) An approximately unbiased test of phylogenetic tree
selection. Syst Biol 51 (3):492-508
Shimodaira H (2004) Approximately unbiased tests of regions using multistep-
multiscale bootstrap resampling. Ann Stat 32 (6):2616-2641
Shull GH (1914) Duplicate genes for capsule-form in Bursa bursa-pastoris.
Zeitschrift für Induktive Abstammungs- und Vererbungslehre 12 (1):97-
149
Silvertown JW, Doust JL (1993) Introduction to plant population biology. 3 edn.
Blackwell Scientific Publications LTD, Oxford, United Kingdom

173
Simonnet X, Carlen C (2011) Esparsette (Onobrychis viciifolia) reich an
kondensierten Tanninen: Pflanzenbau und Qualität. Mediplant, Contheyn,
Switzerland
Sindhu A, Ramsay L, Sanderson L-A, Stonehouse R, Li R, Condie J, Shunmugam
ASK, Liu Y, Jha AB, Diapari M, Burstin J, Aubert G, Tar'an B, Bett KE,
Warkentin TD, Sharpe AG (2014) Gene-based SNP discovery and genetic
mapping in pea. Theor Appl Genet 127 (10):2225-2241
Singh RJ, Hymowitz T (1985) Diploid-like meiotic behavior in synthesized
amphiploids of the genus Glycine Willd. subgenus Glycine. Can J Genet
Cytol 27 (6):655-660
Singh S, Sidhu JS, Huang N, Vikal Y, Li Z, Brar DS, Dhaliwal HS, Khush GS
(2001) Pyramiding three bacterial blight resistance genes (xa5, xa13 and
Xa21) using marker-assisted selection into indica rice cultivar PR106.
Theor Appl Genet 102 (6-7):1011-1015
Sliwka J, Jakuczun H, Kaminski P, Zimnoch-Guzowska E (2010) Marker-assisted
selection of diploid and tetraploid potatoes carrying Rpi-phu1, a major
gene for resistance to Phytophthora infestans. J Appl Genet 51 (2):133-140
Smith DN, Devey ME (1994) Occurrence and inheritance of microsatellites in
Pinus radiata. Genome 37:977-983
Smith T (2007) New interest in sainfoin. Angus Journal 7:142-143
Sorrells ME, Wilson WA (1997) Direct classification and selection of superior
alleles for crop improvement. Crop Sci 37 (3):691-697
Sottie ET (2014) Characterization of new sainfoin populations for mixed alfalfa
pastures in western canada. PhD Thesis, University of Lethbridge,
Lethbridge, AB, Canada
Stebbins G (1950) Chapter 8: Polyploidy 1: Occurence and Nature of Polyploid
Types. In: Columbia University Press (ed) Variations and Evolution in
Plants. New York, USA, pp 298-341
Stein J, Pessino SC, Martinez EJ, Pia Rodriguez M, Siena LA, Quarin CL, Amelio
Ortiz JP (2007) A genetic map of tetraploid Paspalum notatum Flugge
(bahiagrass) based on single-dose molecular markers. Mol Breed 20
(2):153-166

174
Strigens A, Schipprack W, Reif JC, Melchinger AE (2013) Unlocking the Genetic
Diversity of Maize Landraces with Doubled Haploids Opens New Avenues
for Breeding. PLoS One 8 (2):e57234-Article No.: e57234
Studer B, Boller B, Bauer E, Posselt UK, Widmer F, Kölliker R (2007) Consistent
detection of QTLs for crown rust resistance in Italian ryegrass (Lolium
multiflorum Lam.) across environments and phenotyping methods. Theor
Appl Genet 115 (1):9-17
Studer B, Jensen LB, Hentrup S, Brazauskas G, Kölliker R, Lübberstedt T (2008)
Genetic characterisation of seed yield and fertility traits in perennial
ryegrass (Lolium perenne L.). Theor Appl Genet 117 (5):781-791
Sturtevant AH (1921) A case of rearrangement of genes in Drosophila. Proc Nat
Acad Sci 7:235-237
Stypinski P (2011) The effect of grassland-based forages on milk quality and
quantity. Agron Res 9 (2):479-488
Suzuki R, Shimodaira H (2006) Pvclust: an R package for assessing the
uncertainty in hierarchical clustering. Bioinformatics 22 (12):1540-1542
Sybenga J (1996) Chromosome pairing affinity and quadrivalent formation in
polyploids: Do segmental allopolyploids exist? Genome 39 (6):1176-1184
Talukder SK, Babar MA, Vijayalakshmi K, Poland J, Prasad PVV, Bowden R,
Fritz A (2014) Mapping QTL for the traits associated with heat tolerance
in wheat (Triticum aestivum L.). BMC Genet 15:1-13
Tan M, Dumlu Z (2009) Local forage ecotypes and their importance in turkey.
Paper presented at the 1st International Symposium on Sustainable
Development Sarajevo, Bosnia
Tasei JN (1984) Légumineused fourragères et protéagireusses. In: Pessan P,
Louveaux J (eds) Pollinisation et productions végétales. INRA, Paris,
France, pp 285-287
Taylor NL, Anderson MK (1980) Maintenance of parental lines for hybrid red
clover. Crop Sci 20:367-369
te Beest M, Le Roux JL, Richardson DM, Brysting AK, Suda J, Kubesova M,
Pysek P (2012) The more the better? The role of polyploidy in facilitating
plant invasions. Ann Bot 109:19-45

175
Tehrani MS, Mardi M, Saeidi H, Gharehyazi B, Assadi M (2008) Transferability
of genomic and EST-microsatellites from Festuca arundinacea Schreb. to
Lolium persicum Boiss. and Hohen. ex Boiss. Int J Bot 4 (4):476-480
Terrill TH, Rowan AM, Douglas GB, Barry TN (1992) Determination of
extractable and bound condensed tannin concentrations in forage plants,
protein concentrate meals and cereal grains. J Sci Food Agric 58:321-329
Theodoridou K, Aufrere J, Andueza D, Le Morvan A, Picard F, Pourrat J,
Baumont R (2012) Effects of condensed tannins in wrapped silage bales of
sainfoin (Onobrychis viciifolia) on in vivo and in situ digestion in sheep.
Animal 6 (2):245-253
Thill J, Regos I, Farag MA, Ahmad AF, Kusek J, Castro A, Schlangen K, Hayot
Carbonero C, Gadjev IZ, Smith LMJ, Halbwirth H, Treutter D, Stich K
(2012) Polyphenol metabolism provides a screening tool for beneficial
effects of Onobrychis viciifolia (sainfoin). Phytochemistry 82:67-80
Thomson JR (1938) Cross- and self-fertility in sainfoin. Ann Appl Biol 25 (4):695-
704
Thornton PK (2010) Livestock production: recent trends, future prospects.
Philosophical Transactions of the Royal Society B-Biological Sciences 365
(1554):2853-2867
Toluei Z, Ranjbar M, Wink M, Atri M (2013) Molecular phylogeny and
ecogeography of Onobrychis viciifolia SCOP. (Fabaceae) based on nrDNA
ITS sequences and genomic ISSR fingerprinting. Feddes Repert 123
(3):193-207
Travis T (1993) Haber-Bosch process: exemplar of 20th century chemical
industry. Chemistry and Industry (15):581-585
Tufenkci S, Erman M, Sonmez F (2006) Effects of phosphorus and nitrogen
applications and Rhizobium inoculation on the yield and nutrient uptake
of sainfoin (Onobrychis viciifolia L.) under irrigated conditions in Turkey.
N Z J Agric Res 49 (1):101-105
Tzamaloukas O, Athanasiadou S, Kyriazakis I, Huntley JF (2006) The effect of
chicory (Cichorium intybus) and sulla (Hedysarum coronarium) on larval
development and mucosal cell responses of growing lambs challenged with
Teladorsagia circumcincta. Parasitology 132:419-426

176
ufasamen (2015) Feldsamenkatalog 2015. vol 2015. fenaco Genossenschaft,
Winterthur, Switzerland
Upcott M (1939) The nature of tetraploidy in Primula kewensis. J Genet 39
(1):79-100
Vali U, Einarsson A, Waits L, Ellegren H (2008) To what extent do microsatellite
markers reflect genome-wide genetic diversity in natural populations? Mol
Ecol 17 (17):3808-3817
van Oijen JW (2006) JoinMap 4, Software for the calculation of genetic linkage
maps in experimental populations. Kyazma B.V., Wageningen,
Netherlands
van Ooijen JW (2011) Multipoint maximum likelihood mapping in a full-sib
family of an outbreeding species. Gen Res 93 (5):343-349
Volf M, Hrcek J, Julkunen-Tiitto R, Novotny V (2015) To each its own:
differential response of specialist and generalist herbivores to plant
defence in willows. J Anim Ecol 84 (4):1123-1132
von Haller A (1772) Von den Futterkräutern. In: Haller E (ed) Sammlung kleiner
hallerischer Schriften, vol 2. Verlag Emanuel Hallers, Bern, Switzerland, p
342
Voorrips RE (2002) MapChart: Software for the graphical presentation of linkage
maps and QTLs. J Hered 93 (1):77-78
Waghorn GC, Jones WT (1989) Bloat in cattle. Potential of dock (Rumex
obtusifolius) as an antibloat agent for cattle. N Z J Agric Res 32 (2):227-
235
Walsh PS, Fildes NJ, Reynolds R (1996) Sequence analysis and characterization
of stutter products at the tetranucleotide repeat locus vWA. Nucleic Acids
Res 24 (14):2807-2812
Wang H, Walla JA, Magnusson VA, Zhong S, Dai W (2014) Construction of
genetic linkage maps and QTL mapping for X-disease resistance in
tetraploid chokecherry (Prunus virginiana L.) using SSR and AFLP
markers. Mol Breed 34 (1):143-157
Wang JL, Hill WG, Charlesworth D, Charlesworth B (1999) Dynamics of
inbreeding depression due to deleterious mutations in small populations:
mutation parameters and inbreeding rate. Genet Res 74 (2):165-178

177
Wang Y, Majak W, McAllister TA (2012) Frothy bloat in ruminants: Cause,
occurrence, and mitigation strategies. Anim Feed Sci Technol 172 (1-
2):103-114
White WH (1982) Generation mean analyses of various allelochemics in cottons.
Crop Sci 22 (5):4
Wilman D, Asiedu FHK (1983) Growth, nutritive value and selection by sheep of
sainfoin, red clover, lucerne and hybrid ryegrass. J Agr Sci 100 (01):115-
126
Wofford DS, Gray FA (1987) Evaluation of cultivars, experimental lines and
plant introduction collection of sainfoin for resistance to Meloidogyne
hapla Chitwood. J Nematol 19 (1):30-37
Woodgate K, Maxted N, Bennett SJ (1999) A generic conspectus of the forage
legumes of the Mediterranean basin. In: Bennett SJ, Cocks PS (eds)
Genetic Resources of Mediterranean pasture and forage legumes. Springer
Science + Business Media, Dordrecht, Germany, p 204
Wright S (1978) Variability within and among natural populations, vol 4.
Evolution and the genetics of populations. The University of Chicago
Press, Chicago, USA
Xie W, Robins JG, Bushman BS (2012) A genetic linkage map of tetraploid
orchardgrass (Dactylis glomerata L.) and quantitative trait loci for heading
date. Genome 55 (5):360-369
Xu Y, Crouch JH (2008) Marker-assisted selection in plant breeding: from
publications to practice. Crop Sci 48:391-407
Yao LH, Jiang YM, Shi J, Tomas-Barberan FA, Datta N, Singanusong R, Chen
SS (2004) Flavonoids in food and their health benefits. Plant Foods Hum
Nutr 59 (3):113-122
Yates SA, Swain MT, Hegarty MJ, Chernukin I, Lowe M, Allison GG, Ruttink T,
Abberton MT, Jenkins G, Skot L (2014) De novo assembly of red clover
transcriptome based on RNA-Seq data provides insight into drought
response, gene discovery and marker identification. BMC Genomics
15:453-Article No.: 453

178
Yildiz B, Ciplak B, Aktoklu E (1999) Fruit morphology of sections of the genus
Onobrychis Miller (Fabaceae) and its phylogenetic implications. Isr J Plant
Sci 47 (4):269-282
Yu J, Holland JB, McMullen MD, Buckler ES (2008) Genetic design and
statistical power of nested association mapping in maize. Genetics 178
(1):539-551
Zalapa JE, Cuevas H, Zhu H, Steffan S, Senalik D, Zeldin E, McCown B, Harbut
R, Simon P (2012) Using next-generation sequencing approaches to isolate
simple sequence repeat (SSR) loci in the plant sciences. Am J Bot 99
(2):193-208
Zarrabian M, Majidi MM, Ehtemam MH (2013) Genetic Diversity in a Worldwide
Collection of Sainfoin Using Morphological, Anatomical, and Molecular
Markers. Crop Sci 53 (6):2483-2496

179

180
Acknowledgements
It was a pleasure and privilege to meet numerous inspiring people during the last
four years being on hand with help and advice. I am grateful for the funding from
the European Marie Curie Initial Training Network which brought the
‘LegumePlus’ Project (PITN-GA-2011-289377) to life and providing the
framework to work interdisciplinary with a lot of brilliant people from science.
I want to thank my supervisor Dr. Rolland Kölliker for giving me the opportunity
to work on that special project. I am glad for his support during all the stages of
my PhD, i.e., the development of the study design, data analysis and manuscript
writing. I am also glad for his positive thinking and encouragement in situations
of unexpected incidences.
Additionally, I am thankful for the provided knowledge base and plant material
by Dr. Beat Boller. Furthermore, I want to thank people from the group of forage
crop breeding at Agroscope, namely Simone Günter for the establishment of
clones to produce the biparental greenhouse populations as well as her assistance
in bumble bee care. Furthermore, I would like to thank Peter Tanner for his
support in establishing the field trial and Dani Schmid for providing the
equipment for seed cleaning.
A special thank addresses DSP Delley and Dr. Evelyne Thomet for all the
assistance during the field work, especially phenotyping flowering time. It was
good to know that there is always someone to rely on.
I want to thank Prof. Dr. Achim Walter (Institute of Agricultural Sciences) for
leading my dissertation at the ETH and welcome me to his group. I am grateful
for his offers of advice and support despite his tight time schedule.
Furthermore I want to thank my co-examiners Prof. Dr. Michael Kreuzer and
Prof. Dr. Bruno Studer for being my PhD committee.

181
A great thank you to the Swiss colleagues from the molecular ecology group at
Agroscope (Sonja Reinhard, Stephie Pfister, Andy Lutz, Mireille Dessimoz,
Salome Schneider, Martina Birrer, Florian Gschwend, Tina Wunderlin, Roland
Kölliker, Franco Widmer and Jürg Enkerli) for teaching me the “Swiss way of
life” and my German and Austrian colleagues (Luisa Last, Lena Hersemann,
Verena Knorst and Johanna Mayerhofer) for being my classmates. I will always
rethink of that fantastic time.
I specially want to thank my project colleague Carsten Malisch for being at my
side, dealing with that capricious sainfoin plant. I also owe him my gratitude for
street and public transport navigation during our stay in the U.S.
Finally I would like to thank my family. Thank you for always being there for me
- being my home port.
And I want to thank Christoph that he was always at my side during the last
years with love, a lot of patience, tolerance and support. I know that I am
responsible for several of your grey hairs.
182
Curriculum vitae
Personal Data
Name Katharina Kempf
Date of birth/ place 17th April 1985/ Ludwigsburg, Germany
Nationality German
Email [email protected]
Work experience
Project collaborator Saatzucht Steinach
05/2011 - 08/2011 Pyramidisation of resistance genes in the genus
Lolium aimed to develop improved fodder plants
Student work assistant University of Hoheimheim, Stuttgart, Germany
Institute of plant breeding
02/2010 - 04/2010 Selection of doubled haploid maize kernels
Internship GAB eurofins, Niefern-Öschelbronn, Germany
04/2008 - 09/2008 Assistance in eco-toxicological field studies
Education
PhD thesis Agroscope, Zurich, Switzerland
Molecular ecology group

183
05/2012 – 06/2016 Self-fertilization and marker- trait associations
in sainfoin (Onobrychis viciifolia)
Studies University of Hohenheim, Stuttgart
04/2006 – 04/2011 Agricultural biology
Diploma thesis Institute of plant breeding
Production of doubled haploids in maize (Zea
mays L.) with colchicine-alternatives
High school (Abitur) Mathilde-Planck-Schule, Ludwigsburg
09/2002 – 07/2005 Gymnasium of nutrition science
Scientific training
University of Reading, England
06/2012 Training for industry 1
University of Wageningen, Netherlands
11/2012 Animal Nutrition Course
ETH Zurich, Switzerland
Summer semester 2013 Gene Technology in Foods
University of Reading, England
11/2013 Training for industry 2
University of Turku, Finland
05/2014 Training in chemistry and grant application
writing
University of Reading, England
11/2014 Media coaching