Embed Size (px)
Citation preview

No. 8 September 1999Civic Report
Right-Sizing Justice:A Cost-Benefit Analysis
of Imprisonment in Three States
Anne Morrison Piehl,Associate Professor of Public Policy,
John F. Kennedy School of Government, Harvard University
Bert Useem,Director of the Institute for Social Research
and Professor of Sociology, University of New Mexico
John J. DiIulio, Jr.,Fox Leadership Professor of Politics, Religion and Civil Society
and Professor of Political Science at the University of Pennsylvania;Senior Fellow, Manhattan Institute
C E N T E R F O R C I V I C I N N O V A T I O NA T T H E M A N H A T T A N I N S T I T U T EA T T H E M A N H A T T A N I N S T I T U T EA T T H E M A N H A T T A N I N S T I T U T EA T T H E M A N H A T T A N I N S T I T U T EA T T H E M A N H A T T A N I N S T I T U T E
C C i

Civic Report September 1999
Right-Sizing Justice

Right-Sizing Justice
September 1999 Civic Report
Table of Contents
THE CRIMINAL JUSTICE SORTING MACHINE 2
BENEFIT/COST ANALYSIS: ESTIMATING THE CRIMINALITY
OF INCOMING STATE PRISONERS 4The Cost of Crime 5Inmate Surveys 6
POLICY ALTERNATIVES: PAROLE VIOLATORS, REPEAT
OFFENDERS, AND DRUG-ONLY OFFENDERS 10Parole Violators 10Criminal Histories 11Drug Offenders 11
CONCLUSIONS 12Offenders with Social Costs 12Imprisonment of Drug-Only Offenders 13Penal Harm 13
APPENDICES 15Highlights from Surveys 15
Lives of Inmates Prior to Incarceration 15Meaning of Imprisonment 16Expectations of Post-Release Life 1 6Inmates’ Understanding of Sentencing Policy 17Survey Responses 17
METHODOLOGY 20
REFERENCES 20
ENDNOTES 2 2

Civic Report September 1999
Right-Sizing Justice
1
“Americans face at least three distinct but related crime challenges.First is the challenge of preventing at-risk children from becomingjuveniles or young adults who criminally violate the life, liberty, orproperty of others. . . . Second is the challenge of protecting our-selves from victimization at the hands of juvenile and adult crimi-nals. Third is the challenge of restraining convicted but commu-nity-based juvenile and adult criminals so that they cannot com-mit additional crimes against persons or property.”
Council on Crime in America,The State of Violent Crime in America, p. 1(The New Citizenship Project, 1996).

Right-Sizing Justice
September 1999 Civic Report
THE CRIMINAL JUSTICE SORTING MACHINE
Violent crime in America has fallen by about 21 percent since 1993, juvenile crime hasdescended from its 1994 peak, and property crime is at a post-1973 low. While no one reallyknows what factors account for these welcome trends, most experts believe that both punish-ment and prevention efforts are part of the story. But this good news has not dramaticallylessened Americans’ concerns about crime; though most rightly feel safer today than they didfive years ago, most continue to identify crime as one of the main problems facing the countrytoday. Indeed, more Americans were “personally most concerned about” crime in 1998 (46percent) than in 1974 (30 percent).1
No experts predicted the post-1993 crime drop, but most now contend that the goodnews about crime will continue. A few dissenting voices, however—James Q. Wilson of UCLA,James Alan Fox of Northeastern University, and a co-author of this report, John DiIulio of theUniversity of Pennsylvania—continue to warn that certain demographic trends are likely toexert upward pressure on crime rates; for example, by the year 2006, the number of teens aged14 to 17 will be a fifth greater than it was in 1996, and the nation’s total teen cohort will be itslargest since 1975.
With an eye to this trend, the Council on Crime in America, an independent bipar-tisan group led by former U.S. Secretary of Education Dr. William Bennett and former U.S.Attorney General Griffin Bell, argued in its January 1996 report that the justice systemcould do a better job of “restraining known, convicted, violent, and repeat criminals.”2 Inits February 1997 report, the Council argued that the justice system could do a better job ofpromoting crime prevention programs, especially those in which responsible, caring non-parental adults “monitor, mentor, and minister” to at-risk youth, juvenile delinquents, andyoung adults on probation.3
Generally speaking, liberals liked the Council’s second report far more than its first, andconservatives liked its first report far more than its second. Taken together, however, the Council’stwo reports reflect what we would identify as three emerging points of consensus about crime,prevention, and punishment in America today.
First, to the extent that public policies, independent of other factors, can effect andsustain reductions in crime, both punishment and prevention—both “prisons and pro-grams”—are necessary. Second, though it is true that spending on all aspects of criminaljustice remains small compared to many other categories of public spending (for example,a single federal-state health program, Medicaid, consumes more tax money than all fed-eral, state, and local spending on prisons and jails combined), any increases in justice-system spending still must be cost-effective—in other words, lead to proportional increasesin public safety. Third, even at its best, the justice system cannot cost-effectively detect,arrest, convict, sanction, and supervise more than a small fraction of all criminals, adultand juvenile, suspected and adjudicated.
Metaphorically speaking, the justice system functions as a “sorting machine” with loose-fitting parts (courts, cops, and corrections), competing legal purposes (punish, deter, incapaci-tate, rehabilitate), multiple enforcement methods (ranging from police investigation to plea-bargaining, community corrections to maximum-security prisons), and diverse leaders and con-stituencies (federal, state, and local policy makers, voters, advocates, and others).
2
Civic Report September 1999
Right-Sizing Justice
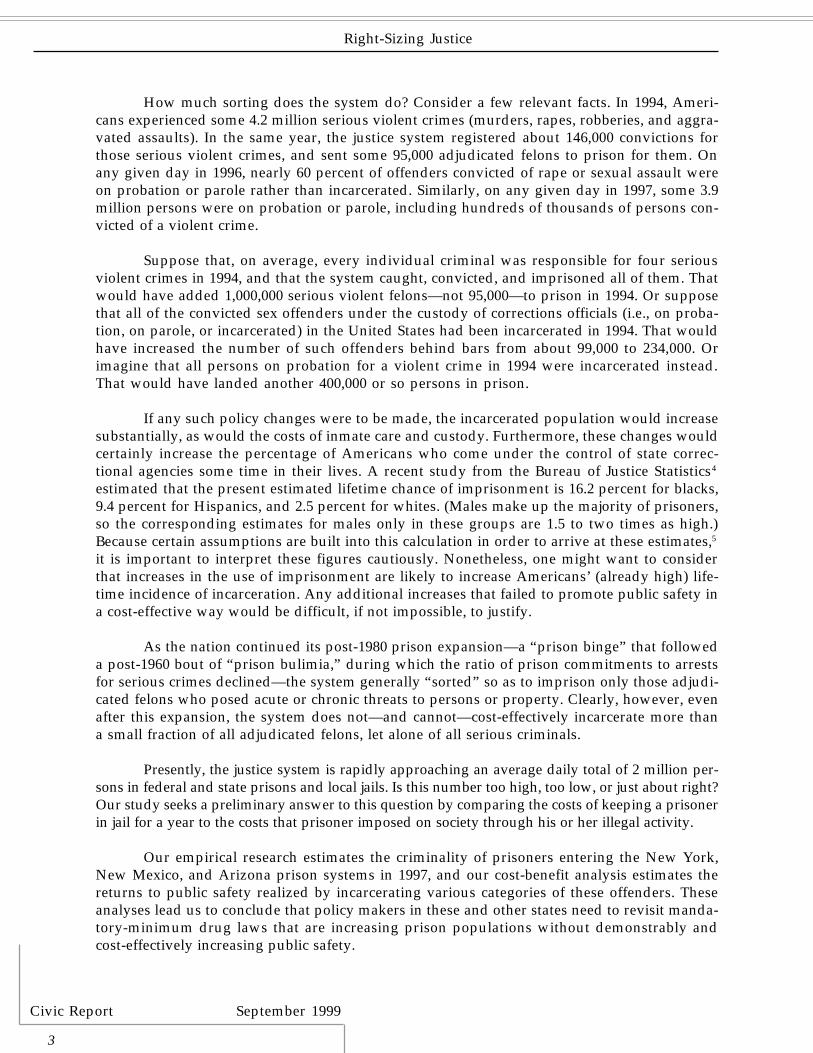
How much sorting does the system do? Consider a few relevant facts. In 1994, Ameri-cans experienced some 4.2 million serious violent crimes (murders, rapes, robberies, and aggra-vated assaults). In the same year, the justice system registered about 146,000 convictions forthose serious violent crimes, and sent some 95,000 adjudicated felons to prison for them. Onany given day in 1996, nearly 60 percent of offenders convicted of rape or sexual assault wereon probation or parole rather than incarcerated. Similarly, on any given day in 1997, some 3.9million persons were on probation or parole, including hundreds of thousands of persons con-victed of a violent crime.
Suppose that, on average, every individual criminal was responsible for four seriousviolent crimes in 1994, and that the system caught, convicted, and imprisoned all of them. Thatwould have added 1,000,000 serious violent felons—not 95,000—to prison in 1994. Or supposethat all of the convicted sex offenders under the custody of corrections officials (i.e., on proba-tion, on parole, or incarcerated) in the United States had been incarcerated in 1994. That wouldhave increased the number of such offenders behind bars from about 99,000 to 234,000. Orimagine that all persons on probation for a violent crime in 1994 were incarcerated instead.That would have landed another 400,000 or so persons in prison.
If any such policy changes were to be made, the incarcerated population would increasesubstantially, as would the costs of inmate care and custody. Furthermore, these changes wouldcertainly increase the percentage of Americans who come under the control of state correc-tional agencies some time in their lives. A recent study from the Bureau of Justice Statistics4
estimated that the present estimated lifetime chance of imprisonment is 16.2 percent for blacks,9.4 percent for Hispanics, and 2.5 percent for whites. (Males make up the majority of prisoners,so the corresponding estimates for males only in these groups are 1.5 to two times as high.)Because certain assumptions are built into this calculation in order to arrive at these estimates,5
it is important to interpret these figures cautiously. Nonetheless, one might want to considerthat increases in the use of imprisonment are likely to increase Americans’ (already high) life-time incidence of incarceration. Any additional increases that failed to promote public safety ina cost-effective way would be difficult, if not impossible, to justify.
As the nation continued its post-1980 prison expansion—a “prison binge” that followeda post-1960 bout of “prison bulimia,” during which the ratio of prison commitments to arrestsfor serious crimes declined—the system generally “sorted” so as to imprison only those adjudi-cated felons who posed acute or chronic threats to persons or property. Clearly, however, evenafter this expansion, the system does not—and cannot—cost-effectively incarcerate more thana small fraction of all adjudicated felons, let alone of all serious criminals.
Presently, the justice system is rapidly approaching an average daily total of 2 million per-sons in federal and state prisons and local jails. Is this number too high, too low, or just about right?Our study seeks a preliminary answer to this question by comparing the costs of keeping a prisonerin jail for a year to the costs that prisoner imposed on society through his or her illegal activity.
Our empirical research estimates the criminality of prisoners entering the New York,New Mexico, and Arizona prison systems in 1997, and our cost-benefit analysis estimates thereturns to public safety realized by incarcerating various categories of these offenders. Theseanalyses lead us to conclude that policy makers in these and other states need to revisit manda-tory-minimum drug laws that are increasing prison populations without demonstrably andcost-effectively increasing public safety.
3

Right-Sizing Justice
September 1999 Civic Report
BENEFIT/COST ANALYSIS: ESTIMATING THE CRIMINALITY OF INCOMING STATE PRISONERS
Benefit/cost analysis allows us to compare things that seem very different from eachother. That is, we can compare the same outcome at different times (building a bridgetoday versus building a bridge in 10 years) or different outcomes (a bridge today versus aschool today). In order to do this, however, one must define a criteria for measuring thevalue of these outcomes. Generally, the outcomes are translated into dollar terms, whichthen allow easy comparisons. We should not overlook, however, the importance of themethod by which these outcomes are translated into dollars. A full discussion of all thedifferent ways this can be done is beyond the scope of this report. Here we describe theconceptual issues involved and our attempts to resolve them.6
The purpose of a benefit/cost analysis of incarceration is to calculate the social costsand the social benefits of prison and compare them. It is generally thought that calculatingthe costs of incarceration is relatively simple: just add up the costs of building and operat-ing a cell. The range of estimates for these costs is about $20,000–$50,000 per year.7 Butthere may be many social costs left out of these numbers. By “social costs” we mean anyburdens on society in addition to the resources it takes to run a prison system. They includethe lost labor-market productivity of inmates, the loss to families of having a member awayfrom home, and the loss to communities of having a resident removed.
On the benefit side, there likewise may be a variety of effects. First, incarcerationwill incapacitate the offender so that he or she will not victimize other (non-incarcerated)citizens during the period of confinement. Second, the incarceration of one person mayserve as a deterrent to others. Moderating against these influences are the possibility thatthe criminal activities of inmates are picked up by other inmates (prisons as “schools ofcrime”), the possibility that criminals are simply “replaced” by other individuals in thecommunity, and the likelihood that at some point in time an offender naturally reduces hiscriminal activity regardless of government sanction.
The first serious effort to apply benefit/cost analysis to corrections was conductedover a decade ago. In 1987, Edwin Zedlewski, a staff economist for the National Institute ofJustice, tried to calculate the costs and benefits of incarceration. He did this by dividing theyearly cost to keep one inmate in prison ($25,000 per annum, he estimated) by the productof the number of crimes the “typical” inmate would commit if on streets (187) and theaverage cost of a crime to society ($2,300).8 Simple arithmetic showed that the benefitsgreatly outweighed the costs, on the order of 17 to 1. The results, as interpreted by Zedlewski,strongly supported the idea of increased use of incarceration.
Numerous researchers challenged the 17 to 1 ratio. Zedlewski had estimatedthe number of crimes the “typical” inmate would commit if on the streets based upona survey of prisoners and jail inmates in three states (Michigan, Texas, and Califor-nia). The inmates were asked about the number of crimes they committed in the periodimmediately prior to their incarceration. Critics argued that Zedlewski should haveused the median, rather than the mean, to calculate the typical number of crimes com-mitted. A few inmates claimed an extraordinarily high rate of crimes; some of theseclaims may have been boasts or even deliberate jests to “put on” the researchers. Theuse of the median would have reduced the impact on the estimate of these possiblyoutlandish claims.
4

Civic Report September 1999
Right-Sizing Justice
5
But even if one was to accept Zedlewski’s calculations as 100 percent correct, the ben-efit/cost ratio might depend crucially on the size of the prison system. That is, if most high-rateoffenders are already in prison, then prison growth would result in the imprisonment of lessand less dangerous offenders (assuming the offender population is not growing larger or moredangerous). Actually, Zedlewski thought about this possibility. In a rebuttal to two law-professorcritics, Zedlewski argued that the number of offenders behind bars was then low enough thatexpanding the prison population would not affect the inmate profile. There is, he stated, “nobasis for believing that the average commission rates should decrease in the 300,000 to 600,000inmate range under discussion.”9
In fact, the country exceeded the upper-boundary of 600,000 in 1988, the year afterZedlewski published his report. Is increased use of incarceration still cost-beneficial, with amuch larger inmate population?
In the following, we use benefit/cost analysis not so much to argue for a particularnumber of prison cells, but to compare the policies of several states and to consider variations ofcriminal justice policy. We calculate the benefit of incarceration by multiplying the number ofspecific crimes committed by inmates by the social cost of each specific crime, thereby derivingthe cost of the crimes particular inmates would have committed in the community had they notbeen incarcerated. The data regarding the number of crimes each prisoner committed are froma 1997 survey of prisoners in three states—New York, New Mexico, and Arizona—as thoseinmates were passing through intake facilities. The data regarding the social cost of each crimeare taken from a recent report published by the National Institute of Justice, with one exception.
Our analyses are quite similar to those reported by two of us in the Brookings Re-view10 utilizing surveys of inmates in Wisconsin and in New Jersey. These other articlesemphasized that the answer to whether prison expansion is warranted depends on howthe additional cells would be used. The answer also depends upon how well criminal jus-tice agencies sort offenders for incarceration from among the greater population of indi-viduals who have committed criminal acts—in other words, which law-breakers are se-lected for incarceration. In what follows, we present profiles of the prison populations inthe three states, find that many people currently imprisoned do not pass a benefit/costtest, and conclude that states seeking to maximize the benefits of current prison spaceshould reexamine the policy of imprisoning drug-only offenders.
The Cost of Crime
Table 1 displays the estimates of the value of crimes surveyed from a recent report fromthe National Institute of Justice. These numbers are based on the compensation awarded byjuries to injury victims. The $5 cost per drug sale is our own estimate,11 based on two competingconsiderations. On the one hand, many of the social costs of drug crime comes from the violenceand theft associated with the trade. These costs will be largely accounted for on their own. Onthe other, drug usage has its own inherent costs—they are the reason that drug use is criminalized.Thus, unless society is sorely mistaken about the costs of drug usage—and we do not believe itis—then it would be unrealistic to assign no costs to drug offenses. We believe that $5 reflects areasonable middle ground. This $5 cost per drug offense should represent the social savingsfrom incarcerating a drug offender and therefore preventing him or her from making a sale.Note that if the offender is “replaced” by another drug dealer satisfying the same customers,this estimate will be “too high.”

Right-Sizing Justice
September 1999 Civic Report
While researchers disagree over the precise values that should be used, in practice itturns out that their various estimates are close enough that choosing one over another does notmake much difference to the policy conclusions.12 These numbers simply provide a way ofranking the crimes people commit.
We have omitted murderers from the analysis for several reasons. First, in most cases it isdifficult to argue that the major benefit from incarcerating murderers is incapacitation, and it isincapacitation that this study design is best able to evaluate. Second, the number of murderersis relatively small13 and will not affect our medians in any substantial way. In what follows, wedo not consider changes in criminal justice policy regarding the sentencing of murderers.
Inmate Surveys
During the first half of 1997, we surveyed inmates entering prison in New York, NewMexico, and Arizona. (See the appendices for a discussion of the methodology.) Table 2 de-scribes some of the features of our surveys. The first row shows the number of inmates, maleand female, surveyed in each state.
6
Table 1. Estimates of Social Costs of Selected CrimesSource: Authors’ adjustments to Table 1of Ted R. Miller, Mark A. Cohen, andBrian Wiersema, Victim Costs and Con-sequences: A New Look, (National Insti-tute of Justice, 1996). The estimate fordrug sales is the authors’. We subtracted25% of the property losses for robbery,burglary, motor vehicle theft, and otherthefts and frauds to account for transfer,not loss, of property. We also updatedthe numbers to reflect inflation; the val-ues are reported in 1998 dollars.
Crime
RapeAssaultRobberyMotor vehicle theftBurglaryFraud, forgery, petty theftDrug Sale
Social Cost
$ 98,327$ 10,624$ 8,830$ 3,249$ 1,271$ 342$ 5
Notes: Those who report having committed a murder are excluded. This restriction drops 22 men and no womenin NY; 9 men and 2 women in NM; and 6 men and 1 woman in AZ.
1. Total number of surveys
2. Number w/social cost (proportion of total)
3. Number w/drug offenses only (proportion of total)
4. Number w/no crimes reported (proportion of total)
Table 2. Surveys of Inmates in Three States
New York
Men
478
330(69%)
132(28%)
148(31%)
Women
41
36(88%)
20(49%)
5(12%)
New Mexico
Men
339
215(63%)
51(15%)
124(37%)
Women
51
32(63%)
7(14%)
19(37%)
Arizona
Men
390
260(67%)
69(18%)
130(33%)
Women
137
98(72%)
27(20%)
39(28%)
Civic Report September 1999
Right-Sizing Justice
7
The inmate surveys are divided into three groups, as represented by Rows 2–4. Row2 reports the number of inmates who said that they committed a crime to which we canattribute an identifiable social cost, that is, one of the crimes listed in Table 1. The third rowtabulates inmates who reported that they committed drug offenses, but no others. For pur-poses of this study, “drug offenses” is defined as the sale of illegal narcotics. Depending onthe state, the proportion of the total number of offenders with “only” drug offenses issubstantial, between 15 and 30 percent. This group is a subset of Row 2. Row 4 is com-prised of people who report having committed no crimes listed in Table 1 during the periodwe asked about (the four months prior to arrest for the current term).14 These are prisonerswho either (A) committed no crime, (B) refused to admit to the crimes that they did com-mit, or (C) committed crimes we did not ask about.
How should prisoners in Row 4 be treated in our cost-benefit analysis? We, of course, areunable to distinguish between those inmates who were falsely imprisoned (Group A) and thosewho refused to admit to us the crimes that they did commit (Group B) and cannot include themin our analysis. Nor can we include those in Group C. With regard to this group, the purpose inconducting the survey was not merely to classify inmates by the crimes they committed, but tomeasure the costs of their crimes. Economists have calculated the costs of many, but not all,crimes. Thus, inevitably, there would be inmates in our sample who committed crimes to whichwe cannot impute any monetary value.
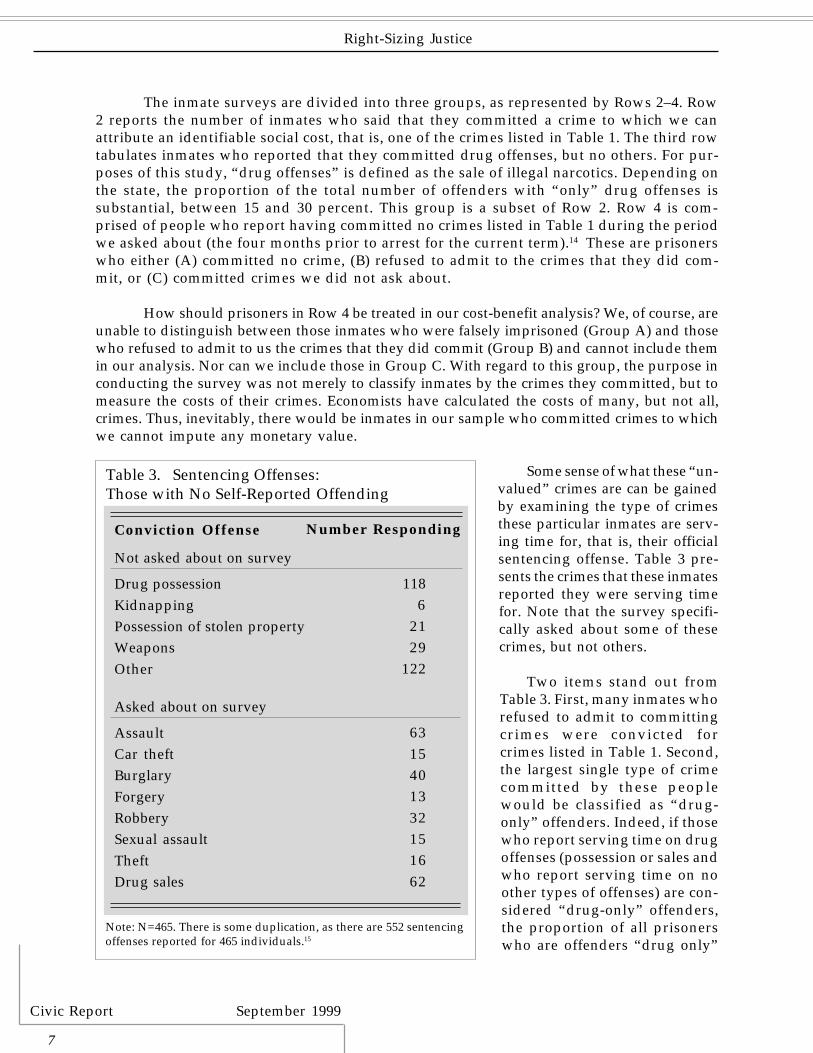
Some sense of what these “un-valued” crimes are can be gainedby examining the type of crimesthese particular inmates are serv-ing time for, that is, their officialsentencing offense. Table 3 pre-sents the crimes that these inmatesreported they were serving timefor. Note that the survey specifi-cally asked about some of thesecrimes, but not others.
Two items stand out fromTable 3. First, many inmates whorefused to admit to committingcrimes were convicted forcrimes listed in Table 1. Second,the largest single type of crimecommitted by these peoplewould be classified as “drug-only” offenders. Indeed, if thosewho report serving time on drugoffenses (possession or sales andwho report serving time on noother types of offenses) are con-sidered “drug-only” offenders,the proportion of all prisonerswho are offenders “drug only”
Note: N=465. There is some duplication, as there are 552 sentencingoffenses reported for 465 individuals.15
Conviction Offense
Not asked about on survey
Drug possessionKidnappingPossession of stolen propertyWeaponsOther
Asked about on survey
AssaultCar theftBurglaryForgeryRobberySexual assaultTheftDrug sales
Table 3. Sentencing Offenses:Those with No Self-Reported Offending
Number Responding
1186
2129
122
6315401332151662

Right-Sizing Justice
September 1999 Civic Report
in New York rises to 49 percent for males and 68 percent for females; in New Mexico, to 26percent and 41 percent; and in Arizona, to 32 percent and 49 percent respectively. Theseare substantial jumps.
In the following analysis we only examine the group of offenders with “relevant infor-mation,” that is, those who self-report the number of crimes they committed listed in Table 1.We exclude those in Row 4 from our benefit/cost analysis because even if we can establish asentencing offense for which we have estimated a social cost, we cannot establish how manysuch crimes these individuals committed and hence are certain to underestimate the social ben-efits of incarcerating them.
Table 4 reports the social costs of crimes committed by the inmates in the category “of-fenders with relevant information.” It does this for each offender by multiplying the number ofthe particular crime type committed by the average social cost of that crime. For offenders witha range of offending, the costs of each type of crime are then added together.16 The table in-cludes values only for male inmates; the results for females are discussed in endnote 17.
Table 4 improves on Zedlewski’s calculation in two key respects. Whereas Zedlewskiwas forced to assume that all crimes have the same costs, we can relax that assumption becausewe can draw on the work of economists who have identified the different costs of differentcrimes. Second, Zedlewski calculated a single cost for the “average” inmate. Table 4 reports thecosts at various cutting points (percentiles). It is useful to know not only the benefit/cost ratio ofimprisoning the “typical” inmate, but also that ratio for the most and least serious offenders.Thus, we ascertain various cutting points to see the proportions of inmates for whom incarcera-tion clearly is or is not cost-beneficial.
What can be said about the social costs of male inmates in the three states? First, itshould be noted that these are inmates who had just been admitted to prison. The social costs ofall inmates behind bars would, on average, be higher (assuming that judges give longer sen-tences to offenders who inflict higher social costs—which is no doubt true).
Second, at all cut points the social cost inflicted by New York inmates is higher thaninmates in the other two states. The median social cost in New York is about $32,000, whereasthe median cost in New Mexico and Arizona is $26,000. Put differently, in New York, half of the
8
Table 4. Profiles of Male Inmates: Social Costs
Offender
80th percentile60th percentileMedian40th percentile20th percentileMedian number of non-drug crimesNumber of inmates
New York
$ 239,338$ 78,517$ 31,866$ 13,604$ 6,570
6330
New Mexico
$ 163,311$ 41,377$ 26,486$ 11,032$ 4,050
9215
Arizona
$ 219,702$ 37,651$ 25,472$ 11,000$ 3,950
6260

Civic Report September 1999
Right-Sizing Justice
9
incoming inmates inflicted more than $32,000 in damages, and half less than that amount.Likewise, in New Mexico and Arizona, half of the incoming inmates inflicted $26,000 in dam-ages and half less than that.
Another way to consider the criminality of the median offender is to look at his reportedcriminal acts. In New York, the $31,866 figure represents the damages associated with thecommission of 3 assaults per year. In New Mexico, the median offender committed robberies atthe rate of 3 per year (and no other offenses). In Arizona, the median offender committedburglaries (rate of 3 per year), thefts (rate of 6 per year), and car thefts (rate of 6 per year).
Third, as is always found in inmate surveys, the social costs of the most costly offendersgreatly exceed those at the lower end of the spectrum. While it clearly pays to incarcerate thoseat the 80th percentile in all three states, on incapacitation grounds alone, it does not appear to“pay” to incarcerate those below the median. The social costs associated with the offender atthe 40th percentile are all below $15,000.17
The offenders going to prison in our three states exhibit two different patterns. Manyhigh rate offenders and many drug offenders take up New York’s prison space. In Arizona andNew Mexico, the non-drug-only offenders have committed, on average, fewer crimes than theirNew York counterparts. (The median number of non-drug crimes committed by non-drug-onlyoffenders is 16 in New Mexico and 15 in Arizona, compared to 24 in New York.) But, comparedto New York, these two states imprison fewer drug-only offenders.
What explains these interstate differences? One possible explanation could be derivedfrom the three states’ crime rates and incarceration rates which are listed below in Table 5.However, that table does not seem to help much. First, we would anticipate that high incarcera-tion states would produce low social costs per inmate, because their prison systems would, allelse being equal, tend to incarcerate relatively less-serious offenders. Yet New York’s incarcera-tion rate per unit of population is roughly half-way between Arizona and New Mexico; thus,that factor cannot explain New York’s high offender costs.
Table 5. Incarceration and Crime Rates: Three States
Inmates/100,000 population (1997)
Violent crime/100,000 population (1997)
Property crime/100,000 population (1997)
New York
383
688.6
3222.4
New Mexico
258
853.3
6053.2
Arizona
484
623.7
6571.3
United States
401
610.8
4311.9
Sources: Prison population numbers as of 6/30/97, from “Prison and Jail Inmates at Midyear 1997,”(Bureau of Justice Statistics Bulletin, No. NC3-167247, January 1998).(Note: this document reports those under state or federal authority.)Crime rates from Uniform Crime Report (Federal Bureau of Investigation, 1998).
Right-Sizing Justice
September 1999 Civic Report
Second, the crime rates reported in Table 5 are also not very helpful as explanatoryfactors. New Mexico has a high violent crime rate, compared to New York and Arizona. How-ever, New York has recently experienced dramatic declines in violent crime. The traditionallyhigh level of violent crime in New York may explain the higher per inmate costs. At the sametime, however, Arizona and New Mexico have property crime rates nearly double that of NewYork. No clear pattern emerges here.
Still another explanation comes to mind when one thinks about the prison-system de-mographics in the three states. Comparing the three states, New York has a higher percentageof African-American inmates, and New Mexico and Arizona have higher percentages of His-panic inmates. Arguably, these differences might be linked to the differences in costs in the threestates. Yet when we looked at the cost by race and ethnicity, we found costs were very similaracross non-Hispanic whites and blacks in New York and in Arizona.18 Within the inmate popu-lation, “drug-only” offenders were more likely to be African-American and Hispanic (exceptamong women in New York, who were no more likely to be Hispanic).
POLICY ALTERNATIVES: PAROLE VIOLATORS, REPEAT OFFENDERS, AND DRUG-ONLY OFFENDERS
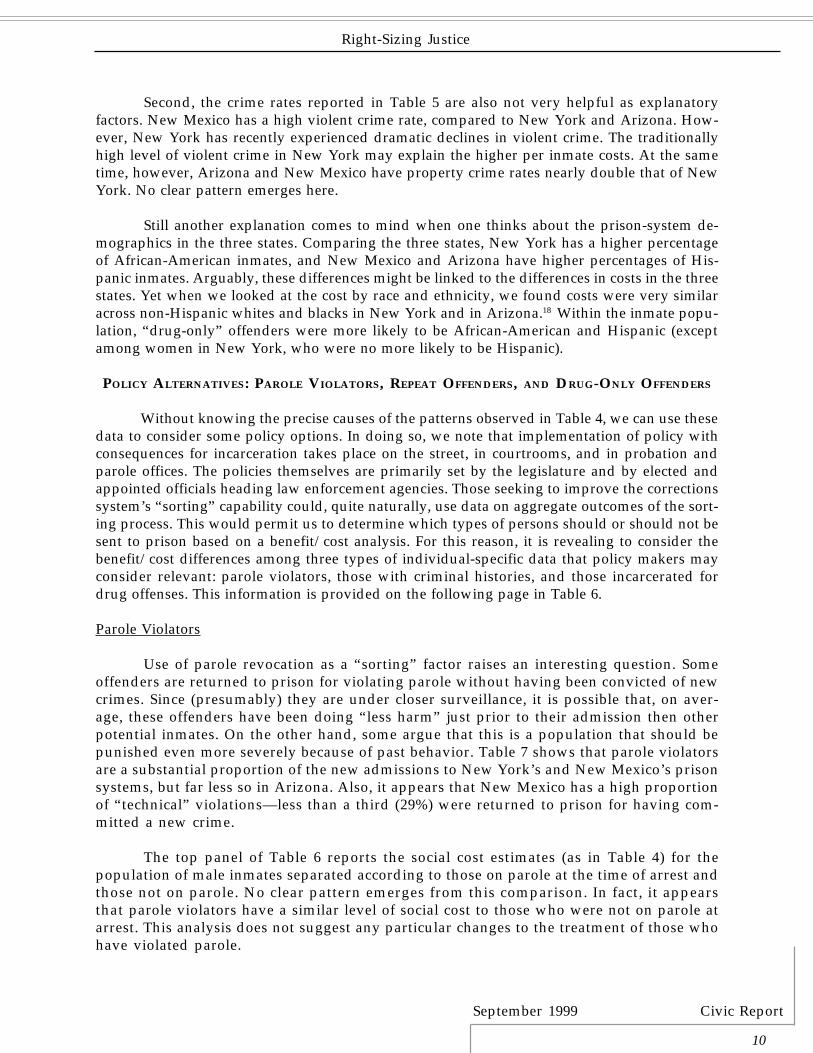
Without knowing the precise causes of the patterns observed in Table 4, we can use thesedata to consider some policy options. In doing so, we note that implementation of policy withconsequences for incarceration takes place on the street, in courtrooms, and in probation andparole offices. The policies themselves are primarily set by the legislature and by elected andappointed officials heading law enforcement agencies. Those seeking to improve the correctionssystem’s “sorting” capability could, quite naturally, use data on aggregate outcomes of the sort-ing process. This would permit us to determine which types of persons should or should not besent to prison based on a benefit/cost analysis. For this reason, it is revealing to consider thebenefit/cost differences among three types of individual-specific data that policy makers mayconsider relevant: parole violators, those with criminal histories, and those incarcerated fordrug offenses. This information is provided on the following page in Table 6.
Parole Violators
Use of parole revocation as a “sorting” factor raises an interesting question. Someoffenders are returned to prison for violating parole without having been convicted of newcrimes. Since (presumably) they are under closer surveillance, it is possible that, on aver-age, these offenders have been doing “less harm” just prior to their admission then otherpotential inmates. On the other hand, some argue that this is a population that should bepunished even more severely because of past behavior. Table 7 shows that parole violatorsare a substantial proportion of the new admissions to New York’s and New Mexico’s prisonsystems, but far less so in Arizona. Also, it appears that New Mexico has a high proportionof “technical” violations—less than a third (29%) were returned to prison for having com-mitted a new crime.
The top panel of Table 6 reports the social cost estimates (as in Table 4) for thepopulation of male inmates separated according to those on parole at the time of arrest andthose not on parole. No clear pattern emerges from this comparison. In fact, it appearsthat parole violators have a similar level of social cost to those who were not on parole atarrest. This analysis does not suggest any particular changes to the treatment of those whohave violated parole.
10
Civic Report September 1999
Right-Sizing Justice
11
Criminal Histories
One may also want to consider whether it appears beneficial to concentrate additionalprison resources on offenders who already have criminal histories, regardless of their currentparole status. Across the three states, from 39-48 percent of the new inmates had served priorterms in adult prisons. The second panel in Table 6 reports the social cost estimates for inmatesby whether or not they had prior prison terms. Again, the numbers bounce around somewhatand no clear pattern emerges. In no state is it obvious that there is a higher benefit from inca-pacitating those with criminal histories.
Drug Offenders
The final policy alternative we consider has to do with drug offenders. We have alreadyshown that a substantial fraction of offenders are drug offenders—a very substantial portion ifthe data cited at pp. 7-8 is included. In this analysis, we compare those who report their cur-rent prison term is due to a violation of drug laws to those serving time for other types ofoffenses. This is not the same comparison as above, because here we divide the sample based on“sentencing offense” rather than reported criminal activity. (Note that the “sentencing offense”is self-reported, as is everything else on the survey).
One reason to divide the sample this way is that it is quite likely that some of thoseserving time for drug offenses have committed other types of violations as well. Because social
Table 6. Male Inmates: Social Costs at Different Margins
Offender
Parole / No paroleMedian40th percentile20th percentileNumber
Prison / No prisonMedian40th percentile20th percentileNumber
Drug Sentence / OtherMedian40th percentile20th percentileNumber
New York
$39,293/$26,524$16,053/$12,475
$6,570/$6,570130/200
$31,404/$31,866$11,777/$18,524
$6,570/$6,570159/171
$6,570/$77,492 $6,570/$35,792 $75/$10,679
113/174
New Mexico
$12,942/$27,479 $7,851/$17,577$4,050/$4,050
54/161
$26,486/$26,892$14,162/$9,410 $4,050/$4,050
103/112
$—/$31,866 $—/$20,029
$—/$4,10926 /176
Arizona
$25,979/$24,781$13,500/$10,795
$4,500/$3,926 34/226
$19,650/$31,602$12,855/$10,466
$4,109/$2,054101/159
$4,050/$31,876$2,880/$16,308
$30/$4,573 38/202
Notes: The survey asked inmates if they had been on parole at the time of the arrest and if they had a priorcriminal history to permit those comparisons. The sample sizes for women are small enough that we were notcomfortable reporting these values as meaningful. We discuss some of the results for women in endnote 17.

Right-Sizing Justice
September 1999 Civic Report
cost numbers incorporate the whole range of offending, this “experiment” will show whetherany drug laws lead to the incarceration of violent offenders.
The bottom panel of Table 6 reports the social cost estimates for those sentenced for drugoffenses to those who were sentenced for other charges. To simplify the comparisons, we omit-ted those whose only reported crimes were drug sales but were sentenced for something else.(The concern here is the same as that expressed earlier at pp. 7-8). No estimates are reported fordrug offenders in New Mexico due to the small number in this category.
In contrast to the other two policies considered, a clear picture emerges in this panel.The social costs associated with those sentenced on drug offenses are substantially lower thanfor other inmates, thereby providing policymakers interested in rationing prison space accord-ing to benefit/cost analysis with a clear reference point with which to do so. We now turn toour conclusions based on these analyses.
CONCLUSIONS
U.S. Supreme Court Justice Robert Jackson once remarked that the Constitution is not asuicide pact. The same must be said for our commitment to punish criminal offenders. Thiscommitment deserves respect, but it can also be too unyielding—taken to extremes it can amountto a suicide pact. Benefit/cost analysis allows us to see if prison is being overused, beyond thenormal criteria of fairness and due process of law. The purpose of our study was to conductsuch a benefit/cost analysis for the incoming prison population in three states. Several conclu-sions can be drawn.
Offenders with Social Costs. Arguing against further prison expansion is theprinciple of diminishing returns. That is, as noted above, if the most serious offenders arealready in prison, then prison growth requires the criminal justice system to reach deeperinto the pool of prison-eligible offenders, such that increases in incarceration are less andless cost-effective. One of the most surprising, and significant, findings of this study is thatthis has not been the case with regard to the prison systems we surveyed when drug-onlyoffenders are excluded. When drug-only offenders are included, however, it appears thatthe value of incarcerating the least “costly” half of inmates (least costly in terms of thesocial-costs of their offenses) is quite low.
12
Table 7. Parole Violation – Men
% parole violators
- among those with social cost
- among “drug only” offenders
% of parole violators w/new crime(vs. technical violation)
New York
30%
33%
33%
69%
New Mexico
24%
23%
26%
29%
Arizona
11%
12%
16%
71%

Civic Report September 1999
Right-Sizing Justice
13
To establish some comparison points, Zedlewski relied on data collected in threestates in 1978 and 1979. Anne Piehl and John DiIulio conducted similar surveys of inmatesin Wisconsin in 1990 and in New Jersey in 1993. Strikingly, the median number of crimescommitted seems uncorrelated with time. Of course, we are comparing different states atdifferent times, whereas ideally we would be comparing the same states at different times.(Actually, the ideal comparison would be data collected before and after a dramatic changein sentencing policy, implemented quickly enough that one could assume the offender popu-lation would not have changed.)
Still, again with the exception of drug-only offenders, the comparisons suggest that prisonexpansion in the three states under study has not come at the expense of incarcerating largernumbers of offenders who, if left on the streets, would commit few crimes.
Imprisonment of Drug-Only Offenders. All three states imprison large numbers ofdrug-only offenders. The main effect of imprisoning drug sellers, we believe, is merely to openthe market for another seller. Numerous students of drug policy attest to the existence of this“replacement process.” Still, it is difficult to observe and measure directly. One indirect measureis the price of drugs. Presumably, if the incarceration of drug offenders does make a dent in thedrug market, we would expect to see an association between the number of drug offendersbehind bars and the street price of drugs.
The evidence is not encouraging. It is probably not enough to merely point out, as AlfredBlumstein and Allen Beck19 have, that the street price of cocaine has decreased since 1980 whilethe rates of incarceration have increased. First, one needs to know, as well, what the price ofcocaine would have been in the absence of that enforcement level—and we do not. Second, asMark Moore has pointed out, the “effective” price of a drug includes, not only the drug’s cashprice, but also the risk of imprisonment and other inconveniences and danger associated withits purchase.
20 Still, the data suggest that the market for the illicit drugs has not been disrupted
by increased incarceration.
In sum, it seems to us that the imprisonment of large numbers of drug offenders is not acost-effective use of public resources. At least some prison beds currently occupied by drugoffenders would be better reserved for high-rate property and violent offenders.
Penal Harm. In the benefit/cost calculations, we did not take into consideration theharm that high incarceration rates can have on communities. A striking finding of our survey isthe extent to which the incoming inmates appeared to be contributing members of their com-munities. As noted below, many of them were working in the month of their arrest, and the vastmajority had held a job in the past for more than three months. In all three states, more than 75percent say they would take a full-time job paying the minimum wage upon release. Also, thevast majority of the inmates were optimistic that they would be able to find a job upon release,and not end up back in prison.
In terms of the broader debates that routinely swirl around prisons, these findingscan be interpreted in two ways. On the one hand, they suggest that the vast majority ofprisoners are not driven to crime by dire economic need. Crime appears to be an add-on toeconomically viable lives. On the other hand, the findings further highlight the costs to thecommunity of imprisonment. These are large numbers of people who would otherwise beworking and paying taxes.

Right-Sizing Justice
September 1999 Civic Report
It is likely that the community costs associated with additional incarceration wouldincrease as the incarceration rate increases. One reason for this is that prison may lose its valueas a penalty if it is seen as commonplace. A second reason is that high incarceration rates mayundermine the legitimacy of the government if citizens come to see the government as toointrusive and coercive. Of course, low incarceration rates may have that effect too, if citizenscome to feel that the government is not “doing enough” about crime. Thus, it is important toget the level of incarceration “right” for reasons of justice as well as to ensure the prudent useof tax dollars. Given the dramatic increases in the proportion of the population under correc-tional supervision in recent years, these costs must be considered.
* * *
14

Civic Report September 1999
Right-Sizing Justice
15
APPENDICES
I. Highlights from Surveys
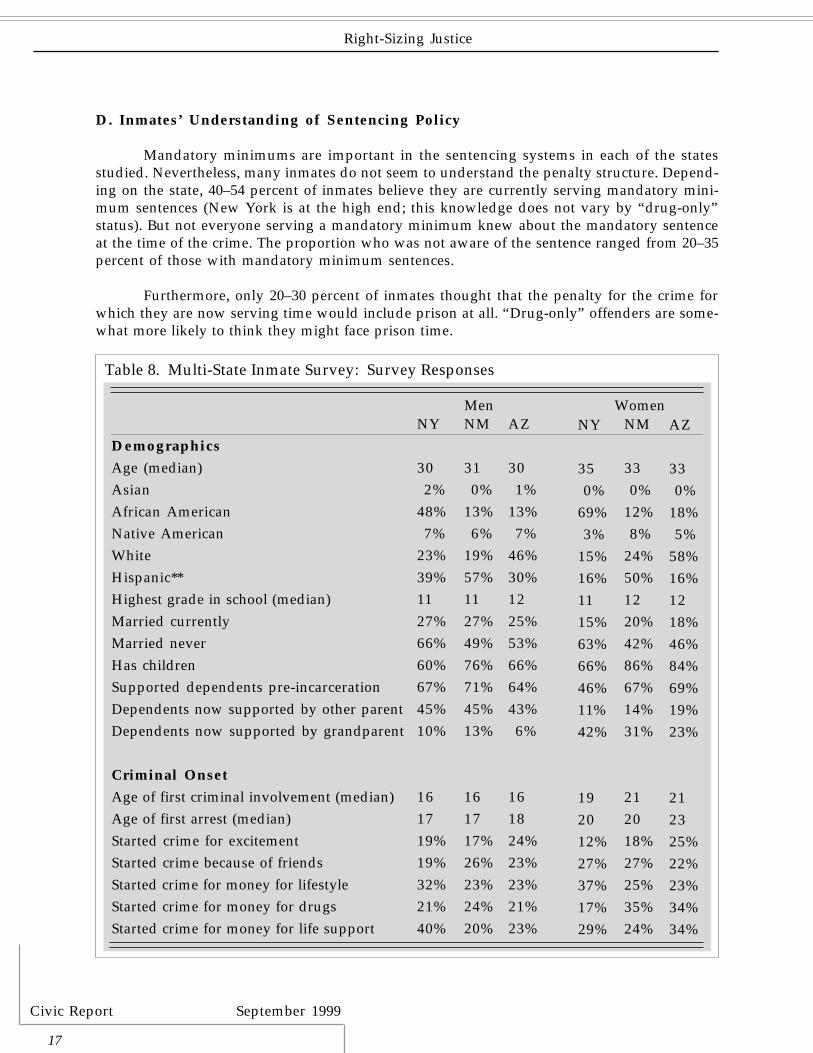
The surveys asked a large number of questions. This section outlines the highlights ofthe surveys in several sections: pre-incarceration experiences; the meaning of imprisonment;understanding of sentencing policy; and expectations about life after release. For readers inter-ested in more detail, the values for each of the questions in the surveys are included in Table 8.
A. Lives of Inmates Prior to Incarceration
The survey asked inmates about certain features of their life prior to being admitted toprison. From the responses, we can get a better idea of their life circumstances.
•Prison inmates are at high risk of victimization. Overall, 40 percent of offendershave been the victim of a robbery; robbery victimization is higher in New York thanthe other two states. Forty-seven percent of men and 69 percent of women havebeen shot at sometime in their lives. For women (but not men) these rates are higherin New York.
•Most prisoners have legitimate employment histories. Many were working inthe month of arrest (40–60 percent), and 85 percent had held a job in the past formore than three months. In all states, more than 75 percent said they would takea full-time job paying $5.25 per hour, if offered one, upon release. (The percent-age is higher for women than for men—88 percent versus 78 percent.)“Drug-only” offenders were neither more, nor less, likely to have been employedthan the other inmates in the sample.
For men, the median offender received less than 10 percent of income from crime(this figure is held down by Arizona inmates, who had somewhat lower earningsthan men did in the other states.) For women, the median offender received 10–25percent of income from crime. “Drug-only” offenders received appreciably higherproportions of their income from crime than did other offenders.
Two points can be made about these findings. One is that the image of offenders allbeing driven to crime by poverty and unemployment is, at best, exaggerated. Themajority of the offenders in our study had jobs, and few derived a high proportionof their incomes from crime. At the same time, however, these findings highlight oneof the costs of imprisonment. Many of these offenders, if not in prison, would becontributing to the economy through work.
•Most prisoners are responsible for one or more dependents. Most inmates wereparents, with women somewhat more likely than men to report having children.Around 65 percent of inmates (across the board) were helping to support at leastone dependent at the time of arrest. These could be children, parents, or others.Many of the inmates were unwilling to answer a question about who was providingsupport for those dependents now that they were in prison. Still, a general patternemerged: the “other parent” primarily supported the dependents of male inmateswhile grandparents primarily supported the dependents of female inmates.
Right-Sizing Justice
September 1999 Civic Report
16
B. Meaning of Imprisonment
Thomas Bonczar and Allen Beck21 estimate that 5.1 percent of all persons in theUnited States will serve time in a federal or state prison; among African-Americanmales, more than a quarter (28.5 percent) will do so. Richard Freeman22 calculatesthat, in 1993, one man was incarcerated for every 50 in the workforce and one Afri-can-American man was behind bars for every 11 African-American men in the laborforce. Over a third (34 percent) of the 25 to 34-year-old African Americans who droppedout of high school were behind bars in 1993.
Our survey included several questions to tap the extent to which inmates perceive theirimprisonment as a “normal” course of events. The respondents in two states (New Mexico andArizona) were asked if they agreed or disagreed with three statements:
• “Among my friends on the outside, one gains respect for having done time in astate prison.”• “Doing time in a state prison may be hard, but it is ‘no big deal’ for me;” and• “For someone like myself, going to prison is just another part of life.”
Thirty-two percent of the respondents stated they either strongly agreed or agreed thatthey gained respect from their friends for going to prison; 17 percent said that they stronglyagreed or agreed that going to prison is “no big deal” for them; and 21 percent said that theystrongly agreed or agreed with the statement that going to prison is “just another part of life.”
Because such questions have never been asked of inmates before, we have no baseline tocompare the responses. It may be, for example, that the 17 percent who said that going toprison was “no big deal” were merely expressing a general defiance toward authority. Thislevel of defiance may have been equally prevalent among earlier generations of inmates. Per-haps more worrisome is that one-third of the respondents felt they gained respect for going toprison, and a fifth said that going to prison was a “part of life.”
C. Expectations of Post-Release Life
We also asked the inmates what they thought the chances were that, upon release, theywill: (a) “try to make it on the outside, that is, without doing crime”; (b) “find a keep a job atleast for a year”; and (c) “end up back in prison or jail.” Most inmates expressed a positiveoutlook on these questions. Seventy-one percent said that they probably will or are certain to tryto “make it on the outside”; 77 percent reported a high chance or certainty that they would beable to find and keep a job upon release; and 81 percent thought there was no chance or a lowchance that they would return to prison or jail after their release.
Such hope, however, may have little predictive power. Mark Fleisher23 observesthat many criminal offenders are masters of “verbal camouflage.” Through repeatedencounters with the criminal justice system, they learn to say what will advance theirinterests in passing through the system (e.g., to “accept” responsibility for their crimi-nal acts), not what they truly believe. At the start our survey, inmates were told thattheir responses would be kept confidential and could not affect their future circum-stances. Still, some may not have believed this assurance or, in any case, may haveresorted to verbal camouflage simply out of habit.
Civic Report September 1999
Right-Sizing Justice
17
D. Inmates’ Understanding of Sentencing Policy
Mandatory minimums are important in the sentencing systems in each of the statesstudied. Nevertheless, many inmates do not seem to understand the penalty structure. Depend-ing on the state, 40–54 percent of inmates believe they are currently serving mandatory mini-mum sentences (New York is at the high end; this knowledge does not vary by “drug-only”status). But not everyone serving a mandatory minimum knew about the mandatory sentenceat the time of the crime. The proportion who was not aware of the sentence ranged from 20–35percent of those with mandatory minimum sentences.
Furthermore, only 20–30 percent of inmates thought that the penalty for the crime forwhich they are now serving time would include prison at all. “Drug-only” offenders are some-what more likely to think they might face prison time.
NM
330%
12%8%
24%50%1220%42%86%67%14%31%
212018%27%25%35%24%
Demographics
Age (median)AsianAfrican AmericanNative AmericanWhiteHispanic**Highest grade in school (median)Married currentlyMarried neverHas childrenSupported dependents pre-incarcerationDependents now supported by other parentDependents now supported by grandparent
Criminal Onset
Age of first criminal involvement (median)Age of first arrest (median)Started crime for excitementStarted crime because of friendsStarted crime for money for lifestyleStarted crime for money for drugsStarted crime for money for life support
NY
302%
48%7%
23%39%1127%66%60%67%45%10%
161719%19%32%21%40%
NM
310%
13%6%
19%57%1127%49%76%71%45%13%
161717%26%23%24%20%
AZ
301%
13%7%
46%30%1225%53%66%64%43%6%
161824%23%23%21%23%
AZ
330%
18%5%
58%16%1218%46%84%69%19%23%
212325%22%23%34%34%
Men Women
Table 8. Multi-State Inmate Survey: Survey Responses
NY
350%
69%3%
15%16%1115%63%66%46%11%42%
192012%27%37%17%29%

Right-Sizing Justice
September 1999 Civic Report
18
Started crime because “normal activity”Started crime under influence of alcoholStarted crime under influence of drugs
Prior Criminal Justice Interventions
Juvenile institution or probationAdult institution, probation, paroleDrug treatment participation
Victimization
Ever a victim of robberyEver shot at
Activities at Arrest
In school month of arrestHeld job at time of arrest
Crimes
Burglary: any within previous 4 mo.Burglary: median annual rate (if did any)Burglary: arrests per burglaryRobbery: any within previous 4 mo.Robbery: median annual rate (if did any)Robbery: arrests per robberyAssaults: any within previous 4 mo.Assaults: median annual rate (if did any)Assaults: arrests per assaultTheft: any within previous 4 mo.Theft: median annual rate (if did any)Theft: arrests per theftAuto theft: any within previous 4 mo.Auto theft: median annual rate (if did any)Auto theft: arrests per auto theftFraud: any within previous 4 mo.Fraud: median annual rate (if did any)
NY
10%12%19%
37%91%56%
55%49%
15%50%
13%98%
15%9
11%14%90%
18%210%
12%123%6%
12
NM
10%29%22%
51%83%58%
25%45%
5%58%
16%9
14%12%4.5
22%14%65%
19%18%6%
12%6
17%13%6
AZ
9%23%24%
42%86%59%
38%47%
5%61%
18%7.5
13%10%124%13%66%
24%121%
15%6
17%13%13.5
NY
5%10%32%
22%88%73%
49%93%
12%39%
10%----7%
----5%
----22%----2%
----12%--
Men WomenNM
8%25%29%
29%80%63%
24%69%
0%38%
16%----16%----10%----27%----4%
----24%--
AZ
11%11%33%
28%91%72%
43%62%
9%41%
10%----6%
----9%
----29%240%4%
----23%9

Civic Report September 1999
Right-Sizing Justice
19
Fraud: arrests per fraudCons: any within previous 4 mo.Cons: median annual rate (if did any)Cons: arrests per conDrug sales: any within previous 4 mo.Drug sales: median annual rate (if did any)Drug sales: arrests per saleRape: any within previous 4 mo.Rape: median annual rate (if did any)Rape: arrests per rapeAverage monthly income from crimeReceived greater than 25% of income from
crime
Current sentence
Current sentence (months)
Attitudes
Try being crime free: greater than even chanceAble to get & keep job for 1 year: greater than
even chanceReturn to jail or prison: greater than even
chanceKeep free of alcohol and drugs: greater than
even chanceHave been at least somewhat successful
at crimePrison brings respect: agree or strongly agreePrison is no big deal: agree or strongly agreePrison is part of life: agree or strongly agreeExpected prison time for this crime
NY3%5%----
47%1,314.06%
2%----
5,00047%
30
59%72%
8%
51%
43%
------
26%
NM17%
3%----
36%810.12%1%----500
36%
36
80%82%
6%
48%
46%
37%21%19%27%
AZ1%5%----
40%810.06%1%----500
34%
30
75%83%
5%
50%
44%
31%25%19%21%
NY--7%----
71%----0%----
5,00057%
36
72%73%
12%
60%
26%
------
37%
NM--
12%----
43%----0%----
2,50049%
25.5
76%78%
2%
59%
46%
38%20%20%20%
AZ--4%----
50%1,215.06%
1%----
2,50043%
24
87%74%
4%
60%
50%
28%17%12%19%
Men Women
Notes: N varies by question, depending on the skip logic and on the thoroughness of respondents. The total possibleN’s are: 478 (NY men), 339 (NM men), 390 (AZ men), 41 (NY women), 51 (NM women), and 137 (AZ women).Estimates for the men are more reliable than for women due to sample size.*Values are not reported if fewer than 30 individuals answered a particular question.**Race and ethnicity were asked differently in NY from NM and AZ. In NY, people of any race could identify withHispanic ethnicity. In NM and AZ, race and ethnicity were mutually exclusive categories.

Right-Sizing Justice
September 1999 Civic Report
20
II. Methodology
The surveys from the three states used almost identical instruments and very similar protocols.In all cases, the survey was anonymous and voluntary. Correctional officers brought inmates tothe classrooms in which the surveys were administered by outside researchers. Spanish ver-sions of the survey were available. Inmates received no compensation for their effort.
The survey instrument was very similar to that used by DiIulio and Piehl in New Jersey andWisconsin, which in turn were similar to the RAND surveys conducted in the 1970s. In thoseother administrations, however, inmates received compensation for their participation (in theform of stipends to commissary accounts).
New York: A survey of 634 new admissions to the New York prison population con-ducted in late 1996 and early 1997. 541 of the surveys were useable for analysis. The sampleincluded inmates who entered the system through each of the four intake centers for thestate Department of Corrections. The sample is a census of one week’s incoming admis-sions. As such, the sample represents the flow of inmates into the system, not the currentprison population.
New Mexico: A total of 429 inmates were surveyed; 401 were useable. Female inmates weresampled at a higher rate than were male inmates. New Mexico has one intake facility for menand one for women, where the surveys were administered. The first interviews were conductedon May 2, 1997 and the last on August 22, 1997. During this period, an interviewer visited themen’s facility every week (except over the Fourth of July holiday) and the women’s facilityevery two or three weeks.
Arizona: A total of 554 surveys were administered; 534 were useable. Like New Mexico,Arizona has one intake facility for men and one for women, where the surveys were adminis-tered. The first interviews were conducted on July 3, 1997 and the last on September 6, 1997.
REFERENCES
Blumstein, Alfred and Allen Beck, Factors Contributing to the Growth in U.S. Prison Popula-tions, (Crime and Justice conference, Washington, 1998).
Bonczar, Thomas P. and Allen J. Beck, Lifetime Likelihood of Going to State or Federal Prison,(Bureau of Justice Statistics, No. NCJ-160092, 1997).
Boyum, David and Mark A. R. Kleiman, “Alcohol and Other Drugs,” in Crime (James Q. Wil-son & Joan Petersilia, eds., San Francisco: Institute for Contemporary Studies, 1995).
Criminal Justice Institute, The Corrections Yearbook, (Criminal Justice Institute, 1997).
DiIulio, John J., Jr. and Anne Morrison Piehl, Does Prison Pay? The Stormy National Debateover the Cost-effectiveness of Imprisonment, 9 BROOKINGS REVIEW 28 (Fall, 1991).
Fleisher, Mark A., Beggars and Thieves: Lives of Urban Street Criminals, (University of Wiscon-sin, Madison Press, 1995).

Civic Report September 1999
Right-Sizing Justice
21
Freeman, Richard B., Why Do So Many Young American Men Commit Crimes and What MightWe Do About It? 10 JOURNAL OF ECONOMIC PERSPECTIVES 25 (1996).
Gillard, Darrell and Allen J. Beck, Prison and Jail Inmates at Midyear 1997 (Bureau of Justice,No. NCJ-167247, 1998).
Hagan, John, “Children of the Prison Generation: Collateral Consequences of Imprisonment forChildren and Communities,” (unpublished paper, 1998).
Miller, Ted R., Mark A. Cohen, and Brian Wiersema, Victim Costs and Consequences: A NewLook, (National Institute of Justice, 1996).
Moore, Mark, Policies to Achieve Discrimination on the Effective Price of Heroin, 63 AMERICAN
ECONOMIC REVIEW 270 (1973).
Moore, Mark H. and Anne Morrison Piehl, Reckoning the Value of Prisons: The Strengths andLimitations of Benefit/Cost Analyses of the Crime Reduction Effects of Imprisonment, (Unpub-lished paper, Harvard University, 1998).
Piehl, Anne Morrison and John J. DiIulio, Jr., Does Prison Pay? Revisited, 13 BROOKINGS REVIEW 20(Winter, 1995).
Sourcebook of Criminal Justice Statistics 1995 (Kathleen Maguire & Ann L. Pastore, eds., U.S.Department of Justice, Bureau of Justice Statistics, USGP0, 1996).
Sourcebook of Criminal Justice Statistics 1996 (Kathleen Maguire & Ann L. Pastore, eds., U.S.Department of Justice, Bureau of Justice Statistics, USGP0, 1997).
U.S. Department of Justice, Crime in the United States 1997, (FBI Uniform Crime Reports, USGPO,1998).
Zedlewski, Edwin W., Making Confinement Decisions, (National Institute of Justice Research inBrief, 1987).
Zedlewski, Edwin W., New Mathematics of Imprisonment: A Reply to Zimring and Hawkins,35 CRIME AND DELINQUENCY 169-73 (Jan. 1989).

Right-Sizing Justice
September 1999 Civic Report
22
ENDNOTES
* Our study had its origins in deliberations of the Council on Crime in America. We are grateful to the Council;the foundations that supported our independent research; the Manhattan Institute’s Center for Civic Innova-tion; Mr. Peter Widulski, Ms. Pauline Spaulding and Ms. Melinda Ogle, who were instrumental to our NewYork, New Mexico and Arizona survey administrations, respectively; and the officials and prisoners in eachstate who cooperated with our study. The data analyses and opinions expressed herein, however, are solelythose of the authors.
1 Roper Starch Worldwide, reporting survey results for August 1998, as summarized in THE AMERICAN ENTER-PRISE, (January/February 1999) at 93.
2 The State of Violent Crime in America, at i.
3 Council on Crime in America, Preventing Crime, Saving Children (The Manhattan Institute for Policy Re-search, 1997).
4 Thomas P. Bonczar and Allen J. Beck, “Lifetime Likelihood of Going to State or Federal Prison,” (Bureau ofJustice Statistics, No. NCJ-160092, 1997).
5 The critical assumption is that the current distribution of inmates approximates the “steady state.” However,in a period of rapid population growth, an extrapolation based on cross-sectional data may yield estimatesthat overstate the lifetime likelihood of going to prison. This is because there will be a large number of “first-time” offenders at all ages in the early stages of prison growth. As people age in this new regime, there will befewer additional first-time offenders due to the larger pool of people with prison experience. Therefore, esti-mates based on the early experience in a new sentencing regime would tend to produce an upward bias in thelifetime likelihood of incarceration. On the other hand, Bonczar and Beck (1997) used data collected in 1991.The increase in the incarceration rates since 1991 may offset this upward bias.
6 See Ted R. Miller, Mark A. Cohen, and Brian Wiersema, “Victim Costs and Consequences: A New Look,”(National Institute of Justice, 1996); or Mark Moore, Policies to Achieve Discrimination on the Effective Price ofHeroin, 63 AMERICAN ECONOMIC REVIEW 270 (1973), for more details.
7 This wide band for costs reflects two things. First, the actual cost of corrections varies considerably from stateto state. Second, measuring the cost of corrections is notoriously difficult, and there is no standard or acceptedmethod. This makes inter-state comparisons risky. In any case, according to one calculation, Arizona’s perinmate costs are just below the average, whereas those in both New York and New Mexico are among thehighest in the nation (The Corrections Yearbook 74-75 (Criminal Justice Institute, 1997)).
8 Zedlewski determined the cost of a single crime by dividing the total costs of the criminal justice system in ayear by the number of crimes committed in that year.
9 Edwin Zedlewski, New Mathematics of Imprisonment: A Reply to Zimring and Hawkins, 35 CRIME AND
DELINQUENCY 171 (Jan. 1989).
10 John J. DiIulio Jr. and Anne Morrison Piehl, Does Prison Pay? The Stormy National Debate over theCost-effectiveness of Imprisonment, 9 BROOKINGS REVIEW 28 (Fall, 1991); and Anne Morrison Piehl and John J.DiIulio, Jr., Does Prison Pay? Revisited, 13 BROOKINGS REVIEW 20 (Winter 1995).
11 All relevant previous analyses, from Zedlewski (1987) through Piehl and DiIulio (1995) have imputed zerosocial cost to illicit drug sales. To illustrate why, consider that in Piehl and DiIulio (1991), the prisoner at the75th percentile (i.e., 3 out of 4 of the prisoners in the sample imposed greater social costs than he did) was ahigh-rate property offender. In effect, the empirical evidence on offending patterns suggests that
Civic Report September 1999
Right-Sizing Justice
23
incapacitating high-rate property offenders via incarceration reduces the total number of property crimesbecause one high-rate house burglar or car thief is not simply “replaced” by another, nor do non-incar-cerated high-rate property offenders respond to the incarceration of another high-rate property offenderby doing all the crimes they would otherwise have done plus “his.” In fact, his incarceration may evenreduce their marginal rate of offending (i.e., a deterrence effect). But most of the empirical evidencesuggests that the incapacitation value of incarcerating the median drug offender is zero or close to zero.There are definitely conditions under which street-level anti-drug law enforcement makes drugs moreexpensive and deters both consumption and sales; for example, see Mark A. R. Kleiman, Against Excess:Drug Policy for Results (Basic Books, 1992). But there is as yet little evidence of an inverse relationshipbetween, for example, quadrupling prison commitments from 19 to 80 per 1,000 drug arrests (as we didin America from 1980 to 1994) and the number of felonious street-level drug transactions. James Q.Wilson, in an article otherwise devoted to exposing the empirical fallacies of arguments for legalizingdrugs, captures the academic consensus on the subject when he observes that a “robber taken off thestreet is not replaced by a new robber who has suddenly found a market niche, but a drug dealer sentaway is replaced by a new one because an opportunity has opened up.” See Wilson, What to Do AboutCrime, COMMENTARY (Sept. 1994) at 31.
As explained in the text, our other social cost estimates are derived from relevant analyses of jury awards.There are no other social cost estimates in the literature for drug sales. We here impute a social cost of $5 perdrug crime as a considered response to critics of previous analyses who argue that imputing zero cost to thesecrimes “analytically decriminalizes” or “legalizes” drugs, and wrongly assumes that all street-level drugcrimes always and everywhere, from small towns to inner cities, are subject to an instant and perfect “replace-ment effect.” But the $5 imputation does not in any way fundamentally change our bottom-line results fromwhat they would be had we instead imputed zero cost as per the practice in the literature to date, nor does itpreclude others from imputing larger costs and reanalyzing the data accordingly.
12 The correlation between using the numbers we report below in calculating “social costs” (definedbelow) and using the numbers some of us have used in the past is 0.993 (c.f. the estimates in DiIulio andPiehl 1991; and Piehl and DiIulio 1995). The point of doing this is that some economists argue that stolenproperty is not destroyed, it is “transferred” to others. Therefore, the value of the stolen property shouldnot count as a social cost. Taken seriously, this should argue for subtracting the entire value of propertytaken from social loss estimates. This seems extreme, because we know that the “resale” price of stolenproperty is much lower than the replacement value. We have taken an admittedly arbitrary discount of25%. Note that because the value of the property is quite small compared to the total costs per crime,precision on this dimension makes little substantive difference.
13 Among new court commitments to prisons in 1992, 4.1% were convicted of homicide (includes murder,non-negligent manslaughter, and negligent manslaughter). These figures come from data collected in 38states, covering the vast majority of new inmates. Sourcebook of Criminal Justice Statistics 1996, Table 6.33(Kathleen Maguire & Ann L. Pastore, eds., U.S. Department of Justice, Bureau of Justice Statistics, USGPO,1997). As detailed in the notes to Table 2, the omission of murderers drops 40 people from our analyses.
14 It is possible that some of the people in this row have been sentenced for a crime they committed morethan four months before their arrest, which could account for the large number of people who weresentenced for crimes listed in Table 1 but who do not self-report committing any crimes. Of course, thereis no way to determine the extent of this phenomenon, and even if there were there is no way of ascertain-ing the number of Table 1-listed crimes each person committed. Therefore, people who were sentencedfor, but did not self-report, Table 1-listed crimes are excluded from further analysis.
15 From admissions data to prisons nationwide, we learn that 22% of offenders committed to prison had a“most serious offense” that was not specifically asked about in the self-report section of our survey. Theseoffenses include: kidnapping (0.6%), drug possession (6.7%), other drug offenses (non-trafficking) (4.8%),public order offenses (including weapons violations and driving while intoxicated) (8.8%), and other offenses(1.1%). Sourcebook at Table 6.33.

Right-Sizing Justice
September 1999 Civic Report
24
16 It should be kept in mind that these social costs are for a subset of the entering offenders. Excluded aremurderers and offenders who did not report having committed a crime that we asked about.
17 While the samples of women inmates in the three states were small, it appears that the incapacitation benefitsare lower for women than they are for men. An important dimension of this finding is that the proportion of“drug-only” offenders is as high or higher for women than men. This is especially the case if “drug possess-ors” are included in the category of drug-only offenders.
Given the small sample size, the number of dimensions that can be analyzed, as well as the reliability of theestimates, are limited. Here we must rely primarily on the Arizona data, which include 71 women inmateswith crimes associated with social costs. Relative to the men in Arizona, at each point in the distribution (c.f.,Table 4), the social costs associated with the women were lower than for the men, though these differences werenot always statistically significant.
18 While there was some difference in New Mexico, given the huge variation in social cost and the small numberof African Americans in our sample (n=23), we cannot say anything definitive.
19 Alfred Blumstein and Allen Beck, “Factors Contributing to the Growth in U.S. Prison Populations,” (Crimeand Justice Conference, Washington, 1998).
20 Mark Moore, Policies to Achieve Discrimination on the Effective Price of Heroin, 63 AMERICAN ECONOMIC
REVIEW 270 (1973).
21Thomas P. Bonczar and Allen J. Beck, “Lifetime Likelihood of Going to State or Federal Prison,” (Bureau of
Justice Statistics, No. NCJ-160092, 1997).
22 Richard B. Freeman, Why Do So Many Young American Men Commit Crimes and What Might We Do AboutIt? 10 JOURNAL OF ECONOMIC PERSPECTIVES 25 (1996).
23 Mark A. Fleisher, Beggars and Thieves: Lives of Urban Street Criminals, (University of Wisconsin, MadisonPress, 1995).

The Center for Civic Innovation’s (CCI) purpose is to improve the quality of life in cities by shaping publicpolicy and enriching public discourse on urban issues.
CCI sponsors the publication of books like Mayor Goldsmith’s The Twenty-First Century City, which providesa blueprint for getting America’s cities back in shape, and George Kelling’s and Catherine Coles’ FixingBroken Windows, which explores the theory widely created with reducing the rate of crime in New York andother cities. CCI also hosts conferences, publishes studies, and holds luncheon forums where prominentlocal and national leaders are given opportunities to present their views on critical urban issues. Cities on aHill, CCI’s newsletter, highlights the ongoing work of innovative mayors across the country.
EXECUTIVE DIRECTOR
Henry Olsen
Non-ProfitOrganizationUS Postage
PAIDPermit 04001
New York, NY
ADVISORY BOARD
Mayor Stephen Goldsmith, ChairmanMayor Susan GoldingMayor John O. NorquistMayor Edward G. RendellMayor Bret Schundler
FELLOWS
John J. DiIulio, Jr.Chester E. Finn, Jr.
Floyd H. FlakeGeorge L. Kelling
Diane RavitchPeter D. SalinsAmy Sherman
Roger Starr
CC E N T E R F O R C I V I C I N N O V A T I O N
A T T H E M A N H A T T A N I N S T I T U T EA T T H E M A N H A T T A N I N S T I T U T EA T T H E M A N H A T T A N I N S T I T U T EA T T H E M A N H A T T A N I N S T I T U T EA T T H E M A N H A T T A N I N S T I T U T E
C i
52 Vanderbilt Avenue • New York, NY 10017
www.manhattan-institute.org
Would you prefer to receive this publication via e-mail? If so, please supply us with your e-mail address bycontacting us at [email protected] or 212-599-7000. Previous publications are also available.