Embed Size (px)
Citation preview

RIDES TO WELLNESSCOMMUNITY SCAN PROJECT
SPRING 2017

>>> 2
RIDES TO WELLNESS COMMUNITY SCAN PROJECTHEALTH OUTREACH PARTNERS
TABLE OF CONTENTS
Introduction.....................................................................................................................................................
National Survey: Transportation Barriers and Missed Appointments......................................................
Acknowledgements.........................................................................................................................................
Introduction........................................................................................................................................................
Literature Review Key Findings.....................................................................................................................
Methodology.....................................................................................................................................................
Results.................................................................................................................................................................
Discussion..........................................................................................................................................................
Lessons Learned..............................................................................................................................................
Conclusion.........................................................................................................................................................
Appendix............................................................................................................................................................
References.........................................................................................................................................................
Rides to Wellness Community Profiles.........................................................................................................
Acknowledgements.........................................................................................................................................
Introduction........................................................................................................................................................
Southern Illinois: Rural Medical Transportation Network........................................................................
Worcester, Massachusetts: Smart Transit for Healthcare.......................................................................
South-Central Missouri: HealthTran..............................................................................................................
Buffalo, New York: Go Buffalo Mom............................................................................................................
Portland, Oregon: Ride Connection.............................................................................................................
King County, Washington: HopeLink............................................................................................................
3
5
6
7
7
11
14
18
19
19
20
22
25
26
27
28
30
32
34
36
38

>>> 3
RIDES TO WELLNESS COMMUNITY SCAN PROJECTHEALTH OUTREACH PARTNERS
INTRODUCTION
IN ANY GIVEN YEAR, 3.6 MILLION AMERICANS MISS AT A MINIMUM ONE MEDICAL APPOINTMENT DUE TO A LACK OF TRANSPORTATION.1
Transportation is a critical component of the United States health care system. Lack of transportation can cause patients to miss medical appointments, disrupting the continuity of care and causing delays in the delivery of necessary health and wellness services. Research indicates that lack of transportation is a barrier to health care for various segments of patients, including rural veterans (Buza et al., 2011); low-income immigrants in suburban communities (Silver, Blustein, & Weitzman, 2012); patients with chronic disease (Guidry, Aday, Zhang, & Winn, 1997); poor and low-income adults (Ahmed, Lemkau, Nealeigh, & Mann, 2002); and children and families (Children’s Health Fund, 2011). Access to reliable and affordable transportation is associated with increased utilization of health services, improved health outcomes, and greater likelihood of primary care visits by the pediatric population, adults living with HIV, and frequent users of emergency departments (Kim, Norton, & Stearns, 2009).
Transportation is regularly cited as a primary cause of missed appointments. Missed medical appointments result in poor health outcomes for patients and increased costs to the health care system. Nevertheless, data on the costs associated with transportation barriers to health care are not consistently collected, analyzed, and disseminated. Health centers across the country are increasingly working to remove transportation as a barrier to care for patient populations; however, broad-based evidence demonstrating the return on investment for providing transportation to care is not yet available. Further research is needed to measure the impact of transportation barriers on clinical outcomes and the impact of transportation barrier interventions (Syed, Gerber, & Sharp, 2013). A better understanding of the costs that transportation barriers pose to the health care system would generate broad interest in innovative patient-centered solutions.
Rides to Wellness Community Scan Project
In May 2016, Health Outreach Partners (HOP) launched the Rides to Wellness Community Scan Project. Funded by the Federal Transit Administration (FTA), the purpose of the project was twofold: to determine the impact of transportation barriers on health care costs and to highlight existing patient-centered transportation solutions. The project consisted of two elements, the results of which are summarized in this report:
▲ National survey: Implementation of a national survey of health centers and private providers to identify the impact of lack of transportation on missed medical appointments and associated health care costs.
▲ Community profiles: Development of profiles illustrating communities that are adopting patient-centered transportation solutions that show promising opportunities for return on investment.
Through the National Survey, HOP gathered data from health centers on the costs associated with missed appointments, specifically those due to transportation barriers. The national survey collected data on the following themes: 1) the scope of the problem of missed appointments and transportation barriers; 2) geographic areas; 3) tracking data; 4) costs; 5) high risk populations; 6) clinical outcomes; and 7) strategies. The findings from the national survey demonstrate that transportation barriers and missed appointments are an ongoing issue of concern for health centers, regardless of whether they are situated in urban, suburban, or rural areas. Further, it is clear that transportation barriers impact the health outcomes of patients, as well as the clinical and financial performance of health centers.
1 Wallace R., Hughes-Cromwick, P. & Mull, H. (2005). Access to health care and nonemergency medical transportation: Two missing links. Transportation Research Record: Journal of the Transportation Research Board, 1924.

>>> 4
RIDES TO WELLNESS COMMUNITY SCAN PROJECTHEALTH OUTREACH PARTNERS
For the Community Profiles, HOP researched transportation solutions that show promising opportunities for return on investment and aim to ensure patients can get to the health and wellness services they need. The profiles highlight examples of six models that demonstrate innovative ways to design, implement, and sustain efforts to address transportation barriers to care. The communities profiled include: Buffalo, New York; King County, Washington; Portland, Oregon; South-Central Missouri; Southern Illinois; and Worcester, Massachusetts. The barriers these communities confront when addressing patient access to care are generally complex and multidimensional issues. Yet, they are finding creative ways to address transportation barriers. One crosscutting theme that emerged in the profiles was the importance of demonstrating the program’s financial sustainability. The efforts of the profiled communities demonstrate that creative thinking and collaboration are proven solutions to addressing transportation barriers.

NATIONAL SURVEY: TRANSPORTATION
BARRIERS & MISSED APPOINTMENTS

>>> 6
RIDES TO WELLNESS COMMUNITY SCAN PROJECTHEALTH OUTREACH PARTNERSNATIONAL SURVEY: TRANSPORTATION BARRIERS & MISSED APPOINTMENTS
ACKNOWLEDGEMENTS
The report was prepared for Health Outreach Partners (HOP) by Melissa Mollard-Martin, MPH, of The Results Group. The report is a product of HOP’s Rides to Wellness Community Scan Project, funded by the Federal Transit Administration (FTA) under Federal Award Id Number (FAIN): CA-2016-002-00.
HOP would like to extend its appreciation to the various people who contributed to the development of the report:
Experts Providing Input and Interviews: • Flora Castillo, Vice President of Community and Strategic Engagement, UnitedHealthcare• Paul Perry, Deputy Director, Veterans Transportation Program, Veterans Administration• Marc Chevalier, LCSW, National Program Coordinator, Veterans Administration• Jo Ayers, COO, Kokua Kalihi Valley Community Health Center• Jared Christenot, Quality Officer, Kokua Kalihi Valley Community Health Center• Dennis Johnson, Executive Vice President, Children’s Health Fund• Nancy Johnson, CEO, El Rio Community Health Center• Dale Marisco, Director, Community Transportation Association of America• Beverly Sirvent, Migrant Health Services Director, Finger Lakes Community Health• Mary Zelazny, CEO, Finger Lakes Community Health
Rides to Wellness Community Scan Partners Group:• Administration for Community Living• UnitedHealthcare• Department of Transportation• Centers for Medicare and Medicaid Services• Kaiser Permanente• Health Resources and Services Administration• Veterans Administration
Federal Transit Administration:• Danielle Nelson, Rides to Wellness Program Manager, Rural and Targeted Programs• Marianne Stock, Division Chief, Rural and Targeted Programs
HOP Staff: • Sonia Lee, MPH, Senior Manager, Client Services and Communications (Project Co-Lead)• Alexis Wielunski, MPH, Senior Manager, Organizational Learning & Sustainability (Project Co-Lead)• Caitlin Ruppel, Associate Project Manager (Editorial Contributor)• Diana Lieu, (Design and Layout)• Kristen Stoimenoff, MPH, Deputy Director (Editorial Contributor)
>>> 7
RIDES TO WELLNESS COMMUNITY SCAN PROJECTHEALTH OUTREACH PARTNERSNATIONAL SURVEY: TRANSPORTATION BARRIERS & MISSED APPOINTMENTS
INTRODUCTION: NATIONAL SURVEY
Transportation barriers pose a significant public health threat and economic risk to the health care system. Estimates for annual costs associated with missed appointments range from $3 million in a clinical setting (Kheirkhah et al., 2016) to $564 million for the VA system (Davies, et al., 2016). National agencies, such as the Health Resources and Services Administration (HRSA) and the Veterans Health Administration (VA), presently do not collect national data on missed appointments, or the cost of missed appointments due to transportation barriers. Thus, little is known about the cost to the health care system of missed appointments due to transportation barriers. Through the “Rides to Wellness Community Scan Project”, HOP conducted a national survey of health centers and private providers to measure the impact of lack of transportation and missed appointments on health care costs. HOP designed a national survey to be administered to a range of provider types, guided by the following research questions:
1. How does lack of transportation impact health care costs, including the percentage of missed appointments?
2. What percentage of missed appointments are due to transportation issues?
3. What are the direct costs associated with missed appointments?
4. What are the indirect costs associated with missed appointments?
Between September 2016 and early January 2017, HOP collected data from health centers and private providers through an online survey. This report provides a summary of the research methodology, survey results, as well as analysis and lessons learned.
LITERATURE REVIEW KEY FINDINGSA literature review was conducted to establish a baseline understanding of the intersection of transportation barriers and missed appointments, in order to inform the development of the survey and the analysis of survey data. The findings from the literature review were categorized into four areas: 1) the nature and scope of missed medical appointments; 2) transportation modes to care; 3) transportation barriers to care, and 4) costs associated with missed appointments due to transportation barriers.
1) Missed Medical Appointments
Key Finding: Rates of missed appointments vary widely across health care sites.
There is significant literature related to missed health care appointments, including: the percentage of missed appointments in specific health care systems; determining whether any demographic factors are predictive of missing an appointment; the adverse effects of missing appointments; and evaluating the effectiveness of strategies to mitigate missed appointments. For the purposes of this literature review, we will be focusing only on the first three categories.
The health care system is fragmented in the United States, and consists of a mix of public and private providers from single physician primary care groups to large health care systems. Therefore, it is extremely difficult to identify the average percentage of missed appointments throughout the entire system. Estimates range from 3% to 80%, reflecting significant variations depending on the site, and suggesting that any health care site interested in addressing the issue of missed appointments first needs to understand the scope of the problem within their system. In a study of one health center with

>>> 8
RIDES TO WELLNESS COMMUNITY SCAN PROJECTHEALTH OUTREACH PARTNERSNATIONAL SURVEY: TRANSPORTATION BARRIERS & MISSED APPOINTMENTS
multiple site locations, missed appointments were estimated between 6% - 26% depending on the site, suggesting that it is difficult to estimate the rate of missed appointments for even one health center with multiple locations due to the variance (Moore, Wilson-Witherspoon, and Probst, 2001).
Key Finding: Missed appointments are associated with poorer health outcomes.
Patients who miss health care appointments have adverse health outcomes, including complications in chronic illness, increased hospital readmissions, medication noncompliance, and disruption in the continuity of care (Mehrotra, Keehl-Markowitz, &Ayanian, 2008; Salameh, Olsen & Howard, 2012). Evidence indicates that missing follow-up appointments to primary care providers can lead to increased health risks for patients who miss diagnostic testing and follow-up for treatment (Karter, et al., 2004; Geoge & Rubin, 2003). Missed appointments can also compromise early detection of disease (Weingarten & Meyer, 1997).
Key Finding: Demographic factors, such as race/ethnicity and income status, are associated with missed appointments.
There is some evidence that race/ethnicity is a predictor of missed appointments. A study of a safety net health system in Baltimore found that African-Americans were 1.8 times more likely to miss appointments, and Hispanic/Latinos and American Indian/Alaskan Natives 2 times more likely compared to White/Caucasian patients (Shimatsu, et al., 2016). They also found that patients with medical complexity and major mental illness were more likely to miss appointments. Other studies found that African-American or Hispanic patients were more likely to miss appointments (Kaplan-Lewis & Percac-Lima, 2013; Parker, et al., 2012). Some studies suggest cultural and linguistic barriers result in missed appointments (Barr & Wanat, 2005). Financial reasons, such as lack of insurance and out-of-pocket health care costs for insured individuals, are also significant barriers for appointment adherence (DeNavas-Walt, Proctor, Smith, 2012).
Being in an ethnic minority group was associated with missed medical appointments, but so was being older, poorer, less educated, and female (Wallace et al., 2005). In one Department of Transportation (DOT) study, controlling for socioeconomic status (SES) and mode of travel, researchers found that African-Americans had higher burdens of travel compared to Whites. While it is important for researchers to examine variables independently in predictive statistical models, it is also important to examine whether there is confounding or interaction occurring. It appears that transportation barriers may affect ethnic minorities disproportionately and should be a consideration of health care systems when examining transportation solutions.
2) Transportation Modes to Care
Key finding: Not having access to a car is independently associated with missing appointments.
Several studies indicate that for many people, driving themselves is the preferred mode of transportation to medical appointments, and not having access to a vehicle is an identified barrier (Guidry, et al., 1997; Salloum, et al., 2012; Rask, et al., 1994; Flores, et al., 1998). One study found that 82% of those who kept their appointment had access to a car, compared to 58% of those who did not keep their appointment (Yang, 2006). Another study found that 25% of missed appointments were due to transportation issues, and that patients relying on the bus were twice as likely to miss appointments compared to car users (Silver, et al., 2012).

>>> 9
RIDES TO WELLNESS COMMUNITY SCAN PROJECTHEALTH OUTREACH PARTNERSNATIONAL SURVEY: TRANSPORTATION BARRIERS & MISSED APPOINTMENTS
3) Transportation Barriers to Care
Key finding: Transportation is frequently identified as a barrier to health care utilization.
It is difficult to quantify or provide an exact estimate for the scope of the problem. Research has found transportation restricts access to health services for as little as 3% of a sample population or as much as 8% (Ahmed, Lemkau, Nealeigh, & Mann, 2002; Children’s Health Fund, 2012; Davies et al., 2016; Mattson, 2011; Syed et al., 2013; Sharp & Hamilton, 2001; Ferguson & Kokesh, 2005; Rust, et. al., 1995; Johnson, Mold, Pontious, 2007; Bennett & Baxley, 2009; Dreiher, et al., 2008; Transportation for Healthy Communities Collaborative, 2002). Studies examining transportation as a barrier have consistently found it to be significant for various patient populations and geographies (Wallace, Hughes-Cromwick, Mull, Khasnabis, 2005; Kim, et. al., 2007; Garwick, Kohrman, Wolman, Blum, 1998; Cristancho, Garces, Peters, Mueller, 2008; Buzza, et. al., 2011; Bambra, et al., 2010; Goins, Williams, Carter, Spencer, Solovieva, 2005; Garcia Popa-Lisseanu, et. al., 2005; Ahmed, Lemkau, Nealeigh, Mann, 2001; Blazer; Landerman, Fillenbaum, Horner, 1995; Crain, Kercsmar, Weiss, Mitchell, Lynn, 1998; Diamant, et. al., 2004). Individuals living in rural areas often experience transportation barriers to care (Goins, et. al., 2005; Iezzoni, Killeen, O’Day, 2006; Kempf, et. al., 2010). For example, in one study conducted in Wisconsin, more rural than urban patients reported problems with transportation and the distance to their provider (Heckman, et al., 1998). A national cross-sectional survey also found that rural patients reported more problems with transportation to appointments than urban patients (Probst, et al., 2007).
Studies examining transportation as a barrier to missed appointments tend to focus on particular patient populations and/or geographic areas. Therefore, what may be true for one patient population within a particular geographic region may not be generalizable to similar patient populations in other geographic regions, especially since different geographic areas will have unique transportation resources and systems. Several studies conducted within specific geographic regions found no difference between rural and urban households. One study examined whether rural households experienced delays in care for their children with special needs, and found no difference, after controlling for socioeconomic status (Skinner & Slifkin, 2007).
Few studies, however, have examined the direct correlation between limited or unavailable transportation options and missed or delayed medical appointments. An analysis of national transportation and health care data sets from 2001 and 2002 concluded that approximately 3.6 million Americans miss at a minimum one medical appointment each year due to a lack of transportation (Wallace et al., 2005). This article has been routinely cited within recent literature and at present provides the most comprehensive estimate for the number of missed medical appointments that may be attributed exclusively to a transportation issue (MacLeod et al., 2015; Syed et al., 2013).
Key Finding: Some populations are at higher risk of missing appointments due to transportation barriers.
There are key populations that are more likely to bear the burden of transportation barriers. For example, parents with young children cite transportation as the reason they could not bring their child in for a scheduled appointment (Crain, et al., 1998). Seasonal agricultural workers have also indicated that transportation barriers may impact their ability to make medical appointments (Weathers, et al., 2004).
The elderly and veterans are additional groups for whom transportation poses a barrier to utilization of health care services (Arcury et al., 2005; Battista et al., 2015; Buza et al., 2011; Children’s Health Fund, 2012; Kheirkhah et al., 2016; MacLeod et al., 2015; Mattson, 2011; Pellowski, 2013; Peterson, 2015; Syed et al., 2013; Wallace et al., 2005). The elderly may have chronic health conditions, be unable to drive themselves, and have limited transportation options that make it difficult to make it to an appointment. In a study on veterans, researchers found that those with uncontrolled pain or without primary social support identify transportation as a barrier (Zullig, et. al., 2012).

>>> 10
RIDES TO WELLNESS COMMUNITY SCAN PROJECTHEALTH OUTREACH PARTNERSNATIONAL SURVEY: TRANSPORTATION BARRIERS & MISSED APPOINTMENTS
4) Costs Associated with Missed Appointments and Transportation Barriers
Key finding: There are studies that quantify the cost of missed appointments to health care sites or systems.
Health care systems make up 17.8% of the U.S. Gross Domestic Product (Centers for Medicaid and Medicare Services, 2017). When patients miss an appointment, there is a potential for adverse health outcomes for the patient, and a loss of income and revenue for the health care site. One study found that a health care system had an average no-show rate of 62 appointments per day and an estimated annual cost of $3 million (Clark, 2006). Another study of a large family practice center found that missed appointments resulted in an annual revenue shortfall of 3% - 14% (Moore, et. al., 2001). Clearly, with health care costs rising, health care sites and systems are looking for ways to decrease the number of missed appointments. Determining how to remove the transportation barrier is an important step toward reaching that goal.
Key finding: Costs associated with missed appointments due to transportation barriers have not been established in the empirical literature.
There are estimates for annual costs associated with missed appointments (ranging from $3 million in a clinical setting to $564 million for the VA system). However, there are no studies that isolate the costs of missed appointments due to transportation issues.

>>> 11
RIDES TO WELLNESS COMMUNITY SCAN PROJECTHEALTH OUTREACH PARTNERSNATIONAL SURVEY: TRANSPORTATION BARRIERS & MISSED APPOINTMENTS
METHODOLOGY
Research Questions
The specific purpose of this research study was to determine the extent to which health care sites collect and track information on missed appointments, and specifically those due to transportation barriers, and associated costs. Specific research questions that guided the study were:
1. How does lack of transportation impact health care costs, including the percentage of missed appointments?
2. What percentage of missed appointments are due to transportation issues?
3. What are the direct costs associated with missed appointments?
4. What are the indirect costs associated with missed appointments?
Participants
The primary respondents of the survey were HRSA-funded health centers.1 Health centers were recruited through email, and 188 responses were collected for a sample size of about 15%. Initially, the research design was conceived to include three distinct types of health systems: health centers; VA medical centers; and UnitedHealthcare’s Medicaid Managed Care network. Due to their layered approval process, the VA was not able to grant approval for HOP to administer surveys to its medical centers within the timeframe for the project. For the Medicaid Managed Care network, HOP collaborated with UnitedHealthcare. UnitedHealthcare recognized the need for doing this research and provided access to the mailing list of Medicaid Managed Care physicians. However, UnitedHealthcare notified HOP on the outset that response rates for provider surveys are typically low. It was also noted that this data does not currently exist, nor is it being tracked.
Human Subjects Considerations
HOP submitted the research protocol to the Institutional Review Board (IRB) for determination whether the research qualified as “human subjects.” The IRB determined that the nature of the study and questions asked about operations and financials did not constitute human subjects research (see Appendix A).
In order to maximize participation in the survey, HOP offered incentives to respondents. They included: 1) Raffle for $100 Amazon Gift Cards (30 randomly selected); 2) Two conference registrations of choice (up to $800 each); 3) Customized, one-hour consultation call with HOP ($1000 value); and 4) Customized, one-hour webinar conducted by HOP ($2,500 value). These incentives were designed to be substantial enough to encourage participation. After the survey period was closed, 34 sites were randomly selected to receive the incentives for participation.
Survey Design
The survey utilized a cross-sectional design with a mixed-methods approach. The survey consisted of 25 questions, consisting of a mix of short answer, Likert scale, and ranked choice response categories.
For analytic purposes, the survey was designed to focus on the following domains:
▲ Scope of problem: To what extent are missed appointments a problem?
▲ Geographic areas: Are there any significant differences in responses by geographic type (e.g. urban, suburban, rural)?
1 For the purpose of the report, HRSA-funded health centers will be referred to as health centers.

>>> 12
RIDES TO WELLNESS COMMUNITY SCAN PROJECTHEALTH OUTREACH PARTNERSNATIONAL SURVEY: TRANSPORTATION BARRIERS & MISSED APPOINTMENTS
▲ Tracking data: To what extent is information being collected and tracked on missed appointments, and in particular, missed appointments due to transportation barriers?
▲ Cost: What is the average cost of missed appointments, and in particular, the average cost of missed appointments due to transportation barriers?
▲ High risk populations: To what extent do transportation barriers disproportionately affect particular patient groups (e.g. pregnant women, veterans, the elderly)?
▲ Clinical outcomes: What are the implications of missed appointments due to transportation barriers on clinical outcomes?
▲ Strategies: What are some specific strategies (e.g. quality improvement efforts) used to address transportation barriers?
Procedures
Before survey development commenced, HOP conducted a thorough literature review to determine the state of the empirical evidence around missed appointments and transportation barriers. Additionally, key informant interviews were conducted with five representatives of health centers chosen for their specific engagement with HOP and existing transportation efforts. Informants were asked to provide feedback on themes to explore within the survey, wording that would be most appropriate, and what to consider around potential differences between health centers located within rural, suburban, and urban settings. After these interviews were reviewed and analyzed, an initial draft of the survey was completed and disseminated to key stakeholders for feedback and review. These stakeholders included: program officers at the FTA, senior leadership at HOP, and members of the Rides to Wellness Community Scan Partners Group. The Partners Group included representatives from Administration for Community Living, UnitedHealthcare, Department of Transportation, Centers for Medicare and Medicaid Services, Kaiser Permanente, HRSA, and the VA. A revised version was completed after this feedback was incorporated.
Prior to launching the survey, HOP emailed a pre-survey via SurveyMonkey to a list of Project Directors from health centers to identify and get contact information for the best-equipped person to answer the survey questions. HOP received 154 pre-surveys, with names and email addresses for staff to whom the full survey should be sent. The full survey was emailed via SurveyMonkey to those specific individuals, as well as to the full list of HRSA-funded sites, whether or not they responded to the pre-survey. At the suggestion of HOP’s HRSA Project Officer, HOP sent additional reminders to complete the survey via HRSA’s Primary Health Care Digest. HOP also sent targeted emails about the survey to its network of health center contacts. Further recruitment efforts included: inviting health center participants in HOP’s Not Just a Ride Learning collaborative to complete the survey; asking Primary Care Associations (PCAs) and other partners to send the survey to their health center members; distributing postcards about the survey at the Midwest Stream Forum for Agricultural Worker Health; and presenting about the survey to HRSA National Cooperative Agreements, PCAs, and health center representatives during a “Community Leadership and Partnership” peer learning team webinar. Reminders were emailed out periodically to encourage more sites to participate in the survey. As noted above, 188 health centers responded to the full survey.
Analysis
Univariate and bivariate analyses were used to answer the research questions and describe the frequencies and distribution of the data. The data was disaggregated by geographic type defined as Metropolitan (Urban), defined as a core urban area of 50,000 residents or more, Micropolitan (Suburban), defined as at least 10,000 residents but less then 50,000, and neither Micropolitan nor Metropolitan (Rural), defined as sparsely populated with less than 10,000 residents2, to determine whether any statistically significant differences between groups were detected. For the open-ended questions, results were coded and analyzed for themes.
2 Metropolitan and micropolitan statistical areas (metro and micro areas) are geographic entities delineated by the Office of Management and Budget (OMB) for use by Federal statistical agencies in collecting, tabulating, and publishing Federal statistics. See the United States Census Bureau for additional information.

>>> 13
RIDES TO WELLNESS COMMUNITY SCAN PROJECTHEALTH OUTREACH PARTNERSNATIONAL SURVEY: TRANSPORTATION BARRIERS & MISSED APPOINTMENTS
Limitations
Sample size HOP made multiple attempts to recruit a large enough sample of respondents so that robust comparisons between geographic types could be made. While there was fairly good representation across the designated geographic types, the sample size, especially when disaggregating by geographic type, may limit generalizability to the larger population.
Incomplete data HOP attempted to locate the person best equipped to answer questions about health center operations and finances; however, in some cases, the survey may have been completed by representatives who knew or were able to access some of the information, but not all of it. It is possible that more health centers do, in fact, track the cost of missed appointments, but not widely share that information with all levels of staff.
Data limited to HRSA-funded health centersThe original intent of the research project was to collect data from three distinct provider types. Due to factors outside of its control, HOP was unable to obtain data from the Veterans Health Administration and received low response rates from the UnitedHealthcare Medicaid Managed Care network. FQHCs are a critical portion of UnitedHealthcare’s Medicaid Managed Care Network. However, in order to prevent double sampling, the FQHCs were pulled out of the UnitedHealthcare provider list. This likely played a role in the lower than anticipated response rates of UnitedHealthcare providers. There may be interesting variation between these provider types that could help inform policy and practice, and future research should seek opportunities to collect this data.

>>> 14
RIDES TO WELLNESS COMMUNITY SCAN PROJECTHEALTH OUTREACH PARTNERSNATIONAL SURVEY: TRANSPORTATION BARRIERS & MISSED APPOINTMENTS
RESULTS
Description of Sample
Of the 188 responses received, 50% (93) were located in Metropolitan/Urban areas; 23% (44) were located in Micropolitan/Suburban areas, and 27% (51) were located in neither Metropolitan or Micropolitan/Rural areas. For the purposes of this report, these locations will hereafter be referred to as urban, suburban, and rural.1 Twenty-three states were also represented in the sample, reflecting a diverse geographic pool of respondents.
Health center respondents reported that on average, they see over 45,000 patients a year, or almost 4,000 a month, primarily low-income, medically underserved, rural patients, and special populations, such as individuals experiencing homelessness and agricultural workers.
Scope of Problem
1. To what extent are missed appointments a problem?
The total sample of respondents indicated that missed appointments are a significant problem at their health center. No health center reported that missed appointments were “Not a problem” or “Don’t Know,” indicating that for the reporting health centers, missed appointments are acknowledged as an issue.
Figure 1: Missed appointments in health centers
Interestingly, when disaggregated by geographic type (Urban, Suburban, Rural), urban health centers were more likely to report that missed appointments are a “Serious Problem”, 35% of urban health centers vs. 13% of rural health centers. The majority of respondents indicated that the average monthly rate of missed appointments was between 11-20% (34%) and 21-30% (32%). Rural health centers were less likely to report rates as high as the average with 14% reporting less than a 5% missed appointment rate, 21% reporting a 5-10% rate, and 19% reporting a 21-30% rate. However, similarly with urban and suburban health center, 33% reported 11-20% rate.
1 For the purposes of the report, health center sites are referred to as urban, suburban, and rural; however, the category of “suburban” may not be the most precise corollary to the Micropolitan designation.
A moderate problem
A serious problem
A minor problem
Not a problem
I don't know
59.1%
59.1% 28.0%
28.0%
12.8%
12.8%
0%
0%
To what extent are missed appointments (i.e. an appointment where the patient does not show up) a problem at your health center or practice?

>>> 15
RIDES TO WELLNESS COMMUNITY SCAN PROJECTHEALTH OUTREACH PARTNERSNATIONAL SURVEY: TRANSPORTATION BARRIERS & MISSED APPOINTMENTS
Respondents were asked to rank a set of barriers for patients complying with scheduled appointments. The list of barriers was not meant to be an exhaustive list of all possible barriers, but rather those most frequently discussed in the literature. Barriers included: health status, job schedule, lack of or unreliable transportation, cost of appointment, cost of transportation to appointment, language or cultural barriers, mental health or substance abuse issues, and lack of child care. Forty-one percent (41%) of centers ranked “Lack of or unreliable transportation” as the top barrier for patients, and 69% of respondents listed transportation as one of the top 3 reasons. For the other transportation-related barrier, “Cost of transportation to appointment,” while only 3% listed this as the top barrier, 39% included it in their top 3. Other top reasons included “Job schedule/unable to take off work” (45% listed as one of the top 3 reasons) and “Mental health or substance use issues” (31%). Urban and suburban health centers were slightly more likely than rural health centers to list “Lack of or unreliable transportation” as the top reason (48% and 49%, compared to 36%), but this question did not specify using public transportation. Based on the rankings provided across health centers, transportation was clearly identified as a top barrier for making scheduled appointments.
When asked how significant transportation barriers are for their patients, 86% indicated that it is a “Moderate” or “Serious” problem. Suburban health centers were more likely than urban or rural health centers to indicate that is a serious problem (52% compared to 39% and 45%, respectively). Nonetheless, is it clear that transportation barriers are an issue for health centers, regardless of their location.
Consistent with the empirical literature reviewed, health centers responded that patients frequently drive themselves or ride with a friend or family member in a vehicle (65% and 61%). The literature consistently states that having a vehicle or access to a vehicle is associated with making it to scheduled appointments. Public transit was the next category of transportation that respondents stated patients frequently use (40%). However, public transit was more likely to be listed as a frequent mode by urban health centers (79%) than suburban (35%) or rural health centers (14%). Rural health centers responded that patients drive themselves (95%) or ride with a friend/family member (84%) frequently, suggesting that access to a vehicle in rural settings is important for making it to appointments.
Tracking Data
2. To what extent is information on missed appointments being collected and tracked, and in particular, missed appointments due to transportation barriers?
Ninety-two percent (92%) of health centers reported tracking their missed appointments. When asked whether health centers track the reason why patients miss appointments, 40% responded yes, 50% no, and 10% unsure. For those who track the reasons, some of the written responses included statements such as, “We track, but not actively monitor” and “Lack of transportation is the primary cause.” Suburban health centers were the most likely to track the reason for missed appointments (54%), compared to either urban (31%) or rural (43%).
Cost
3. What is the average cost of missed appointments, and in particular, the average cost of missed appointments due to transportation barriers?
Roughly a quarter of respondents indicated that they track the cost of missed appointments (23%). Of those who track the cost of missed appointments, only 27 health centers provided a specific estimate of the cost. Responses ranged from $50 to $350, with an average of $175 per missed appointment. Unfortunately, because so few health centers responded that they tracked cost, on top of a fairly small number of centers who track the reason for missed appointments (40%), it is not possible to determine the average cost of missed appointments due to transportation barriers specifically. However, it can be imputed that because transportation barriers were listed as one of the top three barriers by almost 70% of respondents, a significant portion of the cost of missed appointments can be traced to transportation barriers.

>>> 16
RIDES TO WELLNESS COMMUNITY SCAN PROJECTHEALTH OUTREACH PARTNERSNATIONAL SURVEY: TRANSPORTATION BARRIERS & MISSED APPOINTMENTS
High Risk Populations
4. To what extent do transportation barriers disproportionately affect particular patient groups (e.g. pregnant women, veterans, the elderly)?
Transportation barriers appear to disproportionately impact subgroups of patients. The chart below summarizes the results—note that any percentage greater than 25% has been bolded.
Table 1. Transportation barriers for subgroups
Not applicable
Not a problem
A minor problem
A moderate problem
A serious problem
Veterans 9% 7% 17% 23% 14%
Older patients, ages 60+ 1% 1% 14% 37% 34%
Pregnant women 4% 12% 26% 3% 11%
Patients with young children
0% 5% 26% 35% 23%
Grandparents raising grandchildren
1% 6% 25% 31% 18%
Chronically ill patients 0% 1% 11% 42% 36%
Agricultural workers 23% 5% 13% 16% 19%
People experiencing homelessness
6% 2% 13% 21% 46%
People with disabilities 1% 3% 20% 32% 33%
People living in public housing
5% 5% 20% 33% 19%
Older patients, those experiencing homelessness, patients with young children, chronically ill patients, residents of public housing, individuals with disabilities, and pregnant women were all categorized as being disproportionately impacted by transportation barriers, populations to whom health centers target their services. There were no major differences between rural, suburban, and urban areas with the exception of agricultural workers—rural and suburban health centers were more likely to identify transportation barriers as a moderate or serious problem (40% and 47%, compared to 27% for urban health centers) for this population.
Clinical Outcomes
5. What are the implications of missed appointments due to transportation barriers on clinical outcomes?
Health centers reported that transportation barriers are a significant problem for many clinical outcomes.
>>> 17
RIDES TO WELLNESS COMMUNITY SCAN PROJECTHEALTH OUTREACH PARTNERSNATIONAL SURVEY: TRANSPORTATION BARRIERS & MISSED APPOINTMENTS
Table 2: Transportation Barriers and Clinical Outcomes
Not a problem
A minor problem
A moderate problem
A serious problem
Less health care utilization 5% 13% 42% 34%
Lack of regular, preventive medical care 0% 19% 33% 40%
Lack of specialty care 2% 10% 30% 51%
Delayed care for health conditions or illnesses
3% 13% 29% 51%
More Emergency Department visits 5% 15% 26% 40%
Failure to fill prescriptions 5% 24% 37% 26%
Over half of the health centers reported that “Lack of specialty care” and “Delayed Care for health conditions or illnesses” was a serious problem. This aligns with the empirical literature which finds that delays in care and barriers to receiving specialty care can result in patients being sicker by the time they get to a doctor and treatment for life-threatening diseases and conditions delayed.
Strategies
6. What are some specific strategies (e.g. quality improvement efforts) used to address transportation barriers?
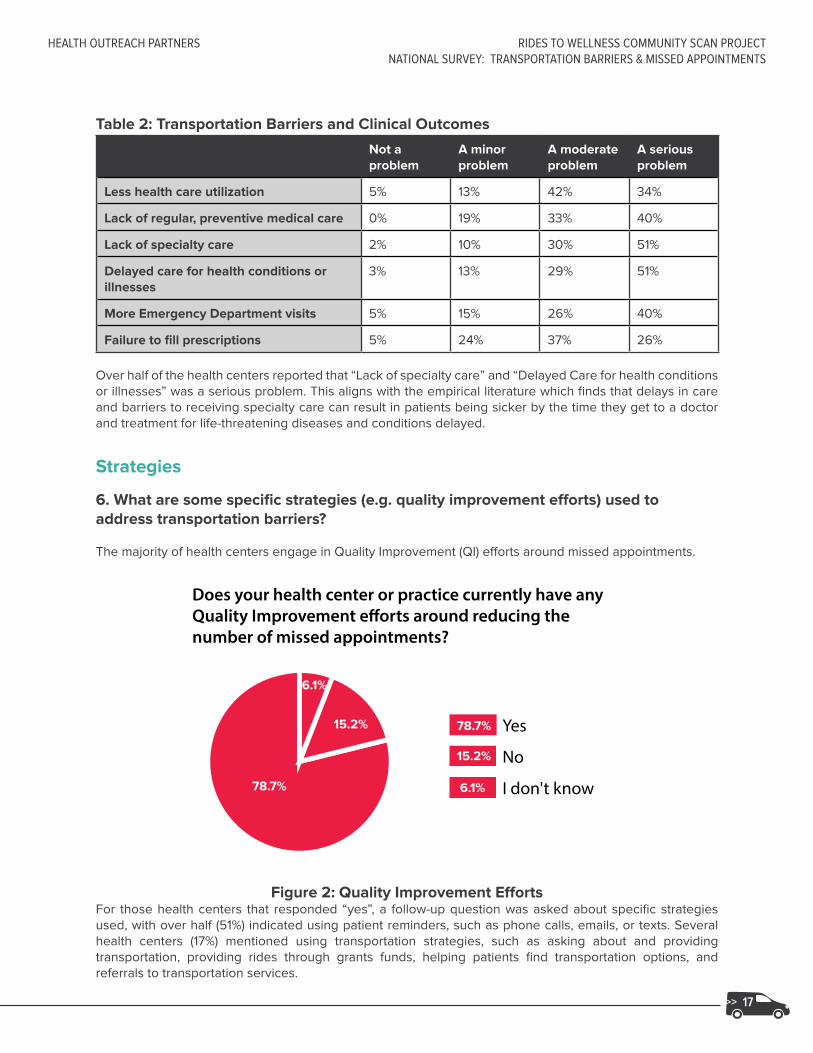
The majority of health centers engage in Quality Improvement (QI) efforts around missed appointments.
Figure 2: Quality Improvement EffortsFor those health centers that responded “yes”, a follow-up question was asked about specific strategies used, with over half (51%) indicated using patient reminders, such as phone calls, emails, or texts. Several health centers (17%) mentioned using transportation strategies, such as asking about and providing transportation, providing rides through grants funds, helping patients find transportation options, and referrals to transportation services.
Yes
No
I don't know
78.7%
78.7%
15.2%
15.2%
6.1%
6.1%
Does your health center or practice currently have any Quality Improvement e�orts around reducing the number of missed appointments?

>>> 18
RIDES TO WELLNESS COMMUNITY SCAN PROJECTHEALTH OUTREACH PARTNERSNATIONAL SURVEY: TRANSPORTATION BARRIERS & MISSED APPOINTMENTS
DISCUSSIONThe findings from the national survey clearly suggest that transportation barriers and missed appointments are an ongoing issue of concern for health centers, regardless of whether they are in urban, suburban, or rural areas. The key takeaways from the survey indicate that:
▲ Missed appointments are a problem for health centers, and impact key clinical outcomes.
▲ Health centers are engaged in quality improvement efforts to decrease missed appointments.
▲ Health centers acknowledge that transportation is a top reason why patients miss their appointments, and certain patient subgroups are disproportionately affected.
▲ Health centers are not tracking reasons for missed appointments in a consistent way. This makes it difficult to pinpoint the percentage of missed appointments due to transportation issues.
▲ Health centers are also not tracking the cost of a missed appointment in a consistent way. With limited data on missed appointments, reasons for missed appointments, and associated costs, it is not possible to definitively estimate the costs of missed appointments due to transportation barriers.
It is clear that transportation barriers impact the health outcomes of patients, as well as the clinical and financial performance of the health care system. As only a minority of health centers responded that they track this information, it may be that the complexity of trying to track the average cost of a missed appointment across many sites, as opposed to tracking overall expenses and income, is discouraging. Yet given the financial and clinical implications of missed appointments due to transportation barriers, it seems that this data needs to be collected, tracked, and reported. Providing centers with a simple cost analysis tool to help them determine the costs of missed appointments, specifically due to transportation issues, may help pinpoint this number. For example, as part of its Transportation Initiative, HOP developed a Transportation and Health Access Quality Improvement Toolkit specifically to provide a methodology and structure to implementing a QI project related to assessing and addressing transportation barriers. (See Appendix B for a sample tool titled “Cost Methodology of Missed Appointments and the Financial Impact to Health Centers”). Additionally, health centers need to be provided with the tools and resources to assist them with outreach to patients who miss appointments, and to help them determine the specific nature and scope of their health center’s problem around missed appointments so that they can better target their QI strategies and interventions.
One of the findings from both the key informant interviews conducted before the survey and the qualitative information provided in the survey is that suburban areas can have many of the same issues around the lack of public transportation as rural areas. Some suburban health centers responded that they serve a predominantly rural area within their catchment area, so it is important to keep in mind that the official designations of areas may occlude how rural they primarily are. Any recommendation specific to rural areas should also apply to those suburban areas that include rural areas, or that lack a public transportation infrastructure. Future research needs to test the extent to which this is true for different regions.
In order for policymakers to address transportation barriers for patients, expanded transportation options beyond public transportation is critical, particularly for rural and suburban areas. As reflected in the empirical literature, vehicle access is a predictor for making it to appointments. In order for health centers to advocate for health-related transportation policies, more data collection needs to occur at the health center and at the broader state and national level. This survey was an attempt to describe the nature and scope of the problem at a national level, and while results strongly indicate that transportation is a significant problem, and one that impacts certain patient populations disproportionately, there are no doubt geographic variation and nuances that are important for localities and regions to understand and address.

>>> 19
RIDES TO WELLNESS COMMUNITY SCAN PROJECTHEALTH OUTREACH PARTNERSNATIONAL SURVEY: TRANSPORTATION BARRIERS & MISSED APPOINTMENTS
LESSONS LEARNED
Recruitment
During the recruitment process, HOP sent various marketing emails to a list of over 1,300 health centers. By sending the pre-survey and survey via email, as well as reminder messages, the response rate increased significantly. Conversely, email addresses for the Medicaid Managed Care network were not available. Instead, postcards containing the survey link were sent to over 10,000 Medicaid Managed Care providers, which restricted HOP’s ability to successfully recruit respondents and yielded a severely low response rate. Having access to email addresses is crucial to recruitment and improving the response rate for online surveys.
Securing a champion
As with many processes where an outside entity is trying to extract information and data from health care sites, it is critical to identify and rely on an internal champion who can help secure buy-in and encourage participation. In this case, HOP was able to find champions in each of the respondent types, and these champions advocated for getting approval to participate in the research, and providing email and mailing address lists. For future research, securing that champion can be key to obtaining a good response rate. Similarly, some institutions or organizations may have a system in place that takes extra time to navigate through their channels to receive approval to administer, or have them administer, a survey to their qualifying sites. Having a champion can help to navigate and cut through those channels, so enough time is built in the research process for subsequent studies, particularly for national surveys.
CONCLUSIONTransportation is an important component to health care access and should be a priority for health centers, provider networks, insurers, policymakers, and governmental agencies. Patients with consistent transportation to get to their appointments will have fewer delays in care, will have better clinical outcomes, will use the Emergency Departments less, and will have more opportunities to receive preventive services—all of which create cost savings for the health care system as a whole. Investing in transportation has the potential to increase optimal health outcomes, while decreasing costs to patients, health care sites, and insurance providers.
Missed medical appointments due to a lack of transportation is not something that is currently being tracked by providers. This is not a topic that is a priority, nor are many providers aware of the significance of this challenge. This is uncharted territory with significant opportunity for partnerships between the health and transportation sectors. However, additional research is needed. There is a high burden rate to collect the required data. For providers to collect and track their missed appointment rate, and know the true percent related to lack of transportation, each patient who misses an appointment would need to be contacted to inquire about the reason. Once providers have a true understanding of the impact of lack of transportation on missed medical appointments and the associated health care costs, the solutions will follow.

>>> 20
RIDES TO WELLNESS COMMUNITY SCAN PROJECTHEALTH OUTREACH PARTNERSNATIONAL SURVEY: TRANSPORTATION BARRIERS & MISSED APPOINTMENTS
Appendix A: Institutional Review Board (IRB) Exemption
University of Southern California University Park Institutional Review Board3720 South Flower Street Credit Union Building (CUB) #301
Los Angeles, CA 90089-0702Phone: 213-821-5272
Fax: [email protected]
Date: Jun 07, 2016, 10:30amAction Taken: Not Human Subjects ResearchPrincipal Investigator: Melissa Martin-Mollard, PhD SCHOOL OF SOCIAL WORKFaculty Advisor: Project Title: NHSR for Melissa Martin-MollardStudy ID: IIR00001984
The University Park Institutional Review Board (UPIRB) designee has determined on06/07/2016 that the research activities described do not meet the federal definition of Human Subject under 45 CFR 46.102. Therefore, this study is considered Not Human Subjects Research* and is not subject to 45 CFR 46 regulations, including informed consent requirements or further IRB review.
This review and opinion is based on the information provided and is not valid if the proposed project is not exactly as described, or if information has been withheld. If your project design changes in ways that may affect this determination, please contact the IRB for guidance.
You are encouraged to follow the University’s Code of Ethics and policies when designing and conducting research projects.
Reminder: As the Principal Investigator, you are required to ensure the Department of Defense (DoD) Human Research Protection Official (HRPO) performed an administrative review of the research and concurs with the UPIRB’s review determination before any research activities may begin.
*From 45 CFR 46.102, The Federal Regulations on Human Subjects Research
Human Subject: A living individual about whom an investigator (whether professional or student) conducting research obtains data through intervention or interaction with the individual, or identifiable private information.
Research: A systematic investigation, including research development, testing, and evaluation, designed to develop or contribute to generalizable knowledge.
Social-behavioral health-related interventions or health-outcome studies must register with clinicaltrials.gov or other International Community of Medical Journal Editors (ICMJE) approved registries in order to be published in an ICJME journal. The ICMJE will not accept studies for publication unless the studies are registered prior to enrollment, despite the fact that these studies are not applicable “clinical trials” as defined by the Food and Drug Administration (FDA). For support with registration, go to www.clinicaltrials.gov or contact Jean Chan ( [email protected], 323-442-2825).
This is an auto-generated email. Please do not respond directly to this message using the “reply” address. A response sent in this manner cannot be answered. If you have further questions, please contact iStar Support at (323) 276-2238 or [email protected].
The contents of this email are confidential and intended for the specified recipients only. If you have received this email in error, please notify [email protected] and delete this message.
>>> 21
RIDES TO WELLNESS COMMUNITY SCAN PROJECTHEALTH OUTREACH PARTNERSNATIONAL SURVEY: TRANSPORTATION BARRIERS & MISSED APPOINTMENTS
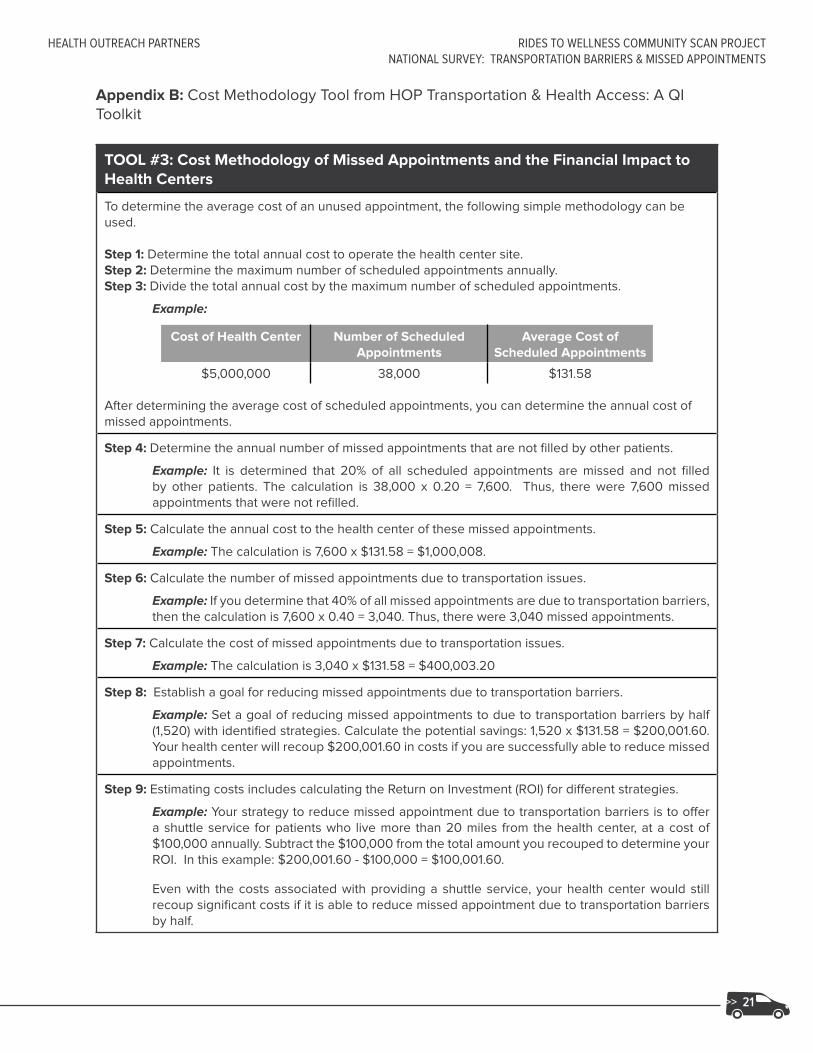
Appendix B: Cost Methodology Tool from HOP Transportation & Health Access: A QI Toolkit
TOOL #3: Cost Methodology of Missed Appointments and the Financial Impact to Health Centers
To determine the average cost of an unused appointment, the following simple methodology can be used.
Step 1: Determine the total annual cost to operate the health center site.Step 2: Determine the maximum number of scheduled appointments annually. Step 3: Divide the total annual cost by the maximum number of scheduled appointments.
Example:
Cost of Health Center Number of Scheduled Appointments
Average Cost of Scheduled Appointments
$5,000,000 38,000 $131.58
After determining the average cost of scheduled appointments, you can determine the annual cost of missed appointments.
Step 4: Determine the annual number of missed appointments that are not filled by other patients.
Example: It is determined that 20% of all scheduled appointments are missed and not filled by other patients. The calculation is 38,000 x 0.20 = 7,600. Thus, there were 7,600 missed appointments that were not refilled.
Step 5: Calculate the annual cost to the health center of these missed appointments.
Example: The calculation is 7,600 x $131.58 = $1,000,008.
Step 6: Calculate the number of missed appointments due to transportation issues.
Example: If you determine that 40% of all missed appointments are due to transportation barriers, then the calculation is 7,600 x 0.40 = 3,040. Thus, there were 3,040 missed appointments.
Step 7: Calculate the cost of missed appointments due to transportation issues.
Example: The calculation is 3,040 x $131.58 = $400,003.20
Step 8: Establish a goal for reducing missed appointments due to transportation barriers.
Example: Set a goal of reducing missed appointments to due to transportation barriers by half (1,520) with identified strategies. Calculate the potential savings: 1,520 x $131.58 = $200,001.60. Your health center will recoup $200,001.60 in costs if you are successfully able to reduce missed appointments.
Step 9: Estimating costs includes calculating the Return on Investment (ROI) for different strategies.
Example: Your strategy to reduce missed appointment due to transportation barriers is to offer a shuttle service for patients who live more than 20 miles from the health center, at a cost of $100,000 annually. Subtract the $100,000 from the total amount you recouped to determine your ROI. In this example: $200,001.60 - $100,000 = $100,001.60.
Even with the costs associated with providing a shuttle service, your health center would still recoup significant costs if it is able to reduce missed appointment due to transportation barriers by half.

>>> 22
RIDES TO WELLNESS COMMUNITY SCAN PROJECTHEALTH OUTREACH PARTNERSNATIONAL SURVEY: TRANSPORTATION BARRIERS & MISSED APPOINTMENTS
References
Arcury, T.A, Gesler, W.M, Preisser, J.S., Sherman, J., Spencer, J., & Perin, J. (2005). The Effects of Geography and Spatial Behavior on Health care Utilization among the Residents of a Rural Region. Health Services Research, 40(1), 135-156. doi: 10.1111/j.1475-6773.2005.00346.x.
Ahmed SM, Lemkau JP, Nealeigh N, Mann B. Barriers to health care access in a non-elderly urban poor American population. Health and Social Care in the Community. 2001;9(6):445–453.
Bambra C, Gibson M, Sowden A, Wright K, Whitehead M, Petticrew M. Tackling the wider social determinants of health and health inequalities: Evidence from systematic reviews.
Barr DA, Wanat SF. “Listening to Patients: Cultural and Linguistic Barriers to Health Care Access” Family Medicine. 2005;37(3):199–204.
Bennett KJ, Baxley EG. The effect of a carve-out advanced access scheduling system on no-show rates. Fam. Med. 2009;41:51–56.
Blazer DG, Landerman LR, Fillenbaum G, Horner R. Health services access and use among older adults in North Carolina: Urban vs rural residents. American Journal of Public Health. 1995;85(10):1384–1390.
Buzza C, Ono SS, Turvey C, Wittrock S, Noble M, Reddy G, et al. Distance is relative: Unpacking a principal barrier in rural health care. Journal of General Internal Medicine. 2011;26(Suppl 2):648–654.
Clark J. Appointment cancellation options-a new system to help decrease no-show appointments. IACH Informer. 2006, 3.
Crain EF, Kercsmar C, Weiss KB, Mitchell H, Lynn H. Reported difficulties in access to quality care for children with asthma in the inner city. Archives of Pediatrics and Adolescent Medicine. 1998;152(4):333–339.
Cristancho S, Garces DM, Peters KE, Mueller BC. Listening to rural hispanic immigrants in the midwest: A community-based participatory assessment of major barriers to health care access and use. Qualitative Health Research. 2008;18(5):633–646.
Davies, ML, Goffman, RM, May, JH, Monte, RJ, Rodriguez, KL, Tjader, YC, & Vargas, DL (2016, February). Large-scale no-show patterns and distributions for clinic operational research. Healthcare, 4(1), 15.
DeNavas-Walt C, Proctor BD, Smith JC. Income, Poverty, and Health Insurance Coverage in the United States:
2011, in Current Population Reports, P60-243, U.S. Census Bureau, Editor. Washington, DC 2012.
Diamant AL, Hays RD, Morales LS, Ford W, Calmes D, Asch S, et al. Delays and unmet need for health care among adult primary care patients in a restructured urban public health system. American Journal of Public Health. 2004;94(5):783–789.
Dreiher J, Goldbart A, Hershkovich J, Vardy DA, Cohen AD. Factors associated with non-attendance at pediatric allergy clinics. Pediatr. Allergy Immunol. 2008;19:559–563. doi: 10.1111/j.1399-3038.2007.00691.
Ferguson S, Kokesh J. Remote Otolaryngology Services: A Cost Comparison Study. 2005.
Garcia Popa-Lisseanu MG, Greisinger A, Richardson M, O’Malley KJ, Janssen NM, Marcus DM, et al. Determinants of treatment adherence in ethnically diverse, economically disadvantaged patients with rheumatic disease. The Journal of Rheumatology. 2005;32(5):913–919.
George, Ajay, and Greg Rubin. “Non-attendance in general practice: a systematic review and its implications for access to primary health care.” Family Practice 20.2 (2003): 178-184.

>>> 23
RIDES TO WELLNESS COMMUNITY SCAN PROJECTHEALTH OUTREACH PARTNERSNATIONAL SURVEY: TRANSPORTATION BARRIERS & MISSED APPOINTMENTS
Giambruno C, Cowell C, Barber-Madden R, Mauro-Bracken L. The extent of barriers and linkages to health care for head start children. Journal of Community Health. 1997;22(2):101–114. [PubMed]
Goins RT, Williams KA, Carter MW, Spencer M, Solovieva T. Perceived barriers to health care access among rural older adults: A qualitative study. The Journal of Rural Health: Official Journal of the American Rural Health Association and the National Rural Health Care Association. 2005;21(3):206–213.
Guidry, J. J., Aday, L. A., Zhang, D., & Winn, R. J. (1997). Transportation as a barrier to cancer treatment. Cancer Practice, 5(6), 361–366.
Iezzoni LI, Killeen MB, O’Day BL. Rural residents with disabilities confront substantial barriers to obtaining primary care. Health Services Research. 2006;41(4 Pt 1):1258–1275.
Johnson BJ, Mold JW, Pontious JM. Reduction and management of no-shows by family medicine residency practice exemplars. Ann. Fam. Med. 2007;5:534–539. doi: 10.1370/afm.752.
Karter AJ, Parker MM, Moffet HH, Ahmed AT, Ferrara A, Liu JY, et al. Missed appointments and poor glycemic control: an opportunity to identify high-risk diabetic patients. Med Care 2004 Feb;42(2):110-115.
Keating A, Lee A, Holland AE. What prevents people with chronic obstructive pulmonary disease from attending pulmonary rehabilitation? A systematic review. Chronic Respiratory Disease. 2011;8(2):89–99.
Kempf MC, McLeod J, Boehme AK, Walcott MW, Wright L, Seal P, et al. A qualitative study of the barriers and facilitators to retention-in-care among HIV-positive women in the rural southeastern united states: Implications for targeted interventions. AIDS Patient Care and STDs. 2010;24(8):515–520.
Kheirkhah, P, Feng, Q, Travis, LM, Tavakoli-Tabasi, S, & Sharafkhaneh, A (2016). Prevalence, predictors, and economic consequences of no-shows. Health Services Research, 16(1), 13.
Kim, J., Norton, E.C., & Stearns, S.C. (2009, February). Transportation Brokerage Services and Medicaid Beneficiaries’ Access to Care. Health Services Research, 44, 145-161.
Kim MM, Swanson JW, Swartz MS, Bradford DW, Mustillo SA, Elbogen EB. Health care barriers among severely mentally ill homeless adults: Evidence from the five-site health and risk study. Administration and Policy in Mental Health. 2007;34(4):363–375.
Mehrota, A., Keehl-Markowitz, L., & Ayanian, J. Z. (2008). Implementing open –access scheduling of visits in primary care practices: A cautionary tale. Annals of Internal Medicine, 148, 915-922.
Moore C., Wilson-Witherspoon, P., Probst, J. (2001). Time and money: effects of no-shows at a family practice residency clinic. Family Medicine. July; 33(7): 522-7.
National Health Expenditure Data: NHE Fact Sheet . Centers for Medicare and Medicaid Services. 2008.
Parker, M. M., Moffet, H. H., Schillinger, D., Adler, N., Fernandez, A., Ciechanowski, P., & Karter, A. J. (2012). Ethnic Differences in Appointment-Keeping and Implications for the Patient-Centered Medical Home—Findings from the Diabetes Study of Northern California (DISTANCE). Health Services Research, 47(2), 572–593. http://doi.org/10.1111/j.1475-6773.2011.01337.x
Rust CT, Gallups NH, Clark WS, Jones DS, Wilcox WD. Patient appointment failures in pediatric resident continuity clinics. Arch. Pediatr. Adolesc. Med. 1995;149:693–695. doi: 10.1001/archpedi.1995.02170190103018.
Salameh, E., Olsen, S., & Howard, D. (2012). Nonattendance with clinic follow-up appointments: Diabetes as exemplar. The Journal for Nurse Practitioners, 8(10), 797-803.

>>> 24
RIDES TO WELLNESS COMMUNITY SCAN PROJECTHEALTH OUTREACH PARTNERSNATIONAL SURVEY: TRANSPORTATION BARRIERS & MISSED APPOINTMENTS
Sharp DJ, Hamilton W. Non-attendance at general practices and outpatient clinics. BMJ. 2001;323:1081–1082. doi: 10.1136/bmj.323.7321.1081.
Shimotsu, Scott, Anne Roehrl, Maribet McCarty, Katherine Vickery, Laura Guzman-Corrales, Mark Linzer, and Nancy Garrett. “Increased Likelihood of Missed Appointments (‘No Shows’) for Racial/Ethnic Minorities in a Safety Net Health System.” Journal of Primary Care & Community Health 7, no. 1 (January 1, 2016): 38–40. doi:10.1177/2150131915599980.
Silver D, Blustein J, Weitzman BC. Transportation to clinic: Findings from a pilot clinic-based survey of low-income suburbanites. Journal of Immigrant and Minority Health/Center for Minority Public Health. 2012;14(2):350–355.
Syed, S.T., Gerber, B.S. & Sharp, L.K. J Community Health (2013) 38: 976. doi:10.1007/s10900-013-9681-1
Wallace, R., Hughes-Cromwick, P., & Mull, H. (2005). Access to Health care and Nonemergency Medical Transportation: Two Missing Links. Transportation Research Record: Journal of the Transportation Research Board, 1924. Retrieved from http://www.tdsa.org.au/wp-content/uploads/2012/06/Access-to-Health-Care-and-Nonemergency-Medical-Transportation-Two-Missing-Links.pdf.
Weingarten, Nancy, Daniel L. Meyer, and James A. Schneid. “Failed appointments in residency practices: who misses them and what providers are most affected?.” The Journal of the American Board of Family Practice 10.6 (1997): 407-411.
Yang S, Zarr RL, Kass-Hout TA, Kourosh A, Kelly NR. Transportation barriers to accessing health care for urban children. Journal of Health Care for the Poor and Underserved. 2006;17(4):928–943.
Zullig LL, Jackson GL, Provenzale D, Griffin JM, Phelan S, van Ryn M. Transportation—a vehicle or roadblock to cancer care for VA patients with colorectal cancer? Clinical Colorectal Cancer. 2012;11(1):60–65.

RIDES TO WELLNESSCOMMUNITY PROFILES

>>> 26
RIDES TO WELLNESS COMMUNITY SCAN PROJECTHEALTH OUTREACH PARTNERSRIDES TO WELLNESS COMMUNITY PROFILES
ACKNOWLEDGEMENTS
The Rides to Wellness Community Profiles is a product of HOP’s Rides to Wellness Community Scan Project, funded by the Federal Transit Administration (FTA) under Federal Award Id Number (FAIN): CA-2016-002-00.
HOP would like to extend its appreciation to the various people who contributed to the development of the profiles:
Profile Interview Contributors• Southern Illinois
Dennis Presley, Project Coordinator, The Rural Medical Transportation Network
• Worcester, Massachusetts Moumita Dasgupta, Principal Investigator, Smart Transit for Healthcare
• South-Central Missouri Suzanne Alewine, Executive Director, Missouri Rural Health Association Doris Boeckman, Founder and Principal, Community Asset Builders Mary Gordon, HealthTran Project Manager, Missouri Rural Health Association
• Buffalo, New York Mary K. Comtois, Program Director of Health Initiatives, United Way of Buffalo & Erie County
• Portland, Oregon Troyce Crucchiola, Dialysis Patient/Advisory Committee Member, Ride Connection Julie Wilcke, Chief Operating Officer, Ride Connection
• King County, Washington Francois Larrivee, Transportation Director, Hopelink
Other Contributors and Interviewees• John Dillard, Mobility and Transportation Coordinator, Southern Georgia Regional Commission• Suzanne Smith, Network Development Coordinator, Health Care Collaborative of Rural Missouri• Bob Vickers, Network Coordinator, Health Care Collaborative of Rural Missouri
Federal Transit Administration• Danielle Nelson, Rides to Wellness Program Manager, Rural and Targeted Programs • Marianne Stock, Division Chief, Rural and Targeted Programs
HOP Staff• Edith Hernandez, MPH, MSW, Project Manager (Author)• Liam Spurgeon, Project Manager (Author)• Sonia Lee, MPH, Senior Manager, Client Services and Communications (Editorial Contributor)• Alexis Wielunski, MPH, Senior Manager, Organizational Learning & Sustainability (Editorial
Contributor)• Kristen Stoimenoff, MPH, Deputy Director (Editorial Contributor)• Diana Lieu, (Design and Layout)

>>> 27
RIDES TO WELLNESS COMMUNITY SCAN PROJECTHEALTH OUTREACH PARTNERSRIDES TO WELLNESS COMMUNITY PROFILES
INTRODUCTION: COMMUNITY PROFILES
Transportation barriers not only inhibit a patient’s ability to make it to their medical appointments, they often prevent individuals from ever seeking care, which over time can worsen their health status. While differences in language, health literacy level, and socioeconomic status also hinder one’s ability to seek care, transportation has continuously emerged as a top barrier to accessing health services, particularly for underserved communities. Improving transportation access for patients is essential to providing quality and consistent care, but can often be a difficult and overwhelming issue to undertake. Addressing transportation barriers requires extensive planning, collaboration, intervention, and policy change. As a response, a variety of communities, in partnership with health organizations, local and state agencies, and community-based organizations, are finding their own solutions to transportation barriers.
The Rides to Wellness Community Profiles highlight examples of six innovative transportation models that demonstrate promising opportunities to design, implement, and sustain efforts to address transportation barriers to care. The barriers communities confront are generally complex and multidimensional issues. Yet one crosscutting theme emerged throughout the profiles: the importance of demonstrating the program’s financial sustainability. While the initial investment can often seem daunting, there is true potential to not only recoup these funds in long-term savings, but to see a positive return on investment over the course of a transportation program by decreasing missed appointments, maintaining continuity of care, and reducing inappropriate use of emergency services.
Communities are finding creative ways to address transportation barriers, such as: partnering with community agencies like transit and emergency medical services (EMS) providers, developing online ride scheduling platforms, providing transportation rewards programs, and implementing targeted transportation services. In the end, these individual efforts demonstrate that creative thinking and collaborations are proven solutions to addressing transportation barriers.
The communities profiled include:
▲ Buffalo, New York
▲ King County, Washington
▲ Portland, Oregon
▲ South-Central Missouri
▲ Southern Illinois
▲ Worcester, Massachusetts
Each profile includes a summary of the transportation problem, the community’s response, and the potential financial benefits of the response, as well as key contact information for the transportation program.

>>> 28
RIDES TO WELLNESS COMMUNITY SCAN PROJECTHEALTH OUTREACH PARTNERSRIDES TO WELLNESS COMMUNITY PROFILES
SOUTHERN ILLINOISRURAL MEDICAL TRANSPORTATION NETWORK (RMTN)
The Problem: Lack of Non-Emergency Medical Transportation for Rural Residents
Southern Illinois is an area composed of predominantly rural communities where approximately 22% of the population is at or below the Federal Poverty Level and aged 65 years or older.1 Among this age group, heart disease, cancer, and stroke are the top causes of death2. For residents in southern Illinois, non-emergency medical transportation is especially crucial to maintaining their health and well-being; however these services are either unavailable or difficult to acquire. Additionally, public transportation options in the area are scarce and with no other transit options available, emergency medical services (EMS) are often used inappropriately to transport patients to hospitals for non-emergency treatment. This results in costly medical trips that are often nonreimbursable and increases costs for patients, healthcare providers, and EMS providers.
The Response: Research-Focused Initiative for Enhancing Community Access to Transportation
In 2007 the Illinois Department of Transportation collaborated with Southern Illinois University’s Center for Rural Health and Social Service Development to fund the Rural Medical Transportation Network (RMTN) project. The RMTN is a research-focused initiative with the purpose of identifying gaps in transportation, including both emergency and non-emergency transportation services offered by public and private providers, and developing solutions to these deficiencies. The RMTN operates across the state with a particular focus in rural southern Illinois. Since its inception, RMTN has conducted a comprehensive assessment and formed various partnerships with health organizations and transportation agencies to address community transportation needs. Among RMTN’s most unique and notable efforts is their extensive work in increasing collaboration with Emergency Medical Services (EMS) as partners in addressing community transportation issues.
“YOU’D BE SURPRISED HOW INFREQUENTLY THOSE DOMAINS [HEALTH CARE PROVIDERS, EMS, PUBLIC TRANSIT] ACTUALLY INTERACT. WE WANT THEM WORKING TOGETHER BECAUSE THEY HAVE TO BE INVOLVED TO REALLY ADDRESS TRANSPORTATION ISSUES. IF YOU GET THEM IN A ROOM AND THEY START TALKING, IT’S AMAZING HOW MUCH THEY REALIZE THEY CAN IMPACT EACH OTHER.”
With public transportation options so scarce in rural southern Illinois, RMTN recognizes EMS as a capable and viable partner to fill transportation gaps. However, EMS in southern Illinois experiences various deficiencies, including a shortage of emergency medical technicians (EMT), the absence of adequate continuing training
1 Wilken, P., Ratnapradipa, D., Presley, D., & Wodika, A. (2014) An evaluation of the non-emergency medical transportation system of rural southern Illinois. American Journal of Health Studies. 29(2), 199-204.
2 ibid.
RMTN Service AreaSource: Image from http://rmtn.siu.edu

>>> 29
RIDES TO WELLNESS COMMUNITY SCAN PROJECTHEALTH OUTREACH PARTNERSRIDES TO WELLNESS COMMUNITY PROFILES
opportunities, and a lack of EMS lead instructors. In response, RMTN has implemented efforts to increase EMS capacity through training workshops, partnerships with the National Association of EMS Educators to bring lead instructors to the area, and first responder courses in local high schools to encourage young people to pursue a career as a volunteer or paid EMT. Ultimately, their goal is to increase community interest in EMS and build a base of future transportation providers.
In addition, a successful RMTN effort has been the EMS Patient Navigator Program. The program was piloted at two EMS agencies where Patient Navigators (PN), who are registered nurses and employed by local EMS consortiums, received referrals from EMS staff for patients who have utilized 9-1-1 calls for non-emergency transportation. The PN then worked with the referred patient to identify and address the reasons that led to the misuse of EMS. This included patient education on appropriate use of 9-1-1 calling and connecting patients to available transportation resources.
The Potential Financial Impact
RMTN has found that connecting patients to necessary, non-emergency medical care can have many financial benefits, including a reduction in avoidable costs for patients and the health care system attributed to unnecessary hospital emergency department visits. Involving EMS as a partner in transportation has already demonstrated some preliminary cost savings, specifically in the EMS Patient Navigator Program. Since its implementation in 2012, both pilot agencies have seen over a 50% reduction in calls from frequent 9-1-1 callers.3
Table 1. Reduction in 9-1-1 Calls
Measure Pilot Site 1 Pilot Site 2
PN Referral Clients 111 136
Calls Reduced 231 (37 to 106) 620 (1,047 to 427)
Reduction in calls (%) 69% 59%
Source: Table from “Illinois Patient Navigator Pilot Program Successfully Redirects Non-Emergent Patients” by Tom Bik, Dennis Presley, Dottie Miles, 2015, Journal of Emergency Medical Services, 40(1).
To estimate the cost savings of the program, the reduction in the number of 9-1-1 calls was multiplied by the average cost of each agency to respond to a 9-1-1 call. For both agencies, those cost savings from the reduced numbers of calls exceeded $100,000.4
Table 2. Cost Savings
Measure Pilot site 1 Pilot site 2
Cost per EMS call $484 $562
Total EMS cost savings $111,804 $348,440
Source: Table from “ Illinois Patient Navigator Pilot Program Successfully Redirects Non-Emergent Patients” by Tom Bik, Dennis Presley, Dottie Miles, 2015, Journal of Emergency Medical Services, 40(1).
The EMS Patient Navigator Program demonstrates the value that a collaborative relationship between health care providers and EMS brings to the community. Together, these entities that so often work separately from one another can enhance the patient care experience by increasing appropriate use of health care and transportation services, while also reducing unnecessary health care spending.
Contact: Dennis Presley, Project Coordinator, [email protected]
3 Bik,T., Presley, D., Miles, D. (2015). Illinois Ppatient navigator pilot program successfully redirects non-emergent patients. Journal of Emergency Medical Services. 40(1). Accessed on January 4, 2017 http://www.jems.com/articles/print/volume-41/issue-1/features/illinois-patient-navigator-pilot-program-successfully-redirects-non-emergent-patients.html
4 Ibid

>>> 30
RIDES TO WELLNESS COMMUNITY SCAN PROJECTHEALTH OUTREACH PARTNERSRIDES TO WELLNESS COMMUNITY PROFILES
WORCESTER, MASSACHUSETTSSMART TRANSIT FOR HEALTHCARE
The Problem: Missed Appointments among Low-Income Populations
National data reveals that low-income populations are especially impacted by a lack of transportation to health care.1 Findings from patient surveys conducted at Family Health Center (FHC), the major local hospital in Worcester, Massachusetts, revealed that 55% of low-income patients reported having missed their appointment or arrived late due to transportation issues.2 Although public transportation options are generally available in Worcester, with some providing transit information online, there are still shortcomings with the reliability and accessibility of the current system, as well as the availability of resources. For the Worcester community, additional interventions and assistance to ensure that patients successfully access health care are greatly needed.
The Response: Web-Based Software Appointment Scheduling
In 2014, as part of the Art of Science Learning Project in Worcester, groups of students, educators, scientists, and artists came together to identify innovative ways to address community issues. Recognizing the local and national impact that a lack of transportation has on the health and wellbeing of communities, one team focused on creating a more reliable experience for patients who depend on public transportation to get to appointments. They initiated Smart Transit for Healthcare, which proposed developing a scheduling software to streamline the patient appointment scheduling with transportation services.
The Worcester Regional Transit Authority and Central Massachusetts Regional Planning Committee came together with the Smart Transit team and received a grant from the National Center for Mobility Management to conduct market research to assess local transportation needs and propose solutions that might meet those needs. This included surveys and focus groups with various community organizations serving low-income populations, as well as patients in waiting rooms at FHC. The findings from the FHC patient focus groups indicated that a majority of patients rely on public transportation to attend their health care appointments, with 45% of patients taking the bus.3
Survey findings also revealed that 50% of respondents did not utilize any planning method for their medical trips, further supporting Smart Transit’s proposed solution of intervening at the scheduling stage of accessing care. The team also worked with other stakeholders, the transit agencies, hospital scheduling representatives and IT staff, to discuss feasibility of implementing the Smart Transit software. Their input as well as the patients’ perspective demonstrated a demand for a service that ties scheduling health care appointments to transportation needs. The findings were utilized to further develop and refine the Smart Transit software.
The traditional scheduling process requires patients to schedule their transportation service and medical appointment separately from each other. This can include multiple phone calls with hospital schedulers and transit dispatchers, which can cause confusion for the patient. Smart Transit removes potential confusion
1 Smart Transit for Healthcare. (2015). Healthcare access mobility challenge. Accessed on January 6, 2017 http://nationalcenterformobilitymanagement.org/wp-content/uploads/2014/11/Worcester.pdf
2 Ibid
3 Smart Transit for Healthcare. (2016). Business Plan.
Take the bus
Drive by themselves
Share a ride with a friend
Walk
Use a taxi service
45%
45%
18%
18%
15%15%
12%
12%
10%
10%
How Patients Access FHCSource: Data from Smart Transit for Healthcare-Healthcare Access Mobility Challenge.
>>> 31
RIDES TO WELLNESS COMMUNITY SCAN PROJECTHEALTH OUTREACH PARTNERSRIDES TO WELLNESS COMMUNITY PROFILES
for patients and facilitates the scheduling process by allowing the hospital to schedule a patient’s doctor appointment and ride at the same time. Smart Transit also runs an “optimization schedule,” which considers the least distance to the hospital, least time spent walking, least time waiting for transit. The software uses this criterion along with the patients’ specific transportation needs and preferred doctor’s available appointment times to output the best transportation option for the patient.
The Potential Financial Impact
FHC reports an average of 800 missed appointments on a monthly basis, with the standard cost of a medical visit per person at $154, FHC loses approximately $1,478,400 on missed appointments per year.4 FHC patient survey responses show that 51% of patients missed their appointments due to transportation issues, which translates to a $739,200 loss. However, patient survey findings revealed that 82% of respondents are willing to use transportation options that run in their neighborhood. Smart Transit can alleviate and reduce health care spending by connecting individuals to transportation services already available in the community to attend medical appointments.
Smart Transit has not yet been piloted at a health care facility. However, its anticipated financial impact has garnered significant interest from various health care organizations and transit providers both within and outside of Worcester. Most recently, organizations in Florida and Pennsylvania have been awarded Rides to Wellness grant funding to implement a Smart Transit model in their service areas.
Contact: Moumita Dasgupta, Principal Investigator, [email protected]
4 Smart Transit for Healthcare. (2016). Business Plan.

>>> 32
RIDES TO WELLNESS COMMUNITY SCAN PROJECTHEALTH OUTREACH PARTNERSRIDES TO WELLNESS COMMUNITY PROFILES
SOUTH-CENTRAL MISSOURIHEALTHTRAN
The Problem: Lack of Public Transportation in Rural Missouri
Since 2000, Missouri’s investment in public transportation has seen a continuous decline. Today, Missouri spends only 9 cents per capita on public transportation funding and ranks 44th in public transportation funding among the 50 states.1 As a result, smaller communities and rural areas are facing severe challenges, such as limited hours of operation for public transportation, which either runs only a few times a week or as little as once a month. At the same time, rural Missourians face a lack of available health care providers. Only 18% of the state’s primary care physicians are located in rural counties, despite being home to 37% of Missouri’s population.2 Many must travel outside of their county to seek health care services. The cost of on-demand transportation for patients in rural Missouri can range from $44 to $175 per roundtrip.3 Patients requiring daily or weekly treatments, such as older adults (age 65 or older) and people with chronic conditions are at especially high risk for missing appointments or foregoing care due to transportation barriers.
The Response: Transportation Coordination and Partnerships
In 2013, various community organizations began to collaborate around the need for public transportation in their communities and the lack of state funding to address this problem. Together, the Missouri Rural Health Association, Missouri Public Transportation Association, Community Asset Builders, LLC, and the Missouri Foundation for Health conducted focus groups with patients at various health centers and hospital sites. They also engaged in discussions with health and transit partners to better understand community barriers to care. Not surprisingly, the findings indicated transportation as the primary barrier to accessing care in rural Missouri.
In response, the Missouri Foundation for Health funded a pilot program, HealthTran, under their Special Projects funding. Administered by the Missouri Rural Health Association, HealthTran is a transportation program that coordinates transportation and provides services to individuals across ten counties in South-Central Missouri. The program partners with existing transportation providers, such as local transit agencies and ambulance districts, to provide low cost transportation to health care sites. HealthTran is available to all individuals who do not have access to transportation to their medical appointments nor are eligible for Medicaid non-emergency medical transportation (NEMT), veterans’ transportation assistance, and are unable to afford other transportation options. HealthTran most commonly serves seniors, people with disabilities, and low-income individuals.
1 Missouri Rural Health Association. HealthTran then and now. (2016). Accessed on November 14, 2016 http://www.morha.org/wp-content/uploads/2016/05/HealthTran-2016.pdf
2 Community Asses Builders, LLC. Missouri rides to wellness-Executive summit summary. (2015). Accessed on November 14, 2016 http://www.morha.org/wp-content/uploads/2016/04/R2W-Report_Dec-1_2015.pdf
3 HealthTran. (2015, August 10). Leo Haralson short. Accessed on November 14, 2016 https://www.youtube.com/watch?v=zHKctSdLzO4
Missouri: Per Capita Investment in Public Transportation
Source: Graph from “HealthTran then and Now” by Missouri Rural Health Association.
Missouri Transit Investment TrendSource: Graph from “Missouri Rides to Wellness- Executive Summit
Summary” by Community Asset Builders.

>>> 33
RIDES TO WELLNESS COMMUNITY SCAN PROJECTHEALTH OUTREACH PARTNERSRIDES TO WELLNESS COMMUNITY PROFILES
HealthTran Coordinators
This role is a cross between a medical care coordinator4 and transportation mobility manager.5 They work to obtain the most appropriate and cost- effective ride based on the patient’s needs. HealthTran Coordinators complete both a pre-assessment with new patients to identify their service needs and a post-assessment to evaluate patient satisfaction and the effectiveness of the program. They schedule rides with public and private transit providers for patients and provide education on how to access and utilize the transportation services.
HealthTran Coordinators are hired from the community they serve and are familiar with the transportation options in their region. Coordinators also help identify “holes” in the medical and transit systems and try to address them so to benefit the patient. From August 2014, HealthTran has provided transportation to 733 individuals and processed 4,729 patient referrals for transportation services. In 2016, HealthTran handled 2,012 referrals of which 76% were completed at an average cost of $34 per leg of the trip.
HealthTran Membership
HealthTran engages health care and community partners to work together to improve community health by becoming members of the program. Current members include private providers, health centers, and hospitals, but is open to other health and support service providers. The model allows the health care provider to determine the amount required to address transportation in their community, which is then paid to HealthTran, starting at $5,000. HealthTran uses 20% to cover their own costs of mobility management services. The remaining 80% is allocated for that member’s patients who are using HealthTran referrals to arrange for transportation and do not have the means to pay. HealthTran Coordinators work closely with the member partners to ensure they understand how to utilize the program so that patients successfully reach their health care appointments via the most affordable and efficient transportation. The Potential Financial Impact
HealthTran helps to reduce healthcare spending in various ways: 1) maintaining a continuity of care for patients; 2) avoiding preventable and costly treatments; and 3) reducing loss of revenue attributed to “no-shows” by completing billable provider visits. While membership fees are sometimes met with reluctance, HealthTran services have already demonstrated positive financial impact for their member organizations. One participating facility estimated that from September 2014 – May 2016, they spent about $139,000 on 3,366 rides and saw a revenue increase of $1,300,000 in Medicare reimbursement for services provided to HealthTran patients. This translated to about $10 in health care service delivery reimbursement for every $1 spent on transportation. HealthTran is also showing positive financial impacts for individual patients. For example, HealthTran provided one patient with about $6,000 worth of transportation services to various providers for medical treatment on his leg. Without this treatment, the likely outcome would have been amputation of the limb; the average lifetime cost of a prosthetic limb and associated medical care is 1.4 million dollars.6 HealthTran not only prevented the costly medical procedure but also maintained the quality of life for the patient.
Contact: • Suzanne Alewine, Executive Director, [email protected]
• Doris Boeckman, Principal, Community Asset Builders, LLC, [email protected]
• Mary Gordon, HealthTran Project Manager, [email protected]
4 The Agency for Healthcare Research and Quality defines care coordination as the deliberate organization of patient care activities between two or more participants (including the patient) involved in a patient’s care to facilitate the appropriate delivery of health care service. The care coordinator is the individual within an organization who provides these services.
5 The AARP defines “mobility management” as a process of managing a coordinated community-wide transportation service network comprised of the operations and infrastructures of multiple trip providers in partnership with each other. It is characterized by a focus on individual needs, not on moving the masses. A mobility manager, is the individual within an organization who provides these services.
6 HealthTran Patient Story. Accessed on November 14, 2016 https://www.youtube.com/watch?v=zHKctSdLzO4
“THE PATIENT HAS TO BE THE MAIN PRIORITY. NOT THE DOCTOR’S OFFICE, NOT THE TRANSIT PROVIDER. PATIENTS SIMPLY ARE NOT ABLE TO NAVIGATE THE SYSTEMS WE HAVE IN PLACE. WE’VE PUT A PERSON IN THE MIDDLE. WE’VE GIVEN THE PATIENT THEIR OWN ADVOCATE.”

>>> 34
RIDES TO WELLNESS COMMUNITY SCAN PROJECTHEALTH OUTREACH PARTNERSRIDES TO WELLNESS COMMUNITY PROFILES
BUFFALO, NEW YORKGO BUFFALO MOM
The Problem: High Rate of Premature Births
The City of Buffalo, New York, is the third poorest city in the United States1 and has the highest rate of preterm births in the state at 11.4% of all births.2 This rate is 31% higher than the New York average, and 19% higher than the national average,3 often due to the challenges pregnant women face in accessing prenatal care. In fact, 27% of pregnant women in Buffalo do not receive prenatal care in their first trimester,4 in large part due to the lack of transportation options. As the population continues to expand across Buffalo and the surrounding counties, the availability of public and private transportation options has not kept pace with the growth.
The Response: Personalized Transportation Navigation and Financial Education
The United Way of Buffalo and Erie County recognized the importance of addressing this great transportation need and began by looking internally to those with the most knowledge – their Healthy Start Coalition comprised of 50 local social service organizations – to establish a Design Transportation Team. Partnering with the Buffalo Niagara Regional Transportation Council, the team conducted focus groups with pregnant women and reviewed data from past prenatal nutrition programs. Findings confirmed that transportation was one of the biggest barriers for pregnant women in reaching their prenatal appointments. As a result, the team created Go Buffalo Mom, a transportation program that provides personalized support and financial education to low-income pregnant women.
Transportation Navigators
Findings from the focus groups indicated the need to address information gaps around existing transportation options in a personalized manner. Go Buffalo Mom trains Transportation Navigators to meet with pregnant women at their first prenatal appointment, conduct an assessment of their transportation needs, and develop an individualized plan using existing bus routes, light rail, rideshare, and taxi services. The goal is to outline the most affordable and efficient plan possible to get to their appointments, with extra emphasis on a transportation plan for the day of delivery
1 Buffalo Business First. Buffalo’s poverty rate tops 30 percent, making it America’s third-poorest city. (2014). Accessed on October 18, 2016. http://www.bizjournals.com/buffalo/news/2014/01/02/buffalos-poverty-rate-tops-30.html
2 Go Buffalo Mom. (n.d.) Go Buffalo Mom Business Plan: Healthy start healthy future for all coalition.
3 March of Dimes. 2016 Premature Birth Report Card. Accessed on October 18, 2016. http://www.marchofdimes.org/materials/premature-birth-report-card-united-states.pdf
4 New York State Department of Health. Percentage of births with early prenatal care. Accessed on February 14, 2017. https://www.health.ny.gov/statistics/chac/birth/b21.htm
0
2
4
6
8
10
12
New York State
United States
Bu�alo
11.4%
9.6%8.7%
11.4%
9.6%
8.7%
Bu�alo UnitedStates
New YorkState
Take the bus
Drive by themselves
Share a ride with a friend
Walk
Use a taxi service
45%
45%
18%
18%
15%15%
12%
12%
10%
10%
Preterm Birth RatesSource: Data on preterm births from Go Buffalo Mom Business Plan and
from the March of Dimes 2016 Premature Birth Report Card.
Buffalo Women Receiving Prenatal Care in First Semester
Source: Data New York State Department of Health

>>> 35
RIDES TO WELLNESS COMMUNITY SCAN PROJECTHEALTH OUTREACH PARTNERSRIDES TO WELLNESS COMMUNITY PROFILES
Financial Coaching
Go Buffalo Mom developed the Ride and Save program to supplement the Transportation Navigators program. Ride and Save encourages healthy financial and savings practices for future transportation needs. The program will be piloted with 100 pregnant women who are able to meet with a financial coach, establish a bank account and manageable savings plan, and attend financial education classes. Each participant will receive a free bus pass for as long as they are active in the program. The goal is for the participants to continue the program long after their child is born.
The Potential Financial Impact
Go Buffalo Mom is considering the financial impact of prenatal care and missed appointments. For example, the average costs for a preterm birth are $58,917 more than for a baby born without health complications.5 In Buffalo, the state and employers are covering the costs of many of these expenses. Furthermore, area clinics have an average 20% to 30% no-show rate, at a loss of about $200 per missed appointment.6 Not all preterm births can be attributed to missed appointments or lack of prenatal care; however, these appointments are crucial for mothers and their children to get the care and information they need to deliver a healthy baby. Go Buffalo Mom plans to serve 500 pregnant women annually. If only 10 of them deliver a healthy baby that might have otherwise been born preterm, it will save almost $600,000, more than twice the program’s initial investment.
Contact: Mary K. Comtois, Program Director of Health Initiatives, [email protected]
5 March of Dimes. Premature Birth, The Financial Impact on Business. Accessed on February 23, 2017. http://www.marchofdimes.org/
6 Comtois, M.K. (2016, August 17). Personal interview.
“PEOPLE REALLY UNDERESTIMATE FEAR OF THE UNKNOWN. IF YOU HAVEN’T TAKEN THESE TRANSPORTATION OPTIONS YOURSELF, IT CAN BE INTIMIDATING AND HAVING A PERSONAL TOUCH IS KEY. THAT ROLE OF THE NAVIGATOR IS SO IMPORTANT TO GET PEOPLE OVER THE HUMP TO TRY THESE ALTERNATIVES.”

>>> 36
RIDES TO WELLNESS COMMUNITY SCAN PROJECTHEALTH OUTREACH PARTNERSRIDES TO WELLNESS COMMUNITY PROFILES
PORTLAND, OREGONRIDE CONNECTION
The Problem: Limited Access to Dialysis Treatment
For diabetes patients with kidney failure, the treatment option besides a transplant is regular dialysis treatments. These treatments are generally needed three times a week and are most often administered at private clinics. The frequent travel places extra strain on patients who are dealing with issues of affordability and scheduling on top of managing their health. Further, dialysis patients need time to recover and are generally not fit to drive themselves immediately after treatment, yet 25% of dialysis patients drive to and from appointments on their own. The other 75% rely on others for a ride or use public transportation.1 In addition, 84% of dialysis patients have Medicare coverage,2 which does not provide non-emergency transportation, leaving the vast majority of patients to search and pay for their own transportation.
The Response: Transportation for Dialysis Treatment
Ride Connection, a non-profit organization based in Portland, Oregon, provides transportation services with a focus on serving older adults and people with disabilities. It began as a citizen committee of TriMet, the local public transportation authority. Ride Connection has gone from facilitating 11,700 rides in 1986 to providing almost 570,000 rides in 2015-2016. With a network of 30 service partners and nearly 700 drivers, one-third of whom are volunteers, Ride Connection offers a myriad of transportation services, including rides to dialysis treatments and other non-emergency medical treatments. They have also trained 2,000 riders on using public transit services. Ride Connection continues to grow and design services to address new populations.
In evaluating the impact of their services, it became clear that the patients using transportation services for their dialysis treatments had a much greater need than what Ride Connection was offering. Additionally, partner organizations reported increased difficulties in serving this patient population, as requests for rides to dialysis treatment were rising. In response, Ride Connection launched a pilot program in 2013 to understand and address the challenges dialysis patients face.
The Pilot Program: Dialysis and Transportation
The Dialysis and Transportation pilot program was broken into three phases: a participatory planning process, the development of promising practices, and on-site implementation.
Phase I: Participatory PlanningRide connection began with a participatory planning process to identify patients’ greatest transportation barriers. This was done by creating an advisory committee and conducting focus groups, patient interviews, patient and provider surveys, and public workshops. Six main themes emerged: 1) dependability of rides, 2) flexibility in scheduling, 3) long wait times and indirect routes, 4) affordability of transportation, 5) lack
1 Wilcke, J., Henderson, T., Small,V., & Tsumenmine, Y.(2016) Need a ride? Improving transportation to dialysis treatment (Part 1). The Journal of Nephrology Social Work. 40(1), 28-35.
2 Ibid.
Almost 700 drivers (1/3 are volunteers)
569,444 rides in 2015-2016
Over 2,000 riders trained

>>> 37
RIDES TO WELLNESS COMMUNITY SCAN PROJECTHEALTH OUTREACH PARTNERSRIDES TO WELLNESS COMMUNITY PROFILES
of driver training, and 6) inconvenient clinic assignments. As a result, Ride Connection developed a transportation matrix of available options to be distributed to partner organizations. They also instituted new policies to allow a guaranteed return trip for all riders and excuse no-shows or cancellations due to medical conditions.
Phase II: Promising PracticesPhase II centered on putting the findings collected into practice. Ride Connection believes that a successful ride depends as much on the driver as it does the passenger, and created a training course for drivers to better understand the experience of patients. This training is delivered by patients and is offered for free to all, including outside organizations. Phase II also initiated targeted outreach efforts to the dialysis community. Using the participants from the planning process (Phase I), they reached out to outside programs, patients, and providers to design outreach materials, assist in recruiting volunteer drivers, and increase advocacy around their cause.
Phase III: On-site ImplementationThe final phase was to test the program at one clinic, starting in February 2015. One dispatcher was dedicated to that clinic, and started to assess the needs of patients. Next, they collaborated on scheduling with Ride Connection partners to increase convenience and efficiency. Finally, they offered free rides to patients from drivers who were trained in Phase II and who receive mileage reimbursements. The rides were provided by paid and volunteer drivers from a variety of programs and services. Thus far, the results have shown a great impact on the dialysis community. Patients report fewer missed appointments, clinics are spending less time on scheduling, more rides are available, and patients are showing improved overall health outcomes.
The Potential Financial Impact
Tracking the program’s financial impact has emerged as an increasingly important issue in order to secure long-term funding and to share best practices. Before the pilot, patients were cutting their treatments short due to arriving late or leaving early for their ride. Because dialysis replaces only a fraction of kidney function, every few minutes of treatment lost can greatly diminish kidney health. Missed and shortened treatments led to poorer health outcomes, and ultimately, admission to the hospital. Patients with end stage renal disease (kidney failure) who are readmitted to the hospital have an average monthly cost of $12,634, which is nearly $9,000 more than for patients who are not admitted.3 In the month following a patient’s initial hospitalization, just one extra dialysis treatment per patient could create 31,730 fewer hospitalizations per year.4 This would lead to $240 million in savings for the patients and healthcare system. The investment in Ride Connection is relatively small compared to the long-term health and financial benefits.
Contact: Julie Wilcke, Chief Operating Officer, [email protected]
3 Erickson K.F, Winkelmayer, W.C, Chertow, G.W, & Bhattacharya J. (2014). Physician visits and 30-day hospital readmissions in patients receiving hemodialysis. Journal of the American Society of Nephrology, 25(9), 2079–2087.
4 Ibid.
“EMPOWERING PEOPLE TO TAKE LEADERSHIP ROLES TAKES TIME AND ENERGY, BUT THE RESULTS ARE PHENOMENAL.”

>>> 38
RIDES TO WELLNESS COMMUNITY SCAN PROJECTHEALTH OUTREACH PARTNERSRIDES TO WELLNESS COMMUNITY PROFILES
KING COUNTY, WASHINGTONHOPE LINK
The Problem: Lack of Transportation for Seniors
Seniors often face simultaneous health and social issues. With higher rates of chronic disease, limited mobility, and a need for frequent care, navigating their complex needs requires extra attention and resources. However, resource sharing can often be fragmented among providers and care teams. The need for transportation is one of the main barriers in allowing senior patients to follow through on their full course of care and is one of the greatest challenges facing service providers. Many seniors lose much of their independence in their later years due to limited physical mobility, including the ability to drive. Navigating available transportation options can be time consuming and confusing. While Medicaid-eligible patients can access non-emergency medical transportation services, the options are limited to a handful of community programs for older adults only covered by Medicare.
The Response: Community-Wide Transportation Services for Seniors
Hopelink provides a variety of services including food access, employment assistance, and transportation programs throughout King County. Recognizing the impact that a lack of transportation has on senior health, Hopelink engaged the local community by working with health and social service representatives to identify the exact nature of the transportation problem for this population. Through these conversations, Hopelink began to focus on the issue of hospital discharge and readmission. Based on community needs data, they focused on Medicare patients in South King County, facilitating their post-hospital treatment plans to prevent avoidable readmissions.
Care Mobility Rewards
The resulting pilot program, titled Care Mobility Rewards, is aimed at “high and rising risk” discharge patients. High and rising risk patients are seniors who are more likely to end up back in the hospital because they may be unable to follow their recommended course of treatment. Care Mobility Rewards eliminates much of the miscommunication between care teams while easing some of the complications of transportation for seniors who may be already feeling burdened by their new, detailed discharge plan. The program is divided into distinct sections that must work together in order to succeed: Collaboration, Transportation Navigators, and Travel Credits.
Collaboration Collaboration is key to the success of Care Mobility Rewards. One of Hopelink’s strengths is its connection to area health and social services agencies. By partnering with hospitals and their patient navigators team, they will be able to get important transportation information in-cluded in a patient’s discharge plan. Hopelink will then offer patients access to join Care Mobility Rewards to coordinate travel to appointments and help improve their health.
“OVER TIME YOU SEE THE OUTCOMES OF THESE COORDINATION EFFORTS AND YOU REALIZE THE SIGNIFICANCE OF IT. HAVING THAT NETWORK THERE IS INVALUABLE.”

>>> 39
RIDES TO WELLNESS COMMUNITY SCAN PROJECTHEALTH OUTREACH PARTNERSRIDES TO WELLNESS COMMUNITY PROFILES
Transportation NavigatorsRather than training existing patient navigators on trans-portation, which would put undue burden on a workforce already at capacity, the Care Mobility Rewards program will hire and train new transportation navigators. These transportation navigators will staff a central phone line that patients can call to arrange transportation to future appointments. The navigators will be versed on available agencies that can provide transportation according to the patient’s schedule, and can address any concerns or doubts over the phone.
Travel CreditsA patient receives Travel Credits as a “reward” upon enrolling in the Care Mobility Rewards Program. These credits can be used directly for free rides through partner agencies and can be redeemed through the transportation navigators. Travel Credits can also be earned by participating in healthy behavior programs, such as a smoking cessation course. As a patient becomes more familiar with the program, they can find new ways to earn credits.
The Potential Financial Impact
Hopelink’s research revealed that hospitals in South King County have an estimated 1,384, 30-day readmissions among their Medicare patients in a given year. These readmissions come at an average cost of $11,563. Hopelink estimates that 30% of these patients would be considered high and rising risk upon discharge. Considering these figures, even modest projections show that this program has the potential for a large return on investment. For example, if only 1% of the estimated 1,384 readmissions (approximately 14 individuals) are avoided through the program, this has a potential savings of $160,032.
Table 1. Potential Savings of the Care Mobility Rewards Program
12-month Pilot
Average Cost per Readmission $11,563
Estimated Annual # of 30-day Readmissions $1,384
Potential Readmissions Prevented 14 (1%) 28 (2%) 42 (3%)
Potential Savings $160,032 $320,064 $480,096
Through a dedication to collaboration, the inclusion of transportation navigators and travel credits, HopeLink hopes to make a significant impact on the health and wellbeing of seniors in King County. They place great value in quantifying the financial benefit of the program in order to ensure its longevity and make the greatest impact possible for this population.
Contact: Francois Larrivee, Transportation Director, [email protected]

Copyright © 2017 by Health Outreach Partners. All rights reserved. Copies of this and other documents are available from Health Outreach Partners.