Embed Size (px)
Citation preview

Rice Processing Industry of Bangladesh
May 2017

Department of Research| Emerging Credit Rating Limited
Emerging Credit Rating Limited
Department of Research Industry Analysis Series
Rice Processing Industry of Bangladesh
By
Arifur Rahman
Al Mamun
Nabihatul Afrooz
Subrata Howlader
A.B.M. Qudrot-E-Khuda
Industry Analysis 2017-05
May 2017
Department of Research
Shams Rangs, House 104, Park Road
Level-A1, A2 & A5
Baridhara, Dhaka-1212
Tel: +880 2 986 0911, +880 2 986 0897
Fax: +880 2 986 0828
Email: [email protected]
Web: www.emergingrating.com

i
Department of Research | Emerging Credit Rating Limited
Table of Contents
1. Introduction: ............................................................................................................... 1
2. The Present Scenario of the Rice Processing Industry of Bangladesh: .............................. 3
3. Establishment and Operational Cost of a Rice Mill: ......................................................... 4
3.1 Automatic Rice Mill: ................................................................................................... 4
3.1.1 Establishment Cost .............................................................................................. 4
3.1.2 Operational Cost: ................................................................................................ 5
3.2 Husking Mill: ............................................................................................................. 5
3.2.1 Establishment Cost: ............................................................................................. 5
3.2.2 Operational Cost: ................................................................................................ 6
4. Legal Issues: ............................................................................................................... 7
5. Production Process: ..................................................................................................... 8
5.1 Production Process of Automatic Rice Mills: ................................................................. 8
5.2 Production process of Husking Mills: ..........................................................................10
6. Difference between Traditional and Modern Mill: ...........................................................11
7. By Product Generation: ...............................................................................................12
8. Marketing Channel: ....................................................................................................13
9. Government policies: ..................................................................................................14
10. Economic analysis: ..................................................................................................16
11. Problems and Prospects: ..........................................................................................20
11.1 Prospects: .............................................................................................................20
11.2 Problems: ..............................................................................................................21
12. Conclusion: .............................................................................................................22
References .......................................................................................................................23
Appendix: .........................................................................................................................25
ii
Department of Research | Emerging Credit Rating Limited
List of Tables
Table 1: Machinery Cost (Taka in million) of the Automatic Rice Mill ....................................... 4
Table 2: Machinery Cost (Taka in million) of Husking Mill ....................................................... 6
Table 3: The Modern Rice Milling Process ............................................................................. 8
Table 4: Major Differences of Husking and Automatic Rice Mill ..............................................11
Table 5: Milling Outturn and Production of By-Products for 40 KG Paddy ...............................12
Table 6: By-product Selling Price for both Husking and Automatic Rice Mills ...........................12
Table 7: Summary Statistics ...............................................................................................19
Table 8: Benefit-Cost Ratio (BCR) by the Size of the Organization. ........................................19
Table 9: Size of the Organization by Total Cost, Total Revenue, Total Current Asset, Total Fixed
Asset, Total Production, Total Capacity, Total Insurance, Total Mortgage, Total Loan..............25
Table 10: Division by Total Cost, Total Revenue, Total Current Asset, Total Fixed Asset, Total
Production, Total Capacity, Total Insurance, Total Mortgage, Total Loan................................26
Table 11: Types of the Organization by Total Cost, Total Revenue, Total Current Asset, Total
Fixed Asset, Total Production, Total Capacity, Total Insurance, Total Mortgage, Total Loan. ....27
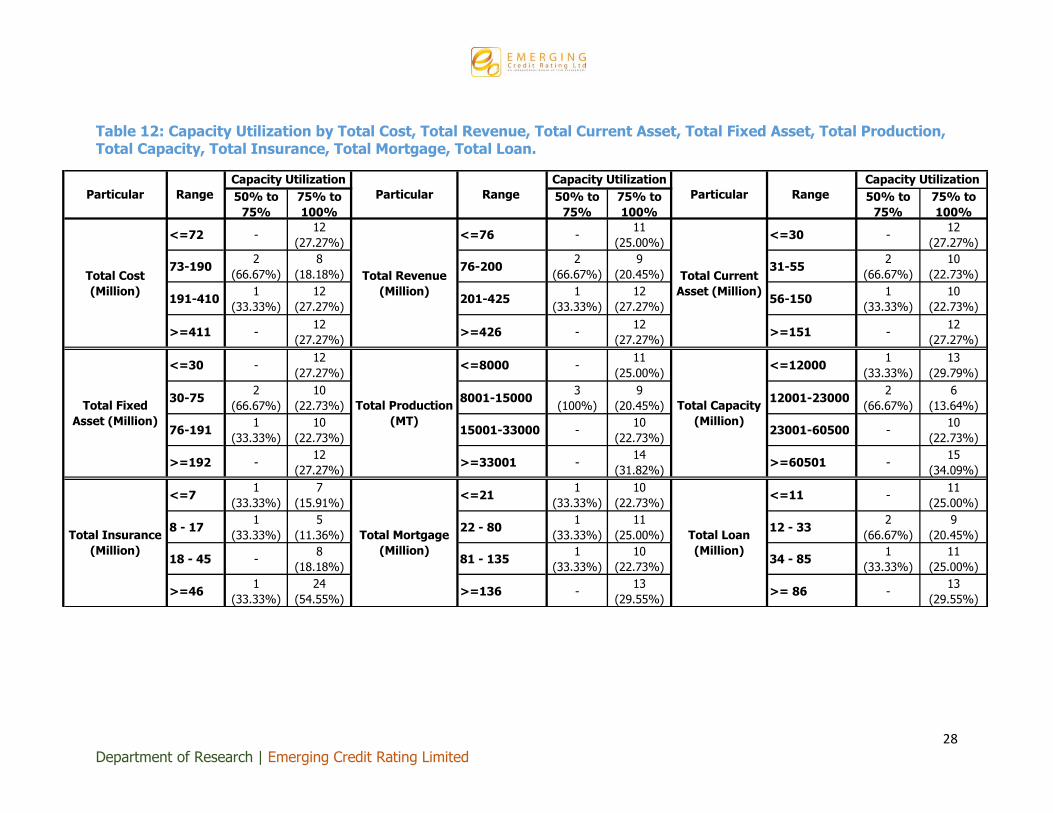
Table 12: Capacity Utilization by Total Cost, Total Revenue, Total Current Asset, Total Fixed
Asset, Total Production, Total Capacity, Total Insurance, Total Mortgage, Total Loan..............28
Table 13: Net Profit by Size of the Organization. ..................................................................29
Table 14: Breakdown of the Fixed Assets by Size of the Organization. ...................................30
Table 15: Breakdown of the Current Assets by Size of the Organization. ................................30
Table 16: Benefit-Cost Ratio of the Individual Organization. ..................................................31

iii
Department of Research | Emerging Credit Rating Limited
List of Figures
Figure 1: Rice Production and Consumption Trend in Bangladesh ........................................... 2
Figure 2: Auto Rice Milling Flow Chart .................................................................................. 9
Figure 3: Husking Mill Flow Chart .......................................................................................10
Figure 4: Marketing Channel of Rice Processing Industry ......................................................13
Figure 5: Distribution of Firms by Division ...........................................................................16
Figure 6: Distribution of Firms by Types of the Organization .................................................16
Figure 7: Distribution of Firms by size of the organization .....................................................16

1
Department of Research | Emerging Credit Rating Limited
1. Introduction:
Bangladesh is one of the world's top rice-consuming countries. The per capita rice consumption
stood at 196.6 kilograms in FY2016 and 196.3 kilograms in FY2017 (The University of Arkansas,
2017). Rice is the most important cereal and staple food which provide more than 70 percent of
the total calorie intake in Bangladesh (Zaman, Mishima, Hisano, & Gergely, 2001). Bangladesh
has three seasons of rice production namely Aus (summer), Aman (winter) and Boro (spring).
The aggregated production of Aus (2.6 million MT), Aman (13.2 million MT) and Boro (18.7
million MT) paddies has been estimated to be 34.5 million metric tons (MT) in FY2016 by using
total 11.77 million hectares (HA) of land (Lagos & Hossain, 2016) which is more than 75
percent of total cropped land (BARC, 2011).
However, after harvesting paddy from the crops field, it needs to be processed for
consumption. There are three stages of rice processing which includes parboiling, drying, and
milling. This process can be conducted both at home and at the rice mill. The small scale paddy
processing is conducted at home for the non-commercial purpose, precisely for the family
consumption. Dheki1 is the main instrument to process paddy after it is parboiled and dried.
Another way of small scale paddy processing is conducted in the village rice mill2 or small
husking mill for the family consumption. Small rice husking machine can also be the main
instrument to process paddy after it is parboiled and dried at home. The large scale of paddy
processing is mainly conducted by the rice mill which is known as a commercial milling3 center.
Generally, two types of commercial mills are available in Bangladesh: modern or automated rice
mill and husking or traditional rice mill. Modern or automatic rice mills holds out roughly all
activities through a mechanical process, including categorization of rocks & unfilled grains, grain
marinating, boiling, drying, milling, polishing & bagging. On the other hand, traditional
commercial mills or Husking mill is the oldest processing method of paddy. They are often made
of wood with few metal components and are often driven by a single power source through a
system of transmissions (Islam, 2014). This study mainly focuses on commercial milling system
of Bangladesh.
1 A wooden made instrument, 2. 5 - meter long and 20 - cm square, balanced like a seesaw on a bamboo
fulcrum. This tool is known as Dheki, used by villagers for husking rice. During the husking process,
women push one end with her foot, so that the other end, fitted with a wooden peg, rises and falls on
the rice grains in a hole scooped in the kitchen's earthen floor. The pounding breaks the outer husks,
leaving the inner kernels intact (Zaman, Mishima, Hisano, & Gergely, 2001) 2 Village - rice mills are used for service milling paddy of farmers for home consumption. It can be found
in rural communities. 3Commercial milling systems mill the paddy in stages and consequently are called multi-stage or multi-pass rice mills. The purpose of commercial rice milling is to diminish mechanical pressures and heat
buildup in the grain, thereby decreasing grain breakage and producing uniformly polished grain (Rice Knowledge Bank, 2017).

2
Department of Research | Emerging Credit Rating Limited
In the last two decades, consumption and production of rice increased significantly (Table 1). At
the same time, the commercial rice mills have also increased. Some traditional or husking mill
owners have replaced their mills from husking to modern system. Despite many problems, the
firm owners are making a considerable profit which is influencing people to invest in this
business. However, the main objective of this study is to provide a complete picture of the
commercial rice milling system.
Figure 1: Rice Production and Consumption Trend in Bangladesh
To meet up the objective, this study discusses the recent scenario of rice processing industry of
Bangladesh, along with the capital required and the rules and regulations to follow to establish
and run a rice mill. This study also accentuates other factors like production process, by-
products, seasonal impact and marketing channels. Along with these, this study analyzes the
primary survey data collected from different rice mills. Finally, the problems & prospects to
establish and run a commercial rice mill have also been talked about. However, for a significant
discussion, this study used both primary and secondary data. Secondary data has been
collected from different sources.
-0.15
-0.1
-0.05
0
0.05
0.1
0.15
0.2
0.25
0
5000
10000
15000
20000
25000
30000
35000
40000
Pe
rce
nta
ge
10
00
MT
Year
Rice Production and Consumption Trend
Domestic Consumption Production Consumption Growth Rate Production Growth Rate
Source: Index Mundi (Index Mundi 2016)

3
Department of Research | Emerging Credit Rating Limited
2. The Present Scenario of the Rice Processing
Industry of Bangladesh:
The rice milling or processing sector in Bangladesh is undergoing a revolution. In recent years,
significant numbers of people are not using Dheki for the paddy processing. This place has been
occupied by the machines. However, in recent years, per capita income of people in Bangladesh
has increased significantly. Due to rise in the income levels, people now prefer processed rice,
which is less costly, looks glossy, takes less time to cook, is free from stones & dead rice, and
has longer shelf life. To match with the demand of the people, new automatic rice mills are
being set up at a mounting rate, increasing competition for thousands of small and medium
husking mills. Automatic rice mills may have an impact on the performance of the rice selling
system. On the other hand, many husking mills are withdrawing which is decreasing the market
share for the small millers. Over the previous decade, several hundred automatic and semi-
automatic rice mills have been found in different rice producing regions of Bangladesh.
Naogaon, Chapainawabganj, Dinajpur, Kushtia and Noapara of Jessore are some districts that
have involved investment in establishing large automatic rice mills. More investments are
coming up for placing new auto rice mills (The Daily Star, 2011). In 2005, around 500
automatic and semi-automatic rice mills together with 17000 husking mills have been in
operations which are also involved in parboiling, drying and crushing paddy bought from
farmers. Of these mills, more than 350 operators have their own brand rice in the market.
Bangladesh Auto, semi-auto and Husking Mills Association has around 17,000 members. These
mills process and market at least 60 percent or three crore tons of the five crore tons of paddy
produced a year in the country. The farmer keeps the rest of the production for their own
consumption according to analyst and millers. In a year, the market for milling and processing
of rice stands at around Taka 50,000 crore (The Daily Star, 2015). According to the provisional
data by the Bangladesh Bureau of Statistics (BBS), it has been reported that in FY15, the
production of milled rice reached a record high of around 34.708 million tons, a little up from
approximately 34.41 million tons in FY14 (Rice Outlook, 2015).

4
Department of Research | Emerging Credit Rating Limited
3. Establishment and Operational Cost of a Rice Mill:
The establishment cost of a rice mill is mainly incurred in three areas such as land purchasing,
building development, and machinery purchase. But the cost will vary depending on the size
and types of the firms. This part of the study mainly focuses on the minimum cost and capital
required to establish an automatic and a semi-automatic rice mill.
3.1 Automatic Rice Mill:
3.1.1 Establishment Cost
3.1.1.1 Land:
To establish a 50-ton production capacity rice mill, land of 100 decimal is required and for 100-
ton capacity rice mill, land of 150 decimal is needed. Additional land leads to more comfortable
operation and thus more production capacity (CBECL, 2012). However, the price of the land
depends on different place and location.
3.1.1.2 Infrastructure Development:
3.1.1.2.1 Building Structure Development:
An automatic rice mill structure can be established by using bricks, steel, and the combination
of both. The cost of establishing a building mainly depends on the market price of raw materials
and its quality. The cost of establishing a building may vary based on different locations and
regions. An entrepreneur has to calculate all of the materials cost before constructing a mill.
3.1.1.2.2 Setup Cost of Machinery:
There are four sections of an auto rice mill plant: Parboiling Section, Drying Section, Milling
Section, and Bagging Section. Different types of machinery are required for different stages of
operations. The price of the machines also depends on the different stage of production. Table
1 provides the complete picture of the types of machinery for the different stages of production.
Table 1: Machinery Cost (Taka in million) of the Automatic Rice Mill
Particular Japanese Brand Chinese Brand Indian Brand Korean Brand
Boiler 4.8-5.0 4.8-5.0 . 5.0-8.0
Dryer 13.6 4.2 12.0 7.2
Parboiling 15.0-19.0 7.8-9.0 12.0 3.2
Milling 35.0-40.0 15.0-20.0 . 10.0-20.0
Color Sorter 11.0 5.0-6.0 4.5-6.0 7.0
Power station 2.2 2.2 2.2 3.0-4.0
Source: Bangladesh Rice Research Institute and ECRL primary survey (April 2017)

5
Department of Research | Emerging Credit Rating Limited
The average price of the standard boiler machine is about Tk.4.8 million to Tk.8.0 million which
has the per day capacity of boiling (assuming 16 hours) 50 ton to 100-ton paddy. But the cost
of the Japanese and Chinese brand is lower than the Korean brand. However, almost 90
percent of parboiling rice milling machinery in Bangladesh are generally imported from India
(CBECL, 2012), whereas machines from Japan and Germany are better in quality but expensive
as compared to Indian machinery. The average cost of Indian machine for parboiling section is
about Tk.12 million for 100 tons per day capacity. Another Indian machine for drying section
has the average cost of 100 tons per day capacity costing about Tk.12 million. But the cost of
Chinese brand is only Tk.4.2 million. However, 90 percent of Milling and Bagging machinery is
imported from China. The price of the Chinese machine of milling is about Tk.15 million to
Tk.20 million for 100 tons per day capacity. Similarly, color sorter machines are also very
expensive. The Indian color sorter machine costs around Tk.4.5 million to Tk.6 million. This
machine is used for separating black and weak rice. It works by a camera and the number of
cameras depends on the number of channels.
3.1.2 Operational Cost:
3.1.2.1 Labor Cost:
Labor cost is an important variable cost for an organization. In automatic rice mill, on average
20-25 workers are required including permanent (10-15) and temporary (10-12) workers.
Moreover, the number of labor depends on the size of the firm and their capacity of production.
The monthly salary of permanent workers is around Tk.12,000 to Tk.15,000 on average, where
temporary workers get daily Tk.500 to Tk.700 on average. Normally, it is visible that temporary
workers are getting higher wages than permanent workers but their job is more vulnerable than
permanent workers. However, the wage rate of an automatic rice mill varies according to the
location of the mill, their demands, and availability of labor.
3.1.2.2 Utility Cost:
Another important variable cost is utility cost which is very much depending on the unit of
production. The utility cost, such as electricity bill, fuel cost, gas bill, water bill and others, of an
automatic rice mill, depends on their total monthly production and other related factors.
3.2 Husking Mill:
3.2.1 Establishment Cost:
According to the husking mill owners, to establish a husking mill the capital required on an
average is Tk.4.0 million to Tk.5.0 million and a land of 100 decimals is needed. Most of the
land is required for the drying of paddy. The main fixed cost is the land cost and then the

6
Department of Research | Emerging Credit Rating Limited
machinery cost. This cost will vary depending on different area and location. However, the
machinery cost of husking mill and semi-automated mill is given below.
Table 2: Machinery Cost (Taka in million) of Husking Mill
Particular item Husking Mill
Saddler 0.1
Rice filter 0.1-0.15
Garden polisher 0.08
Milling 0.15
Power station 0.5-0.7
Source: ECRL primary survey (April 2017)
3.2.2 Operational Cost:
Generally, husking mills are labor intensive. So the husking mills require more labors compared
to the automatic rice mill. On an average 30 workers are required for husking mill and their
average wage rate per day is TK.500. The wage rate of husking mill is very much similar to the
automatic rice mill and their wage rate also varies according to the location of the mill, their
demands, and availability of workers. On the other hand, utility cost of husking mill is lower
than the automatic rice mill due to the lower amount of production and mainly for the manual
operating system.

7
Department of Research | Emerging Credit Rating Limited
4. Legal Issues:
Before setting up a rice mill, the entrepreneur needs to acquire necessary approval or licenses
which are required as per regulations from the relevant authorities relating to a range of Acts
and rules made thereunder which gives the clearance of establishing the rice mill.
1. License from Ministry of Land Office: The initial steps require a permit for establishing
the industry.
2. Local Chairman Trade License: Trade license is required before starting any business.
3. Ministry of Food License (Upazila Food Controller, District Food Controller): Rice mill set
up requires a license to be acquired for manufacturing rice or food items.
4. Approval from Ministry of Power: The electricity or power supply is very important in the
manufacturing of rice especially for the auto rice mills. The ministry of power needs to
be informed about the quantity and the power supply required. The ministry would
provide the approval and power supply as required.
5. Ministry of Environment and Forests Approval: Rice mill emits husks while manufacturing
of the rice which has proven to have created a health hazard for the local people living
near the mills. So, an environmental certificate has to be collected which requires
following some rules or precautions to be taken that can reduce the impact. It gives the
approval to the mill owners to mill the rice.
6. Fire Service: The mill has to meet up the requirement of safety measures for fire hazard
by taking necessary steps or buying fire extinguishing equipment, etc.
7. Ministry of Labor and Employment: Millers have to abide by all the rules or laws of
labors.

8
Department of Research | Emerging Credit Rating Limited
5. Production Process:
5.1 Production Process of Automatic Rice Mills:
The modern rice milling facility comes in various configurations, and the milling components
vary in design and performance. A modern rice mill has three basic stages- the husking stage,
the whitening-polishing stage, and the grading, blending, and packaging stage. In modern rice
mills, many adjustments (e.g. rubber roll clearance, separator bed inclination, feed rates) are
automated for maximum efficiency and ease of operation. The whitener-polishers are provided
with gauges that sense the current load on the motor drives which gives an indication of the
operating pressure on the grain. This provides a more objective means of setting milling
pressures on the grain (Rice Knowledge Bank, 2017). However, Table-3 signifies the modern
rice milling processes.
Table 3: The Modern Rice Milling Process
Stage Function
Pre-cleaning Removing all impurities and unfilled grains from the paddy.
Husking Removing the husk from the paddy.
Husk Aspiration Separating the husk from the brown rice/unhusked paddy.
Paddy separation Separating the unhusked paddy from the brown rice.
De-stoning Separating small stones from the brown rice.
Whitening Removing all or part of the bran layer and germ from the brown rice.
Polishing Improving the appearance of milled rice by removing remaining bran particles
and by polishing the exterior of the milled kernel.
Sifting Separating small impurities or chips from the milled rice.
Length grading Separating small and large broken from the head rice.
Blending Mix head rice with a predetermined amount of broken, as required by the
customers.
Weighing and
bagging Preparing milled rice for transport to the customer.
Source: Rice Knowledge Bank

9
Department of Research | Emerging Credit Rating Limited
The production process of a modern rice mill follows different shapes. The flow diagram below
(Figure-2) represents the configuration and flow in a typical modern rice mill.
Source: Rice Knowledge Bank
According to the Rice Knowledge Bank the description of the flow of materials and processes
are given below:
1 - paddy is dumped in the intake pit feeding the pre-cleaner
A - straw, chaff and empty grains are removed
2 - pre-cleaned paddy moves to the rubber roll husker:
B - husk removed by the aspirator
3 - mixture of brown rice and unhusked paddy moves to the separator
4 - unhusked paddy is separated and returned to the rubber roll husker
5 - brown rice moves to the de-stoner
C - small stones, mud balls etc. removed by de-stoner
6 - de-stoned, brown rice moves to the 1st stage (abrasive) whitener
7 - partially milled rice moves to the 2nd stage (friction) whitener
D - Coarse (from 1st whitener) and fine (from 2nd whitener) bran removed from the rice grain
during the whitening process
8 - milled rice moves to the sifter
E - Small broken/brewer’s rice removed by the sifter
9a - (for simple rice mill) ungraded, milled rice moves to bagging station
Figure 2: Auto Rice Milling Flow Chart

10
Department of Research | Emerging Credit Rating Limited
9b - (for more sophisticated mill) milled rice moves to the polisher1
10 - Polished rice, will move to length grader
11 - Head rice moves to head rice bin
12 - Broken rice move to broken rice bin
13 - Pre-selected amount of head rice and broken rice move to blending station
14 - Custom-made blend of head rice and broken rice moves to bagging station
15 - Bagged Rice moves to the market
5.2 Production process of Husking Mills:
The production process of a husking mill also follows different stages like automatic rice mill
and most of the works of a husking mill is conducted manually. The Figure-3 shows the flow
diagram of a typical husking mill.
Figure 3: Husking Mill Flow Chart
After harvesting, the crops are brought for threshing to separate the grains from the straws. It
can be done through machines or manually by farmers. Next step is cleaning. Cleaning grains
after harvesting is important as it removes unwanted materials from the grains. It is important
to dry rice grains as soon as possible after cleaning (ideally within 24 hours) (RKB). Farmers dry
grains manually under the sun in the chatal or open field. Then, farmers boil rice grain. Then
again the farmers dry the boiled grains under the sun. The last process includes milling, sorting
(de-stoning) and packaging of the milled rice.

11
Department of Research | Emerging Credit Rating Limited
6. Difference between Traditional and Modern Mill:
The milling process of traditional and automatic mills significantly differs. These are explicated
below.
Table 4: Major Differences of Husking and Automatic Rice Mill
Types of
Mill Major Components
Capacity
of
Production
Power
Requirement
Hulling/
Polishing
Bran
Separation
and Grading
Husking
Soaking Tank Steam
Parboiled Drying Floor
Engle berg Huller
0.6 to 1
ton/hour 30-40 HP
2 to 3
operations Manually
Automatic
Pre-cleaner Soaking Tank
Boiler, Steam Pressure
Parboiled Dryer, Rubber
Roll Sheller, Paddy
Separator Polisher, Bran
Separator etc.
2 ton/hour 65-100 HP
Separately
by different
devices
All Activities
Mechanically
Source: Zaman, Mishima, Hisano and Gergely (2001)
Compared to traditional rice mill, automated rice mill is the cleanest and finest system for rice
processing. Automated processing involves fewer stones than traditional processing. Automatic
rice processing mills can provide more than double processed rice than traditional mills.
Automated rice mills can produce more than 2 ton of rice per hour whereas traditional or
husking mills can produce 0.6 to 1-ton of rice per hour. Traditional rice processing mill requires
30-40 horsepower where automated rice mills need 65-100 horsepower. Moreover, traditional
rice mills need 2 to 3 operations for the cutting and drying of the processed rice whereas,
automated rice processing mills completes these in only one process. In husking mills, grading
and brand separation are done manually but in the automatic mills, grading and brand
separation are totally automated (Table-4). Automatic rice mills can cut the rice into different
sizes like Miniket, Najir Shail, Pajam, Katari Bhog, Chinigura, etc whereas traditional rice mills
are not able to cut the rice into different sizes. It requires 12-15 minutes to cook the rice, which
has been milled in automatic machines whereas 20-25 minutes are required for rice milled
traditionally. In an automated rice mill, by-products come after the number of processing
because of that bran oil can be produced and the by-product is also good poultry feed where
the by-product of traditional rice mills can only be used for poultry feed (Zaman, Mishima,
Hisano, & Gergely, 2001).

12
Department of Research | Emerging Credit Rating Limited
7. By Product Generation:
Rice mills can produce three varieties of by-products which include rice husk, rice bran, and
broken rice. The percentage of head rice, rice husk, rice bran and broken rice varies according
to mill types. On average, the surveyed automatic rice mills could generate 65.0, 22.75, 8.25
and 5.0 percent of head rice, rice husk, rice bran and broken rice respectively, while husking
mill produces less amount compared to automatic (Table 5).
Table 5: Milling Outturn and Production of By-Products for 40 KG Paddy
However, the prices of these by-products are given below in Table 6. The by-product of auto
rice mill has higher market demand because of good quality. The quantity of by-products and
raw products produced by a rice mill and their market demand could influence the margin of
the millers.
Table 6: By-product Selling Price for both Husking and Automatic Rice Mills
Particular
Husk Rice Bran Broken Rice
(per kg) (per kg) (per kg)
Medium Small
Selling price Tk.24 TK. Tk.22 Tk.23-Tk.24 Tk.20
Source: ECRL primary survey (April 2017)
All the by-products that are produced by rice mills have alternative uses such as, bran and
broken rice are useful feed for cattle, poultry, fish and rice bran which is again used to produce
natural oil, while rice husks are utilized as fuel for millers and rural community and ash of husk
is used in cement factory as silica. Husking mill owners generally uses husks as fuel for boiling.
A miller needs roughly 7200 kg husks to boil 40000kg of paddy (Zaman, Mishima, Hisano, &
Gergely, 2001). Most of the time millers, who purchase husks from other millers or from the
market, make charcoal sticks and sell it in the market.
Mill Type Milling Outturn
(Kg)
Husk
(Kg)
Rice Bran
(kg)
Broken Rice
(Kg)
Husky 25 9.3 3.5 2.2
(62.5) (23.25) (8.75) (5.5)
Automatic 26 8.7 3.3 2
(65.0) (22.75) (8.25) (5.0)
Source: ECRL primary survey (April 2017)

13
Department of Research | Emerging Credit Rating Limited
8. Marketing Channel:
Marketing channel or distribution channel is described as a set of interdependent groups that
help to transfer the ownership of goods or services from the producer to the consumers.
Agricultural products move from farmers to ultimate customers through various market
intermediaries that operate in the marketing system and marketing efficiency.
The marketing channels of the rice mills are delineated in Figure 4. Generally, four groups are
involved in the channel for milled rice- producers, aratdar/bazaar, mill, wholesalers /retailers.
Paddy producer sell their paddy to nearby bazaar or hat. Then local aratdar purchases the
paddy from bazaar or hat. Sometimes local aratdar also buy paddy from the producers and sell
it to the millers. The rice millers can also buy paddy directly from producers. Then millers
process the paddy, after processing they sell it to wholesalers or retailers and sometimes
directly to consumers. The retailers buy rice from wholesalers or directly from the mill and sell it
to final consumers.
Source: ECRL primary survey (April 2017)
Local Aratdar Hat/Bazaar
Paddy Producers
Miller
Aratdar/Who
lesaler Retailer
Consumers
Figure 4: Marketing Channel of Rice Processing Industry

14
Department of Research | Emerging Credit Rating Limited
9. Government policies:
Many government policies are into effect to support rice industry and contribute to its growth.
The regulations in domestic rice industry support farmers and rice manufacturer in terms of
paddy prices and rice release mechanism (CRISIL Research, 2016).
The Government of Bangladesh (GoB) adopted the Seventh Five Year Plan (7FYP/SFYP 2016-
2020), accepted by the end of 2015, focuses on raising rural income and generating
employment opportunities for rural people by developing the crop sub-sector. The 7FYP aims to
diversify climate resilient agricultural production with increased commercialization and income
improvement through technological innovations and usage, and connecting the farming
community with markets, both nationally and internationally (FAO, 2016).
The Government of Bangladesh (GoB) is directly assisting farmers by enhancing the use of
inputs, increasing credit facilities and guaranteeing support prices through public procurement.
The government is helping by increasing fertilizer's subsidies, increasing credit provision to
smallholder farmers, continual price stabilization, and domestic procurement, promoting food
and agricultural diversification, etc. (FAO, 2016). This might have a positive impact on the price
of paddy which will make the price cheaper for the millers.
Although the Government of Bangladesh (GOB) is providing subsidies for various inputs such as
seed and fertilizer (20 kg of urea, 10 kg of Di-Ammonium Phosphate, and 10 kg of Muriate of
Potash) to incentivize farmers to grow more Aus rice, many farmers prefer to grow jute because
of higher profit margins (Lagos & Hossain, 2016). This might lower the amount of paddy
supplied to the millers.
During the natural calamity, like flood, the paddy prices rise, making it expensive for the millers
which again increase the price of the rice. Thus, it has a negative impact on millers as well as
on the consumers. In times of the flood in 2016, the Ministry of Agriculture reported 0.75
million hectares (HA) of waterlogged cropland and damaged cropland of 1.6 million hectares
(HA). Later in the season, the Aman rice crop has been recovered through replanting, but the
Aus rice affected by flooding has been destroyed. The government of Bangladesh supported
farmers by spending BDT 421 million ($5.32 million) in an agriculture rehabilitation and
incentive program for the Kharif-2 (autumn) and Robi (winter) season. The government
distributed rice seed, rice seedlings, and fertilizer to 0.75 million lower-income farmers in order
to make up for lost crop and to boost production (Hossain & K.Singh, 2016). This incentive from
the government is very much needed as shortage of paddy will cause a rise in the price of the
paddy.
Additionally, the imposing tariff on imported rice also supports the millers of Bangladesh. The
tariff has been raised and other taxes have been added to stop cheaper Indian rice imports that
generally constitute the largest share of the import market. The GOB imposed a 20 percent
import tariff, on December 8 (2015), on husked (brown) rice, fortified rice kernels, and other

15
Department of Research | Emerging Credit Rating Limited
semi-milled or wholly milled rice to prevent less expensive imports from competing with
domestic rice (Lagos & Hossain, 2016).
As of June 2, 2016, the tariffs have been increased by GOB amounting from 10 to 25 percent
and 10 percent regulatory duty on rice imports has been removed. The GOB also imposed a
value added tax (VAT) of 15-percent in addition to an advance income tax (AIT) of five percent,
and an additional advanced trade VAT (ATV) of four percent. Rice imports have been lowered to
0.22 MMT for the marketing year (MY) 2015/16 based on the latest customs data (Hossain &
K.Singh, 2016). On its annual budget for FY 2016/17, GOB imposed 25 percent import tariffs on
husked (brown) rice, fortified ice kernels, and other semi-milled or wholly milled rice to protect
domestic rice producers. Slowed imports likely will result in lower ending stocks (Hossain,
Bangladesh: Grain and Feed Annual, 2017).

16
Department of Research | Emerging Credit Rating Limited
10. Economic analysis:
The dataset used for this analysis has been collected from the primary survey of Emerging
Credit Rating Ltd. This survey was conducted by the rating department for the purpose of rating
in the fiscal year 2016. This study has taken the best 50 samples from the total of 76 rice mills
which has been selected on the basis of available information. The samples have been collected
from five Divisions of Bangladesh which are- Chittagong, Dhaka, Khulna, Rajshahi, Rangpur
(Figure-5). However, all firms are locally owned and 84 percent of them are solely owned and
rest of them comprises partnership business and private limited company (Figure-6). The size of
the firms are divided into four categories such as Micro, Small, Medium and Large (Figure-7).
This classification has been made on the basis of the number of employees4. However, this
study has considered contingency table, summary statistics and Benefit Cost Ratio (BCR) to
analyze the Rice Mill Industry.
4The classifications has been made taking a range of 10 to 24 employees for Micro Firm, 25 to 99 employees for
Small Firm, 100 to 250 employees for Medium Firm and above 250 employees for Large Firm (BBS 2013).
2%22%
8%
52%
16%
Chittagong Dhaka Khulna Rajshahi Rangpur
84%
6%10%
Sole Ownership Partnership Private Ltd.
Micro38%
Small40%
Medium18%
Large4%
Figure 5: Distribution of Firms by Division Figure 6: Distribution of Firms by Types of the
Organization
Figure 7: Distribution of Firms by size of the organization

17
Department of Research | Emerging Credit Rating Limited
The contingency tables5 (Table 9 to 12) of the firms represent the relationship between total
cost, total revenue, total current asset, total fixed asset, total production, total capacity of
production, total insurance amount, total mortgage amount and total loan amount with the size
of the organizations, division, types of the organization and total capacity utilization of machines
which analyzes and compares the results for one variable with the result of another variable.
However, to generate the contingency table, this study has divided the values of total cost, total
revenue, total current asset, total fixed asset, total production, total capacity of production,
total insurance amount, total mortgage amount and total loan amount into four quartiles6.
Table 9 of the appendix provides a picture of organizations’ size (Micro, Small, Medium, Large)
by the total cost, total revenue, total current asset, total fixed asset, total production, total
capacity, total insurance, total mortgage and total loan. The table represents the positive
relationship with the firms' size and the different range of the particular variables7. As per the
range of different variables, except for the total fixed asset and total mortgage amount,
maximum micro firms are located in first and second quartile (Q1 and Q2) which is around 70
percent and rest of the firms are situated in third and fourth quartile (Q3 and Q4) Similarly,
small firms are located in every quartile of the variables but most of them are situated in first to
the third quartile except total insurance amount. On the other hand, around 70 percent of the
medium firms are falling in the third and fourth quarter where all large firms are situated in the
fourth quarter of the variables. So the table provides a clear picture of the positive relationship
between two variables suggesting that a change in the size of the firm, from micro to large,
leading to change in the position from lower quarter to upper quarter.
Table 10 shows the relationship between Divisions (Chittagong, Dhaka, Khulna, Rajshahi, and
Rangpur) and particular variables like assets, loans, production, capacity, revenues, cost, etc.
The table demonstrates that on average more than 65 percent firms in Dhaka Division and 55
percent firms in Rajshahi Division are located in third and fourth quartile. On the other hand, in
Rangpur Division more than 60 percent firms are situated in first two quartiles except for total
production, the total capacity of production and total insurance amount suggesting that the
capacity and production is high with low cost and loan even though insurance cost is high. But
in Khulna Division, firms are scattered in different quartiles. So it can be concluded from the
table that, maximum firms of the Dhaka and Rajshahi Divisions are belonging to the upper
quartile which signifies that the mills in these two Divisions have the highest range of costs,
revenues, production capacity, assets, and loans.
5 A contingency table (also known as a cross tabulation or two-way table) is a type of table in a matrix format that displays the (multivariate) frequency distribution of the variables. They provide a basic picture of the interrelation between two variables and can help find interactions between them. More specifically it shows how one variable differs based on another variable. 6 The first quartile considers as 0.25 quantile or 25 percentiles, second quartile are 0.5 quantile or 50 percentiles, third quartile is 0.75 quantile or 75 percentiles and finally, fourth quartile consider as 1 quantile or 100 percentiles. 7Variables are the total cost, total revenue, total current asset, total fixed asset, total production, the total capacity of production, total insurance amount, total mortgage amount and total loan amount.

18
Department of Research | Emerging Credit Rating Limited
Another contingency table (Table 11) of appendix provide a picture of organization’s types (Sole
Ownership, Partnership, and Private Ltd.) by particular variables. The table shows that
maximum firms are sole proprietorship business and the firms are scattered in every quartile
but a different scenario is noticeable for the partnership business and private limited
companies. The variables of the firms of the partnership business are located within the first
and third quartiles except for the total insurance amount. On the other hand, on average 80
percent of the private limited companies are staying firmly in third and fourth quartile.
However, more than 90 percent of the firms’ utilization of production capacity varies between
75 percent to 100 percent and they are situated in different quantiles of the variables (Table
12).
Table 7 provides summary statistics by size of the organization for the different variables of
interest. The total cost of the firms includes all types of fixed and variable cost of a rice mill.
The average yearly total cost of micro firms totaled Tk.122.52 million where small firms spend
Tk.342.15 million, medium firms Tk.667.56 million and large firms Tk.1317.22 million. However,
table-5 of the appendix represent the segregation summary statistics of total cost where the
cost of goods sold is the main cost of a rice mill which is more than 90 percent of total cost.
The average yearly cost of good sold among micro firms are Tk.118.28 million, small firms
spend Tk.316.85 million, medium firms Tk.628.26 million and large firms Tk.1257.54 million.
Second important cost is financial services (bank charges and transaction fees) where the
average yearly cost of micro firms are Tk.1.79 million, small firms spend Tk 9.40 million,
medium firms Tk.19.26 million and the large firms Tk.23.28 million. Moreover, the wages seems
to be another highest cost of the rice mill, where the lowest cost (Tk.1.31 million) belongs to
micro firms and the highest cost (Tk.11.89 million) belongs to medium firms. However, on
average micro firms earned yearly total revenue of Tk.128.38 million, small firms earned
Tk.380.15 million, medium firms earned Tk.722.73 million and large firms earned Tk.1357.37
million (Table 7). So the average yearly net profit of the micro firms totaled Tk.5.86 million
where small firms earned Tk.38 million and the large firm earned Tk.40.15 million but the
medium firms earned the highest amount of profit which is Tk.55.17 million (Table 13).
Table 7 also represents the summary statistics of total current and total fixed assets where the
total current and fixed assets are higher for the large firms (Tk.347.73 million and Tk.337.01
million) and lower for the micro firms (Tk.40.72 million and Tk.40.8 million). The similar trend
has also been seen in the case of total insurance value, total mortgage amount and total loan
amount. However, Table 14 of the appendix signifies that main fixed assets for all types of firms
are land and building, and then machine and vehicles. Another table of the appendix (Table 15)
explains the classified summary statistics of current assets, where closing inventories are the
main current assets and secondly A/C receivables. In addition, large firms also have the
average highest amount of loan with mortgage and insurance comparing to any size of the
organization. As the firms grow larger the revenue, assets, cost amount increases even though
the average number of years of business is comparatively low (Table 7).

19
Department of Research | Emerging Credit Rating Limited
Table 7: Summary Statistics
Variables
Micro Small Medium Large
Mean Std.
Dev. Mean
Std.
Dev. Mean
Std.
Dev. Mean
Std.
Dev.
Total Cost (Million,
Taka) 122.52 118.34 342.15 544.36 667.56 573.46 1317.22 897.35
Total Revenue
(Million, Taka) 128.38 123.16 380.15 635.34 722.73 628.90 1357.37 926.15
Total Current Asset
(Million, Taka) 40.72 43.53 151.85 261.49 293.21 287.54 347.73 120.49
Total Fixed Asset
(Million, Taka) 40.80 50.02 118.14 95.51 240.86 118.91 337.01 171.01
Total Years of
Business 16.21 10.22 12.85 8.22 18.56 13.27 9.00 7.07
Total Insurance
(Million, Taka) 14.04 16.45 24.13 14.14 62.07 40.28 147.52 75.68
Total Mortgage
(Million, Taka) 39.58 37.39 109.75 142.31 284.62 180.50 291.66 139.28
Total Loan (Million,
Taka) 25.95 38.27 77.80 109.66 212.26 210.82 247.17 110.67
Table 8 represents the Benefit Cost Ratio (BCR) by the size of the organization. The BCR is
higher for medium firms (Tk.1.09) and lower for the large firms (Tk.1.03). The average total
BCR is Tk.1.06 which means that on average a firm has received a return Tk.1.06 for every
Tk.1.00 investment. However, Table 16 of the appendix shows the BCR for individual firms.
Finally, it can be concluded that a firm can earn a profit by spending each taka.
Table 8: Benefit-Cost Ratio (BCR) by the Size of the Organization.
Micro Small Medium Large Total
1.06 1.06 1.09 1.03 1.06

20
Department of Research | Emerging Credit Rating Limited
11. Problems and Prospects:
11.1 Prospects:
Bangladesh is the world’s sixth largest producer of rice (CRI, 2014). The demand of rice is
inelastic in nature as it is the basic food grain of Bangladesh (Alam, 2010-2011). The demand
does not change significantly with price and low sales uncertainties as all rice products are
saleable:
o Stone-feed
o Rice-plain
o Bran-Oil
o Tush-Mill
o Broken Rice-poor people buys them and also used as feed
Moreover, auto rice mills are entitled to rice allotment or incentives from the government
(Bangladesh Grain and Feed Annual, 2013) and even banks provide financial support to the
mills through overdraft limit, working capital limit, etc (IFIC Bank & ICB, 2017). Demand for rice
increases with the population the income is fixed with low leverage risk. All these and other
factors make rice mill industry an area of possibilities and future investments. Other factors that
can enhance the possibilities for this industry include:8
Reducing middlemen’s cost: Removing intermediary or middlemen’s commission cost.
Low monitoring cost and low cost of labor: Machine intensive mills can reduce the cost
of labor mainly for husking mills.
Export permission: It could be an opportunity for the manufacturers as there are surplus
productions of rice.
A good relationship with the suppliers: This means that supply chain management is
flexible and strong.
Converting to auto rice mill: Automation of the production process to ensure market
survival and continuing credibility.
Climate: For auto rice mills, the climate factors are omitted in the rice processing.
Experience: The vast experience of the proprietor can create a strong presence in the
local area to maintain the fixed market share.
Labor advantage: Labor or technician availability according to area or location.
Good marketing strategy: Small packaging makes storage easier for consumers. So they
would buy in small quantities as storage is easy and buy again when needed.
8 Information gathered based on interviews with Financial Analysts of Emerging Credit Rating Limited and
rice mill owners during surveys. Moreover, analysis had been further conducted by the Research Department of Emerging Credit Rating Limited.

21
Department of Research | Emerging Credit Rating Limited
11.2 Problems:
Generally, there is always the threat of intense competition which might create a problem for
the small firms. Moreover, the difference in the mill types can be a problem. For instance, the
process of husking rice mills is lengthy and labor intensive. Even the drying process takes
longer time compared to the automated rice mills. Other factors which can raise a problem
include:9
Technology: Technology can be a threat as labor is reduced every time specialized
machinery are improved or developed.
By-products not produced by all mills: Husking mill does not have bran.
Government incentives and tax: There is a lack of incentives for the millers and tax rate
which could have helped boost this industry.
The price of paddy: Price volatility of paddy due to damage of crops, lower production of
rice, import impact, etc.
Environmental hazard: ‘Tush' in the air creates breathing problem for people in that
area. For instance, a similar case happened in Dinajpur. ‘Environment Clearance
Certificate' is required for production.
Syndicate: Political syndicate influencing distributional cost
Climate issue: When there is flood it might destroy the paddy which is a risk for the rice
millers as it might raise the price of the paddy.
Management and maintenance problem: There might be management issue if the goal
of the managers is not aligned with the firm's goals. Moreover, there can also be a
maintenance issue if the technician is not skilled or trained to operate the machines.
Farmers switching to other grains: Farmers switching to more profitable crops like
maize, potato, jute, pulses and oilseeds might increase the price for paddy.
The rice mill owners have been interviewed and they informed that their frequency of load
shedding is quite a lot and there are also shortages of labor supply which have a negative
impact on the production. Selling in due is another problem of marketing and distribution.
Besides, setting price floor and ceiling by the government while purchasing paddy from the
farmers and selling rice to the wholesalers and distributors, with deposit 4000-5000 tons of rice
per year to the government warehouse will reduce the revenue generated from sales.
Furthermore, the recent damage in the Haor region is creating negative vibes among the rice
manufacturers. The rice manufacturers are skeptical about the price of paddy which they fear
will rise in the future due to the current loss of paddy in Haor.
9 Information gathered based on interviews with Financial Analysts of Emerging Credit Rating Limited and
rice mill owners during surveys. Moreover, analysis had been further conducted by the Research Department of Emerging Credit Rating Limited.

22
Department of Research | Emerging Credit Rating Limited
12. Conclusion:
The demand for rice will always be there. As demand grows, the need to boost the production
and milling process also grows. Increased business efficiency and productivity can be traced to
the automation of the processes. As per the analysis of this study it is evident that the revenue,
cost, assets, loans and production capacity will increase with firm size and types of
organization. These factors will vary in Division wise though maximum range has been seen in
Dhaka and Rajshahi division. According to the data, small and medium firms have more cash in
hand and bank compared to micro and large firms on average. The net profit on average is
highest for medium firms. Even the average wages are higher for small and medium firms
suggesting that they are mostly husking mills. Although, this analysis is based on primary
survey of 50 samples with disproportionate number of each firm type, it can give an insight of
the revenue, cost, assets, loans and production capacity of different rice mills.
However, in comparison to traditional mills modern mills are efficient and less time consuming
though modern mills consume more energy. Different machineries of different brands for
different stages of rice processing are available. The modern machineries are able to produce
twice the output than traditional ones. Even the wage cost is lower in automated mills as the
rice manufacturing process is full machine based.
Even if the analysis suggest that the rice manufacturing is having a profit margin, while setting
up a rice mill, it is very important to be aware of the seasonal impact and impact of other issues
as well including tariffs, policies, and so on which might create challenges in the production
process. There are pros and cons to be considered before taking any rational decisions. The
government can play an important role in this agricultural sector by supporting the farmers and
millers to face and overcome these challenges.
Unfortunately, the recent flash flood, rainfall, disease attacks on standing paddy and depleting
stocks are creating a challenging situation for the agricultural sector. The damage of Boro
paddy caused by the flood in the haor region in the northeast and recent rainfalls came as a
blow to the market. There is a shortage of paddy which might increase the price thus affecting
the poor people (Parvez, 2017). The government needs to take initiative to help and support
the farmers and the local millers to cope with the situation and stabilize the market.

23
Department of Research | Emerging Credit Rating Limited
References
Alam, M. A. ( 2010-2011). An Analysis of Consumption Demand Elasticity and Supply Response
of Major Foodgrains in Bangladesh. The joint International Master in Rural Development
(IMRD).
BARC. (2011). Research Priorities in Bangladesh Agriculture. Dhaka: Project Implementation
Unit (PIU-BARC), Bangladesh Agricultural Research Council.
CBECL. (2012, September). China Bangla Engineers & Consultants Ltd. Retrieved from
http://www.cbecl.info/2012/09/auto-rice-mill-machines.html
CRI. (2014, December 09 December, 2014). Centre for Research and Information-CRI.
Retrieved from http://cri.org.bd/2014/12/09/bangladesh-towards-sustainable-food-security/
CRISIL Research. (2016). Industry Risk Score-Punjab National Bank. CRISIL Limited .
FAO. (2016). COUNTRY FACT SHEET ON FOOD AND AGRICULTURE POLICY TRENDS: Socio-
economic context and role of agriculture. Food and Agriculture Policy Decision Analysis. Food
and Agriculture Organization of the United Nations.
Hossain, T. (2017). Bangladesh: Grain and Feed Annual.
Hossain, T., & K.Singh, S. (2016). Bangladesh Grain and Feed Update. Global Agricultural
Information Network-USDA Foreign Agricultural Service.
IFIC Bank & ICB. (2017). RIGHTS SHARE OFFER DOCUMENT. IFIC Bank Limited.
Islam, M. K. (2014, December 20). Rice Milling in Bangladesh: Staging Spectacular Rise.
Monthly Business Reveiw , pp. 2-8.
Lagos, J. E., & Hossain, T. (2016). Bangladesh Grain and Feed Annual. Global Agricultural
Information Network-USDA Foreign Agricultural Service.
Parvez, S. (2017). Fresh spike in rice prices.
Rice Knowledge Bank. (2017, May 14). Rice Knowledge Bank. Retrieved from
http://www.knowledgebank.irri.org/index.php?option=com_zoo&view=item&layout=item&Itemi
d=1030
Rice Outlook. (2015). Retrieved March 29, 2017, from www.riceoutlook.com:
www.riceoutlook.com/milled-rice-production-reached-record-high-in-bangladesh-in-2014-15/
The Daily Star. (2011, October 13). Retrieved 02 29, 2017, from http://www.thedailystar.net:
http://www.thedailystar.net/news-detail-206220

24
Department of Research | Emerging Credit Rating Limited
The Daily Star. (2015, March 08). Retrieved 03 29, 2017, from http://www.thedailystar.net:
http://www.thedailystar.net/big-firms-to-go-for-rice-milling-61085
The University of Arkansas. (2017). About Us: The University of Arkansas. Retrieved from
http://www.uark.edu/ua/ricersch/pdfs/per_capita_rice_consumption_of_selected_countries.pdf
Zaman, Z. -U., Mishima, T., Hisano, S., & Gergely, M. C. (2001). The Role of Rice Processing
Industries in Bangladesh : A Case Study of the Sherpur District. The Review of Agricultural
Economics, Hokkaido University , 57 (2001), 121-133.

25
Department of Research | Emerging Credit Rating Limited
Appendix:
Micro Small Medium Large Micro Small Medium Large Micro Small Medium Large
<=72 (Q1)8
(42.11%)
5
(25.00%)- - <=76 (Q1)
8
(42.11%)
4
(20.00%)- - <=30 (Q1)
10
(52.36%)
3
(15.00%)- -
73-190 (Q2)7
(36.84%)
4
(20.00%)
1
(11.11%)- 76-200 (Q2)
7
(36.84%)
5
(25.00%)
1
(11.11%)- 31-55 (Q2)
6
(31.58%)
5
(25.00%)
2
(22.22%)-
191-410 (Q3)3
(15.79%)
7
(35.00%)
3
(33.33%)- 201-425 (Q3)
3
(15.79%)
7
(35.00%)
3
(33.33%)- 56-150 (Q3)
2
(10.53%)
8
(40.00%)
2
(22.22%)-
>=411 (Q4)1
(5.26%)
4
(20.00%)
5
(55.56%)
2
(100%)>=426 (Q4)
1
(5.26%)
4
(20.00%)
5
(55.56%)
2
(100%)>=151 (Q4)
1
(5.26%)
4
(20.00%)
5
(55.56%)
2
(100%)
<=30 (Q1)11
(57.89%)
2
(10.00%)- - <=8000 (Q1)
7
(36.84%)
4
(20.00%)- - <=12000 (Q1)
7
(36.84%)
7
(35.00%)- -
30-75 (Q2)4
(21.05%)
7
(35.00%)
1
(11.11%)- 8001-15000 (Q2)
6
(31.58%)
5
(25.00%)
1
(11.11%)- 12001-23000 (Q2)
4
(21.05%)
3
(15.00%)
1
(11.11%)-
76-191 (Q3)4
(21.05%)
7
(35.00%)
2
(22.22%)- 15001-33000 (Q3)
1
(5.26%)
7
(35.00%)
2
(22.22%)- 23001-60500 (Q3)
2
(10.53%)
7
(35.00%)
1
(11.11%)-
>=192 (Q4) -4
(20.00%)
6
(66.67%)
2
(100%)>=33001 (Q4)
5
(26.32%)
4
(20.00%)
6
(66.67%)
2
(100%)>=60501 (Q4)
6
(31.58%)
3
(15.00%)
7
(77.78%)
2
(100%)
<=7 (Q1)8
(42.11%)
1
(5.00%)- - <=21 (Q1)
8
(42.11%)
4
(20.00%)- - <=11 (Q1)
6
(31.58%)
5
(25.00%)- -
8-17 (Q2)3
(15.79%)
2
(10.00%)
1
(11.11%)- 22-80 (Q2)
7
(36.84%)
5
(25.00%)- - 12-33 (Q2)
9
(47.37%)
2
(10.00%)
2
(22.22%)-
18-45 (Q3)2
(10.53%)
5
(25.00%)
1
(11.11%)- 81-135 (Q3)
4
(21.05%)
6
(30.00%)
2
(22.22%)- 34-85 (Q3)
2
(10.53%)
8
(40.00%)
2
(22.22%)-
>=46 (Q4)6
(31.58%)
12
(60.00%)
7
(77.78%)
2
(100%)>=136 (Q4) -
5
(25.00%)
7
(77.78%)
2
(100%)>= 86 (Q4)
2
(10.53%)
5
(25.00%)
5
(55.56%)
2
(100%)
Total Fixed
Asset
(Million)
Total
Production
(MT)
Total Capacity
(MT)
Total
Insurance
(Million)
Total
Mortgage
(Million)
Total Loan
(Million)
Particular Range Size of the Organization
Total Cost
(Million)
Total
Revenue
(Million)
Total Current
Asset (Million)
Particular Range Size of the Organization
Particular Range Size of the Organization
Table 9: Size of the Organization by Total Cost, Total Revenue, Total Current Asset, Total Fixed Asset, Total Production, Total Capacity, Total Insurance, Total Mortgage, Total Loan.

26
Department of Research | Emerging Credit Rating Limited
Chittagong Dhaka Khulna Rajshahi Rangpur Chittagong Dhaka Khulna Rajshahi Rangpur Chittagong Dhaka Khulna Rajshahi Rangpur
<=72 -3
(27.27%)-
8
(30.77%)
2
(25.00%)<=76 -
2
(18.18%)-
8
(30.77%)
2
(25.00%)<=30 -
2
(18.18%)
1
(25.00%)
8
(30.77%)
2
(25.00%)
73-1901
(100%)
1
(9.09%)
2
(50.00%)
4
(15.38%)
4
(50.00%)76-200
1
(100%)
2
(18.18%)
2
(50.00%)
4
(15.38%)
4
(50.00%)31-55
1
(100%)
2
(18.18%)
2
(50.00%)
5
(19.23%)
3
(37.50%)
191-410 -3
(27.27%)
1
(25.00%)
7
(26.92%)
2
(25.00%)201-425 -
3
(27.27%)
1
(25.00%)
7
(26.92%)
2
(25.00%)56-150 -
5
(45.45%)-
6
(23.08%)
1
(12.50%)
>=411 -4
(36.36%)
1
(25.00%)
7
(26.92%)- >=426 -
4
(36.36%)
1
(25.00%)
7
(26.92%)- >=151 -
2
(18.18%)
1
(25.00%)
7
(26.92%)
2
(25.00%)
<=30 - -2
(50.00%)
8
(30.77%)
3
(37.50%)<=8000
1
(100%)-
1
(25.00%)
7
(26.92%)
2
(25.00%)<=12000 -
3
(27.27%)
2
(50.00%)
7
(26.92%)
2
(25.00%)
30-751
(100%)
4
(36.36%)
1
(25.00%)
3
(11.54%)
3
(37.50%)8001-15000 -
4
(36.36%)
2
(50.00%)
5
(19.23%)
1
(12.50%)12001-23000 -
2
(18.18%)-
4
(15.38%)
2
(25.00%)
76-191 -4
(36.36%)-
7
(26.92%)
2
(25.00%)15001-33000 -
4
(36.36%)-
4
(15.38%)
2
(25.00%)23001-60500 -
2
(18.18%)-
6
(23.08%)
2
(25.00%)
>=192 -3
(27.27%)
1
(25.00%)
8
(30.77%)- >=33001 -
3
(27.27%)
1
(25.00%)
10
(38.46%)
3
(37.50%)>=60501
1
(100%)
4
(36.36%)
2
(50.00%)
9
(34.62%)
2
(25.00%)
<=7 - - -8
(30.77%)
1
(12.50%)<=21
1
(100%)
2
(18.18%)-
8
(30.77%)
1
(12.50%)<=11 -
2
(18.18%)-
7
(26.92%)
2
(25.00%)
8 - 171
(100%)
1
(9.09%)
3
(75.00%)
1
(3.85%)- 22 - 80 -
2
(18.18%)
3
(75.00%)
3
(11.54%)
4
(50.00%)12 - 33 -
1
(9.09%)
3
(75.00%)
6
(23.08%)
3
(37.50%)
18 - 45 -2
(18.18%)
1
(25.00%)
2
(7.69%)
3
(37.50%)81 - 135 -
4
(36.36%)-
7
(26.92%)
1
(12.50%)34 - 85 -
5
(45.45%)-
6
(23.08%)
1
(12.50%)
>=46 -8
(72.73%)-
15
(57.69%)
4
(50.00%)>=136 -
3
(27.27%)
1
(25.00%)
8
(30.77%)
2
(25.00%)>= 86
1
(100%)
3
(27.27%)
1
(25.00%)
7
(26.92%)
2
(25.00%)
Total Fixed
Asset (Million)
Total Production
(MT)
Total Capacity
(MT)
Total Insurance
(Million)
Total Mortgage
(Million)
Total Loan
(Million)
Particular Range Division
Total Cost
(Million)
Total Revenue
(Million)
Total Current
Asset (Million)
Particular Range Division
Particular Range Division
Table 10: Division by Total Cost, Total Revenue, Total Current Asset, Total Fixed Asset, Total Production, Total Capacity, Total Insurance, Total Mortgage, Total Loan.

27
Department of Research | Emerging Credit Rating Limited
Sole
OwnershipPartnership
Private
Ltd.
Sole
OwnershipPartnership
Private
Ltd.
Sole
OwnershipPartnership
Private
Ltd.
<=7211
(26.19%)
1
(33.33%)
1
(20.00%)<=76
11
(26.19%) -
1
(20.00%)<=30
12
(28.57%)
1
(33.33%)-
73-19011
(26.19%)
1
(33.33%)- 76-200
11
(26.19%)
2
(66.67%)- 31-55
10
(23.81%)
1
(33.33%)
2
(40.00%)
191-41010
(23.81%)
1
(33.33%)
2
(40.00%)201-425
10
(23.81%)
1
(33.33%)
2
(40.00%)56-150
10
(23.81%)
1
(33.33)
1
(20.00%)
>=41110
(23.81%)-
2
(40.00%)>=426
10
(23.81%)-
2
(40.00%)>=151
10
(23.81%)-
2
(40.00%)
<=3013
(30.95%)- - <=8000
10
(23.81%)
1
(33.33%)- <=12000
13
(30.95%)
1
(33.33%)-
30-759
(21.43%)
1
(33.33%)
2
(40.00%)8001-15000
10
(23.81%)
1
(33.33%)
1
(20.00%)12001-23000
6
(14.29%)
1
(33.33%)
1
(20.00%)
76-19110
(23.81%)
2
(66.67%)
1
(20.00%)15001-33000
8
(19.05%)
1
(33.33%)
1
(20.00%)23001-60500
7
(16.67%)
1
(33.33%)
2
(40.00%)
>=19210
(23.81%)-
2
(40.00%)>=33001
14
(33.33%)-
3
(60.00%)>=60501
16
(38.10%)-
2
(40.00%)
<=78
(19.05%)
1
(33.33%)- <=21
10
(23.81%)
2
(66.67%)- <=11
11
(26.29%)- -
8 - 17 6
(14.29%)- - 22 - 80
11
(26.19%)-
1
(20.00%)12 - 33
12
(28.57%)
1
(33.33%)-
18 - 45 5
(11.90%)-
3
(60.00%)81 - 135
9
(21.43%)
1
(33.33%)
2
(40.00%)34 - 85
7
(16.67%)
2
(66.67%)
3
(60.00%)
>=46 23
(54.76%)
2
(66.67%)
2
(40.00%)>=136
12
(28.57%)-
2
(40.00%)>= 86
12
(28.57%)-
2
(40.00%)
Total Fixed
Asset (Million)
Total Production
(MT)
Total Capacity
(Million)
Total Insurance
(Million)
Total Mortgage
(Million)
Total Loan
(Million)
Particular Range
Types of the Organization
Total Cost
(Million)
Total Revenue
(Million)
Total Current
Asset (Million)
Particular Range
Types of the Organization
Particular Range
Types of the Organization
Table 11: Types of the Organization by Total Cost, Total Revenue, Total Current Asset, Total Fixed Asset, Total Production, Total Capacity, Total Insurance, Total Mortgage, Total Loan.
28
Department of Research | Emerging Credit Rating Limited
50% to
75%
75% to
100%
50% to
75%
75% to
100%
50% to
75%
75% to
100%
<=72 -12
(27.27%)<=76 -
11
(25.00%)<=30 -
12
(27.27%)
73-1902
(66.67%)
8
(18.18%)76-200
2
(66.67%)
9
(20.45%)31-55
2
(66.67%)
10
(22.73%)
191-4101
(33.33%)
12
(27.27%)201-425
1
(33.33%)
12
(27.27%)56-150
1
(33.33%)
10
(22.73%)
>=411 -12
(27.27%)>=426 -
12
(27.27%)>=151 -
12
(27.27%)
<=30 -12
(27.27%)<=8000 -
11
(25.00%)<=12000
1
(33.33%)
13
(29.79%)
30-752
(66.67%)
10
(22.73%)8001-15000
3
(100%)
9
(20.45%)12001-23000
2
(66.67%)
6
(13.64%)
76-1911
(33.33%)
10
(22.73%)15001-33000 -
10
(22.73%)23001-60500 -
10
(22.73%)
>=192 -12
(27.27%)>=33001 -
14
(31.82%)>=60501 -
15
(34.09%)
<=7 1
(33.33%)
7
(15.91%)<=21
1
(33.33%)
10
(22.73%)<=11 -
11
(25.00%)
8 - 17 1
(33.33%)
5
(11.36%)22 - 80
1
(33.33%)
11
(25.00%)12 - 33
2
(66.67%)
9
(20.45%)
18 - 45 -8
(18.18%)81 - 135
1
(33.33%)
10
(22.73%)34 - 85
1
(33.33%)
11
(25.00%)
>=461
(33.33%)
24
(54.55%)>=136 -
13
(29.55%)>= 86 -
13
(29.55%)
Total Fixed
Asset (Million)
Total Production
(MT)
Total Capacity
(Million)
Total Insurance
(Million)
Total Mortgage
(Million)
Total Loan
(Million)
Particular Range
Capacity Utilization
Total Cost
(Million)
Total Revenue
(Million)
Total Current
Asset (Million)
Particular Range
Capacity Utilization
Particular Range
Capacity Utilization
Table 12: Capacity Utilization by Total Cost, Total Revenue, Total Current Asset, Total Fixed Asset, Total Production, Total Capacity, Total Insurance, Total Mortgage, Total Loan.

29
Department of Research | Emerging Credit Rating Limited
Table 13: Net Profit by Size of the Organization.
Mean Std. Dev. Mean Std. Dev. Mean Std. Dev. Mean Std. Dev.
Total Cost of Goods Sold 118.28 115.22 316.85 474.22 628.26 545.64 1257.54 841.46
Total expenditures on wages in the last 12 months 1.31 2.10 7.84 23.42 11.89 18.35 5.23 5.06
Professional and business fees 0.04 0.09 0.02 0.01 0.04 0.00 0.01 -
Utilities 0.04 0.03 0.06 0.07 2.21 4.98 0.46 0.59
Office and computer related expenses 0.06 0.07 0.09 0.07 0.13 0.11 7.63 10.60
Telephone, Internet and other telecommunication 0.04 0.02 0.05 0.01 0.08 0.03 0.18 0.19
Business taxes, licenses and permits 0.02 0.02 12.20 37.31 9.51 13.28 - -
Rental and leasing 0.20 0.14 0.04 0.01 0.07 0.07 0.47 0.60
Repair and maintenance 0.11 0.08 0.17 0.13 0.13 0.05 0.56 0.65
Amortization and depreciation 1.76 1.57 4.09 4.87 5.74 9.85 19.30 16.85
Insurance 0.06 0.06 0.11 0.08 0.25 0.29 0.76 0.91
Advertising, marketing, promotion, meals and entertainment 0.07 0.09 0.21 0.29 0.12 0.12 0.93 -
Travel, meetings and conventions 0.08 0.07 0.11 0.08 0.16 0.08 0.55 0.38
Financial services 1.79 2.22 9.40 26.12 19.26 27.48 23.28 18.42
Interest expense 2.30 - 0.54 0.70 - - - -
Other non-production-related costs and expenses 0.49 0.93 0.11 0.07 0.15 - 0.24 0.19
All other cost and expenses 0.37 0.46 2.89 6.93 3.96 6.08 1.14 -
Total Expenses 122.52 118.34 342.15 544.36 667.56 573.46 1317.22 897.35
Total Revenue 128.38 123.16 380.15 635.34 722.73 628.90 1357.37 926.15
Net Profit 5.86 4.82 38.00 90.98 55.17 55.44 40.15 28.80
In Million BDT
VariablesMicro Small Medium Large

30
Department of Research | Emerging Credit Rating Limited
Table 14: Breakdown of the Fixed Assets by Size of the Organization.
In Million BDT
Fixed Assets Micro Firm Small Firm Medium Firm Large Firm
Mean SD Mean SD Mean SD Mean SD
Land and Building 39.01 47.42 103.73 69.98 198.50 68.47 191.26 29.92
Machine and Vehicles 5.05 7.68 25.40 38.32 96.84 110.83 137.24 130.67
Office Equipment 0.54 0.48 - - - - - -
Electric Goods and Fittings - - 4.02 5.10 0.39 0.27 - -
Others Fixed Assets 0.63 0.69 4.82 14.12 0.41 0.23 0.87 -
Total Fixed Assets 40.80 50.02 118.14 95.51 240.86 118.91 337.01 171.01
Table 15: Breakdown of the Current Assets by Size of the Organization.
In Million BDT
Current Assets Micro Firm Small Firm Medium Firm Large Firm
Mean SD Mean SD Mean SD Mean SD
Inventories/ Stock ( Closing) 31.03 37.22 86.81 120.70 198.38 171.33 285.50 177.68
Cash in Hand 0.91 1.19 5.65 11.58 3.63 6.39 0.83 0.47
Cash at Bank 0.65 0.86 16.87 56.99 3.55 7.53 0.37 0.22
A/C Receivables 7.72 9.50 39.96 68.24 67.74 97.55 59.73 56.35
Advance, Deposit, and Repayments 1.22 0.86 9.58 20.67 41.15 92.13 1.30 0.59
Total Current Assets 40.72 43.53 151.85 261.49 293.21 287.54 347.73 120.49

31
Department of Research | Emerging Credit Rating Limited
Table 16: Benefit-Cost Ratio of the Individual Organization.
No. Size of the Organization Benefit Cost Ratio (BCR)
1 Micro 1.05
2 Micro 1.03
3 Micro 1.05
4 Micro 1.04
5 Micro 1.05
6 Micro 1.02
7 Micro 1.06
8 Micro 1.06
9 Micro 1.07
10 Micro 1.16
11 Micro 1.11
12 Micro 1.07
13 Micro 1.10
14 Micro 1.05
15 Micro 1.03
16 Micro 1.05
17 Micro 1.03
18 Micro 1.08
19 Micro 1.03
Average Micro 1.06
20 Small 1.11
21 Small 1.03
22 Small 1.07
23 Small 1.05
24 Small 1.05
25 Small 1.08
26 Small 1.06
27 Small 1.16
28 Small 1.04
29 Small 1.03
30 Small 1.07
31 Small 1.03
32 Small 1.28
33 Small 1.04
34 Small 1.03
35 Small 1.07
36 Small 0.74
37 Small 1.17
38 Small 1.06
39 Small 1.05
Average Small 1.06
40 Medium 1.22
41 Medium 1.13
42 Medium 1.11
43 Medium 1.05
44 Medium 1.07
45 Medium 1.06
46 Medium 1.02
47 Medium 1.04
48 Medium 1.09
Average Medium 1.09
49 Large 1.03
50 Large 1.03
Average Large 1.03
Total Average 1.06

About ECRL Emerging Credit Rating Limited (hereinafter referred to as ECRL) began its journey in the year
2009 with the motive to deliver credible superior & quality credit rating opinion in various
industry segments around Bangladesh. ECRL obtained credit rating license from Bangladesh
Securities and Exchange Commission (BSEC) in June 2010 as per Credit Rating Companies Rules
1996 and also received Bangladesh Bank Recognition as an External Credit Assessment
Institutions (ECAI) in October 2010.
Emerging Credit Rating Limited's team is oriented towards the continuous improvement of
processes, striving for an important role in the leadership of the business world. Every individual
in ECRL is committed to providing topmost ingenious Credit Rating Services and Comprehensive
Research Services in Bangladesh. ECRL's rating services and solutions reflect independence,
professional, transparency and impartial opinions, which assist businesses in enhancing the
quality of their decisions and helping issuers access a broader investor base and even smaller
known companies approach the money and capital markets. The Credit Rating process is an
informed, well-researched and intended opinion of rating agencies on the creditworthiness of
issuers or issues in terms of their/ its ability and willingness of discharging its financial
obligations in a timely manner. Issuers, lenders, fixed-income investors use these risk
assessments for the purpose of lending to or investment in a corporation (such as a financial
institution, an insurance company, a non-banking corporation or a corporate entity) as well as
evaluating the risk of default of an organization's financial obligations in terms of loan or debt.
Editorial
Overview
ECRL Research provides
insights, opinions and
analysis on Bangladesh and
International Economies.
ECRL Research conducts
surveys and produces
working papers and reports
on Bangladesh's different
socio-economic issues,
industries, and capital
market. It also provides
training programs to
professionals from financial
and economic sectors on a
wide array of technical
issues.
Dr. Jamaluddin Ahmed
FCA, PhD
Chairman
NKA Mobin
FCA, FCS, CFC
MD and CEO
Arifur Rahman
FCCA
Chief Rating Officer
Al Mamun Senior Research Associate
Email: [email protected]
A.B.M. Qudrot-E-Khuda JR. Research Associate
Email: [email protected]
Nabihatul Afrooz
Research Associate
Email: [email protected]
Subrata Howlader Research Associate
Email: [email protected]
Emerging Credit Rating Ltd. Shams Rangs, House 104, Park Road
Level-A1, A2 & A5
Baridhara, Dhaka-1212
Tel: +880 2 986 0911, +880 2 986 0897
Fax: +880 2 986 0828
Email: [email protected]
Web: www.emergingrating.com
Research Team