Embed Size (px)
Citation preview

United StatesDepartment ofAgriculture
StatisticalReportingService
StatisticalResearchDivision
SRS Staff ReportNumber AGES 831025
Rice Objective Yield198.2 UpdateRoberta B. Pense

ABSTRACT
RICE OBJECTIVE YIELD: 1982 UPDATE. By Roberta B. Pense;Statistical Research Division, Statistical Reporting Service, U.S.Department of Agriculture; October 1983. SRS Staff Report No.AGES831025.
This study is a follow-up of the 1981 research study in Arkansas. Thepurposes of this research were to develop objective procedures toestimate rice yield, and to investigate procedures which use multipleregression models to forecast yield early in the season. Based on 1981and 1982 results in Arkansas, it is possible to estimate yield at harvest.Some potential data collection biases have been identified, but noquantitative measures of bias were made. Several methods of adjustingthe estimates for this bias are outlined, although no methods arerecommended. It is possible to forecast heads per acre at maturityusing early-season counts of stalks or heads. Early-season forecastingequations for weight of grain per head at maturity need more work.
********************************************************* ** This paper was prepared for limited distribution to the research ** community outside the U.S. Department of Agriculture. The views ** expressed herein are not necessarily those of SRS or USDA. ** *********************************************************
ACKNOWLEDGMENTS The author wishes to thank Don Von Steen, Stan Hoge, and the officepersonnel and enumerator staff in the Arkansas State Statistical Officefor their comments and suggestions as well as their data collectionefforts. Thanks are also extended to the members of Data CollectionBranch and Systems Branch who supported this study.
i

CONTENTS INTRODUCTION 1
DATA COLLECTION 1
ASSUMPTIONS 3
AT HARVEST ESTIMATION 5
Yield 5
Acreage Estimates and Production Estimates 9
Handling Effect 9
Plot Location Effect 11
FORECASTING MODELS 11
Heads per Acre 11
Weight per Head 14
SUMMAR Y AND RECOMMENDATIONS 16
REFERENCES 17
APPENDIX I (Forms) 18
APPENDIX II (Maturity Code Descriptions) 27
ii

INTRODUCTION
DATA COLLECTION
RICE OBJECIVE YIELD: 1982 UPDATERoberta B. Pense
The Yield Assessment Section of the Statistical Reporting Service isdeveloping rice objective yield procedures to be used operationally in1984 in the five major rice producing states. These states are:Arkansas, California, Louisiana, Mississippi, and Texas. Work began in1980 with a feasibility study involving nine nonrandomly selected fieldsin Arkansas (2). In 1981, a sample of 130 randomly selected fields inArkansas was chosen. This sample provided at-harvest estimates ofharvested acreage, yield per acre, and production at the state level.Data were also collected for developing regression models to forecastyield (4). This work continued in Arkansas in 1982 with a sample of 100randomly selected fields. The objectives in 1982 were basically thesame as in the 1981 study. Specifically, the objecti ves were to:
1. investigate procedures to estimate rice yield at harvest. In1982 this included looking at the effects on plant growth ofrepeated visits to the field, and the effects of unit locationon yield. It also included examining methods of adjustingyield estimates to account for data collection biases, andevaluating alternative ways to estimate harvest loss,
2. develop regression models to forecast two components ofyield -- number of heads per acre, and weight of threshedgrain per head at maturity, and
3. elicit comments and suggestions for improvements in datacollection procedures from enumerators and state officepersonnel.
This paper describes changes in data collection procedures andsummarizes analysis that was done in 1982. More detail on datacollection procedures, previous analysis, and historical background iscontained in the SRS staff report" 1981 Rice Objective Yield Study"(4).
A sample of 100 fields was drawn using the current objective yieldsampling scheme (probability proportional to size based on expandedJune Enumerative SlJrvey acres planted, or to be planted, to rice). Thissample size was adequate to estimate net yield per acre with acoefficient of variation (CV) of less than 5%, based on 1981 varianceestimates. Enumerators made field observations on the even-numberedsamples at monthly intervals beginning in August as well asimmediately before and after harvest. Odd-numbered fields were onlyvisited just before harvest.
1

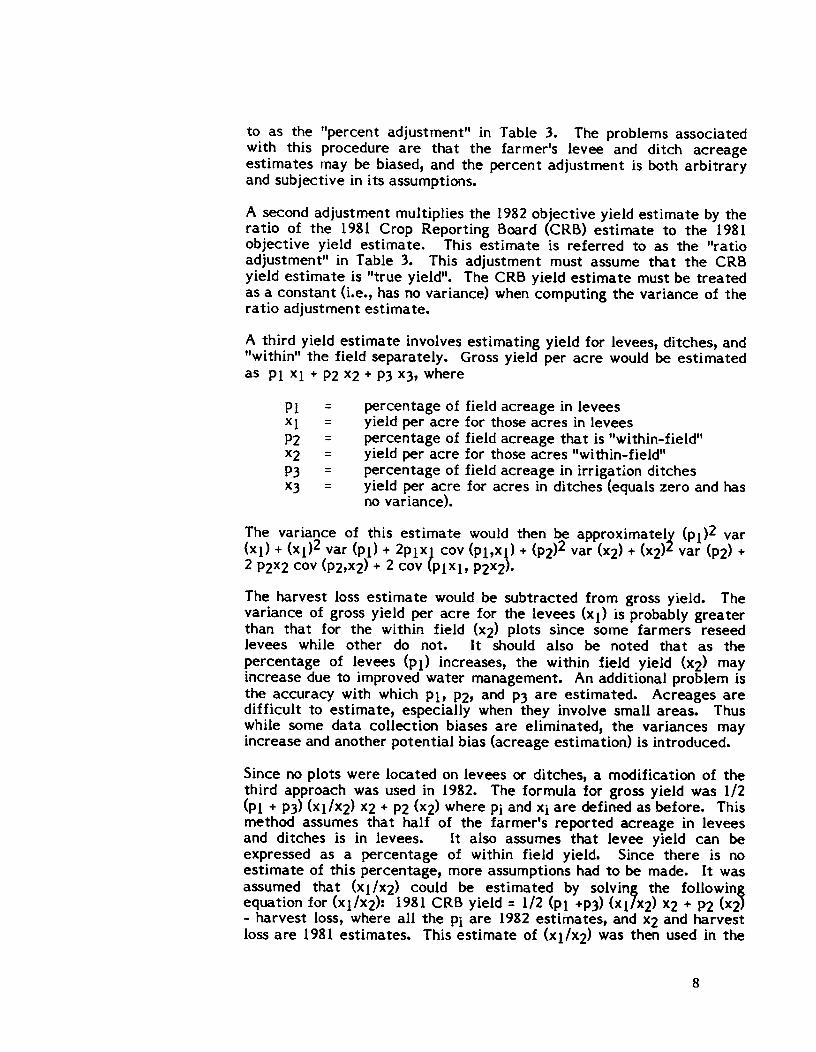
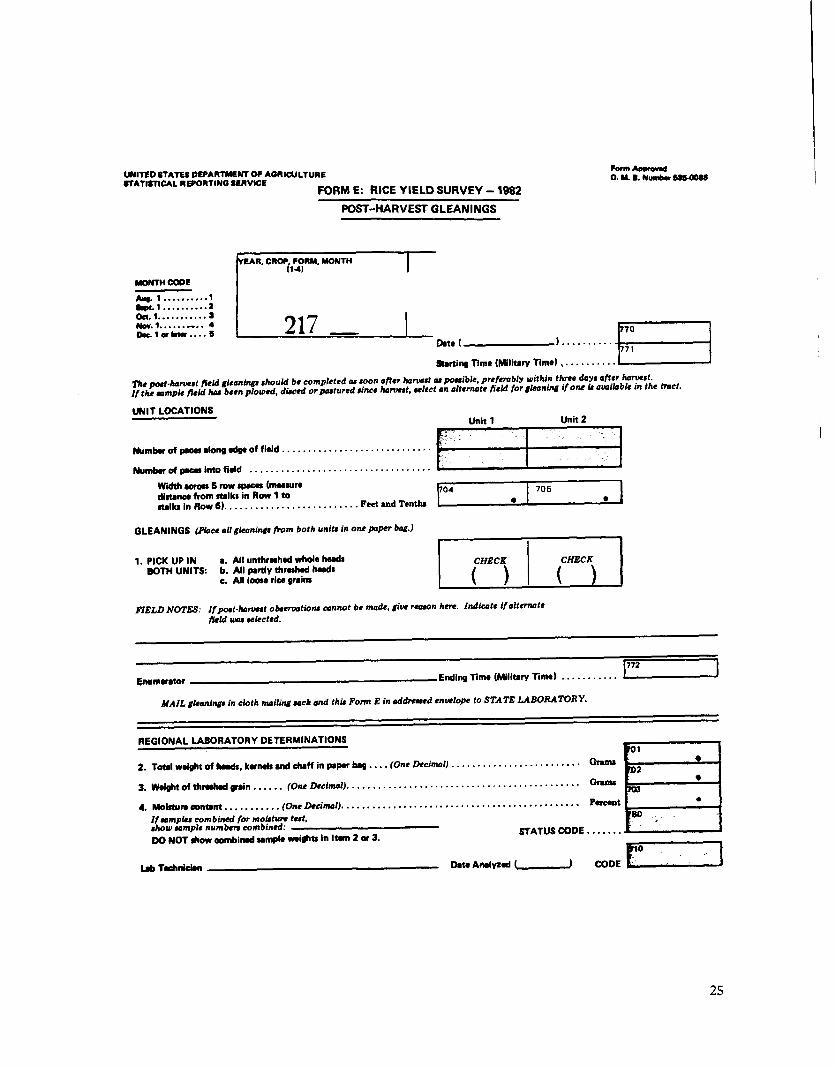
Number of plots per sample, plot size, field observations and counts,and clipping instructions were identical to those in the 1981 study.Plots were not located on levees or in ditches in either year. Post-harvest gleaning units were not located in tire tracks. Both of theseinstructions may introduce bias in yield estimates. However, datacollection problems were severe enough that these instructions werenecessary.
Procedures for locating Unit 1 changed in 1982, based on suggestionsfrom the enumerators involved in the 1981 study. Previously theenumerators located Unit 1 by pacing x-number of steps along the edgeof the field and y-number of steps into the field, where x and yarerandom numbers based on field size. The damage caused by this methodwas obvious from the field's edge. The enumerators were concernedabout this damage, as were some farm operators. In 1982, the'enumerators walked x-number of paces along the edge of the field andvisually located the nearest levee ditch. They then counted andrecorded the number of paces (z) needed to get to this ditch. Theywalked y-number of paces down the levee ditch, turned into the field,and walked z-number of paces. Figure 1 illustrates this procedure.While this procedure may not locate the unit in the same place as the1981 method, the unit location is still random, which is the primaryobjective of unit location.
Plots tended to be located closer to the edge of the field primarilybecause the levees curve a great deal. Difficulty with walking in
Figure 1: Plot Location Procedures
- - - --- tt~LevEe." Dff'(, _ ....... '" -- ---.
~ StartingCorner
IIIQ)UIVc..
"""o
><
IIIQ)UIVc..
2

ASSUMPTIONS
muddy ditches is also a factor, but this problem also occurs whenwalking in a flooded field. Some enumerators even felt that walkingdown the ditches was easier. Six out of nine enumerators responding tothe survey evaluation questionnaire preferred the 1982 unit locationprocedure because it caused less damage to the field. Those who didnot prefer walking down the ditches mentioned curving levees, snakesat levee gates, and confusion caused by the additional instructions asthe major problems. It is recommended that the paces into the field in1983 be 1 1/2 times the paces into the field in 1982 to try to locateplots away from the further edge of the field.
Another change in data collection was that all enumerators wereallowed, but not required, to work in pairs. In 1981, some enumeratorswere assigned to work in pairs and some alone. Many of those assignedto work alone were taking family members or friends with them. TheNASDA (National Association of State Departments of Agriculture)cost per sample in 1982 was $123 as compared to $142 per sample in1981. A more detailed cost breakdown between enumerators workingalone and those working in pairs is not available. Some decrease in costper sample was expected in 1982 since enumerators were moreexperienced. However, it does not appear that allowing enumerators towork in pairs increases costs substantially.
Appendix I contains a copy of all rice objective yield forms. Moreinformation on data collection instructions and editing procedures arefound in the "1982 Rice Objective Yield Research Study Enumerator'sManual" (7) and the "1982 Rice Objective Yield Supervising and EditingManual" (8).
All of the following analyses assume that there is no difference in yieldcomponent estimates between respondents and non-respondents. Table1 gives some indication of the magnitude of non-response in 1981 and1982. It is somewhat surprising that the 1982 response rates of 97% and9396 for the initial and post-harvest interviews, respectively, are higherthan the 1981 response rates (9196 and 8196). Some enumerators hadindica ted that some respondents in 1981 would refuse in future surveys
TABLE 1: Summary of Responses to Farmer Interview
1982Post-Harvest Initial Post-Harvest
----- PERCENT -----
Completed InterviewNo Rice in TractNo Rice in Sample but
Rice in TractRefusal/InaccessibleMissing
Total
90.83.11.54.60.0
100.0
80.8 97.0 93.03.1 1.0 1.01.5 0.0 0.0
11.5 2.0 6.03.1 0.0 0.0
100.0 100.0 100.0
3

because of field damage. However, of the 42 samples in 1982 whichwere also sampled tracts in 1981, only one was a refusal. The tractoperator was also a refusal in 1981, so the previous study did notinfluence his decision.
It is also assumed that little or no bias is introduced into the harvestloss estimate because post-harvest gleaning plots are not located in tiretracks. There should be no bias when the combine used a strawspreader, since harvest loss should be uniformly distributed. If a strawspreader was not used, bias would be introduced. However, in 1982 only6.596 of the samples were harvested without a straw spreader (7.696 in1981). Any bias due to these samples should be negligible and constantover the years.
Another assumption is that grain types (long, medium, and short) can begrouped together when building forecasting equations. This assumptionis necessary since there are so few observations in the short graincategory. Table 2 shows the distribution of samples in 1981 and 1982 byvariety. There has been no major shift in variety types so that anyeffect on regression models due to variety type should be constant overthe two years.
TABLE 2: Summary of Varieties by Grain Type
Variety 11981 J lq82-- PE CtN"I --
Nortai 1.7 1.0Total Short Grain 1.7 1.0
Mars 13.6 13.4Nato 4.2 0.0Total Medium Grain 17.8 13.4
Labelle 24.6 23.7Lebonnet 7.6 9.3Starbonnet 48.3 52.6Total Long Grain 80.5 85.6
Total All Types 100.0 100.0
All variances were computed using the formula for simple randomsampling. This is the procedure used in all operational objective yieldprograms, but it may not adequately represent the sampling design.The validity of computing the variances in this manner is beinginvestigated and is not addressed in this report. It is assumed that anyproblems with computing variances in the current method are minimaland consistent with current Agency practice.
4
AT-HAR VEST ESTIMATIONYield A final estimate of the net yield per acre at harvest in bushels, adjusted
to 12% moisture, was calculated using the data from the final pre-harvest field visit, the laboratory work on the mature samples, and thepost-harvest gleanings. The formula for estimating yield per acre is asfollows:
Net yield per acre =
Heads per acre =
(Heads per acre x Grain weight per head) - Harvest loss per acre,
where
(Number of late boot + emerged )+ detached heads in both units X 43560
(Unit 1 5 row widths +)Unit 2 5 row widths • 5 X 1.8 X 3
Grain weightper head =
X(1 - Moisture,content .J
X 1-.12)
Harvest lossper acre =
(Weight of gleaned grai", (1 - MOisture)after threshin~ .JX 43560 X content
{(Unit 1 5 row width +,\ '\Unit 2 5 row width ).5) X 1.8 X 3 X 453.6 X 45 X (1-.12)
5 adjusts five row widths to one row,43560 is the number of square feet in an acre,1.8 is the length in feet of one row (21.6 inches),3 is the number of rows in one unit,45 is the number of pounds in a bushel of rice,453.6 is the number of grams in a pound, and(1 - .12) adjusts the weight to 12% moisture.
Several methods of estimating harvest loss and net yield wereevaluated. These estimates are summarized in Table 3.
Two methods were used to estimate harvest loss -- an average over allavailable samples, and an estimate based on stratifying harvest loss bythe farmer's reported damage. Ratio and regression estimates ofharvest loss were investigated in 1981. These methods did not lead tomore precise estimators because there was little correlation betweengross yield and harvest loss. This is still true in 1982, as can be seen inFigure 2.
5

TABLE 3: Summary of Yield Estimates
yariable G Mean Std. Error 1 CV(%)_
Heads per Acre 89 1,227,057 48074 3.9Wt. per Head (gr.) 89 1.84 0.07 3.9Gross Yield (bu.) 89 102.8 3.56 3.5Harvest Loss - Avg (bu.) 47 6.0 0.88 14.7Harvest Loss - Strat.(bu.) 93 5.9 0.92 15.7Net Yield - Avg (bu.) 89 96.8 3.67 3.8Net Yield - Hist. (bu.) 89 95.2 3.72 3.9Net Yield - Percent Adj. (bu.) 89 93.9 3.93 4.2Net Yield - Ratio Adj. (bu.) 89 90.2 5.02 5.6Net Yield - Strate Adj. (bu.) 89 90.4 3.51 3.9Farmer Reported Yield (bu.) 93 92.4 1.90 2.1
Figure 2: Plot of Harvest Loss per Acre vs. Gross Yield per Acre (bu/acre)Symbols are: 1 = damage affecting harvest loss
2 = damage during the growing season3 = no significant damage
I27.5 •
III
25.0 •III
22.5 •III
20.0 •III
17.5 •III
15.0.III
12 .•5 •III
10.0 •III
7.5 •III
5.0 •II I JJI n
2.5 + JI J I J J J JI J :I JI
D.G • 1-t- .•.•.••.• + •..• - _ ••• - +_ ••__ + • _ .•.__ + + •. + - - - -+ -- __+ •.• -- +---- +- - --+ .•....••.+ .•.•.• _t __ --+--- -•.•.•.•.••.•-- .••.•.•--. - .•.•..••.•.•...•.••..•
o ID 20 30 40 SO '0 70 10 " IDO 110 120 tJD HO 150 1.0 170 .10 no 200 :no 220 2JD 240
OROSI YlCLD f'£R ACR(
The average estimate of harvest loss is based on the even-numberedsamples which received a post-harvest gleaning visit. Since this is arandom subsample of the sample, no additional bias is introduced intothis estimate. The second estimation procedure involved stratifyingharvest loss based on the farmer's reported damage code. Three stratawere used: (1) damage, such as lodging, which would affect the harvestloss estimate (2) damage which occurred during the growing season, and
6

(3) no significant damage. Means were calculated for each stratumbased on the available gleaning data. Stratum means were 5.4, 4.3, and6.3 bushels per acre respectively. The percentage of samples in eachstratum was estimated using the available data from the post-harvestinterview. The percentages for each stratum were 16%, 14%, and 7096respectively. The standard error for this harvest loss estimator wasslightly higher than for the straight average estimate (see Table 3).This indicates a high within stratum variance, which can also be seen inthe wide range of harvest loss values for stratum 3 in Figure 2. Allsubsequent references to harvest loss will be to the straight averageestima tor.
Net yield per acre was estimated using two methods. They differedonly in how harvest loss was estimated for those samples not receivinga post-harvest gleaning visit. The first method expressed net yield asthe difference between average gross yield and average harvest lossusing only 1982 data (i.e., used the current year's harvest loss estimatefor those samples not receiving a gleaning visit). The estimate usingthis method was 96.8 bushels. A second method used historic harvestloss rather than the current estimate for those samples not receiving apost-harvest gleaning visit. That is, net yield at the sample level wascomputed for those samples having both gross yield and harvest lossdata in 1982. For those samples not receiving gleaning visits, thedifference between average gross yield in those samples in 1982 and theaverage harvest loss in 1981 was used as the net yield estimate. Thevariance of this "historic" estimator is slightly higher than the first(standard error of 3.72 as opposed to 3.67). For this reason the first"average" method will be used in all subsequent references to net yieldin this paper. The "historic" method would probably be used in anoperational program, however, since an historic average would be usedto forecast harvest loss early in the season.
Since the objective yield plots are not located on levees or in ditches,there is a potential for bias in net yield estimates. Rice grown onlevees is more subject to damage from weeds and moisture stress thanrice grown within the field. Yield on the levees should be lower than inthe rest of the field. In addition, levees were not reseeded for 10% ofthe samples in 1982. Based on information obtained from the farmer inthe initial interview an average of 6.1% of the field is in levees andditches. This percentage ranged from 1% to 25% of the field, with 65%of the samples in the 1-5% range. Therefore, the objective yieldestimate probably overstates yield per acre.
Several procedures can be used to adjust the net yield estimate toeliminate this bias. The simplest procedure is to reduce the estimateby a certain percent. For example, assume the rice yield in ditches iszero and the yield on the levees is not significantly different from theyield in the field. Also assume the acreage in levees is equal to theacreage in ditches. The percent reduction should therefore be thepercentage of acreage in ditches. Since an average of 696of the field isin levees and ditches, let 3% be the percent reduction. This is referred
7
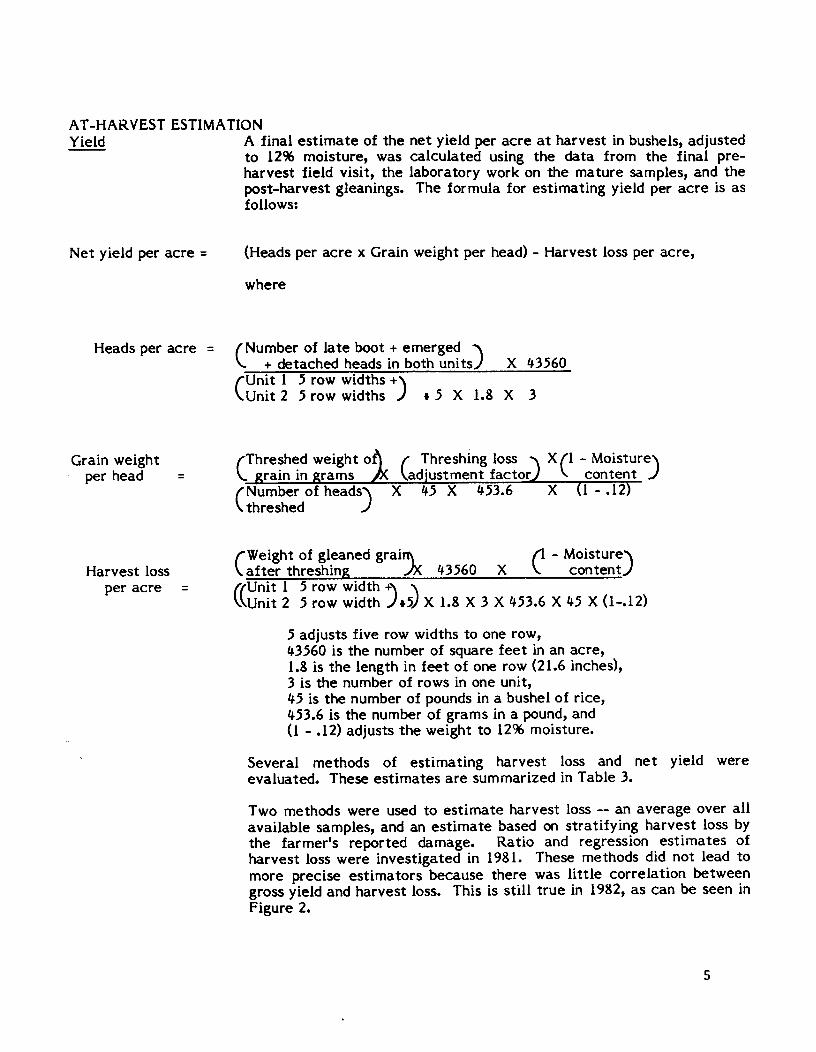
to as the "percent adjustment" in Table 3. The problems associatedwith this procedure are that the farmer's levee and ditch acreageestimates may be biased, and the percent adjustment is both arbitraryand subjective in its assumptions.
A second adjustment multiplies the 1982 objective yield estimate by theratio of the 1981 Crop Reporting Board (CRB) estimate to the 1981objective yield estimate. This estimate is referred to as the "ratioadjustment" in Table 3. This adjustment must assume that the CRByield estimate is "true yield". The CRB yield estimate must be treatedas a constant (i.e., has no variance) when computing the variance of theratio adjustment estimate.
A third yield estimate involves estimating yield for levees, ditches, and"within" the field separately. Gross yield per acre would be estimatedas PI XI + P2 x2 + P3 x3, where
PI =Xl =P2 =x2 =P3 =x3 =
percentage of field acreage in leveesyield per acre for those acres in leveespercentage of field acreage that is "within-field"yield per acre for those acres "within-field"percentage of field acreage in irrigation ditchesyield per acre for acres in ditches (equals zero and hasno variance).
The variance of this estimate would then be approximately (PI)2 var(xl) + (XI)2 var (PI) + 2PlXl cov (Pbxl) + (P2)2 var (x2) + (X2)2var (P2) +2 P2x2 cov (P2,x2) + 2 cov (p1XI, P2x2).
The harvest loss estimate would be subtracted from gross yield. Thevariance of gross yield per acre for the levees (xI) is probably greaterthan that for the within field (X2) plots since some farmers reseedlevees while other do not. It should also be noted that as thepercentage of levees (PI) increases, the within field yield (X2) mayincrease due to improved water management. An additional problem isthe accuracy with which Pb P2, and P3 are estimated. Acreages aredifficult to estimate, especially when they involve small areas. Thuswhile some data collection biases are eliminated, the variances mayincrease and another potential bias (acreage estimation) is introduced.
Since no plots were located on levees or ditches, a modification of thethird approach was used in 1982. The formula for gross yield was 1/2(PI + P3) (Xl/x2) x2 + P2 (X2)where Pi and Xiare defined as before. Thismethod assumes that half of the farmer's reported acreage in leveesand ditches is in levees. It also assumes that levee yield can beexpressed as a percentage of within field yield. Since there is noestimate of this percentage, more assumptions had to be made. It wasassumed that (XI/X2) could be estimated by solving the followingequation for (xI/X2): 1981 CRB yield = 1/2 (PI +P3) (Xl/x2) x2 + P2 (X2)- harvest loss, where all the Pi are 1982 estimates, and x2 and harvestloss are 1981 estimates. This estimate of (Xl/x2) was then used in the
8

Acreage Estimates andProduction Estimates
Handling Effect
equation for 1982 to solve for the 1982 CRB yield. Again, this assumesthe CRB yield is "true" yield.
None of the net yield estimates in Table 3 are significantly differentfrom each other. The farmer's reported yield was 92.4 bushel per acre,and the CRB yield estimate was 97.5 (adjusted to 1296 moisture). Theaverage net yield, unadjusted for bias (96.8), will be used in allsubsequent references to net yield since its standard error was thesmallest in relation to the mean. It should be noted that this estimatemay not have the smallest mean square error. However, since theamount of bias is unknown, the mean square error could not becomputed. The average net yield also maintained independence fromthe Crop Reporting Board estimate, unlike some of the adjustedestimates. Until a validation study can be conducted to eliminate someof the assumptions necessary for adjusting the yield, the simpler"percent" adjustment or a time series chart using average net yield isrecommended rather than the more complicated procedures.
The estimate of planted acres of rice from the June EnumerativeSurvey (JES) was revised to reflect the acres for harvest. The firstrevision was done in August, and was based on the ratio of tract acresto be harvested, as reported during the initial interview, to the tractplanted acres, as reported on the JES. This ratio was 0.96 in 1982. Therevised acreage estimate was 1,359,850 acres, with a standard error ofapproximately 134,300.
The second revision was based on the field acres harvested as reportedon the post-harvest interview. The ratio of this figure to the fieldacres planned for harvest as reported on the initial interview was 1.007.The revised estimate was 1,370,000 acres with a standard error ofapproximately 136,400. The final Crop Reporting Board estimate ofharvested acres was 1,330,000 acres.
Using the objective yield indications for yield (96.8 bu.) and acreage0,370,000), the objective yield estimate of total rice production inArkansas was 132,692,000 bushels. The CRB estimate, adjusted to 12%moisture, was 129,295,000 bushels. The objective yield estimate wastherefore 2.6% higher than the CRB estimate.
Rice in Arkansas is seeded either by using a broadcast method ordrilling in 6 inch rows. This, together with flooded conditions early inthe season, make it difficult to walk through and make counts in a ricefield without some damage to the plants. If the damage is severeenough, the sample plots may not be representative of the "unhandled"areas. In order to investigate the effect of repeated visits, Units 1 and2 in the even-numbered fields were treated differently. Theenumerators located Unit 1 on the first visit and repeatedly observedthis unit each month until maturity. They relocated Unit 2 each month.
9

A Bonferroni paired t-test was used to test the hypothesis that therewas no significant difference in counts between the units. This methodis described in Timm (6) and the 1981 Rice Objective Yield Study (4). In1981, no significant differences existed for any month or at maturity.In 1982, a significant difference between the units existed in Octoberand at maturity (see Table 4). Unit 1 contained more emerged headsthan Unit 2. This tendency was also present in 1981, which mayindicate that damage to the surrounding competition allows more headsto develop fully. The use of two enumerators for all samples in 1982may have accentuated the effect. However, in 1982, Unit 1 tended tocontain more heads (particularly late boot heads) than Unit 2 in Augustwhen neither unit had been previously handled. This tendency was notapparent in 1981 and may indicate that the change in unit locationprocedures affected the plant counts. Since the growing season wasapproximately the same for both years, it apparently does not explainthe year to year difference. Thus, no conclusions can be drawnconcerning a handling effect.
Table 4: Summary of Handling Effects 1..1
Mean of Mean of a Std.t ~/Month Variable n Unit 1 Unit 2 (Unit 1-2) error
Aug Stalks 44 1,427,878 1,396,760 31,118 96,792 0.32Late Boot 47 222,386 133,986 88,400 45,613 1.94Emerged 47 597,877 641,212 -43,334 82,522 -0.53Detached 1 a a aHead Wt. 25 0.722 1.004 -0.229 0.0948 -2.42
Sep Stalks 5 1,228,225 1,147,618 80,607 225,261 0.36Late Boot 47 35,777 17,449 18,328 14,660 1.25Emerged 47 1,266,465 1, 149, 006 117,458 67,990 1.73Detached 35 1, 591 811 780 1,150 0.68Head Wt. 47 2.019 2.119 -0. 100 0.1051 -0.95
Oct StalksLate Boot 10 8,067 2,689 5,378 5,378 1.00Emerged 10 1,145,749 826,279 319,469 84,457 3.78*Detached 9 a a aHead Wt. 10 2.473 2.604 -0.130 0.3732 -0.35
Mature StalksLate Boot 45 0 0 0Emerged 45 1,315,109 1,119,826 195,283 70,019 2.79*Detached 45 1,238 631 607 893 0.68Head Wt. 46 2.250 2•379 -0.129 0.1237 -1.04
1/ Counts are expressed on a per acre basis. Weights are expressedon a per head basis.'£/ * indicates the paired means are significantly different at the overallmultiple-t significance level of a=.05. Hotelling's T2 tests on appropriatesubsets of data yielded same results at ex =.05 level.
10

Plot Location Effect
FORECASTINGMODELS
Heads per Acre
Levees have the effect of subdividing the fields into sub-fields since thewater levels and temperatures are relatively constant within levees,and may be different between levees. Rice yields are lower for thesub-fields closest to the water pump because of cold water and waterimpurities. Yields also tend to be lower in the sub-fields furthest fromthe pump because of insufficient water.
The enumerators recorded the number of levees from the plot locationof Unit 1 to the starting corner. There is no indication of where thewater pump is in relation to this corner. While gross yield estimatestended to increase as the plot was located further from the corner, sodid harvest loss estimates. The average gross yield for plots in the firstfour sub-fields was 97.5 bushels per acre as opposed to 111.6 for theother plots. The average harvest loss was 4.3 and 8.1 bushels per acrefor the plots in the first four sub-fields and the other plots,respectively. Thus, both gross yield and harvest loss increased for non-corner sub-fields. Net yield is increased, but not as much as grossyield. The study was not designed to examine plot location effect inmore detail and no conclusions can be made. Care should be taken toinsure plot location does not bias the yield estimates however.
Multiple regression models were developed to forecast heads in thesample and weight of grain per head at maturity. Early season head andstalk counts, and early season head weights were obtained for the even-numbered samples in 1981 and 1982. Models should be generated foreach maturity category (see Appendix II for a description of matruitycategories), but some categories were combined because there were sofew observations. The procedures and assumptions for building themodels were the same as in 1981. No adjustments were made becauseof sampling design. Checks for collinearity, influential data points, andheteroscedasticity were made using the regression diagnostics describedin Belsley, Kuh, and Welsch (1). Influential data points were deletedwhen building the models. The "best" model was chosen based onhighest R2, lowest mean square error, and the least problem withheteroscedasticity or collinearity. See the" 1981 Rice Objective YieldStudy" report for more details on procedures.
The 1981 study showed that the pre-boot and early boot maturitycategories could be combined, as well as the milk and soft dough stages.The total number of heads (late boot and emerged) was a betterregressor variable than the two head counts individually. Theseconclusions are still valid based on an inspection of the 1982 data. Theindependent variables included number of stalks, number of heads, andfunctions (such as squares, square roots, and logarithms) of thesevariables. The "best" regression equations are listed in Table 5.Figures 3, 4, and 5 show the regression equations for each of the threematurity category groupings as well as ~he plots of the data.
11

Table 5: "Best" Regression Equations - Number of Heads
Maturity Category I R21~ MSE I Equa tion
Pre-boot &:Early boot (I &:2) .53 31* 600.0 29.7606 + 0.6009 (II stalks)
Late boot (3) .69 49 430.6 35.4037 + 0.7229 (II heads)
Milk and Soft dough (4&:5) .89 33 249.8 -3.7823 + 1.0652 (II heads)
* Some observations were deleted when building the model
A forecasting equation involving number of stalks for the late bootcategory, had a higher R2 (.71) and a lower mean square error (404.9)than the "best" equation for that category. Heteroscedasticityappeared to be more of a problem in the "stalk" equation than in the"head" equation, so the head equation was chosen as best.
Figure 3: Plot of Predicted (P) vs Actual (Symbol is Maturity Category)Heads at Maturity - Maturity Categories 1 and 2
221 •IIII
200 •IIII
175 •III
H I~ 150 ; 2o II I 2
I"US,T I
III I
" IT 100 •U I 2• I1 IT I, 75'
IIIISO.IIII
21'IIIIo ~. • +__ .•.••• + •.+ + •••.•.•••.••• __ ••_+ __ ••_+_ .•.__ •••.•. __ +_ .•.__ + +_ .•.__ + +__ .•._+ .•.•...•..•.••...•.__ +_ .•..•..•.•.•. • + • -- .•.-+- ---o 10 20 10 40 50 '0 10 10 '0 100 110 120 UO 140 I'D 160 170 liD 1'0 200 210 220 210 240
12

225 •IIII
200 •IIII
175 •III
M IE 150 •
- I0 I• I
I
- 125 •r I
I
" IA I 3T 100 •U IR II IT IY 75 • 3
IIII
50 •IIII
25 •IIII
o •
Figure 4: Plot of Predicted (P) vs Actual (3)Heads at Maturity - Maturity Category 3
3
3
3333
3 33 3
3
..- ...------ ----. --- ..+--- -+ -- .•-+ .•..••-- +-_ •..•+ .•.• -- +-- ••.•+ .•.-- .••.•. --- + - - - .•.••..••••.•.•.•.•.•.•..•...•.• + •••••••• +- .•.•.•.•....•....•.•....•.....+ •.•..••• + .•••••.•. +- -- ..---- .••.•.•.••--- .••.9 " 29 n 49 59 69 79 19 99 109 119 129 139 149 159 169 179 189 I"
HU"8ER OF HEADS
Figure 5: Plot of Predicted (P) vs Actual (Symbol is Maturity Category)Heads at Maturity - Maturity Categories 4 and 5
250 •,III
225 •IIII
200 •III
H IE 175 •A Io I• I
IA 150 •Y I
I
" IA IT 125 •U IR I1 IT IY 100 •
I 5III
75 •IIII
50 •II 5II
25 •_+ •• + __ •.•• +_ ••.• + + ••_ ••._+ .• + + .• + ••+ + •• + •••.•..•.•• _+ ••• -t ••-- -+ ---- +-- ..-+ .........•.-- •..-+ .•---+-- ....•----+-- +----o 10 20 30 40 50 60 70 10 90 100 110 120 130 140 ISO 160 170 110 190 200 210 no 230 240
HU"IER OF HEADS
13

Weight per Head
It should be noted that only data for Unit 1 were used in building theregression equations. This unit was observed throughout the growingseason. If a handling effect exists, these regression equations must beadjusted to be applicable to unhandled plots. Alternatively, modelscould be built using "unhandled" Unit 2 data. Early season and lateseason relationships probably would not be as strong since differentplants are observed each month (10) (11).
The grain weight per head at maturity in grams, adjusted to 1296moisture, was used as the dependent variable. Early season weights oflate boot and emerged heads, and the count of grains per head wereused as independent variables. Functions of these variables, such assquares, square roots, and logarithms were also used as independentvariables for constructing the "best" regression equation. The weight ofheads (late boot and emerged combined) and functions of this variablewere also used.
Models were developed by maturity category using both 1981 and 1982da ta. However, data for the milk and soft dough stages were combinedsince there were so few observations and the data plots were similar.The data were also grouped by month rather than maturity category.This grouping was inferior to the maturity category grouping and is notpresented.
Table 6 shows the "best" regression equations. Plots of the regressionequations as well as the data are found in Figures 6 and 7.
Table 6: "Best" Regression Equations - Weight per Head
Maturity R2 I n I MSE __ E_q_u_a_t_io_n _
Late boot (3)Milk & Soft dough (4&5)
.45 44*
.13 33*0.21160.3933
0.96 + 1.55 (wt/emerged head)1.91 + 0.40 On(wt/emerged head»
* Some observations were deleted when building the model.
While the equation for the late boot category is acceptable, theequation for the milk and soft dough category is not. In 1981, the"best" equations for the milk and soft dough category involved thegrains per head variable, and had an R2 of .46. While heads tended tobe lighter in 1982 (2.0 grams as opposed to 2.3 grams) and containedfewer grains (107 as opposed to 126), weight per grain remainedconstant. This would indicate that grains per head should continue tobe a good predictor variable. A plot of the data shows that theadditional 1982 data destroys the 1981 relationship. There is noobservable pattern or distributional change due to years, however. Thisis true of all weight per head variables, not just grains per head. This
14

II." .III
1.00 •I
•• IE II 2.75'. ,II IT I
2.50 •III
• 2.25'II IA II III 2.00'
I, IE III 1.75'
I
" IIA 13T 1.50'U III IE I
1.211•II IE IA ID 1.00'
IIII
0.75 •III
o. sa ~+ ••.• __ .••... ••.• _+_ .. ••.. __ + + __ ••••....••.•.•• +_ .• •._ + .• __ .• __ .. __ + +_ .•__ .. __ .•.•• .• ••_+_ •.__ .•.. + ....••• •. __
Figure 6: Plot of Predicted (P) vs Actual (3)Weight of Grain at Maturity - Maturity Category 3
3
I
3
J
3
3
I
33 3
I
J
3
3
3
3
I
I3
33
I
3I
3
3
o,
0.0 0.1 0.2 0.3 0.5 D.' 0.7 D.' 0.' 1.0 1.2
IIEIIMT ,Ell E.IIDED II£AD
Figure 7: Plot of predicted (P) vs Actual (Symbol is Maturity Category)Weight of Grain at Maturity - Maturity Categories 4 and 5
. 4.5 •IIII
4.0 •I
•• IE II I• 3.5 • IIM IT ,
I0 I, 1.0 • 5
I• I 4II IA I 4 45 4I 2.11•
" I 5 114 5I 4 5, I II 4 4
E III 2.0 •
5 5I
" I 4A IT , 5U 1.5 • 4II ,E I 4
I 5M I 5 4E 1.0 • 5A , 5• I
I 4I
0.5 •II
o.D + + + + __ ....._ + + + + + ...•• _ .. + + + .. _+ .••.. •. + + + .• + + _
0.0 0.2 0.4 D•• D.' 1.0 1.2 1.4 I.' 1.' 2.1!. 2.2 2.4 2.' 2.' 3.0 1.2 1.4 I•• I.' 4.0
IIEIIMT 'Ell EMIIOED HEAD
15

SUMMARY ANDRECOMMENDATIONS
fact is particularly important since the SSO used a newer thresher in1982, and a year effect due to the thresher may have been expected.
The assumptions should be summarized before drawing conclusions. Ithas been assumed that land use stratum and tract or field size have noeffect on the estimates when dealing with nonresponse. This sameassumption, along with the assumption of no grain type effect, wasmade when building regression equations to forecast yield components.In addition, variances were computed using the formula for simplerandom sampling, as is done in operational objective yield programs.
Based on the 1981 and 1982 rice objective yield surveys in Arkansas, thefollowing conclusions can be made:
1) It is possible to estimate final yield per acre at harvest using anobjective yield procedure. The objective yield estimate was 96.8bushels per acre in 1982 (CY := 3.8%), which compares favorablywith the Crop Reporting Board estimate of 97.5 bushels. In 1981the objective yield estimate was 110.8 bushels, while the Boardestimate was 103.2 bushels.
2) Several potential biases have been identified. No plots arelocated on levees or in ditches, so that yield estimates should betoo high. Gleaning plots are not located in tire tracks so thatharvest loss estimates should be too high when a straw spreaderwas not used for harvest. Estimates may be too high or too lowdepending on the distribution of the sample plots in the sub-fieldscrea ted by the levees. The 1981 and 1982 studies were notdesigned to examine these problems and therefore no conclusionsor adjustments to the estimates are recommended until theseproblems are examined in detail. These problems should beaddressed in a validation study, where within field relationshipsare thoroughly examined. A pilot test in Arkansas will beconducted at harvest in 1983 to obtain an estimate of levee yieldand its variance and to test data collection procedures.
3) No conclusions can be drawn concerning "handling" effect. In1981, there was no statistically significant effect on yieldcomponents due to repeated handling of the plants. In 1982, asignificant effect occurred at maturity, even though the growingseason was about the same for both years. It is recommendedthat this study be continued for another year.
4) Early season forecasts of heads per sample unit at maturity canbe made using early season counts of number of heads. Currentlythese models assume that there is no handling effect, so that themodels are built using data from plots which were observed atleast twice. If a handling effect is present, either the forecastswill have to be adjusted for bias, or the models will have to be
16

built using the "unhand led" data plots. These models will thenintroduce measurement errors in the independent variables sincethe observations are not made on the same plants, and the earlyseason and late season relationships are not expected to be asstrong.
5) Regression equations to forecast weight of grain per head atmaturity do not look very promising. Considering the datacollection costs, historical averages may be more efficient eventhough they do not reflect current year situations. It isrecommended that data be collected an additional year since therelationships changed so much from 1981 to 1982. Other methodsof forecasting grain weight should be investigated.
REFERENCES 1. Belsley, David A., Edwin Kuh and Roy E. Welsch, RegressionDiagnostics, John Wiley and Sons, Inc., 1980.
2. Bovard, Gary, "Rice Objective Yield Feasibility Study",memorandum, February 12, 1981.
3. Cochran, William G., Sampling Techniques, John Wiley and Sons,Inc., 1963.
4. Pense Roberta B., 1981 Rice Objective Yield Study, StatisticalResearch Division, SRS, USDA, Staff Report No. AGES821221.
5. Steel, Robert G.D., and James H. Torrie, Principles andProcedures of Statistics, MCGraw-Hill Book Company, Inc., 1960.
6. Timm, Neil H., Multivariate Anal sis with A lications inEducation and Phycho10gy, Brooks Cole Publishing Company,1975.
7. Sta tistical Reporting Service, 1982 Rice Objective Yield ResearchSurvey Enumerator's Manual, May 1982.
8. Statistical Reporting Service, 1982 Rice Editing Manual, May1982.
9. Texas Agricultural Experiment Station, Six Decades of RiceResearch in Texas, The Texas A&M University System, 1975.
10. Wigton, William H. and Fred B. Warren, Using ObjectiveMeasurements of Plant and Soil Characteristics to ForecastWeight of Grain per Head for Winter Wheat, SRS, USDA,November 1971.
11. Wood, Ronald A., Grain Sorghum: A Preliminary Forecast Model,SRS, USDA, September 1972.
17

APPENDIX I
Forms
SURVEY MONTH CODEAuO_ 1 ••1Ioptomber 1 .• 2Ol:tobor 1 .• 3
~~S~~~='J:m :~T_'''';.~''m.:.··~~'1rice !f"ded acreage and obtain .your eatimate of the JUNE TRACT ACRESacreage to be harvested for eram. 1
1011
, At the time of the June vilit you had seeded or intended to seed ...•••.••.•.................... • .. . . (Do not cOOnge)acres of rice in fieldlln thll tract.
UNITED STATES DEPARTMENT OF AGRICULTURESTATISTICAL REPORTING SERVICE
FORM A: RICE YIELD SURVEY - 1982T INTERVIEW
Form ApprovedO. M. B. Number 535.QOSSC.E.12-31A.1W
<NO•• Re., •• ell ,,./11•. RE·ADD Column 6.IITHAT !lIGHT?
YES .. Co"'",~.
SHOW operator his tract and (ie/d. on PHOTO.
VERIFY the fielell and the acreagu of rice which Were actU<JlI)'seeded in this tractand entered in the .OOded are"" of Table A. OUTLINE and kibeI on the photo all acresreported in Column 5.
MAKE necessary corrections and new entries in non .•OOdedare••• of Table A.
If no rice wcu .eeded in tract, correct Table A.
RECORD the acreages of rice to be OOrvested for poin in Column 6 and ADD to total.
TABLE AFIELD Acres in USES or CROPS other than ACRES OFNUMBER TOTAL ACRES OF rice to be harvested for grain. RICE(Somple field ACRES RICE (For ezample: bare .pot., TO BEnumber is IN FIELD SEEDED roads, other crop., e,tc.) HARVESTEDc-irded.}
USE ACRES FOR GRAIN1 2 3 4 5 6· · ·.• · . .• '.)1 ·• · ·.• . - i•• ;. .
'h. :~ .•.'1"" ·· · ·.• - .• .• I ·· · ·.• .• .• oil ·· · ·.• .• . ~...• •... ... ..• ·· · ·.• .• • "I ·102
2- The toul rice acreage (Col. 6) to be harvested fr., lI,om ••••.•.•.•.••.••••••.••....••••.••. Acrel ·
<AZERO entry· • return all forms.IF ITEM 2 HAS
An ACREAGE entry •• TURN PAGE
18

Form A: RICE ICom'dl
lte_ 3 to 10 Apply to tll, SAMPLE FIELD ONLY.
If no Rie, ill int,nd,d to be IIorvat,d for 6T'4inin tll,d.IBMted IGmple fj,ld. BUT A NEW fj,1d to be IIoMHtat,dfor"..in illU.t,d in Tobie A, tllill n,w (icld th,n becomu the-i* fi,1d to ,nter in Item 3 And It,m 4.
_______ _./1031 Acres of Rioe to be hlrveated for grain In s.mple Field Number •••••..
4. Whit per •••• of the c,. In s.mple Field Number Is in Ift_• ditdl.7 ••••••..•..•••..••••••••..••••••.••.••••.••••••••.•••••••••••••• PERCENT
5. WhIt nritty of Rice did you MId In this field? •.• OFFICE CODE
I. II this r1ce,llhongraln 111 medium grain 121long grain 131 .•••••••••••••••••••••• ENTER CODE
7. W. thil field _ by: &ro.Icm D- 1 Orlll D - 2 •..••••••••••••••••• ENTER CODE
8. Did you ......s 1ft".? YES 0- 1 NoD- 2 .•••••..••••.•••••••••••• ENTER CODE
IL Ewen Numbtnd s.mplas
''With your permluion I will now go out to the field and mark off two lmall unlU to beUIad in makingltllik and httd DOUntI."
HI wUl retum to the units tteh month until hI •••an to make DOUntsand clip a few httdsto determine their weight and Ilze. Would that be all rlght7': YES Cl NO Cl
b. Odd Numbtred s.mples''With your permission I will return Ihonly before hlrveat andmark off two lmall unit •• I will make DOUntiand clip a fewhttdl to dttermlna their weight and liD.Would that be all rlght7 YES 0 NO 0
10. "After you hive fi'*hed harvaeting this field, I will return to Ilk you about production.It will be appraclated if you cen kttp a ~ of tha total amount of rice hI •••..uclfrom this field."
IMPORTANT: R,vi,w tllill form for complet'Ma. R,cord'ndi", tim, ond .iBn nom'. 'l'rDftlfern,ce."IIIrJ dota (rom Item 3 to Form D. It,m I.
1 lOB
[:104
1105
1106
1107
IIIIII
1172
Endlng Tima (Militory Tim,) ••• _
{teo
STATUS CODE •••••• ~-----
Enum.ator _
19

UNITED STATU DEPARTMENT Of' AGftICUL TUllESfATllTICAL IlIPOfITING IEIlVlCE
Form ~O. M. I. Number •••••••
FORM B: RICE YIELD COUNTS - 1982
II tIIia the _ unit tItet _ IIIdout ••••-.Ill .
Number of •••••••••••• offilld •••••••••••••••
Number of •••• InIDfIIld ..•••••••••••••••••.••
UNITZ
NoDNo 0
UNIT'
y.O
213-UNIT LOCATION
~, .,••••••••••• ' • Z___ , ·a
••••••••' ·4
CINQ NO If 1"*11 lite (hi *' 1o _Y oul ""'t J or If '''' if ""'t 2.Con lite *,r-llon on ",..,.. _lIer"""" "poc. from le•• e" to 1M "mple ." ertHJop. and all otMr B for_.For """(,) dNdtlld: V" -,'lip 1011_ 2.
No - co""*" I"," J.
,. WIcIdl_ 15row •••••• en-,. 1301••••••• "- "'leIln Row' to•••• 1eI1nRow 151••••••••••.•.• PM UICI ,..&11I
2. ITAGE OF MATURITY: lanN _ •••••••• for ...eallllltl
UNIT'
•
UNITZ
•
Mnurky ••••• "-"'loot E.rIy loot L8te loot MIlk • ft Dough Herd Dough Ripe..."-'300 300 300 300 300 300 300
UNIT' , 2 3 4 15 • 7302 302 302 302 302 302 302
UNIT 2 , 2 3 4 6 • 7
f ~":O:"':_turifY t:tIM If 1M:f"'~_Iwily cod, of ,/tller unil IIof un. ,. Colle J ,••••• 11 Cod, ~ or '/f:tGrt eounl, lllitll 4~Forc0iii4Ifart eoun" rill ,. cod. or 1, I'It •• ,II,,,.. 1.nd .
I. L NulMlrof-... •••• OIl•••••••.••••••••.•••••••••
II. No. of ••••••••••• In UNIT••••••••• ONLV ••• FINALPRE-HARYEIT vllln •.•.........•..•... , •••..•....
•• COMIiaNTS ••••••••••• of fIIld •••••••••••••••••• : _
COUNTS WITHIN UNITS
3. Number of ••• 1eI•••••• ,In row ••••••••••••••••••••••••••••••••••••••••••••••
4. No. of ••••• In LATE lOOT ••••••••••••••••••••••••••••
UNIT' UNITZ
Row' Row 2 Row 3 Row' RowZ Row 3311 312 313 314 315 3111
351 352 353 35<' 355 358
331 332 333 334 335 338
341 ',," .. 344, .' . .. . ," . ~ ,
(8ft ••• - CUPPING IN8TRrJC'l'IONB - BIItI,. n-.)
20

FORM 8: RICE CQInt' .••,
lay out UnIts 1 • "-' bIIow:
Row •
Row 2
Row 1 UBIt 2atp
OMant Ar. Clip AnI ALIly GUtollly 1M COUlltarwa for Ullit Z
alp An. 8
CLIPPING ORDER
Unit 1 C••••• I'
First a-. - Row 11n alp Ar. 8
IIIond c:IitIIHI- Row 3 In Clip Ar. 8
11IIrd alpping - Row 2 In alp Ar. A
EnuIMrltor _
Beeord ,...,. cUpped in Ite ••• " and 6 of Form Band olll.D. ,..,.. Attacll oMl.D. ,.., to_IIBI •• C"eelt Itara ( ) after phld", •• ill clot" -om, aaci ~tl to ITA TE. Bllter tiIIH and"". .••.....
7. "11M HIGHEST MATURITY COOl airelad In Item 2 for EITHER Unit II:
(a' Code 1 or 2: 8lW' 1__ 8 aDd to Bater time aDd._.
(b' Code ., t 01' 5: Go to Item 8.
(c) Code 8 or '1: Go to Item to
I. WITHIN CLIP AREAS - MIke ailppinglln 11M•••••••• ROW within Clip Ar-. of EACH unit following atllll be••
lIep 1 - MOW (cut etollt lIIitlllll , inc,.. of ••• ) aDI&alb ill apeclftecllOw UDtII 4 £mafwId •••••• (if tllat -y)are obtabteel OR UIItilthe lOWII coaapIeteI)' 1DOWed.••••• -willi at •••••of lOWfudMIt froIDOOUllt_ aDd mow ill dIncUon of count -. BIwnbte aacb ataJt for __ eel ••••d allt Ia _wed; if •••.•••••t.clip ataJt _1DCb below the -.s. Place the 5 (or Iaa) -.eel ••••• ill ., •••• R.-d count on State(yellolll) to. tee. AI80 _en -wine. clip aDd count an)' ••••• ill ••• boot and place ill 5' •••.
IIep 2 - MOW -.JnInc I&aIb ill lOW. BuDIIDa eecb I&alkand deWmIne wb1eh _ are -.eo••••• aDd which 0_ are ••• boot •••••• CLIP the IlaIk _Inch below the bead. Place the •.•••• nInt__.ad ••••• ~ the 8 # blip aDd the •••• boot ••••• ill the 5# ••••
IIep 3 - a-d the COUIItof the renaaIDInI-.eeI beaell and the late boot ••••• on the aate (yellow) to. tat.
Rapeet •••• 1 tbru • for Unit 2111in1dlffennt blip for emerpd b.eII aDd Jate boot ••••• than lIHlIln Unit 1.
Ptepue two to. tap. label all •••• with _pie and aDit n_bar ••••• and place ., and 5 ''''' In the 81 •••.
Verity State (Yellow) to. laIJ and aUacb to ouWde of 8 # ••••.
Cllaclt ltan Oane PI«inI B I ..,.ill a elo'" mGilm, _It edtl~ to ITATE LAB.ENTER tiIM and "'" ••••••••
t. WITHIN COUNT AREAS - alp •••• Count III ••••• In -.nt _ of 80TH units foIlowI,.ltIPIlMlow.U. •••••••• 1# ••• for •••• unit.
8Iep 1 - atp and Count all H.dIIn ••••• Boot In Row 1 - "-din ••••• 4.
8Iep 2 - atp and Count all EJMrgId HIllIs In Row 1 - "-d In Item liIIand place •••••• beedlln _ •••••• late ~ •••••.
••• 3 - •••••••••• 1••• 2 for ROW2_ 3.- s-4 .
8Iep 4 -l'Ict lip aDd Count all o.t.chId ••••• on IJOUDdIn lIDit and R~ In Item lb. Place In ••• withclipped baada.
•• DlNG TIllE ,_ -, •..•• f:~7-:-----1ITATUSCOOE ••••••••••••• L--.
CODE J_~ _I
21

UNITED STATES DEPARTMENT OF AGRICULTURESTATISTICAL REPORTING SERVICE FormAppro_
O.M.8.Nu_ &3S-OOB8
MONTH CODE
••••.1. .... 1•••••.1. ...• 2Oct.1. ...• 3Nov.1 •••••••
FORM C-1: STATE LABORATORY DETERMINATIONS-
1982 RICE YIELD SURVEY - CLIPPING AREA
SINGLE ROW HEAD SAMPLES
EAR. CROP. FORM. MONTH.,..•,214_
OIt. _
(Sample Proceued)
: __ 1=============~~~I.·.H •••••••• ~~ ••••:__:-2_1-_- -_- _-_ -_ -_ -_-_
1. From lcIentlfjAtion T8IJ
e. All Heeds (Emerged end Lete Boot! .
b. Stege of Mlturity .......................•
UNIT1 UNIT2
2. L8bomory Detlt'minetions. Subumple of emerged heeds 13-1 .111
•• _ •••••••••••••• , .HH .H. HHHHH.H •••• H HHH •• HH·HH 1"-05-3------ _
b. TotIll weight of "-cIs (OM dee/_I) E _
c.:;:;n:c.'~~~~~.~~~~.~~~~~~~.~~~.~~~.~' f_' _
e.~1:-:=~.:~-nt 1-4Oll------ _121 TotIll weight of heeds ................•...........•................... _41_1 _
b •••••• in Let, Boot 15' b8IJl:
(11 T•••••• mber ••• boretory_nt ..•••..••.••.•.........•..........•••... 1_4_13
_••15
121 TotIll weight of Iete boot heeds ..••....•..•.•..............••........•.. _
Leb Technicilln _
22

UNITED STATES DEPARTMENT OF AGRICULTURESTATISTICAL REPORTING SERVICE
(S4mple Proc_d)UNIT 1 UNIT 2
1. From Identification T~ I I•• ~=~~~~.d: .a:-.t~.~t Number ~=ber
Highestb ••• ", of Mllturity ............••• 0 •• o. Code •.• - Code
MONTH CODE
••••••1..••• ,Stpt. , •• " 2Oct., •••.. :INo•• , • 0 o. 4Poc. , or Iotw Ii
+
FORM C-2: REGIONAL LABORATORYDETERMINATIONS - 1982 RICE YIELD SURVEY
HARVESTED UNIT HEAD SAMPLES
YEAR. CROP. FORM. MONTH.,...•,Dlte _
Form ApprovedO. M. B. Number 63!HlOBB
r502
c. Tot" _I"'t of III MIds ••• .21(1) +211 (1) ... 0 •••••• 0_
3. 11Irethld •.• in. all hudl from Units 1 .nd 2
2. LAboratOryDltllfminetiOIll•• 11clipped hudt from Units 1 .nd 2
503'0 Unit 1: (1) Total weieht of all beacla. 0 • 0 •• 0 (On. deeirnJll)...•...••........................ , 504
(2) Heaclain _pie. 0.0 •••••••••••••••••••••••• • ••• ·.00 •• '" ••••••••• , •••••••• , 505
b. Unit 2: (1) Total weieht of all beacla.. 0 • (One d.ei/fUIl) ........••••......................... 506
(2) Heaclain _pie· ... 0 0 ••••••••••••• 0 •••••• 0 ••••••••• 0" •••••••••••• , ••••• - •••
1__ 1
Combine all Math from Unit' 1 ond 2.
)50;
I. Weight immedilltely after thrahing .,. (OMd.eirnJll) .. 0 0 0 ••••••••••••••••••• _ ••••••••• Grama _, _
YES0 00 to 3bII Item 311", thin 2c? •••••••
NO 0 STOP - Notify S"pmJ;'or.
508b. Weight immldilltlly before moisture tilt •••••• (OM d.e/mol) ..• 0 •••• 0 •••••• 0 0 •••••••• Grum
509c. Moilture alntent 1/ 0 •• (OM d.e/mol) ... 0 ••••• 0 0 ••••••••••• 0 0 0 •••••••• 0 • 0 •• 0 ••• Pet'cent
d. 11Irahlng 10. Idjunment flctor (On. d.e/mol) 0 0 ••••••• 0 •• 0 0 ••••••••• 0 ••••••••••• Percent
11 If IOmpl. _i6ht ;. too ,,,,,,11for mo"t •••• tut, , ••(fieient pain of hown mout •••.•contentlllillM oddeato the ",mple ,o"thot 0 mo;'". •.• tut con be mode. 771e mo;.t ••re content oftIN .",ple con then be derived wi", th" followi", forrnultJ:
(A +B) D - (S-C)E- _
A
510
Where A· lfi"i6ht of ,rnolllOmpl" (ite", 3b)B· Wei,fht of odditional ITO," •• q••ired (ormOllt•••e tut. _
C - Jloilt ••••percent o( BD • Jlo;'tun perc.nt of A +B combiMdE - R.ult - - Jloiltur. perc.nt of .moD
_pie (mter jn tt.m 3c)
Oro ••••
Oro ••••
hrcent_______ hrc.nt
_______ hreent
lAb Technician _
23

UNITEDITATEI DEPARTMENT OF AGRICULTUREITATlIT1CAL REPORTING IERYICE
FOAM D: AICE YIELD SURVEY - 1982POST-HARVEST INTERVIEV'I
MONTH CODE
For•••Appr_O.M.8. Nu_ 1535.oסI8
""'.1 2Got.1 •••••. 3••••••.1••••••• 4DIc. 1 •••••• .IS
YEAR. CROP. FORM,MONTH11-41
Buller tIIII year. I (or a re~tath. fromoar office) contacted you lUld_de ao_ COUDtaOIIlma11.lIDitaIn one o( ,our rice fteIda. I wouldBke to IIDowbow ,our crop turned out In tIIII field.
~
700.. I ).... -'
••••••••••••................... ;_7_1 _
1. .I11ter from (Form A. Item S)
11m" FIIlcl Number I AcnI for Grein I e__
2. How _ny _ of rice __ lor will bel h8rw1ted for lraln from this fillcl .•.•••.••....•.•
If It.", 2 Iadiff". ••t fro •••It.", I, oM It •••• S. If 1I0t.,'lip to It.", .•.
DO NOT CHANGE ITEM 1.
a. E.rlier In the crop .,..r litem 1) .cr •• _ ...corded. being intllldedfor "'"-t II grain. Can you II" me. _ for the differ.nee?
Act. r_0_6 e
_
II. On..., cine _ or will hen" be oompIned In this field? _
1607
•. How _ny b••••••••_. ",,""ed from"'" litem 21 ? •.•.•...• Toul •••••••• _
If o".,.to, hldiCClt. yield ])«' oer•• multiply by /IanIeet.d oera~ dd.rmiM totol bIllM". BIlow you, _'*..
6. W. productlon •••••• iMd from WlIighttick.,. V•• 0-1 No 0-2 ..•..•..•..•.• Enter Code
How 1608e. from =-~.'.~~.~~II. ~~.t~.~ ....••••••...••.•.•.•.••••.•.••• TOI8I Bushel •••• , _
7. Then the tOI8I bustlel. henested lor llqlKtedl fromthlsflllcl is IItemS4 +1) ..........•...••....•.... Total Bush.I.1 I
8. WhIt_the molttureoontent of the hIrY.ned rice .•.....••....•••..•••.•••••..•...•••..•• .1_6_
1° _OFFICE USE ~_04 _
(Mollth ond Day)
10.•• this fiIId with • -..blne equlpld with
I •••••••••••• ? v.0 - 1 No 0 -2 Ent. Code
11. W. thin Iny IignIficInt ••••••• In thII fIelcIfrom"-'s,III", ~,lodgIng or other _? .......•.•.•....•.•.••••••.•••..• Enter Code
" y•• ll*ify the _In __ tal of•••••• Ending TIme
STATUS CODE
11111 I
~1,~, , 1
I
E_retor _ CODE r_·:',, _
24
UNITED STATES DEPARTMENT OF AGRICULTURESTATISTICAL REPORTING SERVICE
FORM E: RICE YIELD SURVEY - 1982
POST-HARVEST GLEANINGS
For", .--.. ••••O. M. 8. N•••• I35.ooBI
EAR. CROP{ FORM. MONTH,''')
t7
0Da" ( ,1. -------
118rting Tim. (Military Tlmel , _7_1 _
'tIN pMt'Mrwtt firld ,Ironing. ,hould br complrtrd Of ,oon oftrr M"",t Of poaiblr. pnfvob/Y within thne doy. o(trr Mrwlt.If the cmplr field 11M bern plowed. diM:edor pGltured ,inee Mroelt, •• /rct on o/trrnotr field for ,'-ning if OM U owilobl. in the tract.
MONTH COOE
Aut. 1 •••••••••• 11Ipt.1 •••••••••• 2Oct. 1••••••••••• 3Nov. 1•••••• _ •• 4Doc.1 ••••••.•••• 11
217 _
UNIT LOCATIONSUnit 1
Number of..- .Iong edge of field .......•............•......•. f~~Number of ..- into field .......•....................•...... E
WidttlecrOll 5 row IpeceI (mNlUre t Idlmnce from mlb In Row 1 to 04. 705mlb In Row 61...•.....•..•.••..•....... PHI and Tentha --------"
Unit 2
I• I
GLEANINGS tp/4C1 oll,leoning. (rom both unit, in one poper boI.)
1. PICK UP IN •• All unthr.hed whole heed.BOTH UNITS: b. All plrtly threshed heed.
c. All 1_ rice gr,lns
CHECK( ) CHECK( )FIELD NOTES: If poat-Mrwlt obl~tioftl cannot b. mod'. giue r_n here. Indk4tr if oltrrnot.
(Wid _ •• Iected.
)772
Enumeretor Ending Time (Military Timel ,---------'
MAlL ,koning, in cloth mIIilinglOCh ond thu Form E in oddrl_d .nwlope to STA TE LASaRA TOR Y.
STATUS CODE •••••••
CODE t_o_.....- .....--
2. Toul w••••.•t of hMdI. kernel •• nd dIIIff in plpIr beg •••• (On. Deeimol) ..........••..•..•..•••• , GtamI
3. Weight of threshed ."In •••••• (One Deeimlll)............................................• GtamI
4. Moilture IlOntent ••••••••••• (On. Deeimlll) ..•••••••• , ••••.••.•••••.••..•••••••••.•••••••Ifcmpk, combined for moutun tm,Ihowcmpl. numbrrl combined: ------------DO NOT Ihow combined •• mpte M~tI in Item 2 01 3.
•80
Dete Ane'yzed •••' --'lAb Technicien _
REGIONAL LABORATORY DETERMiNATIONS
25

5.3 Survey Evaluation Porm
Please fill out this questionnaire at the end of the survey period. Your cOlDlllentswill be used in planning future Rice Objective Yield Surveys. Please give a greatdeal of thought to your answers. If you need more space for your answers, writeon the back, or attach another sheet of paper.
1. Were the instructions in the enumerator's _nual clear? If not which sectionsneed improvement?
2. Doyou have any suggestions as to how to improve the count, unit location, orpostharvest gleaning procedures?
3. If you worked on the rice survey last yar, do you prefer walking down theditches as was done this year, or walking into the field from the edge of thefield (the way it was done last year)? Why?
4. Are the supplies and equipment you were given adequate? If no, what othersupplies do you need?
Are there supplies and equipment that you have now that you do not need?
5. W~afarmer refusal a problem?
6. Doyou have any _jor concems with the rice llOrk (safety, field a-ge, post-barveat gleanings, unit location, etc.)?
26

APPENDIX II
CODE 1 -PRE-BOOT
CODE 2 -EARLY BOOT
Maturity Code Descriptions
This is a general category in which you will record all units wheretillers are only an inch or two high, up to where stalks do not indicateany swelling and DO NOT HAVE the definite flag leaf or other evidenceof a partly developed head inside the leaf sheath.
Stalks are starting to joint and joints can be seen easily. A partlydeveloped head may be detected by noting that the stem has startedswelling below the foliage leaf. This swelling may also be felt insidethe sheath. Be careful not to damage the partly developed head bysqueezing the stem or sheath.
In most cases the presence of heads enclosed in the leaf sheath could beverified by going outside the unit and examining stalks that are similarin appearance to the doubtful ones before classifying the unit in theEARLY BOOT stage. Clip a few stalks, unroll the leaf sheath and seewhether or not there is a small, partially developed head encased in theshea tho
CODE 3 -LATE BOOT-FLOWER (HEADSEMERGED) INCLUDESWATERY KERNELS The head has moved up the stem and swelling has occurred above the
base of the top foliage leaf. The sheath will split and the head willpartially or wholly emerge. The flower stage occurs soon after thehead emerges and small blooms or flowers begin to open at the base ofthe head and blooming progresses toward the tip. For our purpose,consider the unit to be in the late boot or flower stage from the timeswelling can be seen or felt above the top foliage leaf until the heademerges and the watery clear liquid in the kernel has begun to turnmilky.
CODE 4 - MILK Kernels are formed in heads. Kernels of grain are soft, moist andmilky. When the grain is squeezed, a milky liquid can be observed. Theplant is still generally green.
CODE 5 - SOFT DOUGH The grains can be crushed between the thumb and fingernail; thecontents of most of the GRAIN are SOFT with ONLY A FEW GRAINSPER HEAD containing any milky liquid.
CODE 6 - HARDDOUGH
CODE 7 - RIPE
The grain is FIRM and though it may be dented by pressure of thethumbnail, it is NOT EASILY CRUSHED.
Ripe -- straw and leaves may be green or partly green but averagemoisture in grain is about 2096. Grains at base of head may be in hard
27

CODE 8 - BLANK
dough stage whereas riper grains in upper portions of the head will berelatively hard. Most of grains will have taken on a mature color butthere may be a slightly green color on lower grains. The straw, and to alesser extent the leaves, may remain fairly green when the grain isconsidered mature.
This maturity code is used for fields with blank areas where the samplefails. There will be no plants in the sample unit.
<0 u.s. GOVERNMENT PRINTING OFFICE: 1983-420-g29:SKS-IJ90
28