Embed Size (px)
Citation preview

i
Ricardo Filipe Morgado de Sousa
Conception and implementation of a
new facility for the manufacture of a
novel dosage form
Dissertation presented to the University of Coimbra to
complete the necessary requirements to obtain the
degree of Master Biomedical Engineering
Project Coordinator: Professor Sérgio Simões, PhD
Project Supervisor: Cláudia Sousa, PhD
Coimbra, 2015

ii

iii
THIS WORK WAS DEVELOPED IN COLLABORATION WITH:

iv

v
Esta cópia da tese é fornecida na condição de que quem a consulta reconhece que os
direitos de autor são pertença do autor da tese e que nenhuma citação ou informação
obtida a partir dela pode ser publicada sem a referência apropriada.
This copy of the thesis has been supplied on condition that anyone who consults it is
understood to recognize that its copyright rests with its author and that no quotation
from the thesis and no information derived from it may be published without proper
acknowledgement.

vi

vii
À minha mãe, à minha avó.
Ao Bruno e ao meu pai.

viii

“É chegado o Fim do Fim
O Fim que até ao Fim
Apesar de não ter Fim
Não deixou, enfim
De ter um princípio, meio e Fim”
Fernando Morgado

x

Abstract
Studies point that patient adherence to medication is still a big challenge to the pharma
industry, since 50-60% of chronic patients in the USA admit not to comply with the
prescribed therapy. For this reason pharmaceutical companies have turn their R&D
efforts to patient centric dosage forms aiming to improve therapeutic outcomes by
improving patient compliance.
One of the most promising technologies in this field are Oral Thin Films (OTFs), a solid
dosage form for fast or sustained drug release in the oral cavity. Currently there are
almost 10 products in the market and OTFs are generally well accepted by the
population, due to their unique advantages. OTFs are easy to swallow, there is no need
of water for the administration, they present a good taste and mouth feel and they may
improve medicines safety through a reduction in their side effects. Due to these
advantages they are particularly suitable for those patients with swallowing difficulties,
such as the elderly, children and patients with neuron motor diseases.
In this dissertation it is explored the manufacturing process of OTFs, in order to identify
the necessary requisites for the implementation of a new manufacturing facility for the
development and commercial scale production of OTFs. Thereby, a specific aim of this
work was to understand the types of equipment necessary, how they work and which
models are available in the market.
Through an intense research and procurement process it was possible to analyze 39
different types of equipment, to study their critical process attributes and to estimate
their capacity. Finally we were able to determine the necessary investment, to outline
the design of a manufacturing facility and to trace a road-map for its implementation.
Keywords: Pharma Industry, Manufacturing, Engineering, Oral Thin Films.

xii

Resumo
Estudos mostram que a adesão dos pacientes à medicação é ainda um grande desafio
para a indústria farmacêutica, sendo que 50-60% dos pacientes crónicos nos EUA admite
não cumprir devidamente a terapêutica prescrita. Desta forma, as empresas
farmacêuticas têm direcionado a sua investigação para novas formas farmacêuticas
centradas no paciente.
Uma das tecnologias mais promissoras neste campo é os Oral Thin Films (OTFs). Os OTFs
são uma forma farmacêutica sólida para libertação rápida ou controlada do
medicamento na cavidade oral. Atualmente há já cerca de 10 produtos no mercado,
sendo que esta nova forma farmacêutica tem sido bem recebida pela população, devido
sobretudo às suas vantagens únicas. São fáceis de engolir e não há necessidade de beber
água, têm sabor agradável e podem melhorar a segurança do medicamento, ao reduzir
os seus efeitos secundários. Devido a estas vantagens, os OTFs são particularmente
adequados para administração em pacientes com dificuldades em engolir, como idosos,
crianças e pessoas com doenças neuro-motoras.
Nesta dissertação é explorado o processo de fabricação de OTFs, com o objetivo de
identificar os requisitos necessários para a implementação de uma nova unidade de
fabrico para o desenvolvimento e produção comercial de OTFs. Assim, uma parte
específica deste trabalho foi tentar perceber qual o tipo de equipamento necessário,
como funciona e quais são os modelos disponíveis no mercado.
Através de uma intensa pesquisa e procura de mercado, foi possível analisar 39
equipamentos de vários tipos, estudar os seus aspetos críticos e estimar as suas
capacidades. Por fim foi possível determinar o investimento necessário, esboçar o
desenho da nova unidade e traçar um road-map para a sua implementação.

xiv

Acronyms
API – Active Pharmaceutical Ingredient
CMO – Contract Manufacturing Organization
CQA - Critical Quality Attributes
EMA – European Medicine Agency
GMP – Good Manufacturing Practices
HEPA – High Efficiency Particulate Air
OEE – Overall Equipment Effectiveness
OTC – Over-the-Counter medicines (No prescription needed)
OTF – Oral Thin Films
Rx – Prescription Medicine
TDDS – Transdermal Drug Delivery Systems
USA – United States of America
USFDA – Food and Drugs Association of the USA

xvi

Table of Contents
ABSTRACT .............................................................................................................................................XI
ACRONYMS ......................................................................................................................................... XV
TABLE OF CONTENTS ......................................................................................................................... XVII
LIST OF TABLES .................................................................................................................................. XIX
LIST OF GRAPHICS .............................................................................................................................. XXI
LIST OF FIGURES ............................................................................................................................... XXIII
1 INTRODUCTION ............................................................................................................................ 2
1.1 SCOPE ............................................................................................................................................... 2
1.2 MOTIVATION ..................................................................................................................................... 2
1.3 ABOUT BLUEPHARMA .......................................................................................................................... 3
2 THEORETICAL BACKGROUND ........................................................................................................ 6
2.1 PATIENT CENTRIC DOSAGE FORMS........................................................................................................... 6
2.2 ORAL THIN FILMS ................................................................................................................................ 8
2.2.1 Formulation .......................................................................................................................... 9
2.2.2 Manufacturing Process ....................................................................................................... 11
2.2.3 Packaging of OTFs .............................................................................................................. 14
2.2.4 Market Perspectives ........................................................................................................... 16
3 OBJECTIVES ................................................................................................................................. 20
4 METHODOLOGY .......................................................................................................................... 22
4.1 SEARCH METHOD .............................................................................................................................. 22
4.2 PROCUREMENT PROCESS .................................................................................................................... 25
4.3 IDENTIFICATION OF THE CRITICAL REQUISITES ......................................................................................... 26
4.4 CAPACITIES ESTIMATION ..................................................................................................................... 27
4.4.1 Coating Equipment ............................................................................................................. 27
4.4.2 Primary Packaging Equipment............................................................................................ 33
4.5 OUTLINE DESIGN OF THE MANUFACTURING FACILITY ............................................................................... 34
4.6 BLUEPHARMA FORECAST AND ROAD-MAP ............................................................................................. 34
5 RESULTS AND DISCUSSION ......................................................................................................... 38
5.1 IDENTIFICATION OF CMOS AND POSSIBLE SUPPLIERS ............................................................................... 38
5.2 THE PROCUREMENT PROCESS .............................................................................................................. 40

xviii
5.2.1 Mixing Equipment ............................................................................................................... 40
5.2.2 Coating Equipment ............................................................................................................. 41
5.2.3 Primary Packaging Equipment............................................................................................ 42
5.2.4 General Analysis ................................................................................................................. 42
5.3 IDENTIFICATION OF THE CRITICAL REQUISITES .......................................................................................... 44
5.3.1 Mixing Equipment ............................................................................................................... 44
5.3.2 Coating Equipment ............................................................................................................. 55
5.3.3 Primary Packaging Equipment............................................................................................ 61
5.3.4 Final Remarks ..................................................................................................................... 70
5.4 CAPACITIES ESTIMATION ..................................................................................................................... 71
5.4.1 Coating Equipment Capacities ............................................................................................ 71
5.4.2 Packaging Equipment Capacities ........................................................................................ 76
5.4.3 Final Remarks ..................................................................................................................... 80
5.5 BLUEPHARMA FORECASTS ................................................................................................................... 81
5.6 EQUIPMENT CAPACITY V.S. BLUEPHARMA FORECASTS ............................................................................. 83
5.6.1 Coating Equipment ............................................................................................................. 83
5.6.2 Primary Packaging Equipment............................................................................................ 85
5.6.3 Final Remarks ..................................................................................................................... 86
5.7 ROAD-MAP ..................................................................................................................................... 86
5.8 INVESTMENT ANALYSIS ....................................................................................................................... 88
5.9 OUTLINE DESIGN OF THE MANUFACTURING FACILITY ............................................................................... 91
5.9.1 Final Remarks ................................................................................................................... 100
6 CONCLUSIONS .......................................................................................................................... 102
6.1 MAIN CONCLUSIONS ....................................................................................................................... 102
6.2 PERSONAL CONSIDERATIONS ............................................................................................................. 103
6.3 FUTURE WORK ............................................................................................................................... 104
7 S.W.O.T. ANALYSIS ................................................................................................................... 106
8 REFERENCES.............................................................................................................................. 110
List of Tables
Table 1 - Typical composition of an oral thin film (16). ............................................ 10
Table 2 – List of websites and platforms used for macro data search, divided by area.
.............................................................................................................................. 23
Table 3 - List of websites and platforms used for micro data search, divided by area.
.............................................................................................................................. 23
Table 4 - Available working time considered to estimate the equipment capacity. .. 29
Table 5 - Considered downtime for the coating machines. This values result from the
conversations with the suppliers. ........................................................................... 29
Table 6 - Principal causes that affect directly the OEE. ............................................. 31
Table 7 - Considered values for each OEE factor and the respective OEE result, for an
operation of 2 and 3 shifts. ..................................................................................... 32
Table 8 - Resume of the procurement process for the mixing equipment. ............... 40
Table 9 - Resume of the procurement process for the coating equipment. .............. 41
Table 10 - Resume of the procurement process for primary packaging equipment. . 42
Table 11- Some numbers that describe the intense contact with equipment suppliers
and the number of machines analyzed. ................................................................... 42
Table 12 - Specifications of the quoted mixing laboratory equipment. .................... 52
Table 13 - Specifications of the quoted mixing pilot equipment. .............................. 54
Table 14 - Specifications of the coating equipment for pilot scale. ........................... 59
Table 15 - Specifications of the coating equipment for commercial scale
manufacturing. ....................................................................................................... 60
Table 16 - Specifications of the pilot web converting and packaging equipments. .... 69
Table 17 - Specifications of the commercial scale web converting and packaging
equipment. ............................................................................................................ 70
Table 18 - Annual capacity of each pilot coating equipment considering 2 shifts and 3
shifts. ..................................................................................................................... 72
Table 19 - Annual capacity of each pilot coating equipment considering 2 shifts and 3
shifts. ..................................................................................................................... 74
Table 20 - Annual capacities of the pilot primary packaging machine, in number of
OTFs. ...................................................................................................................... 77

xx
Table 21 - Annual capacities of the industrial primary packaging machine, in number
of OTFs. .................................................................................................................. 79
Table 22 - Bluepharma OTFs sizes and areas. .......................................................... 82
Table 23 - Bluepharma's forecasts for each product. ............................................... 82
Table 24 - Bluepharma's sales forecast converted to area of film. ........................... 83
Table 25 - Confrontation between the pilot coating equipment capacities and the
company's forecasts. .............................................................................................. 83
Table 26 - Confrontation between the industrial coating equipment capacities and the
company's forecast. ............................................................................................... 84
Table 27 - Confrontation between the pilot primary packaging equipment capacities
and the company's forecast. ................................................................................... 85
Table 28 - Confrontation between the industrial primary packaging equipment
capacities and the company's forecast. ................................................................... 85
Table 29 - Total investment range and average value for setting up the new
manufacturing facility............................................................................................. 90

List of Graphics
Graphic 1 - Comparison between first identified equipment manufacturers and the
selected. ................................................................................................................ 43
Graphic 2 - Geographical distribution of the selected suppliers, by country. ............ 43
Graphic 3 - Number of different models analyzed by type and by scale. .................. 44
Graphic 4 - Calculated annual capacity for each pilot coating equipment, considering 2
or 3 shifts and respective averages. ........................................................................ 73
Graphic 5 - The annual capacities of each industrial coating equipment, working in 2
or 3 shifts and respective averages. Also it's represented the average of the 3 shifts
operation of pilot equipment. ................................................................................ 75
Graphic 6 - Number of OTFs that correspond to the produced area of each pilot coating
equipment. A standard size of 20x30mm per OTF was considered as well as a film
waste of 20%. ......................................................................................................... 75
Graphic 7 - Number of OTFs that correspond to the produced area of each industrial
coating equipment. Was considered a 20x30mm OTF and a film waste of 20%. ....... 76
Graphic 8 - The annual capacities of the pilot equipment for primary packaging and the
respective averages, in number of OTFs and considering a standard strip of 20x30 mm.
.............................................................................................................................. 78
Graphic 9 - The annual capacities of the industrial equipment for primary packaging in
number of OTFs and the respective averages. It was considered a standard size of
20x30 millimeters. .................................................................................................. 79
Graphic 10- Bluepharma's Forecasts from 2018 to 2025. ......................................... 81

xxii

List of Figures
Figure 1 - Factors that influence patient adherence to therapy (2). ............................ 6
Figure 2 - Some examples of strategies to improve patient compliance (3,4). ............ 6
Figure 3 -Schematic of the solvent casting method in a continuous machine (18). ... 12
Figure 4 - Diagram of the hot melt extrusion process for the production of OTFs (18).
.............................................................................................................................. 13
Figure 5 - One OTF and different types of packaging material. ................................. 14
Figure 6 - Diagram of the web conversion and packaging in a primary packaging
machine (20). ......................................................................................................... 15
Figure 7 - Snapshot of Cortellis database................................................................. 24
Figure 8 - Snapshot of Newport database................................................................ 24
Figure 9 - Illustration of the Overall Equipment Effectiveness (OEE) logics. .............. 30
Figure 10 – Geographical distribution of the OTFs contract manufacturers
organizations (CMOs) and the identified equipment suppliers. ............................... 39
Figure 11 – Example of a mixing equipment with an anchor agitator. ...................... 45
Figure 12 - Schematic representation of a mixing equipment used for the production
of OTFs. Legend on the left side. ............................................................................ 46
Figure 13 -Example of an anchor agitator for laboratory scale. It is also visible the wall
scrapers in white. ................................................................................................... 47
Figure 14 - Detail of an anchor agitator for pilot scale mixing. Besides the external
anchor, it's possible to notice the internal counter rotating agitator. ...................... 48
Figure 15 – Dispersion head. a) Representation of what happens in the dispersion
head, showing the smaller particles being expelled at high velocity. b) Representation
of the rotor stator system. The rotor moves at high velocity sucking the mixture and
then expelling it through the slots in in an in the stator, making the mixture to spilt
into disperse phase. ............................................................................................... 49
Figure 16 - Different operation modes of homogenizers. a) Shows a batch disperser
placed on top of the vessel. b) In-line homogenizer, connected to the bottom of the
vessel. It creates an external circulation of the mixture. .......................................... 50
Figure 17- Example of an industrial scale coating machine. ..................................... 55
xxiv
Figure 18 - Scheme of the coating machine path since the uncoated web to the final
coated film. ............................................................................................................ 56
Figure 19 - Representation of three different coating systems: a) Knife Coater, b) Slot
Die and c) Reverse Roll. .......................................................................................... 58
Figure 20 - A scheme of a coating equipment similar to the P.B-I1, a two store complex
where the machine parts are inserted. ................................................................... 61
Figure 21 - Outlook of a pilot scale web converting and primary packaging machine.
.............................................................................................................................. 61
Figure 22 - Layout of an industrial equipment of primary packaging OTFs with the
respective legend. .................................................................................................. 62
Figure 23 - Detail of a primary packaging machine. a) Initial coated film; b) the film
divided in several lanes; c) packaging material. ....................................................... 63
Figure 24 - Detail of a primary packaging machine. The OTFs strips already cut on the
top of the release liner are then trasfered to the bottom packaging material and closed
with the upper packaging material. ........................................................................ 64
Figure 25 - Detail of an in real time inspection tool. In this case it measures the size of
the strips in order to know if it was cut correctly. ................................................... 67
Figure 26 - Layout of a pouch with an OTF strip inside. Both dimensions represent the
standard for this particular product. ....................................................................... 68
Figure 27 - Project Road-Map until 2025. It's possible to see the products launch and
the equipment needs. ............................................................................................ 87
Figure 28 - Investment range table. Each range displays the lowest and the highest
budgetary quotation received for that type of equipment and its respective scale. . 88
Figure 29 - Road-Map of investment. Shows the necessary investment needed in order
to fulfil the sales forecasts. In the bottom is also possible to see the global investment
range. It is only considered the investment in equipment. ...................................... 89
Figure 30 - Design of a laboratory for the development of OTFs with approx. 25m2 of
area. a) mixing equipment. b) lab coating machine. c) lab primary packaging machine.
.............................................................................................................................. 91
Figure 31 - Draw of a medium industrial installation for the production of OTFs with
approx. 432m2 of area. ........................................................................................... 92

Figure 32 - Quick view of the manufacturing process flow. Each number has the
correspondent legend on the right. ......................................................................... 93
Figure 33 - Outline concept design of a facility for the development and production of
OTFs at lab, pilot and industrial scale. ..................................................................... 94
Figure 34 - Outline concept design of a facility for the development and production.
The letters and number in this figure help to understand the following text ............ 95
Figure 35 - Bluepharma's OTFs project S.W.O.T. analysis. ...................................... 107


CHAPTER 1
Introduction

INTRODUCTION
2
1 Introduction
1.1 Scope
This dissertation is the result of the project carried out by the student Ricardo Filipe
Morgado de Sousa for the conclusion of the Master’s Degree in Biomedical Engineering.
The project started in November of 2014 and corresponded to a trainee of 9 months in
the pharmaceutical company Bluepharma, Indústria Farmacêutica S.A.
The supervision of the work developed was in charge of Professor Sérgio Simões from
the Faculty of Pharmacy of the University of Coimbra and Dr. Cláudia Silva, Head of
Research of Bluepharma.
The project was named “Conception and implementation of a new facility for the
manufacture of a novel dosage form”.
1.2 Motivation
It was always been an intention of mine to have an enterprise experience while I was
studying in the University of Coimbra. It is my vision that we should do different things
in college that can contribute to other skills that we will not get inside the classrooms.
That’s why I choose to go abroad under the Erasmus program, to get involved in
Associação Académica de Coimbra and to participate in several national and
international programs.
As a future engineer, it was also my intention to try to have an enterprise experience in
an industrial company. In addition, I was always interested in the pharmaceutical
industry in particular, because of the importance that plays in the World and by the
extreme rigor that is associated to this area.
All of this made me send my curriculum vitae to Bluepharma. I knew the success history
of this young, prestigious and innovative company in Coimbra and I was sure that it
would be the best option to do my Master’s project. All of these are the motivations
that made me accept such a challenging project, a decision I don’t regret at all.
INTRODUCTION
3
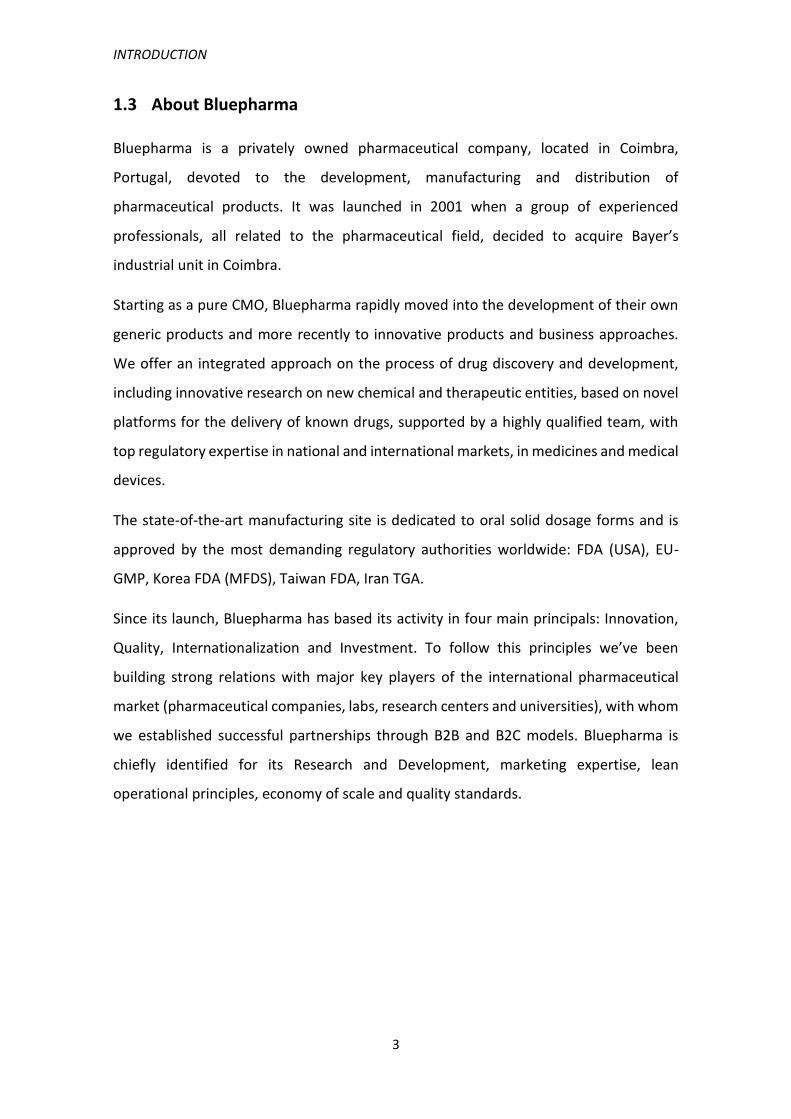
1.3 About Bluepharma
Bluepharma is a privately owned pharmaceutical company, located in Coimbra,
Portugal, devoted to the development, manufacturing and distribution of
pharmaceutical products. It was launched in 2001 when a group of experienced
professionals, all related to the pharmaceutical field, decided to acquire Bayer’s
industrial unit in Coimbra.
Starting as a pure CMO, Bluepharma rapidly moved into the development of their own
generic products and more recently to innovative products and business approaches.
We offer an integrated approach on the process of drug discovery and development,
including innovative research on new chemical and therapeutic entities, based on novel
platforms for the delivery of known drugs, supported by a highly qualified team, with
top regulatory expertise in national and international markets, in medicines and medical
devices.
The state-of-the-art manufacturing site is dedicated to oral solid dosage forms and is
approved by the most demanding regulatory authorities worldwide: FDA (USA), EU-
GMP, Korea FDA (MFDS), Taiwan FDA, Iran TGA.
Since its launch, Bluepharma has based its activity in four main principals: Innovation,
Quality, Internationalization and Investment. To follow this principles we’ve been
building strong relations with major key players of the international pharmaceutical
market (pharmaceutical companies, labs, research centers and universities), with whom
we established successful partnerships through B2B and B2C models. Bluepharma is
chiefly identified for its Research and Development, marketing expertise, lean
operational principles, economy of scale and quality standards.

INTRODUCTION
4

INTRODUCTION
5
CHAPTER 2
Theoretical Background

THEORETICAL BACKGROUND
6
2 Theoretical Background
2.1 Patient centric dosage forms
Studies from 2010 show that in the USA the patient adherence to therapies for chronic
conditions is low, in the order of 50-60%[1].
There are several types of factors that influence the adherence of a patient to a certain
therapy that can be related with the patient himself or even with its social status. Some
of those impacts are described in the Figure 1.
Figure 1 - Factors that influence patient adherence to therapy [2].
To give a response to this problem, the pharmaceutical industry has been seeking new
solutions in order to improve the patient compliance to therapy.
Figure 2 - Some examples of strategies to improve patient compliance [3], [4].
New formulations to improve product profile
•Side effects reduction
•Taste masking
New delivery technologies
•Orodispersible tablets, edible films
•Transdermal patches
•New inhaled formulations, sprays
Smart packaging solutions
•packs with reminder function
•Easier to open/carry packages
Use of friendlier language for information
•Use of mobile apps and web sites to raise awareness and monitoring

THEORETICAL BACKGROUND
7
In the Figure 2 it can be seen some examples of strategies that have been developed. In
this project we will explore a novel oral drug delivery system.
New drug delivery systems represent one of the major research areas in the
pharmaceutical and biomedical industries [5]. Nowadays, pharma industry seeks to
improve drug stability, oral bioavailability and to decrease the incidence of drug’s side
effects [6]. Moreover some of these new dosage forms enable to increase its efficiency
through a controlled release of the drug and may improve patient compliance.
As commonly known, the oral route of drug administration is the most preferred by the
general population [7]. However 28% of the patients have some problems in swallowing
tablets and capsules (dysphagia) [8]. These patients include the elderly who have
difficulty ingesting conventional oral dosage forms mainly due to hand tremors and
dysphagia; children who are afraid to take the solid dosage forms due to the muscular
and nervous underdevelopment; mentally ill; patients with developmental delay and /
or less cooperative; patients with treatment regimens with low intake of liquids;
patients with reduced salivary secretion and travelers who may not have easy access to
the water [9]. Also dysphagia is associated with several medical conditions, like AIDS,
Parkinson’s, head and neck therapy by radiation, thyroidectomy and several other
neurological conditions [10].
Oral drug delivery systems represent more than 52% of the global market share of all
the drug delivery systems and it is estimated that their market value will reach 90 billion
euros by 2016 [11]. All these reasons make the oral drug delivery systems a very
appealing area to invest, in a market with strong competition and billions of investments
in drug development.
In this project, we will explore the manufacturing process of one particular novel oral
dosage form that is currently being developed at Bluepharma, Indústria Farmacêutica,
S.A. – Oral Thin Films (OTFs).

THEORETICAL BACKGROUND
8
2.2 Oral Thin Films
In the late 1970s, the first fast dissolving drug delivery systems were developed, in order
to work as an alternative to capsules and tablets, namely for geriatric and pediatric
patients [10]. Fast dissolving thin films appeared in 2001, first as breath fresheners,
when Pfizer first launched the Listerine® PocketPaks. Nine years would have to pass so
the first OTF accepted for medical prescription was released on the market – Zuplenz®
was launched in 2010 in the United States [12].
Currently, there are several types of OTFs. Depending on its purpose of action they can
be named by the following terms [4]:
Orodispersible Films:
o Non-mucoadhesive
o Mucoadhesive: absorption in the gastrointestinal tract
Oral-Mucosa Films (Buccal, Sublingual or Palatal Films):
o Mucoadhesive: absorption in the oral cavity, for fast onset action.
Generally speaking, Oral Thin Films are a solid dosage form for fast or sustained release
in the oral cavity. The USFDA describes it as a flexible polymeric strip that contains active
pharmaceutical ingredients (APIs), which are intended to be placed on the tongue for
fast disintegration for dissolution in the saliva before swallowing for delivery in the
gastrointestinal tract [13].
The user-friendly characteristics of OTFs make it a good option for specific target groups,
as very young children and geriatric population [4]. Also patients with dysphagia and
motor neuron diseases can benefit from this dosage form. Some of the advantages for
the patients are [4], [14]:
No need of water or spoon for administration, compared with tablets or syrups,
and no need of chewing;
Dose accuracy, because each strip as the precise dose that should be
administrated;
Good taste due to taste masking agents in the formulation, that makes it more
acceptable for children;

THEORETICAL BACKGROUND
9
Easy to carry and to keep, due to its small size, flexibility and packaging options;
Due to its fast dissolution, it’s difficult to spit out, what makes it a suitable option
for difficult patients that tend to reject the medication.
Clinically speaking, there are also clear advantages of using OTFs as a delivery system
[4], [14]:
The fast onset action allows the drug to enter in the systemic circulation directly
in the mouth;
Improved oral bioavailability and reduced side effects. Some OTFs promotes the
absorption of the drug in the oral mucosa reducing hepatic first pass effects and
in these cases the drug dose can be reduced;
Oral Thin Films can also be an advantage to pharmaceutical companies from the market
point of view. If an OTF product presents a different pharmacokinetic profile compared
with the product already in the market, it is considered a new medicine and it follows
the FDA 505(b)(2) approval pathway, where a new clinical study it’s required but
preclinical toxicity studies are not needed, because the molecule it’s the same. This
means that the approval process it’s faster and plus, an exclusivity marketing
authorization of 3 to 5 years it’s can be conceded, so no competitor can launch that
same drug in OTF dosage form during the defined exclusivity period [4], [15].
Nonetheless, as all dosage forms, OTFs have also some limitations.
The main limitation is the small amount of drug that may be incorporated per OTF.
Although some companies managed to introduce up to 50% of drug substance per film
weight, the best case reported was Novartis Gas-X Strips® with 62,5mg of drug
substance into a strip [4], [14]. This means that high doses medicines cannot be
developed in OTFs.
2.2.1 Formulation
One key component of OTFs is the film forming polymer. In fact, OTFs are basically a
polymeric matrix that can have one or more polymers with different properties,
depending on the characteristics that we want to incorporate in them, like the drug load

THEORETICAL BACKGROUND
10
capacity, disintegration time, mucoadhesiveness, elasticity and others. Currently, the
polymers used can be natural derivative polymers of cellulose or starch but can also be
used semi-synthetic or synthetic polymers [4]. The choice of the most suitable polymer
it’s one of the most important steps in the development of OTFs.
Beside the drug substance and the polymer, other ingredients are normally used in the
formulation of OTFs, like sweetening agents or plasticizers. The Table 1 resumes the
ingredients and their usual percentage in a typical OTF.
Water soluble polymer 45% ww
Drug 5 % to 30% ww
Plasticizers 0-20% ww
Surfactants q.s.
Sweetening agent 3% to 6% ww
Saliva stimulating agent 2% to 6% ww
Fillers, colorants, flavors, etc. q.s.
Table 1 - Typical composition of an oral thin film [16].
In both formulation and manufacturing processes there are several critical quality
attributes (CQA) that should be considered in the development of OTFs. These
parameters must be defined in the beginning of the development process. Some of
those CQAs are [4]:
Physical strength: the OTF must present suitable mechanical properties so it can
easily resist to the manufacturing process and consequently handling of the product.
Properties like tensile strength or elongation at break must be tested and the
appropriate values mostly depends on the polymer that is being used;
Stability: drug substance stability (physical, chemical and thermal) is very important
and can directly influence, for example, the manufacturing process, its conditions and
the choice of the polymeric matrix and the packaging material. The stability of the
product will determine, among other things, its shelf-life and the storage conditions;
Appearance: characteristics like the size, the color and shape must be considered.
For example, for OTFs that are intended to be placed under the patient’s tongue, the

THEORETICAL BACKGROUND
11
size should be small enough to be comfortable because the area available is very
small;
Drug release profile: it depends if the OTF is supposed to be dissolved quickly or to
be slowly released, or if the absorption should occur in the oral mucosa or in the
gastro intestinal tract;
Residual water content: an excess or lack of water can interfere with the mechanical
properties of the OTF. Each formulation should have the right amount of water to
ensure the desired mechanical properties. Suitable packaging material should be
taken into account to avoid water transference between the OTF and the surrounding
environment;
Organoleptic characteristics: OTFs can be delivered with a certain flavor
incorporated, what make it a good option for pediatric patients. However, the choice
of a pleasant option depends on the taste of the drug substance. Also, the market
target must be considered because flavor preferences can vary from region to region
and from age to age;
Dose uniformity: the dose uniformity depends on the formulation but also on the
size and thickness of the product. These parameters should be constantly controlled
in the manufacturing process so slight adjustments may be carried out.
2.2.2 Manufacturing Process
There are different manufacturing processes which are well documented in the
literature:
Solvent casting;
Hot melt extrusion;
Semisolid casting;
Solid dispersion extrusion;
Rolling.
Solvent casting and hot melt extrusion are the most commonly used.

THEORETICAL BACKGROUND
12
Solvent casting
Solvent casting, also known as film casting, is the most used manufacturing process for
OTF, being a relatively simple and low cost method [17]. In this process, an aqueous or
hydro-alcoholic mixture of excipients and drug substance(s) is casted on a surface,
where the solvents evaporate so the mixture becomes a solid thin film. After this, the
film is cut in strips with the desired size and shape [4]. During the internship in
Bluepharma, I had the possibility to see the manufacturing of OTFs in the laboratory,
using this method. The process goes as described below:
The mixture is prepared;
A sheet of a release liner is placed in the casting machine;
The mixture is spread along the substrate (release liner) with a proper slot or
knife with a uniform thickness;
The casting machine is heated in order to transfer the necessary energy to the
solvents evaporation;
In the end, the release liner with the OTF on top is removed from the coating
equipment and it is cut into individual OTF with the desired dimensions;
Finally, the release liner it’s peeled off manually from every strip and each
individual OTF is placed into an individual pouch that is sealed by heat.
In a higher scale, the casting machines are more complex, as showed in Figure 3.
Figure 3 -Schematic of the solvent casting method in a continuous machine [18].

THEORETICAL BACKGROUND
13
Like the image displays, the release liner roll is placed on the left and it is slowly
unwinded. Then it passes through an applicator that contains the formulation where the
mixture passes through a small clearance that makes the mixture to be spread with the
same thickness along the release liner. The release liner continues moving and enters in
a drying zone where the solvents are evaporated. Finally, the liner with the solid film is
winded in a new roll.
This method is appropriate for OTFs with high sensitive APIs, namely because the drying
process is made under relative low temperatures [18].
The machines responsible for this process at high production scales are called coating
machines. Thereby this process it’s commonly known as coating process, definition that
we will use in this dissertation.
Hot melt extrusion
This method consists in shaping a mixture of polymers, drug substance and other
ingredients into a film strip through a melting process that melts all components [4].
Figure 4 - Diagram of the hot melt extrusion process for the production of OTFs [18].
As seen in the Figure 4, the drug and the other ingredients are added in the solid state.
The extruder then homogenizes and heat the ingredients by the action of the extruder
screw that moves itself thanks to the motor, so the ingredients are mixed and fused.
Finally, the melted material is forced to pass by a flat die that presses the resulting film
into the desired shape [18], [19].
There are some limitations in this method, mainly because the ingredients are subject
to high temperatures which can cause thermal degradation. Plus, all the ingredients

THEORETICAL BACKGROUND
14
must be completely devoid of water or other volatile solvents. If not, the uniformity of
the film can be affected [18]. From the advantages point of view, this method is
appropriate for anhydrous processes and it tend to present better results in terms of
content uniformity [19].
Semisolid casting, Solid dispersion and Rolling
The semisolid casting is a method where a solution of a water-soluble polymer is added
to a solution of acid insoluble polymer, previously prepared under certain conditions.
Finally a gel mass is prepared by the addiction of a plasticizer and it is casted into films
using a heat source [15].
The solid dispersion method consists in the extrusion of immiscible components with
the drug, so a solid dispersion is obtained [19].
Finally, in the rolling method a solution or suspension composed mainly of water and
alcohol, also containing the drug, is rolled on a carrier. The films are then dried on the
rolls [15].
2.2.3 Packaging of OTFs
OTFs can be packaged in single units or multiple dose packages. Figure 5 shows some
examples of how OTFs can be packed.
Figure 5 - One OTF and different types of packaging material.

THEORETICAL BACKGROUND
15
Some examples of multiple unit options are the dispensers and the continuous roll
dispensers. Some of these solutions are even patented [14].
There are advantages and disadvantages in the way the films are packed. A single unit
package offers more stability and avoid possible fusion of the strips when compared
with multi dose solutions. Nevertheless, it is more expensive to produce single unit
solutions, mainly because more packaging material is necessary increasing the cost. The
multiple dose packaging solutions are more expensive to develop, but less expensive to
produce in high quantities [20].
Web Converting and Primary Packaging
Web converting and primary packaging are two different processes, although they occur
in the same equipment in the case of OTFs. The process it’s described in the Figure 6.
Figure 6 - Diagram of the web conversion and packaging in a primary packaging machine [20].
Figure 6 represents a web converting and primary packaging machine. At the laboratory
scale the cut and packaging of the OTFs may be done manually.

THEORETICAL BACKGROUND
16
The mother roll is the roll that comes from the solvent casting machine, as seen before.
In the first step this roll is divided in two or more lanes, which operate simultaneously.
Pilot machines, as we will see, normally just operate with one lane. The web keeps
running and then it is cut into individual strips with the desired size and shape. The
release liner is then peeled off from the cut film. All this process is called web conversion,
because the film roll is converted into small strips.
After that, each strip is placed into a small individual pouch, which is then sealed. This,
of course, in the case of single packaging process.
Secondary packaging
The secondary packaging is the process were the products are packed in the final
packaging format, conventionally in a carton box. It is done normally by cartoning
machines placed in the end of the primary packaging line. This equipment it’s similar to
the ones used in the production of other more conventional solid dosage forms, like
capsules or tablets.
2.2.4 Market Perspectives
Since 2013, more than 80 OTFs brands were launched, mainly in the USA and Asia.
However, most of this brands launched are Over-the-Counter (OTC) products. As we
have seen, just in 2010 was launched the first OTF for prescription (Rx) [14]. This first
product, Zuplenz ® (Ondansetron PharmFilm®) in the USA and Setofilm® (Ondansetron
RapidFilm®) in Europe, is an OTF for the prevention of nausea and vomiting and in its
first year it conquered a wide share of a market that generated 1.9 billion dollars in that
year [21]. The second Rx product launched was approved one month later. The
Suboxone® sublingual film, is an OTF with two drug substances (buprenorphine and
naloxone) for the opioid addiction, and was the confirmation of the success that OTFs
can have in the Rx market, generating sales of 513 million and 1.5 billion in 2011 and
2012 in the USA, respectively.
It was estimated that OTF Rx market experimented an annual growth of 17.1% from
2009 to 2014. Also, during the period from 2009 to 2019 it is expected that the industry
value added (IVA), an indicator that measures the contribute of an industry to the overall

THEORETICAL BACKGROUND
17
economy, will represent an annual growth of 13.6% in the USA [22]. This is explained by
the crescent number of companies investing on this new dosage form. Currently there
are 10 products launched in the market and 29 are in different stages of development
[23].
There are many advantages, as seen, in this technology. The principal therapeutically
areas where companies are investing are [19]:
Pediatrics;
Geriatrics;
Gastrointestinal diseases;
Nausea;
Pain;
Drug Addiction;
Motor-Neuron Diseases.
This is a market of partnerships between companies dedicated to the manufacturing of
films, contract manufacturing organizations (CMOs), companies dedicated to the
discovery of new chemical entities or developing new uses for existing drugs and also
companies searching for new ways to extend their drugs lifecycle. This strategy results
in lower risk of investment but also shared revenues. It can be said that there are two
main players in the OTF market, the technology owners and the marketing partners [21].
The main players and their technologies are [21], [23]:
MonoSol Rx LLC: PharmFilm®;
Applied Pharma Research (APR) and Tesa Labtec: RapidFilm®;
BioDelivery Sciences: BEMA®;
FFT Medical: Oral Transmucosal Film;
IntelGenx: VesalFilm®.
All these facts demonstrate that OTF delivering systems are a trending technology in the
pharmaceutical market. However, the competition will probably grow as the market
becomes more receptive to it. Thereby it’s important to understand deeply the

THEORETICAL BACKGROUND
18
necessities and opportunities of the market and present solutions that can represent a
differentiate factor rot e company.
Also it must be considered that OTFs manufacturing is a less expensive process when
compared with other complex oral delivery systems, but it is more expensive that the
manufacturing processes of more conventional dosage forms [21].

THEORETICAL BACKGROUND
19
CHAPTER 3
Objectives

OBJECTIVES
20
3 Objectives
The aim of this project was to identify all the necessary requirements for the
implementation of a new manufacturing facility for a novel oral dosage. Moreover the
specific objectives of this project were:
To identify the main manufacturers (CMOs) of OTFs;
To identify the major suppliers of mixing equipment, coating equipment and web
converting and primary packaging equipment;
To make a procurement process in order to obtain the specifications and
budgetary quotations of the equipment mentioned on the previous point, for
pilot and commercial scale;
To analyze each equipment in order to determine their critical quality and
process attributes and to estimate their annual capacities;
To determine the necessary capacity of the new manufacturing facility in order
to meet Bluepharma’s OTF forecasts;
To trace a road-map for the acquisition of equipment and to estimate the
necessary investment;
To outline a manufacturing facility of OTFs that have laboratory, pilot and
industrial scale.

OBJECTIVES
21
CHAPTER 4
Methodology

METHODOLOGY
22
4 Methodology
Oral Thin Films are a novel dosage forms with a particular manufacturing process that is
different to the manufacturing process of tablets or capsules, the conventional ones. For
this reason it is very important to identify the type of equipment used, and to
understand the critical process parameters in order to be able to design a new
manufacturing facility dedicated to this dosage form.
The first step was to look to the competitors in this area in order to find the right
companies with suitable equipment solutions for the three phases of OTF manufacturing
process: Mixing, Coating web converting and Primary Packaging.
In the end, it’s our hope to answer to three simple but crucial questions:
- What do we need in terms of equipment?
- How does it work?
- When do we need it?
4.1 Search Method
To answer the first question, it’s important to study and characterize OTF market.
Moreover, the study of this particular environment allowed us to understand who is
investing in this technology and who are the main suppliers of equipment for the
production of OTFs.
Thereby, it is important to have a suitable end efficient search methodology in order to
get proper, reliable and traceable information.
First of all, we divided our search in Macro Data and Micro Data.
By Macro Data we mean non-specific information that characterizes OTF technology, its
manufacturing and development processes and its market as a whole. For this part of
our search several web sites dedicated to this kind of information were used (see Table
2).

METHODOLOGY
23
Scientific Technology and Manufacturing Economic Others
PubMed
B-On
FiercePharma
PharmaTek
PharmTech
in-Pharma
Drugs.com
IBIS World
Root Analysis
Frost & Sullivan
Markets and Markets
CMO Locator
LinkedIn (discussion
groups)
Table 2 – List of websites and platforms used for macro data search, divided by area.
Through this engines, we were able to find studies, reports, news and articles containing
very important scientific, technological and economical know-how.
In what concerns Micro Data, a specific research was used in order to obtain information
about OTF products, competitors and equipment suppliers. The list of sources can be
found on Table 3.
Databases Suppliers and CMOs Exhibitions / Websites Others
Cortellis Newport
Press Releases Products overall specifications Annual Reports
Interpack PharmTech CPhI FCE Pharma InterPhex Pharm Complex ACHEMA European Coating Show
Google LinkedIn (companies profiles) YouTube (equipment videos)
Table 3 - List of websites and platforms used for micro data search, divided by area.
It’s important to make a reference to Cortellis and Newport databases. These engines
are products of Thomson Reuters, one of the biggest media and information group of
the world. These tools allowed to retrieve precise information on pharmaceutical
products, such as medical indications, sales forecasts, deals, companies’ involved,
patent information, press releases and analysis reports, stage of development and
others. In the Figure 7 it’s possible to see a print screen of the Cortellis database.

METHODOLOGY
24
Figure 7 - Snapshot of Cortellis database.
The biggest difference between these two platforms is that Cortellis has information
about products still in development, while Newport presents information about
products already in the market.
Figure 8 - Snapshot of Newport database.

METHODOLOGY
25
The Figure 8 it’s a print screen of Newport. These tools were used with the needed
permission, once they are not license-free.
Moreover, we visited the websites of some of the biggest pharma events in the world.
This quest was very helpful, because it is possible to search for exhibitors by area of
interest and retrieve information about them.
At last, but not least, we lead an individual investigation to the identification of possible
CMO’s and suppliers that we identified in the previous steps.
A note also for the more common and social engines, such as LinkedIn, Google or
YouTube, that were also a precious help to get information. On LinkedIn we found
discussion groups about OTFs, were people connected to this area post and share
information about this technology. In what concerns YouTube we used it to watch some
videos of the equipment working, founded in some of the suppliers’ pages.
Finally, relevant data was selected and then analyzed among an enormous amount of
information.
4.2 Procurement Process
After the initial search, we identified a group of possible suppliers for the equipment
necessary to the production of Oral Thin Films. After this we followed the following
method to reach the final group of suppliers:
Research phase: identification of possible suppliers and CMOs;
Individual Analysis of the identified suppliers: First Selection;
Direct contact with the first selected suppliers: Final Group of Suppliers.
We followed this three step method in order to reach a final group of suppliers that
fulfilled the following requirements:
Suitable equipment for our needs: mixing, coating, web converting and primary
packaging equipment;
Experience with OTFs and TDDS;
Experience in the pharma and medical industry;
METHODOLOGY
26
Compliance with quality requirements, namely FDA and EU GMP requisites.
After the identification of the possible suppliers, we embarked in a more profound
individual analysis by investigating each supplier profile. We searched the information
available on their websites, the industry databases and press releases. We also analyzed
each competing CMO with the expectation of perceiving their equipment suppliers. This
search was more difficult by the fact that pharmaceutical companies are much closed
about their processes and technologies. Some of these information can be seen in the
appendix A. Nevertheless we found some important information in some press releases
and internal reports. In the end of this step, we had selected a group of 21 companies
as potential suppliers for the OTF manufacturing equipment.
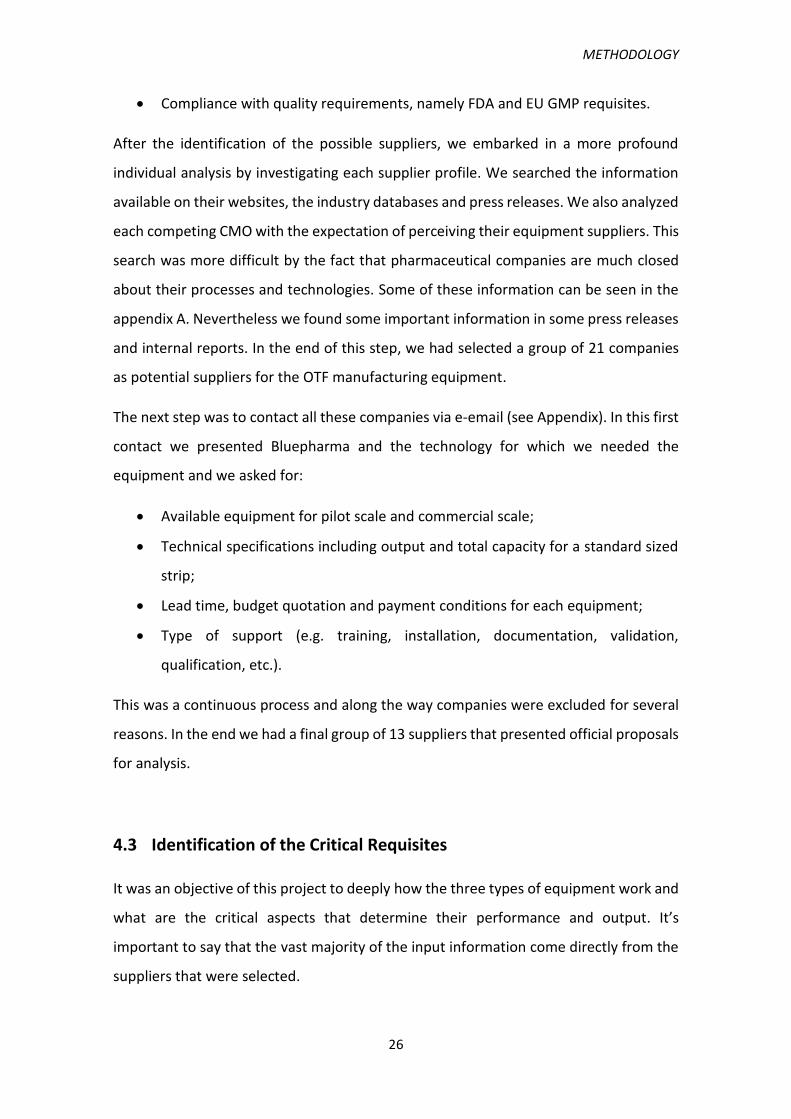
The next step was to contact all these companies via e-email (see Appendix). In this first
contact we presented Bluepharma and the technology for which we needed the
equipment and we asked for:
Available equipment for pilot scale and commercial scale;
Technical specifications including output and total capacity for a standard sized
strip;
Lead time, budget quotation and payment conditions for each equipment;
Type of support (e.g. training, installation, documentation, validation,
qualification, etc.).
This was a continuous process and along the way companies were excluded for several
reasons. In the end we had a final group of 13 suppliers that presented official proposals
for analysis.
4.3 Identification of the Critical Requisites
It was an objective of this project to deeply how the three types of equipment work and
what are the critical aspects that determine their performance and output. It’s
important to say that the vast majority of the input information come directly from the
suppliers that were selected.
METHODOLOGY
27
4.4 Capacities Estimation
To determine the capacity of each equipment we followed a rigorous method that is
defined in the next pages. This work was performed for the coating and primary
packaging equipment.
4.4.1 Coating Equipment
As seen before, this equipment is used to coat the liquid mixture of excipients and drug
substance in a release liner to form a film.
As we can easily understand, it’s the velocity that determines the output of the
equipment. But as we’ll see in the next chapter, the velocity in the coating machines is
determined by the drying process.
Every supplier gave us their claimed process velocity. The problem was that they were
considering different type of formulations, so these velocities were not possible to
compare. Each formulation will behave differently. For example, a formulation with a
high percentage of water will take more time to dry than one with less amount of water.
So, if it takes more time to dry the velocity will be slower and the output smaller.
Once all the equipment used the same drying technology (hot hair in a closed system
dryer), we applied the knowledge that we had about our formulation in order to get a
drying time that we could use in our predictions.
We knew at this point that Bluepharma’s formulation takes 20 to 30 minutes to dry a
sample at 40ºC by contact heating from bellow. We crossed this information with the
opinions of our suppliers for this type of situation, in order to get a realistic time value
to dry our formulation.
Thereby we considered a time of 𝑇 = 10 𝑚𝑖𝑛 to dry our formulation in a coating
machine.
As we will see further, the factor that is directly related with the increase of the capacity
is the dryer length. It is easy to understand, the higher is the drying path we have the
faster the process can go.

METHODOLOGY
28
If we consider 𝑋 as the dryer length of the equipment and 𝑋𝑖 the beginning of the dryer
(zero), we can relate it with the drying time in order to get the velocity of the process
for each equipment:
𝑋 = 𝑋𝑖 + 𝑉 x 𝑇
Eq. 1
If we consider 𝑋𝑖 = 0 𝑚,
𝑉 =𝑋
𝑇
So,
𝑉𝑒𝑙𝑜𝑐𝑖𝑡𝑦 =𝐷𝑟𝑦𝑒𝑟 𝑙𝑒𝑛𝑔ℎ𝑡 (𝑋)
𝐷𝑟𝑦𝑖𝑛𝑔 𝑡𝑖𝑚𝑒 (𝑇)
Eq. 2
We this information we were able to calculate the area produced by a coating
equipment, by applying the following equation:
𝐴𝑟𝑒𝑎 𝑜𝑓 𝑓𝑖𝑙𝑚 = 𝑊𝑜𝑟𝑘𝑖𝑛𝑔 𝑡𝑖𝑚𝑒 x 𝑉𝑒𝑙𝑜𝑐𝑖𝑡𝑦 x 𝑊𝑒𝑏 𝑊𝑖𝑑𝑡ℎ
Eq. 3
Where the Web Width is the accepted release liner width of the equipment and the
Working Time the time that the machine operates.
Working Time
The objective of these estimations was to know if the equipment being analyzed had the
necessary capacity to ensure the production of the Bluepharma’s OTFs according to the
internal forecasts (on a year basis). All the suppliers informed us that both pilot and
industrial equipment can run 24 hours per day, and that it’s normal that the production
run in 2 or 3 shifts per day, normally of 8 hours each. Also, in Bluepharma the production
stops during weekends, so we didn’t considered them. These information lead us to the
scheme in the Table 4:

METHODOLOGY
29
Years Weeks per Year Days per Week Shifts per Day Hours per Shift
1 50 5 2 or 3 8
Table 4 - Available working time considered to estimate the equipment capacity.
As we can see we considered 2 weeks of complete stop of the company. Plus, we made
calculations for 2 and 3 shifts of operation.
During this time, the machines need to stop working for several reasons: for
maintenance, changing of the material, cleaning, product changing, etc. We call this the
downtime of the machines. This downtime varies from machine to machine and
depends also on the production planning. Nevertheless, the contact with the suppliers
gave us important information to set a transversal downtime calculation for the coating
equipment.
Heating and
Calibration
Cooling down Cleaning Coils change
per shift
Maintenance
per year
90 min 90 min 45 min 30 min 2 days
Table 5 - Considered downtime for the coating machines. This values result from the conversations
with the suppliers.
The downtime of the machines, in the Table 5, was considered the same for all machines
because we had very similar answers from the different suppliers. Nevertheless, it was
not always easy to get this type of information from the manufacturers.
We applied these downtimes differently for 2 shift and 3 shift operation:
2 shift operation: Heating, cooling and cleaning happens every day.
3 shift operation: Heating happens in the beginning of the week, and cooling
and cleaning in the end of the working week.
The equipment is prepared to work continuously. If we assume they work 24 hours per
day, it is only necessary to heat when the production starts (in the beginning of the
week) and to cool in the end of the journey. We also considered that for a 3 shift
operation, only one product is produced per week. Product change just happens from
one week to the next. That’s why it is only necessary to clean the machine in the end of
the journey. On the contrary, for the 2 shift operation system there is the need to heat

METHODOLOGY
30
and cool the machine every day and also to clean it, because it is not an acceptable
practice in the pharmaceutical industry not to clean the equipment when there is a
planned interruption of the production.
Translating this to a mathematical equation we have for a 2 shift operation:
𝐷𝑇(2) = (𝐻𝑡 + 𝐶𝐿𝑡 + 𝐶𝑡) ∗ 𝑁𝑑 + (𝐶𝐻𝑡 ∗ 𝑁𝑑 ∗ 𝑁𝑠ℎ) + 𝑀
Eq. 4
While for a 3 shift operation we have:
𝐷𝑇(3) = (𝐻𝑡 + 𝐶𝐿𝑡 + 𝐶𝑡) ∗ 𝑁𝑤 + (𝐶𝐻𝑡 ∗ 𝑁𝑑 ∗ 𝑁𝑠ℎ) + 𝑀
Eq. 5
In Eq. 4 and Eq. 5 𝐻𝑡 is the heating time, 𝐶𝐿𝑡 the cleaning time, 𝐶𝑡 the cooling time,
𝐶𝐻𝑡 the time for coil changes, 𝑁𝑑 the total number of working days, 𝑁𝑤 the total
number of working weeks, 𝑁𝑠ℎ the number of shifts per day and 𝑀 the maintenance
time of the machine.
Overall Equipment Effectiveness (OEE)
In order to have more accurate and realistic results, we decided to use one of the most
known efficiency indicators in the manufacturing industries, namely in the pharma
industry. The Overall Equipment Effectiveness (OEE) can be defined as a best practice
measurement that shows the truly productive time of the planned production.[24]
Figure 9 - Illustration of the Overall Equipment Effectiveness (OEE) logics.
As we can see in the Figure 9 there are 3 concepts that define OEE. These concepts are
rates and can be defined as:
METHODOLOGY
31
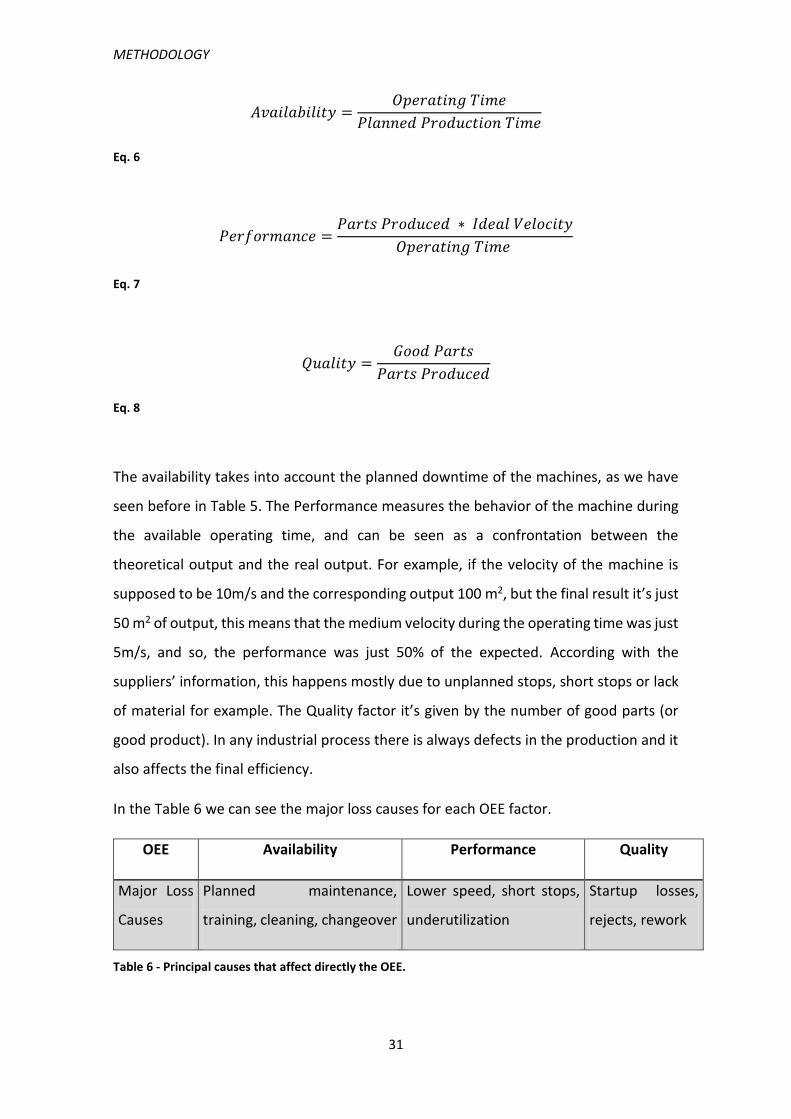
𝐴𝑣𝑎𝑖𝑙𝑎𝑏𝑖𝑙𝑖𝑡𝑦 =𝑂𝑝𝑒𝑟𝑎𝑡𝑖𝑛𝑔 𝑇𝑖𝑚𝑒
𝑃𝑙𝑎𝑛𝑛𝑒𝑑 𝑃𝑟𝑜𝑑𝑢𝑐𝑡𝑖𝑜𝑛 𝑇𝑖𝑚𝑒
Eq. 6
𝑃𝑒𝑟𝑓𝑜𝑟𝑚𝑎𝑛𝑐𝑒 =𝑃𝑎𝑟𝑡𝑠 𝑃𝑟𝑜𝑑𝑢𝑐𝑒𝑑 ∗ 𝐼𝑑𝑒𝑎𝑙 𝑉𝑒𝑙𝑜𝑐𝑖𝑡𝑦
𝑂𝑝𝑒𝑟𝑎𝑡𝑖𝑛𝑔 𝑇𝑖𝑚𝑒
Eq. 7
𝑄𝑢𝑎𝑙𝑖𝑡𝑦 =𝐺𝑜𝑜𝑑 𝑃𝑎𝑟𝑡𝑠
𝑃𝑎𝑟𝑡𝑠 𝑃𝑟𝑜𝑑𝑢𝑐𝑒𝑑
Eq. 8
The availability takes into account the planned downtime of the machines, as we have
seen before in Table 5. The Performance measures the behavior of the machine during
the available operating time, and can be seen as a confrontation between the
theoretical output and the real output. For example, if the velocity of the machine is
supposed to be 10m/s and the corresponding output 100 m2, but the final result it’s just
50 m2 of output, this means that the medium velocity during the operating time was just
5m/s, and so, the performance was just 50% of the expected. According with the
suppliers’ information, this happens mostly due to unplanned stops, short stops or lack
of material for example. The Quality factor it’s given by the number of good parts (or
good product). In any industrial process there is always defects in the production and it
also affects the final efficiency.
In the Table 6 we can see the major loss causes for each OEE factor.
OEE Availability Performance Quality
Major Loss
Causes
Planned maintenance,
training, cleaning, changeover
Lower speed, short stops,
underutilization
Startup losses,
rejects, rework
Table 6 - Principal causes that affect directly the OEE.

METHODOLOGY
32
The OEE is a dynamic tool, and it should be used “on-time” in order to understand where
a manufacturing process can be improved and how. In what concerns this project, it’s
easy to understand that we cannot know how many short stops or how many reject
products we will have. Nevertheless, it is possible, assuming some hypothesis, to have
an acceptable OEE model, and this was what we’ve done.
It’s good to remind that we are estimating the full capacity of the machines for one year
of production. Has we have seen before, we considered 50 weeks of 5 days as the
available time, and 2 and 3 shifts per day. Also as showed before, we know the habitual
downtimes for this type of machines and we know how to calculate it. So, knowing the
Downtime and the Available Time, we can easily calculate the Availability (Eq. 6).
𝐴𝑣𝑎𝑖𝑙𝑎𝑏𝑖𝑙𝑖𝑡𝑦 =𝑂𝑝𝑒𝑟𝑎𝑡𝑖𝑛𝑔 𝑇𝑖𝑚𝑒
𝑃𝑙𝑎𝑛𝑛𝑒𝑑 𝑃𝑟𝑜𝑑𝑢𝑐𝑡𝑖𝑜𝑛 𝑇𝑖𝑚𝑒
In the Table 7 it’s possible to see the different values of the OEE ant its factors for the
different number of shifts.
Column1 Availability Performance Quality OEE
2 Shift Operation 69,1% 75,0% 95,0% 49,24%
3 Shift Operation 89,8% 75,0% 95,0% 64,00%
Table 7 - Considered values for each OEE factor and the respective OEE result, for an operation of 2
and 3 shifts.
As we can notice, the OEE it’s approx. 20% lower for a 2 shift operation due to the fact,
that the number of planned stops is higher if the equipment doesn’t work continuously
during the entire week.
The values of the Performance and Quality were assumed by us. As we said, it’s not
possible to know them at this point. Thereby, we asked directly every supplier about the
OEE performance and quality rates for their machines, and almost all answers were
those values or very near them. The maximum value given by one of the suppliers was
80%, while the minimum was 65%.

METHODOLOGY
33
With the OEE estimated for every machine, we were then in conditions to estimate the
capacity of each equipment, by applying the following formula:
𝐶(𝑚2) = 𝑇𝑖𝑚𝑒 (𝑚𝑖𝑛) ∗ 𝑂𝐸𝐸 ∗ 𝑉𝑒𝑙𝑜𝑐𝑖𝑡𝑦(𝑚/𝑚𝑖𝑛) ∗ 𝑊𝑒𝑏 𝑊𝑖𝑑𝑡ℎ(𝑚)
Eq. 9
4.4.2 Primary Packaging Equipment
As we have seen in the second chapter, the primary packaging equipment combine both
production and packaging processes:
Web Converting (Production): the coated film is cut into small strips with de
desired size.
Primary Packaging (Packaging): the small strips are packed into a small pouch
by hot sealing.
The limiting step of these manufacturing phase is the primary packaging of each
individual film strip into a pouch. It is the size and the material of the pouch that has
the most important impact on the final output of the equipment. This happens because
OTFs don’t vary very much in terms of size, and once they are small, size variations don’t
significantly affect the web converting process velocity. On the contrary, variations in
the pouch size can have a significant impact on the output of the machine. Also the
pouch material has a very important influence. For example, if a certain material takes
more time to seal than other, we’ll have a lower output.
At this stage of the project the primary packaging material is not known nor the size of
the pouches.
Thereby, we used the claimed capacity of each supplier to estimate the maximum
capacity for each equipment. Contrary to the coating machines where the output is
given by the velocity that in turns depends on the formulation, in this case it is given by
the maximum number of pouches per minute.
Taking all this into account and considering the principles referred before the following
formula was applied for this estimation:

METHODOLOGY
34
𝐶(𝑛𝑢𝑚𝑏𝑒𝑟 𝑜𝑓 𝑂𝑇𝐹𝑠) = 𝑇(min) ∗ 𝑂𝐸𝐸 ∗ 𝑁𝑜𝑡𝑓(𝑂𝑇𝐹
𝑚𝑖𝑛) ∗ 𝑁𝑙
Eq. 10
The capacity 𝐶 is then equal to the multiplication of the working time 𝑇 by the 𝑂𝐸𝐸, the
number of strips, 𝑁𝑜𝑡𝑓, produced per minute in each lane and the number lanes 𝑁𝑙. As
we have seen, machines can have one to several production lanes embedded. Once we
are estimating the maximum capacity, we considered the total number of lanes of each
equipment.
4.5 Outline Design of the Manufacturing Facility
One of the challenges of this project was to outline the manufacturing facility for OTF
production in terms of space, building requirements and overall investment needed.
This projection should include laboratorial, pilot and commercial scale equipment, in
order to gather all phases of the product development, since the lab until the
commercial scale manufacturing.
The first step consisted in searching information regarding other facilities used to the
same purpose. We then collect information from inside the company that lead us to a
first design that was several times improved until we reach the final draw that is
presented in this dissertation.
4.6 Bluepharma Forecast and Road-Map
At this point we already could answer to these two questions: what we need? How does
it work? But to answer to the question, “when do we need it?” we have to look to the
company’ sales forecast.
First of all it’s important to say that the forecasts were provided by Bluepharma. As we
will see in the confrontation between the capacities estimated and the sales forecast,
these sales predictions are represented in number of OTFs per year and they go until
the year of 2025.
METHODOLOGY
35
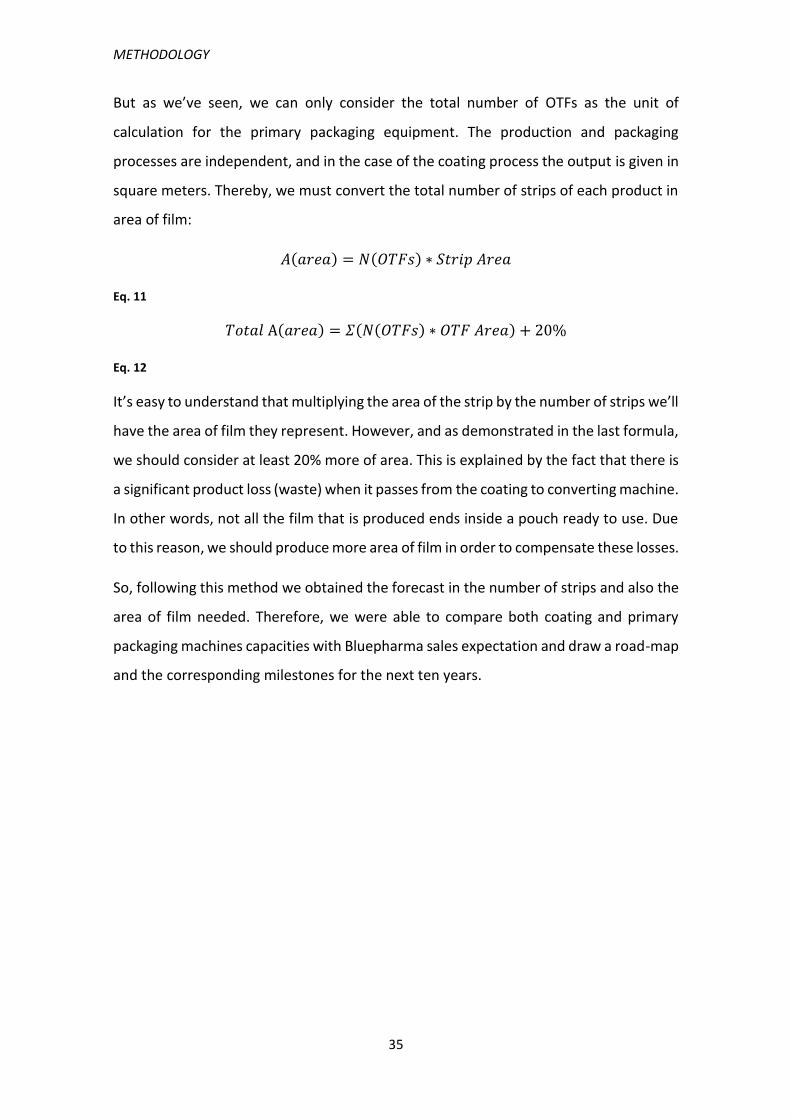
But as we’ve seen, we can only consider the total number of OTFs as the unit of
calculation for the primary packaging equipment. The production and packaging
processes are independent, and in the case of the coating process the output is given in
square meters. Thereby, we must convert the total number of strips of each product in
area of film:
𝐴(𝑎𝑟𝑒𝑎) = 𝑁(𝑂𝑇𝐹𝑠) ∗ 𝑆𝑡𝑟𝑖𝑝 𝐴𝑟𝑒𝑎
Eq. 11
𝑇𝑜𝑡𝑎𝑙 A(𝑎𝑟𝑒𝑎) = 𝛴(𝑁(𝑂𝑇𝐹𝑠) ∗ 𝑂𝑇𝐹 𝐴𝑟𝑒𝑎) + 20%
Eq. 12
It’s easy to understand that multiplying the area of the strip by the number of strips we’ll
have the area of film they represent. However, and as demonstrated in the last formula,
we should consider at least 20% more of area. This is explained by the fact that there is
a significant product loss (waste) when it passes from the coating to converting machine.
In other words, not all the film that is produced ends inside a pouch ready to use. Due
to this reason, we should produce more area of film in order to compensate these losses.
So, following this method we obtained the forecast in the number of strips and also the
area of film needed. Therefore, we were able to compare both coating and primary
packaging machines capacities with Bluepharma sales expectation and draw a road-map
and the corresponding milestones for the next ten years.

METHODOLOGY
36

METHODOLOGY
37
CHAPTER 5
Results and Discussion
RESULTS AND DISCUSSION
38
5 Results and Discussion
In this chapter we will describe and analyze the results of the prospection that was
made.
For confidentiality reasons we will not use the names of any of the companies contacted
nor the equipment models that we’ve analyzed. Instead, the following letter system will
be used:
The first letter describes the type of equipment: “M” – for mixing equipment;
“C” – for coating equipment; “P”- for primary packaging equipment;
The second Letter tells the supplier, and can goes from “A” to “B”, “C”, “D”, “E”,
etc.
The last letter describe the scale of the equipment: L – for Lab, “P” – for Pilot and
“I” – for Industrial scale. If a supplier has more than one equipment for a certain
scale then the last letter must have a number next to it (ex: P1 for pilot
equipment number one, P2 for pilot equipment number 2)
Let’s use an example. “MD-P2”: mixing equipment, from supplier D, pilot scale, model
2.
5.1 Identification of CMOs and Possible Suppliers
This first stage comprised the identification of possible equipment suppliers and the
Contract Manufacturing Organizations (CMOs) in the market for benchmarking
purposes. This is a particularly important step. On one hand suppliers can give us the
necessary input on equipment specifications and prices, on the other CMOs are a good
barometer not only to classify the possible suppliers, but also to understand how the
different market regions are responding to this new kind of dosage form.

RESULTS AND DISCUSSION
39
Figure 10 – Geographical distribution of the OTFs contract manufacturers organizations (CMOs) and
the identified equipment suppliers.
Figure 10 shows the distribution of Oral Thin Films CMOs and Equipment Suppliers, for
Mixing, Coating and Primary Packaging. As we can notice, most of the equipment
manufacturers are established in Europe while the majority of CMOs are in the United
States of America. In fact, Europe (mainly Germany, as we will see) is the region with the
biggest concentration of machinery and equipment companies.
It’s almost common sense that Germany is known by their robust machinery, and the
pharma equipment is not an exception. It’s is estimated that 1 in each 4 pharma
machines are made in Germany or by German companies [25]. Also, the basis for
innovation in the most prominent players in the pharma packaging equipment is set up
in the growing need of solutions for novel drug delivery systems, like OTFs [26].
On the other hand most of the OTF manufacturers are in the USA. The first reason that
can explain this is that the USA is where the Headquarters of the major pharma
companies are located [27]. The other reasons is due to the fact that OTF products are
more accepted by the patients in the USA than in Europe, because this is a technology
that was first introduced there and also because both OTC and Rx OTF were first
launched in the USA [21], [28].

RESULTS AND DISCUSSION
40
As we’ve seen before, from the market search 21 possible equipment suppliers were
identified, 7 for each type of equipment: Mixing, Coating and Primary Packaging.
5.2 The Procurement Process
5.2.1 Mixing Equipment
Table 8 - Resume of the procurement process for the mixing equipment.
Table 8 resumes the selection of the possible suppliers of the mixing equipment. Five
potential suppliers were selected (out of seven) which presented a total of 23 different
types of machines.
As we can see, we asked for equipment in each of the three phases (lab, pilot and
industrial). This only happens for this type of equipment because Bluepharma already
has specific lab scale equipment for coating and primary packaging. .
During the course of this work and in result of the procurement process, a lab mixing
equipment with the features identified as critical for OTF manufacturing process was
acquired and is operational.
Mixing Supplier A B C D E F G
Country Germany UK Germany Switzerland Germany USA USA
Equipment for Pharma
IndustryYes Yes Yes Yes Yes Yes Yes
Possible Matching
EquipmentYes Not Clear Yes Yes Yes Not Clear Not Clear
Selected for First Round Yes Yes Yes Yes Yes Yes Yes
Contact Yes Yes Yes Yes Yes Yes Yes
Answer Positive Positive Positive Positive Positive No answer No answer
Type of ContactLocal
Representative
Local
Representative
Local
RepresentativeDirect Direct
Presentation of Formal
QuotationsYes Yes Yes Yes Yes
Lab Scale equipment 3 1 1 2 -
Pilot Scale equipment 1 1 1 1 1
Industrial Scale
equipment3 - 3 2 3
Final Group of Suppliers Yes Yes Yes Yes Yes No No

RESULTS AND DISCUSSION
41
5.2.2 Coating Equipment
Table 9 - Resume of the procurement process for the coating equipment.
In what concerns to coating equipment seven different companies were identified. In
the first step we eliminated one of these possible suppliers, due to the fact that we
couldn’t find enough information about the company and because the only equipment
sold by this company is also supplied by another company that was selected for contact.
Another company was discarded because they only operate in the Scandinavian region.
Finally, the last company excluded from the final list of suppliers never provided an
official budget quotation or any technical information although several emails were
exchanged.
Coating Supplier A B C D E F G
Country Germany Germany Switzerland Germany USA USA Denmark
Equipment for Pharma
IndustryYes Yes Yes Yes Not Clear Yes Yes
Coating Machines for
OTFsYes Yes Yes Yes Not Clear Not Clear Not Clear
Selected for First Round Yes Yes Yes Yes No Yes Yes
Contact Yes Yes Yes Yes Yes Yes
Answer Positive Positive Positive Positive Positive Negative
Type of Contact Direct DirectLocal
RepresentativeDirect Direct
Presentation of Formal
QuotationsYes Yes Yes Yes No
Pilot Scale equipment 2 1 1 1 -Industrial Scale
equipment2 1 1 - -
Final Group of Suppliers Yes Yes Yes Yes No No No

RESULTS AND DISCUSSION
42
5.2.3 Primary Packaging Equipment
Table 10 - Resume of the procurement process for primary packaging equipment.
Finally the web converting and primary packaging equipment, in the Table 10. Only one
company was excluded after the preliminary analysis because it was not possible to find
any solid information about equipment or guaranties of experience and quality. The
contrary happened with another supplier, a well-known company in pharma industry
with high experience in the packaging field. We even had a face-to-face meeting with
the local representative, but we never received any official proposal. The same occurred
with one last company, with the difference that from this company we received some
preliminary information and indicative prices, but never an official quotation.
5.2.4 General Analysis
All this process was a very intense and with a lot of exchanged information, as it can be
seen in the Table 11.
Emails exchanged Phone calls Meetings Equipment models
analyzed
> 300 >30 6 39
Table 11- Some numbers that describe the intense contact with equipment suppliers and the number
of machines analyzed.
Primary Packaging
SuppliersA B C D E F G
Country USA Italy Germany Germany USA Germany Índia
Equipment for Pharma
IndustryYes Yes Yes Yes Yes Yes Not Clear
Primary Packaging
Machines for OTFsYes Yes Yes Yes Not Clear Yes Not Clear
Selected for First Round Yes Yes Yes Yes Yes Yes No
Contact Yes Yes Yes Yes Yes Yes
Answer Positive Positive Positive Positive Positive Positive
Type of Contact Direct Direct Direct Direct DirectLocal
Representative
Presentation of Formal
QuotationsYes Yes Yes Yes No No
Pilot Scale equipment 1 1 1 1 - -Industrial Scale
equipment1 1 1 1 - -
Final Group of Suppliers Yes Yes Yes Yes No No No

RESULTS AND DISCUSSION
43
In the next two charts (Graphic 1 and Graphic 2) it is possible to compare the initial
number of identified companies and the final selection as well as the geographic
distribution of the selected companies by country.
Graphic 1 - Comparison between first identified equipment manufacturers and the selected.
Graphic 2 - Geographical distribution of the selected suppliers, by country.
Graphic 3 shows the number of equipment’s analyzed by type and by scale. Analyzing
the graph it is possible to observe that there is a higher variety of suppliers of mixing
equipment than coating and primary packaging equipment. This is expected considering
that this type of equipment can be used in several types of dosage forms, while the
coating and primary packaging equipment is limited to the manufacture of OTFs or
transdermal patches.
7 7 7
5
4 4
0
1
2
3
4
5
6
7
8
Mixing Coating Primary Packaging
Primary Identification Final Selection
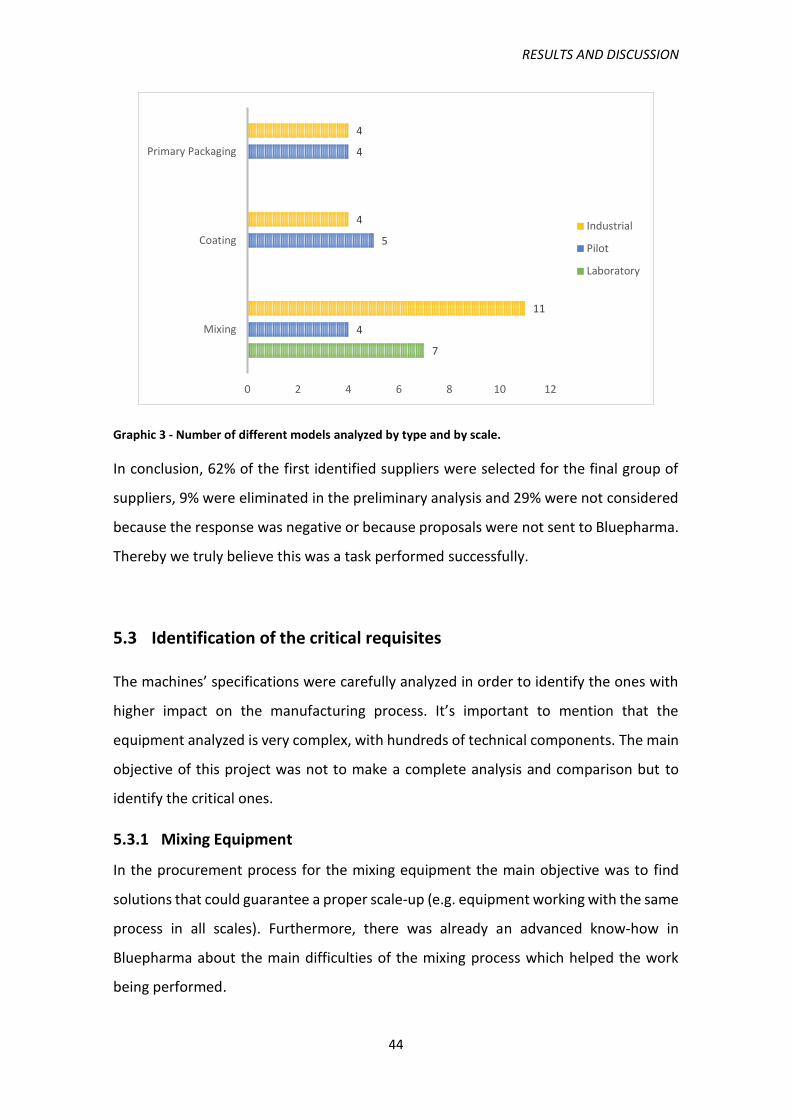
RESULTS AND DISCUSSION
44
Graphic 3 - Number of different models analyzed by type and by scale.
In conclusion, 62% of the first identified suppliers were selected for the final group of
suppliers, 9% were eliminated in the preliminary analysis and 29% were not considered
because the response was negative or because proposals were not sent to Bluepharma.
Thereby we truly believe this was a task performed successfully.
5.3 Identification of the critical requisites
The machines’ specifications were carefully analyzed in order to identify the ones with
higher impact on the manufacturing process. It’s important to mention that the
equipment analyzed is very complex, with hundreds of technical components. The main
objective of this project was not to make a complete analysis and comparison but to
identify the critical ones.
5.3.1 Mixing Equipment
In the procurement process for the mixing equipment the main objective was to find
solutions that could guarantee a proper scale-up (e.g. equipment working with the same
process in all scales). Furthermore, there was already an advanced know-how in
Bluepharma about the main difficulties of the mixing process which helped the work
being performed.
7
4
5
4
11
4
4
0 2 4 6 8 10 12
Mixing
Coating
Primary Packaging
Industrial
Pilot
Laboratory

RESULTS AND DISCUSSION
45
Regardless the formulation composition, it is mandatory to achieve a perfectly
homogeneous mixture. This means a mixture without bubbles or lumps and with a
homogeneous distribution of the drug(s) substance(s). The existence of any of those
problems can seriously compromise the coating process.
The equipment recommended for the mixing process of OTFs corresponds to highly
advance processing units, developed for the production of emulsions and suspensions
mainly to the pharmaceutical industry. Besides the typical mixing features, like agitation
for example, they allow to work with high pressures or vacuum and to regulate the
temperature, among several other functions.
In Figure 11 it’s possible to see the outlook of a typical processing unit used in the
preparation of OTFs.
Figure 11 – Example of a mixing equipment with an anchor agitator. (Image from supplier M.A).
Figure 12 shows a schematic representation of a mixing equipment that will be useful to
understand the discussion.
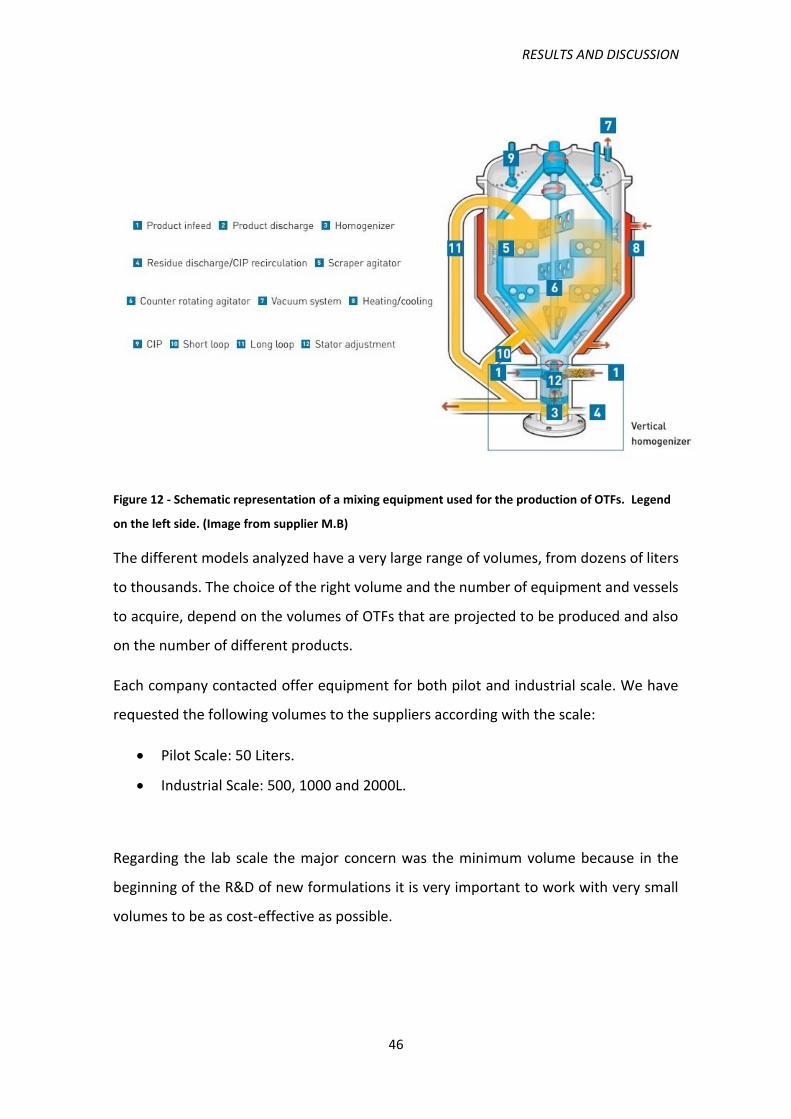
RESULTS AND DISCUSSION
46
Figure 12 - Schematic representation of a mixing equipment used for the production of OTFs. Legend
on the left side. (Image from supplier M.B)
The different models analyzed have a very large range of volumes, from dozens of liters
to thousands. The choice of the right volume and the number of equipment and vessels
to acquire, depend on the volumes of OTFs that are projected to be produced and also
on the number of different products.
Each company contacted offer equipment for both pilot and industrial scale. We have
requested the following volumes to the suppliers according with the scale:
Pilot Scale: 50 Liters.
Industrial Scale: 500, 1000 and 2000L.
Regarding the lab scale the major concern was the minimum volume because in the
beginning of the R&D of new formulations it is very important to work with very small
volumes to be as cost-effective as possible.

RESULTS AND DISCUSSION
47
Agitation
There are various types of agitators in the market, such as propeller, anchor or magnetic
agitators. Our demand focus was on the anchor agitators (Figure 13) that are anchor
shaped and their blades are very close to the walls and to the bottom of the vessel. They
work in low to medium velocities and are recommended for medium to high viscosity
solutions or emulsions and for laminar fluids. This can be explained looking to the
Reynold’s Number:
𝑅𝑒 =𝑖𝑛𝑒𝑟𝑡𝑖𝑎𝑙𝑓𝑜𝑟𝑐𝑒𝑠
𝑣𝑖𝑠𝑐𝑜𝑢𝑠𝑓𝑜𝑟𝑐𝑒𝑠
Eq. 13
The number of Reynolds is lower when the viscosity is higher, and in this case near-walls
agitators are recommended to shear the mixture [29].
Figure 13 -Example of an anchor agitator for laboratory scale. It is also visible the wall scrapers in
white. (Image from supplier M.A).
However, for higher volumes the anchor agitators do not show a high performance,
because the center zone experience little movement resulting in a non-efficient mixing
[29]. Thereby, pilot and industrial equipment present more complex agitators in order
to surpass this limitation, like agitators with both internal and external agitation and
temperature controlled systems.

RESULTS AND DISCUSSION
48
Figure 14 - Detail of an anchor agitator for pilot scale mixing. Besides the external anchor, it's possible
to notice the internal counter rotating agitator. (Image from supplier M.A).
As the Figure 14 shows, the anchor works as an external agitator that moves close to the
walls and the bottom of the vessel, while the counter rotation agitator (or blade) is
placed in the center of the vessel and rotates in the opposite direction of the anchor.
The counter rotating is normally vertical and has several paddles along it. This
technology is used due to the high vessel volumes, to ensure a constant and uniform
agitation not only in the borders but also in the center of the vessel.
Another important feature to mention are the wall scrappers (indicated in the Figure
13). These pieces, normally made of PTFE, scrap the walls and the bottom of the vessel,
what ensure that no agglomerates stay glued to the borders of the vessel.
Homogenization
As referred before, one of the most important goal to achieve in the formulation of OTFs
is a truly homogeneous mixture. The production step (coating) comprehends the
spreading of the solution on a substrate. If the solution has solid agglomerates or air
bubbles, for example, an entire batch can be compromised because the resulting film
will not comply with the specifications. To achieve perfect homogenization, dispersion
equipment (or homogenizers) are commonly used. The dispersion process can be
defined as the mixing of at least two substances that don’t dissolve in each other, hardly
react with each other or don’t chemically react with each other [30].

RESULTS AND DISCUSSION
49
However, and as all the suppliers have explained, these tools are able to mix any mixture
and with better results than a simple agitator, because the mixture it’s dispersed at very
high velocities. Nevertheless it’s important to say that it doesn’t make the agitator
dispensable. The agitator guarantees the uniformity of the mixture inside the vessel and
pushes it in the direction of the homogenizer, mainly in bigger vessels.
Figure 15 – Dispersion head. a) Representation of what happens in the dispersion head, showing the
smaller particles being expelled at high velocity. b) Representation of the rotor stator system. The
rotor moves at high velocity sucking the mixture and then expelling it through the slots in in an in the
stator, making the mixture to spilt into disperse phase.
These homogenizers have a principal component that is the dispersion head, which
works according to the rotor-stator principle, as demonstrated in the Figure 15. The
rotor operates at very high velocities creating a very powerful axial suction force that
sucks the mixture into the dispersion head, where the rotor rotates at very high velocity
forcing the mixture through the stator slots. The mixture is submitted to very high shear
forces through those slots being spliced. There are three main factors that characterize
these instruments:
Range of Velocities: to create the necessary high shear forces, the rotor has to
reach very high velocities, in the order of thousands revolutions per minute
(RPM). Nevertheless, very high velocities can damage more sensitive mixtures,
for example, mixtures containing some kinds of polymers [31]. In this case, it’s
important to have special attention to the minimum velocities of the
homogenizers.

RESULTS AND DISCUSSION
50
Dispersion head: for each equipment there are several different heads available,
with different shapes and different slot sizes. The selection of a suitable
dispersion head should take into account the type of the formulation in order to
achieve maximum homogenization.
Mode of operation: there are two different types of homogenizers, the batch
and the in-line homogenizers. The first ones are individual tools, normally with
the format of a magic wand for kitchen and are placed in an overhead position
on the top of the vessel. In the Figure 16 these two operation modes are
represented.
Figure 16 - Different operation modes of homogenizers. a) Shows a batch disperser placed on top of
the vessel. b) In-line homogenizer, connected to the bottom of the vessel. It creates an external
circulation of the mixture.
While in the batch homogenizer the disperser head is inside of the vessel and the
dispersion happens locally, in the case of the in-line dispersers the disperser heads are
located outside the vessel (normally on the bottom or connected to it) and create a
circulation circuit (Figure 16). These last ones are more effective, once they ensure that
all the mixture passes by the circuit of dispersion several times. This is particularly
relevant for higher volumes (e.g. pilot scale and industrial scale). For our project, we
considered the batch dispersers only for laboratory equipment due to the higher
volumes of pilot and commercial scale. However, some laboratory solutions present also
in-line homogenizers, what is an advantage in terms of scale-up. Although, to use this

RESULTS AND DISCUSSION
51
type of homogenizer higher volumes are needed when compared with the batch
laboratory homogenizers, which is a disadvantage once we seek the minimum volume
possible for this scale.
Vacuum
Another critical aspect of the formulation process is to avoid aeration, i.e. formation of
air bubbles inside the mixture. During a mixing process it is frequent the formation of
bubbles or foam.
To avoid this, manufacturers of mixing equipment offer optional accessories that ensure
that the mixing process is made under vacuum conditions. These accessories are
normally vacuum pumps, which are connected to the vessel through an inlet that is
sealed and when operating can create vacuum inside by sucking the air inside of the
vessel.
Nevertheless, other factors can help to avoid aeration. For example, if a batch disperser
is used, the dispersion head should not be placed closed to the surface of the mixture in
order to avoid turbulence, which can promote the formation of bubbles or foam. In any
case, an in-line disperser is always a better option, because the recirculation system
created also helps to eliminate the air entrapped in the mixture. Also it is possible to
add the solid ingredients (like powders) directly in the in-line homogenizer so it passes
in the rotor-stator before it enters in the mixing vessel, which avoid the formation of
lumps and air bubbles.
Temperature Control
The control of the temperature in a mixing process is very important. Depending on the
formulation, heat may be necessary. The agitation and homogenizing tools, for example,
can create heat that affect the stability of the mixture. The necessity to keep the mixture
at high or low temperatures depends on the composition of the formulation. However
it is crucial to have the temperature controlled at all time. The presence of unwanted
moisture can compromise the OTF mechanical properties, plus it can be necessary to
change process temperature to improve or reduce the viscosity of the mixture [15]. Also,
drug substances are often very sensitive to temperature, being necessary to control this
parameter in order to not affect it [18].

RESULTS AND DISCUSSION
52
In the pilot and industrial scale equipment analyzed, the vessels have a double wall
jacket and for heating the mixture, compressed air and steam are introduced in the wall
jacket. On the other side, to cool down the mixture, cold water is introduced in the wall
jacket.
Specifications of the Quoted Equipment
The Table 12 and Table 13 resume the specifications of the different quoted equipment.
Type Mixing Equipment (M)
Supplier A B C D
Model L1 L2 L3 L1 L1 L1 L2
Code M.A-L1 M.A-L2 M.A-L3 M.B-L1 M.C-L1 M.D-L1 M.D-L2
Maximum Volume (L)
1 2 2 - 3 1 2
Minimum Volume (L)
0,5 0,8 0,8 - 0,75 0,45 1,1
Máx. Viscosity (mPas)
100.000 150.000 150.000 - 50.000 50.000 50.000
Agitator Anchor Anchor Anchor - Other* Anchor Anchor
Wall Scrapers
Yes Yes Yes - Yes Yes Yes
Agitator Speed (rpm)
10 - 150 8 - 290 ndi - 30 - 150 10 - 400 10 - 400
Homogenizer Batch Batch Batch/In-
line Batch/In-
line In-line Batch Batch
Homogenizer Speed (rpm)
3.000 - 25.000
3.000 - 25.000
3.000 - 25.000 / 3.000 - 26.000
0 - 6.000 3.000 - 12.000
500 - 30.000
500 - 30.000
Vacuum Pump
Yes Yes Yes - Yes Yes Yes
Temperature Control
Yes Yes Yes - Yes Yes Yes
ndi: not delivered information
* patented and registered technology of the supplier that cannot be revealed due to
confidential reasons
Table 12 - Specifications of the quoted mixing laboratory equipment.
On Table 13 it is possible to find the specification of the laboratory equipment. In what
concerns the volume, our major concern was the minimum working volume, because
the in the R&D phase of new OTFs formulations it is normal to work with very small
volumes in order to reduce costs. Only two can of the models work with 0,5 Liters or
less, and these volumes are closer to Bluepharma’s needs for this scale.

RESULTS AND DISCUSSION
53
The supplier of equipment M.B-L1 just sent data regarding the homogenizer
specifications. This happened because this equipment corresponds to a homogenizer
only. Supplier B is known for its homogenizers and claims that, in certain cases, they can
exclude the necessity of the agitator and that they can work with volumes in the order
of 1 mL. Thereby we decided to consider this supplier just for laboratory equipment,
even though it does not present any of the other features.
Besides the M.B-L1 and M.C-L1 models, all the other options present an anchor agitator.
This information agrees with what was referred before, that this type of agitators are
recommended for medium to high viscosities, which is the case of OTFs formulations
[29]. Nevertheless, the M.C-L1 has a patented technology that was designed for working
with high viscosities and the supplier “C” claims that it ensures far better results than a
typical anchor agitator.
Looking to the type of homogenizer we can see that there are models with in-line
homogenizers for lab scale. This is an important thing to consider, because at pilot and
industrial scale, most of the equipment uses this technology. In addition to ensure a
better homogenization, if we use the same process in all scales, the scale up process will
have a higher probability to have success.

RESULTS AND DISCUSSION
54
Type Mixing Equipment (M)
Supplier A C D E
Equipment P1 P1 P1 P1
Code M.A-P1 M.C-P1 M.D-P1 M.E-P1
Maximum Volume (L)
50 50 50 60
Minimum Volume (L) ndi 13 ndi 8
Max. Viscosity (mPas)
100.000 50.000 50.000 ndi
Agitator Anchor + Counter
rotating blade Other* Anchor
Anchor + Counter rotating
blade
Wall Scrapers Yes yes Yes Yes
Agitator Speed (rpm) 22 - 66 24 to 120 ndi ndi
Homogenizer In-line In-line Batch/In-line In-line
Homogenizer Speed (rpm)
3.000 600 - 4.800 Max. 3.000/
10.000 600 -3000
Homogenizer Recirculation
External Internal / External
ndi Internal / External
Vacuum Pump Yes Yes Yes Yes
Temperature Control Double jacket
System Double Jacket
System Double Jacket
System Double Jacket
System
CIP Yes Yes Yes Yes
ATEX (option) Yes Yes Yes Yes
ndi: not delivered information * patented and registered technology of the supplier that cannot be revealed due to confidential
reasons
Table 13 - Specifications of the quoted mixing pilot equipment.
For the pilot equipment the target volume was 50 liters but the information regarding
the minimum working volume is also important. However only two suppliers provided
that information and as it can be seen in the Table 13, the M.E-P1 presents the lowest
useful volume, 8 liters.
Finally, all the models allow the regulation of temperature, vacuum, clean-in-place (CIP)
and ATEX configuration. ATEX are the European guidelines and directives to work with
Explosive Atmospheres [32]. In many industries, like pharma, there are processes were,
for example, inflammable or explosive materials are handled. In this case the equipment
must be configured in order to meet those guidelines.
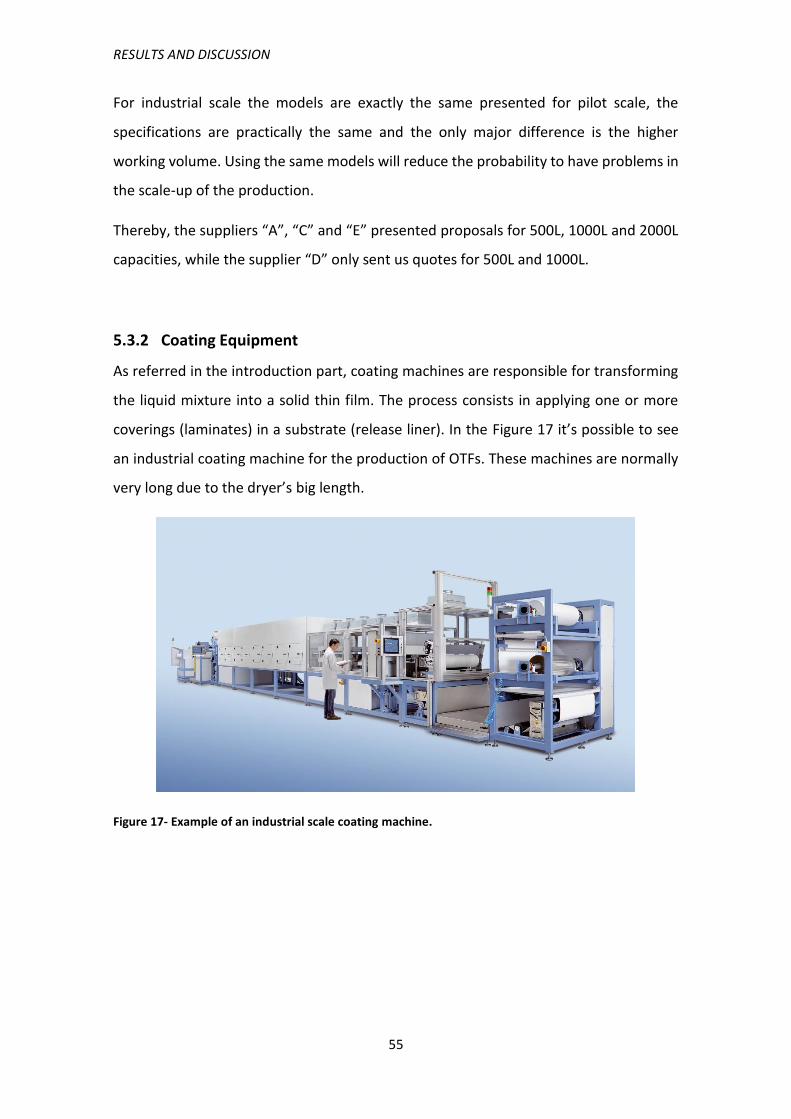
RESULTS AND DISCUSSION
55
For industrial scale the models are exactly the same presented for pilot scale, the
specifications are practically the same and the only major difference is the higher
working volume. Using the same models will reduce the probability to have problems in
the scale-up of the production.
Thereby, the suppliers “A”, “C” and “E” presented proposals for 500L, 1000L and 2000L
capacities, while the supplier “D” only sent us quotes for 500L and 1000L.
5.3.2 Coating Equipment
As referred in the introduction part, coating machines are responsible for transforming
the liquid mixture into a solid thin film. The process consists in applying one or more
coverings (laminates) in a substrate (release liner). In the Figure 17 it’s possible to see
an industrial coating machine for the production of OTFs. These machines are normally
very long due to the dryer’s big length.
Figure 17- Example of an industrial scale coating machine.

RESULTS AND DISCUSSION
56
The Figure 18 shows a scheme of the coating process for OTFs, as explained before. In
the end the coated films instead of being winded in one roll, it’s is first cut in two and
winded into two smaller rolls. As we’ll see further this due to an optional feature called
slitting station that allow us to have two independent coated rolls with a smaller web
width.
Web Width
The web width can be defined as the maximum release liner (web) width that is accepted
by the coating machine. Normally the machines don’t have a fixed width, instead they
have defined a maximum value. Pilot scale machines have normally a shorter web width
than the industrial ones, the main difference is in the length. It is easy to understand
that the web width as well as the web length are directly related with the machine
output.
Dryer
The dryer plays a very important role in the coating process. These dryers are very
complex systems and the process has to be perfectly adjusted to the mixture
Figure 18 - Scheme of the coating machine path since the uncoated web to the final coated film.

RESULTS AND DISCUSSION
57
composition in order to ensure a final OTF with the desired properties (plasticity,
elasticity). The film has to be dried at a constant velocity and the film cannot be inside
of it more than the calculated time, otherwise it may become brittle.
It’s also important to refer that the dryers normally come in modules, this means that it
is possible to add more modules depending on the capacity that we will need (each
module increases the dryer length). This concept is present in the industrial scale
machines, but not at pilot scale.
The length of the dryer is probably the most critical aspect of these machines since a
dryer with a higher length is synonymous of a higher output of the machine. It’s easier
to understand if we look to what happens in the machine: the web (release liner) moves
slowly in the dryer direction, before it enters the dryer, the mixture is spread in the
release liner a fixed thickness and after that, it enters into the dryer. The velocity which
the web moves it’s determined by the time that the mixture has to stay inside the dryer
in order to turn to the solid state. So, if we have a small dryer, the web will move very
slowly and on the contrary if we have a longer dryer the web can run at a higher velocity.
In any of those cases, the web will be the exactly same time inside the dryer, but the
velocity it runs will be different.
There are several drying techniques, like infrared, UV or microwave radiation, by contact
eating or by natural air contact, for example. But in case of OTFs manufacturing, the
method used by all the suppliers selected and their equipment is drying by hot air. This
technique is used because it does not have some of the problems of other techniques:
a) radiation techniques may modify the OTF properties;
b) heating by contact can damage the structure of the coated film due to the very
small thickness it presents.
Thereby, drying by hot air allows a uniform distribution of the heat around the film
carrier at all moments, due to the convection current originated. Plus, it enables a slow
and steady drying, which is the recommended procedure. If the drying process is too
fast, the surface and bottom of the film will dry much before the middle part and the
solvents can become cloistered inside, creating crusts in the film.
Dimensions

RESULTS AND DISCUSSION
58
The dimensions of the equipment (length, height and width) are important to make an
estimation of the area required for the manufacturing facility.
Application System
The Application System (or coating heads) can be described as the machine feature
responsible to coat the release liner with the mixture. These components are very
precise and can ensure a wet thickness of micrometers. There are several types of
coating heads and they are related with the material that is being produced. In the case
of OTFs, the most common systems are the Knife Coater, the Slot Die and the Reverse
Roll, however other possibilities may be considered.
Figure 19 - Representation of three different coating systems: a) Knife Coater, b) Slot Die and c)
Reverse Roll.
In the Figure 19, the green layer represents the liner and the mixture is represented in
red. The different systems all release the mixture at a constant rate and with a very
precise thickness. The selection of the best options depends on the mixture properties,
mainly its density, viscosity and composition. All suppliers selected equipment models
appropriate for the production of OTFs
Release Liner
There are several options on the market of release liners. In the OTF manufacturing
process, it is mandatory that this product fill all the quality requisites required by the
authorities, namely the FDA (for the US market) and the EMA (for the European market).
Release liners for OTFs production are normally made of a polymeric film or paper
substrate that may be coated with silicone.
The release liners play a crucial role in the manufacturing process of OTFs besides being
the substrate where the mixture is spread. These liners provide extra strength to the

RESULTS AND DISCUSSION
59
film, helping to maintain its integrity and surpass all the stresses during the
manufacturing process [33]. Before the packaging of the OTFs into individual pouches
the release liner is peeled off releasing the film without damaging it.
One of the tasks of this work was to find a suitable release liner fulfilling the US and
European regulatory requirements and non-siliconized. Most of the release liners for
pharma are siliconized in one or both sides but considering the BlueOS technology
composition these release liners are not compatible. Nevertheless, it was possible to
find a non-siliconized release liner, compliant with all the necessary requirements.
Specifications of the Quoted Equipment
We will now compare the different equipment models that we’ve received proposals.
The specifications for each equipment received are displayed in Table 14 (pilot scale)
and Table 15 (industrial scale).
Type Coating Equipment (C )
Supplier A B C D
Equipment P1 P2 P1 P1 P1
Code C.A-P1 C.A-P2 C.B-P1 C.C-P1 C.D-P1
Length (mm) 2216 2200 3000 4121 3200
Width (mm) 646 1000 1250 1500 1000
Height (mm) 600 1100 1850 1600 1900
Area (m2) 1,4 2,2 3,8 6,2 3,2
Weight 190 1100 ndi ndi 6000
Max. Web Width (mm)
155 250 400 350 130
Useable Coating Width (mm)
120 200 250 200 100
Coating System Coating Knife Coating Knife Roll Coater Knife/Slot die Knife over
roll/Slot Die
Dryer Sections 2 3 3 2 3
Dryer Length (mm) 1600 3400 1660 1876 1500
Dryer Technology Hot Air Hot Air Hot Air Hot Air Hot Air
Slitting Station (option)
No Yes ndi Yes ndi
Adaptable for TDDS Yes Yes Yes Yes ndi
ndi: not delivered information
Table 14 - Specifications of the coating equipment for pilot scale.

RESULTS AND DISCUSSION
60
As we can see, all the models have a small dimension (between 1,4 m2 and 6,2 m2 ) and
have a small web width. Also, the dryer lengths are between 1,5m and 2m for four of
the five models. Just the equipment C.A-P2 has a higher dryer length. This happens
because this is the only machine where the dryer makes a U pathway, almost duplicating
the length of the dryer path.
Type Coating Equipment (C )
Supplier A B C
Equipment I1 I2 I1 I1
Code C.A-I1 C.A-I2 C.B-I1 C.C-I1
Length (mm) 4700 6300 14180 9700
Width (mm) 2100 2600 5200 1500
Height (mm) 2100 2100 6362 2300
Area (m2) 9,9 16,4 73,7 14,6
Weight 7000 8000 ndi 7000
Max. Web Width (mm)
460 460 600 480
Useable Coating Width (mm)
440 440 500 460
Coating System Coating Knife Coating Knife Roll Coater Knife/Slot die
Dryer Sections 2 4 3 4
Dryer Length (mm) 4700 8500 9000 3810
Dryer Technology Hot Air Hot Air Hot Air Hot Air
Slitting Station (option)
Yes Yes ndi Yes
Adaptable for TDDS Yes Yes No Yes
ndi: not delivered information
Table 15 - Specifications of the coating equipment for commercial scale manufacturing.
As expected, the commercial scale machines have a significant higher dimensions when
compared with pilot equipment (ranging from 9,9 m2 to 73,7m2). However, just the
equipment P.B-I1 presents a significantly higher area value. This is explained by the fact
that this equipment is a two store complex-like unit, what makes the occupied area
higher than if we just considered the machinery parts. But once we considered the
layouts given by the suppliers for these calculations, we decided to consider the
equipment as a whole. Looking to the Figure 20 it’s easier to understand this concept.

RESULTS AND DISCUSSION
61
Figure 20 - A scheme of a coating equipment similar to the P.B-I1, a two store complex where the
machine parts are inserted.
In what concerns the web width, all the models present the same range of maximum
accepted values – around 0,5m. The dryer lengths are considerable different, with two
models presenting values above the 5m and the other two presenting almost the
double. Nevertheless, it’s is important to say that all the suppliers informed us that it is
possible to add more dryer modules, although we just considered the parameters of the
proposal that were sent.
5.3.3 Primary Packaging Equipment
Web converting and Packaging machines convert the coated film into small individual
strips (production process) and after that they ensure the packaging of the final films
into individual pouches (packaging process). Like the coating machines we’ve seen
before, this type of equipment is very complex.
Figure 21 - Outlook of a pilot scale web converting and primary packaging machine (eq. P.D-P1).
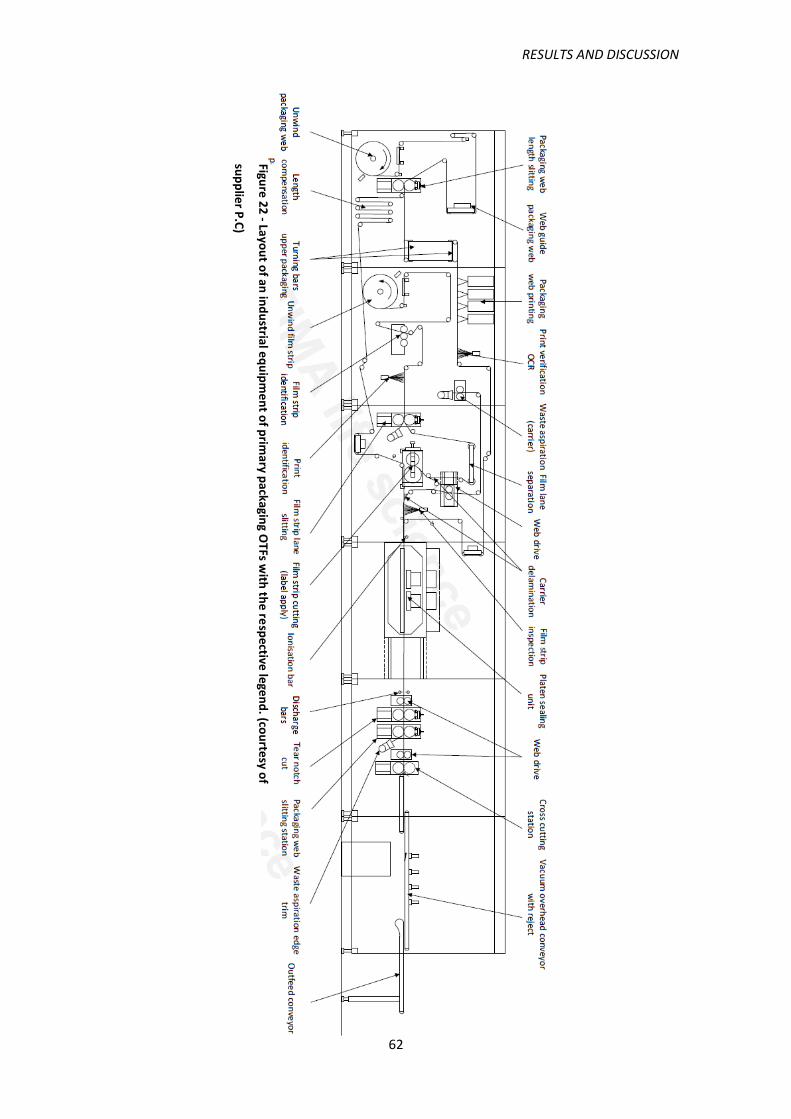
RESULTS AND DISCUSSION
62
Figure
22
- Layo
ut o
f an in
du
strial eq
uip
me
nt o
f prim
ary packagin
g OTFs w
ith th
e re
spective
lege
nd
. (cou
rtesy o
f
sup
plie
r P.C
)

RESULTS AND DISCUSSION
63
Looking to the Figure 22 we can describe the web converting and primary packing
processes by the following steps:
From the left to the right, the film roll is inserted in a coil of the machine and
starts to be unwinded. Also, the packaging material roll is inserted in the
machine.
The packaging material is dived in two lanes (one for the upper packaging
material and other for the bottom packaging material) and then it passes
through a web printing station and verification, where the batch number and
shelf life is printed.
The OTF film enters in a slitting station where the film can be divided in several
lanes of an appropriate width. See Figure 23.
Figure 23 - Detail of a primary packaging machine. a) Initial coated film; b) the film divided in several
lanes; c) packaging material. (image from supplier P.D).

RESULTS AND DISCUSSION
64
After that, a cutting station cuts the film (already divided in lanes) into small
strips with the desired size to ensure the appropriate DS strength in the final
dosage form. In parallel, the release liner is peeled off and rewinded.
At the same time the strips are dropped in the bottom packaging material web
and the upper packaging material is immediately placed on top.
Figure 24 - Detail of a primary packaging machine. The OTFs strips already cut on the top of the
release liner are then trasfered to the bottom packaging material and closed with the upper packaging
material. (image from supplier P.D).
These three layers (bottom packaging material, film strips and upper packaging
material) go into the sealing station.
In this station, the pouches are created by a four side hot sealing. The number of
pouches made in each sealing cycle depends on the pouch size. At this point the
strips are closed in a four sealed pouch but the pouches are still connected to
each other.
The web keeps moving until a cross cut station where they are cut into individual
pouches.
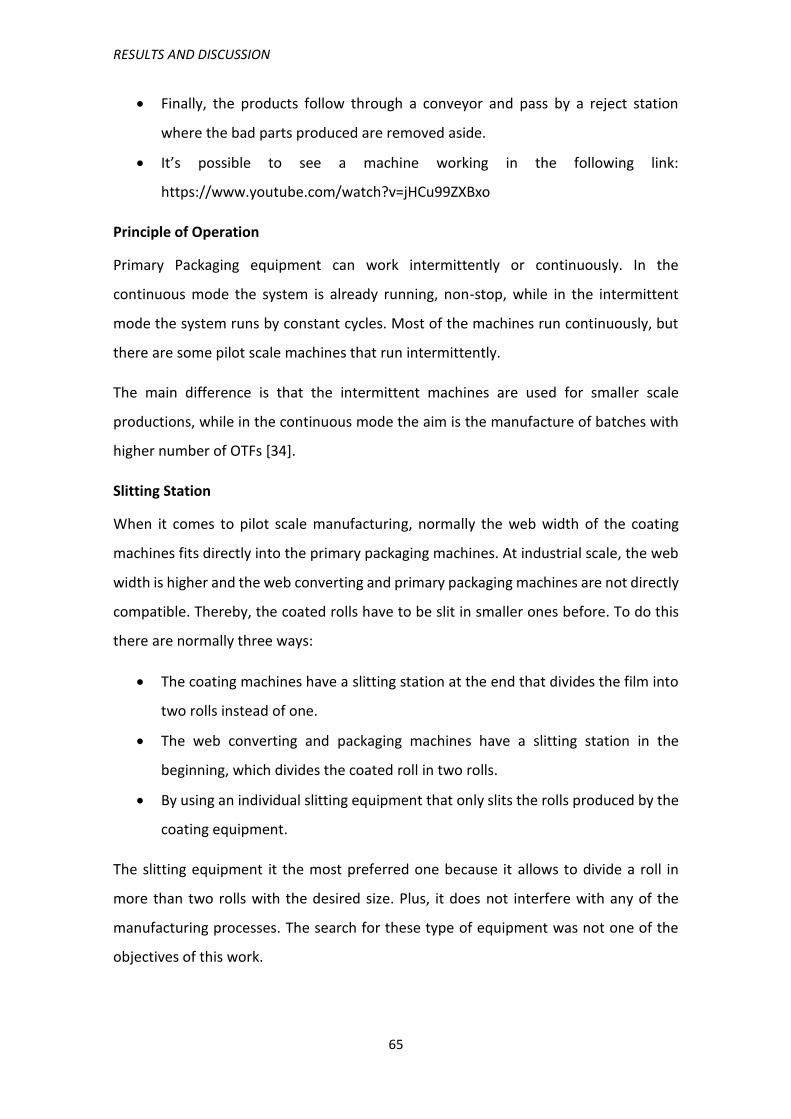
RESULTS AND DISCUSSION
65
Finally, the products follow through a conveyor and pass by a reject station
where the bad parts produced are removed aside.
It’s possible to see a machine working in the following link:
https://www.youtube.com/watch?v=jHCu99ZXBxo
Principle of Operation
Primary Packaging equipment can work intermittently or continuously. In the
continuous mode the system is already running, non-stop, while in the intermittent
mode the system runs by constant cycles. Most of the machines run continuously, but
there are some pilot scale machines that run intermittently.
The main difference is that the intermittent machines are used for smaller scale
productions, while in the continuous mode the aim is the manufacture of batches with
higher number of OTFs [34].
Slitting Station
When it comes to pilot scale manufacturing, normally the web width of the coating
machines fits directly into the primary packaging machines. At industrial scale, the web
width is higher and the web converting and primary packaging machines are not directly
compatible. Thereby, the coated rolls have to be slit in smaller ones before. To do this
there are normally three ways:
The coating machines have a slitting station at the end that divides the film into
two rolls instead of one.
The web converting and packaging machines have a slitting station in the
beginning, which divides the coated roll in two rolls.
By using an individual slitting equipment that only slits the rolls produced by the
coating equipment.
The slitting equipment it the most preferred one because it allows to divide a roll in
more than two rolls with the desired size. Plus, it does not interfere with any of the
manufacturing processes. The search for these type of equipment was not one of the
objectives of this work.

RESULTS AND DISCUSSION
66
Cutting System
The cutting technique used for OTF production is the kiss cut. It consists on making an
unique cut with the desired shape and size that only cuts the thin film but not the release
liner. In this way, the film waste (i.e. the surrounding edges) it’s peeled off and the
individual strips, with the defined size and shape, stay on the top of the release liner
until it is also peeled off and the strips transferred to the bottom packaging web
material.
Number of Lanes
Pilot scale machines normally have one operating lane. As for the commercial scale
equipment it is possible to work with more than one lane when they have a slitting statin
in their beginning. Thus, the process can be optimized which results in a higher output.
The different lanes run alongside at the same process velocity and the capacity of the
machine is calculated multiplying one lane output by the number of working lanes.
Printing and inspection features
Web converting and packaging machines for OTFs offer various options for printing. It is
possible to print not only the expiration date and the batch number, but also the
description of the content. Also it is possible to print directly in the OTF strip.
The inspection features assures that all the process is going well in real time, by
examining, for example, if the strip is correctly placed in the middle of the pouch, if the
sealing was correctly done or if there is any empty pouch. In case of any error the
machine gives an alert and the product is automatically rejected.
These features are chosen according to the production needs and although they do not
slow down the machines’ output, they can increase the machine cost significantly. The
Figure 25 shows a detail of an inspection toll inspecting the size of each OTF strip.

RESULTS AND DISCUSSION
67
Figure 25 - Detail of an in real time inspection tool. In this case it measures the size of the strips in
order to know if it was cut correctly (equipment from supplier P.A).
Pouch size, pouch material and sealing time
These three aspects are the most relevant to determine the output of these machines.
As referred before, there are two principal processes that occurs in these machines. The
conversion of the inserted film roll into individual OTFs and then the primary packaging
of those strips inside a pouch. These processes have to be synchronized so the machine
works properly. The actions that affect the process velocity in each part of the process
are: the cutting of the strips, for the conversion process, and the sealing of the packaging
material to form the pouch, for the primary packaging process.
According to the information collected form the suppliers, sealing the pouch is the
process that has more impact on the output of the machines because it takes more time
than the cutting of the strip that is very quick (kiss cut). Additionally, the sealing stations
have limited space for sealing so, if the pouch size increases, the number of pouch
produced in every sealing cycle decreases. Very important is also the type of packaging
material: different materials take different times to seal, higher sealing times reduce the
machine output. In addition to all this, for changing the pouch format new spare parts
may be needed and this means additional costs. In the Figure 26 it’s possible to see a
schematic representation of a layout of an OTF inside of a pouch.

RESULTS AND DISCUSSION
68
Figure 26 - Layout of a pouch with an OTF strip inside. Both dimensions represent the standard for this
particular product (courtesy of supplier P.B).
Thereby, it is important to have in mind that:
The selected packaging material must be resistant enough to protect the OTF,
mainly when the pouch is handled and easy to seal (small temperature and
quickly).
The size of the pouch must take into account the specifications of the sealing
station to optimize the project by trying to fit in every sealing cycle the maximum
number of pouches possible.
If possible, the size of the pouches should be maintained in order to maintain the
investment in spare parts at a minimum. With the right planning this can be
achievable because the size variation of the strips are not very significant.
The cost of the material is also a very important question. In some cases, the
packaging material contributes with the higher percentage of the costs. So, it is
very important to negotiate higher quantities in order to decrease the material
costs and to improve the cost-effectiveness of the manufacturing process.
Specifications of the Quoted Equipment
The four suppliers selected for web converting and packaging equipment delivered
quotations on both pilot (Table 16) and commercial scale equipment (Table 17).

RESULTS AND DISCUSSION
69
Type Primary Packaging Equipment (P)
Supplier A B C D
Equipment P1 P1 P1 P1
Code P.A-P1 P.B-P1 P.C-P1 P.D-P1
Length (mm) 6770 4520 4000 3060
Width (mm) 1500 1700 1600 1376
Height (mm) 1700 1850 2000 2006
Area (m2) 10,2 7,7 6,4 4,2
Approx. Weight (kg) 7000 3000 4000 3000
Accepted Web Width (mm)
250 200 150 150
N.º of Lanes 1 1 1 1
Principle of Operation
Continuous Continuous Intermittent Intermittent
Slitting Station (option)
No ? Yes Yes
Adaptable for TDDS Yes No Yes Yes
ndi: not delivered information
Table 16 - Specifications of the pilot web converting and packaging equipments.
The first two models (P.A-P1 and P.B-P1) work continuously while the last ones work
intermittently. By the definitions we’ve seen before, this should mean that the ones that
have an intermittent operation should have a lower capacity of production as we will
see later on.
All the models have just one lane of operation and a small web width. Although, this is
still a considerable width if we take into account that OTFs are significantly smaller,
normally not bigger with an area of 5 to 20cm2 [35].

RESULTS AND DISCUSSION
70
Type Primary Packaging Equipment (P)
Supplier A B C D
Equipment I1 I1 I1 I1
Code P.A-I1 P.B-I1 P.C-I1 P.D-I1
Length (mm) 10000 10000 12000 7150
Width (mm) 1870 2500 1600 3930
Height (mm) 2400 2000 2000 2320
Area (m2) 18,7 25,0 19,2 28,1
Approx. Weight (kg) ndi 6000 10000 ndi
Accepted Web Width (mm)
330 300 150 150
N.º of Lanes (Maximum)
4 3 4 3
Principle of Operation
Continuous Continuous Continuous Continuous
Slitting Station (option)
No Yes No Yes
Adaptable for TDDS Yes No No Yes
ndi: not delivered information
Table 17 - Specifications of the commercial scale web converting and packaging equipment.
Regarding the commercial scale models we see that the higher differences are in the
number of lanes and in the dimensions. All 4 models work continuously. As we will see,
the output of these machines are significantly higher, mainly because it’s possible to
operate more than one lane at the same time. In this cases, a slitting unit in the primary
packaging machine may not be needed because the web is already divided by the
number of working lanes.
It is also important to make a reference to the printing an inspection features, which are
not specified because it exists numerous options for each one of the pilot and industrial
machines machine and the chosen features depend on what kind of information must
be printed.
5.3.4 Final Remarks
We now know how these different types of equipment work and the critical parameters
that influence their performance. The collection of this information is very important
because it is not readily available in any source (books, papers, internet, etc.) and

RESULTS AND DISCUSSION
71
because it will contribute for the understanding of this non-conventional manufacturing
process. Furthermore, it will give a very important contribution for the design of a new
manufacturing facility dedicated to the manufacture of this novel dosage form, the first
of its kind in Portugal.
In a more detailed way it was possible to understand the manufacturing process and
identify the principal requisites.
In order to deepen even more the knowledge regarding these machines and the critical
quality and process attributes, it is necessary to continue the contact with the suppliers,
through more face-to-face meetings, visits to the machines manufacturing sites and
ultimately experiment these machines.
All the suppliers, mainly of mixing and coating equipment, offer trial services where a
team can go to a test facility not only to try the equipment but also to adapt the
parameters of the equipment to the desired formulation. In the case of the mixing
equipment it’s even possible to experiment an equipment in our own facilities.
5.4 Capacities Estimation
One of the main goals of this project was to determine the necessary production
capacity of the new manufacturing facility to meet OTFs’ forecasts.
In order to do it, we must first estimate the annual capacity of the coating and the web
converting and packaging equipment and then to confront it with Bluepharma’s
forecasts until 2025.
The calculations were made for both pilot and industrial scale.
The methods used for these calculations were are explained in the Methodology
chapter.
5.4.1 Coating Equipment Capacities
As seen before, the velocity of the coating machines depend on the dryer length. The
higher it is, the higher the velocity will be. As we know the Velocity of the process it’s
given by Eq. 2,

RESULTS AND DISCUSSION
72
𝑉𝑒𝑙𝑜𝑐𝑖𝑡𝑦 =𝐷𝑟𝑦𝑒𝑟 𝑙𝑒𝑛𝑔ℎ𝑡
𝐷𝑟𝑦𝑖𝑛𝑔 𝑡𝑖𝑚𝑒
So considering that the Drying Time of the Bluepharma’s formulation in a coating
machine is 10 minutes, the annual capacity of the coating equipment is given by using
Eq. 9
𝐶(𝑚2) = 𝑇𝑖𝑚𝑒 (𝑚𝑖𝑛) ∗ 𝑂𝐸𝐸 ∗ 𝑉𝑒𝑙𝑜𝑐𝑖𝑡𝑦(𝑚/𝑚𝑖𝑛) ∗ 𝑊𝑒𝑏 𝑊𝑖𝑑𝑡ℎ(𝑚)
Additionally, and as we’ve seen, it was considered 250 days of work per year, divided by
weeks of 5 days. We also considered 2 and 3 shifts of 8 hours per day to have two
scenarios.
Table 18 gathers all the necessary data for this estimation and has the results for the
annual capacities (in square meters of film) for each equipment model when working in
2 shifts and in 3 shifts.
Table 18 - Annual capacity of each pilot coating equipment considering 2 shifts and 3 shifts.
Looking to Table 18, Models C.A-P1 and C.D-P1 present the lowest capacities, while
models C.B-P1 and C.C-P1 present similar capacities. The machine C.A-P2 presents by
Type
Supplier B C D
Equipment P1 P2 P1 P1 P1
Code C.A-P1 C.A-P2 C.B-P1 C.C-P1 C.D-P1
Drying Time BLPH
formulation (min)
Useable Coating
Width (mm)120 200 250 200 100
Dryer Length(mm) 1600 3400 1660 1876 1500
Velocity (m/min) 0,16 0,34 0,17 0,19 0,15
OEE
Annual Capacity
(m2)2.269 8.036 4.905 4.434 1.773
Average
OEE
Annual Capacity
(m2)4.424 15.667 9.562 8.645 3.456
Average 8.351
Coating Equipment (C )
64,00%
A
10
2 Shift Operation
3 Shift Operation
49,24%
4.283

RESULTS AND DISCUSSION
73
far the higher capacity when compared with all the other options – 8.036m2 and
15.667m2. Another important thing to notice is the enormous difference between a
production with 2 shifts and with 3 shifts. This due to the higher time of production, and
also because of the OEE that is also significantly different by the reasons explained in
the Methodology: the equipment has to stop more times what increases its downtimes.
To facilitate the comparison between each machine, results are also displayed in Graphic 4
Graphic 4 - Calculated annual capacity for each pilot coating equipment, considering 2 or 3 shifts and
respective averages.
Concluding, we can say that C.A-P2 model is by far the option with the highest capacity,
and that the average capacity for a 2 shift operation is 4.283m2 and 8.351 m2 for 3 shifts.
We can say, that in average these models produce 94% more when running in 3 shifts
than when just work 2 shifts per day. Almost the double.
The Next table, Table 19, displays the estimations for the annual capacity of each
industrial scale model working in 2 or 3 shifts.
-
2
4
6
8
10
12
14
16
18
C.A-P1 C.A-P2 C.B-P1 C.C-P1 C.D-P1
Tho
usa
nd
s m
2
2 Shift Operation
3 Shift Operation
Average 2 shifts
Average 3 shifts

RESULTS AND DISCUSSION
74
Table 19 - Annual capacity of each pilot coating equipment considering 2 shifts and 3 shifts.
From the four models analyzed, we can notice that the capacities calculated are very
heterogeneous. However, model C.B-I1 is clearly the one that ensures the highest
annual capacity, followed by the C.A-I2. Like in the pilot equipment, the difference
between 2 and 3 shifts of operation is enormous.
Analyzing this table we can notice that the coating width, the dryer length and the
velocity are significantly higher than the values of Table 18, for pilot equipment.
In fact, looking to the Graphic 5, we realize that the industrial equipment can produce,
in average, ca. 8 times more area of film than the pilot equipment (if we compare the 3
shift operation capacities).
Type
Supplier B C
Equipment I1 I2 I1 I1
Code C.A-I1 C.A-I2 C.B-I1 C.C-I1
Drying Time BLPH
formulation (min)
Useable Coating
Width (mm)440 440 500 460
Dryer Length
(mm)4700 8500 9000 3810
Velocity (m/min) 0,47 0,85 0,90 0,38
OEE
Annual Capacity
(m2)24.440 44.200 53.182 20.713
Average
OEE
Annual Capacity
(m2)47.647 86.170 103.681 40.380
Average
Coating Equipment (C )
69.469
2 Shift Operation
3 Shift Operation
10
64,00%
49,24%
35.634
A

RESULTS AND DISCUSSION
75
Graphic 5 - The annual capacities of each industrial coating equipment, working in 2 or 3 shifts and
respective averages. Also it's represented the average of the 3 shifts operation of pilot equipment.
In the coating process, the size of the film for each product may vary and so it is best to
estimate the annual capacity in area than in number of films. Nevertheless it may be
important to have a notion of how many strips those capacities represent. Graphic 6 and
Graphic 7 show the conversion of the area to the corresponding number of OTF of a
standard size of 20x30 millimeters and a wasted area of 20%, as explained in chapter 4.
Graphic 6 - Number of OTFs that correspond to the produced area of each pilot coating equipment. A
standard size of 20x30mm per OTF was considered as well as a film waste of 20%.
-
20
40
60
80
100
120
C.A-I1 C.A-I2 C.B-I1 C.C-I1
Tho
usa
nd
s m
2
2 Shift Operation
3 Shift Operation
Average 2 shifts
Average 3 shifts
Avarage 3 shifts (Pilot)
-
5
10
15
20
25
C.A-P1 C.A-P2 C.B-P1 C.C-P1 C.D-P1
Mill
ion
s o
f O
TFs
2 Shift Operation
3 Shift Operation
Average 2 shifts
Average 3 shifts

RESULTS AND DISCUSSION
76
Graphic 7 - Number of OTFs that correspond to the produced area of each industrial coating
equipment. Was considered a 20x30mm OTF and a film waste of 20%.
There is an enormous difference separating the two scales. The best pilot option (C.A-
P2) can produce enough area for more than 20 million OTFs, while the best industrial
solution (C.B-I1) can produce an annual area of film for more than 160 million OTFs.
Another important thing to take from this charts, is that the pilot equipment can
produce, during the year, several pilot batches. The pilot batches are an important
requirement, because they are necessary to validate the manufacturing process.
Normally, a pilot batch need to have at least 100.000 product units [36]. In addition, the
high capacities of the pilot equipment makes it a good option for low productions and
niche products.
5.4.2 Packaging Equipment Capacities
As referred in the methodology chapter, the capacity of this type of equipment (number
of OTFs delivered by each machine inside a pouch) is given by the Eq. 10:
𝐶(𝑛𝑢𝑚𝑏𝑒𝑟 𝑜𝑓 𝑂𝑇𝐹𝑠) = 𝑇(min) ∗ 𝑂𝐸𝐸 ∗ 𝑁𝑜𝑡𝑓(𝑂𝑇𝐹
𝑚𝑖𝑛) ∗ 𝑁𝑙
Ns is the number of strips delivered in a certain range of time and the NL it’s the
maximum number of lanes which the machine can run.
For these calculations we’ve assumed again the standard strip size of 20x30 millimeters.
-
20
40
60
80
100
120
140
160
C.A-I1 C.A-I2 C.B-I1 C.C-I1
Mill
ion
s o
f O
TFs
2 Shift Operation
3 Shift Operation
Average 2 shifts
Average 3 shifts

RESULTS AND DISCUSSION
77
We already seen the meaning and advantages of the Overall Equipment Effectiveness
indicator. Although, we choose to use in this estimation the OEE of Bluepharma.
𝑂𝐸𝐸 𝐵𝑙𝑢𝑒𝑝ℎ𝑎𝑟𝑚𝑎 = 35%
Bluepharma only measures the OEE for packaging. The value is significantly lower than
the one we estimated for the production. However, this is an acceptable value for the
packaging phase in the pharmaceutical industry. In fact, reports say that generally
packaging OEE in pharma goes from 15% to 45% [37]. Also the suppliers confirmed this
information and explained us that this low OEE it’s due to the fact that there is a lot of
unexpected stops because of the complexity of these machines and also because the
packaging is always dependent on the production.
Table 20 gathers all the necessary data for the capacity estimation of the pilot primary
packaging equipment. In the same table are presented the results for the annual
capacities (in number of OTFs) for each equipment when working in 2 shifts and in 3
shifts.
Type Primary Packaging Equipment (P)
Supplier A B C D
Equipment P1 P1 P1 P1
Code P.A-P1 P.B-P1 P.C-P1 P.D-P1
Pouches per Minute 100 100 75 40
N.º of Lanes 1 1 1 1
Pouches per Hour 6.000 6.000 4.500 2.400
2 Shift Operation
OEE 35%
Annual Capacity (OTFs)
8.400.000 8.400.000 6.300.000 3.360.000
Average 6.615.000
3 Shift Operation
OEE 35%
Annual Capacity (OTFs)
12.600.000 12.600.000 9.450.000 5.040.000
Average 9.922.500
Table 20 - Annual capacities of the pilot primary packaging machine, in number of OTFs.
All the models analyzed have only one lane, and the maximum output claimed by the
suppliers don’t surpass the 100 pouches per minute. Models P.A-P1 and P.B-P1 present

RESULTS AND DISCUSSION
78
the same capacity. In the next chart it’s easy to compare all the different equipment
capacities.
Graphic 8 - The annual capacities of the pilot equipment for primary packaging and the respective
averages, in number of OTFs and considering a standard strip of 20x30 mm.
None of the machines, when working in two shifts can reach the 10 million of OTFs/year,
while the two first models can surpass the 12 million OTFs /per year if a 3 shift operation
is considered. We can conclude that those two machines would be able to convert and
pack the average area of film produced by the pilot coating machines in one year, as
showed in the Graphic 6. However, none of the options can assure the packaging of the
films manufactured during one year with coating equipment C.A-P2 in 3 shifts.
The next table (Table 21) displays all the needed information to calculate the capacities
of each industrial equipment.
-
2
4
6
8
10
12
14
P.A-P1 P.B-P1 P.C-P1 P.D-P1
Mill
ion
s o
f O
TFs
2 Shift Operation
3 Shift Operation
Average 2 shifts
Average 3 shifts

RESULTS AND DISCUSSION
79
Type Primary Packaging Equipment (P)
Supplier A B C D
Equipment I1 I1 I1 I1
Code P.A-I1 P.B-I1 P.C-I1 P.D-I1
Pouches per Minute 250 300 300 200
N.º of Lanes 4 3 4 3
Pouches per Hour 60.000 54.000 72.000 36.000
2 Shift Operation
OEE 35%
Annual Capacity (OTFs)
84.000.000 75.600.000 100.800.000 50.400.000
Average 77.700.000
3 Shift Operation
OEE 35%
Annual Capacity (OTFs)
126.000.000 113.400.000 151.200.000 75.600.000
Average 116.550.000
Table 21 - Annual capacities of the industrial primary packaging machine, in number of OTFs.
The industrial scale packaging equipment has, in average, an output ca. 12 times higher
than the pilot scale equipment, with 3 of the models analyzed exceeding the 100 million
of OTFs.
Graphic 9 - The annual capacities of the industrial equipment for primary packaging in number of OTFs
and the respective averages. It was considered a standard size of 20x30 millimeters.
-
20
40
60
80
100
120
140
160
P.A-I1 P.B-I1 P.C-I1 P.D-I1
Mill
ion
s o
f O
TFs
2 Shift Operation
3 Shift Operation
Average 2 shifts
Average 3 shifts

RESULTS AND DISCUSSION
80
The model P.C-I1 is the one with the highest capacity, ca. 150 million OTFs per year, at
full capacity (3 shifts). The model P.D-I1 from supplier “D” is the one with the lowest
capacity. The same happened in the pilot scale.
Only equipment P.C-I1 will be able to convert the area produced during one year and
working in 3 shifts by the most powerful coating equipment, the C.B-1.
5.4.3 Final Remarks
From the analysis of these results it is possible to conclude that the limiting step of OTFs
production is the web conversion and the primary packaging. This means that what will
define the number of products produced in one year is the capacity of the web
converting and packaging equipment. It’s also important to refer that these estimations
have some limitations:
The drying time considered for the coating process (T=10min) is significantly
higher than the normal values for OTFs. This assumption was made due to
composition of Bluepharma’s technology and considering a worst case scenario.
If it is possible to reduce the drying time for example to T=5min, the velocity of
the process in each machine would duplicate and the annual capacity too.
On the contrary, it is not possible to significantly increase the capacity of the
primary packaging equipment. Depending on the pouch size and material better
outputs can be achieved, but those variations are not in the same order of
magnitude as in the case of the coating machines.
In a normal scenario of an industrial production of OTFs, with one coating machine and
one primary packaging machine, it is this second equipment performance that will
determinate the annual capacity of the production process.

RESULTS AND DISCUSSION
81
5.5 Bluepharma Forecasts
Graphic 10- Bluepharma's Forecasts from 2018 to 2025.
Currently, the company has four products in pipeline, which will be referred by their
code names BlueOS1, BlueOS2, BlueOS3 and BlueOS4, due to confidential reasons.
Looking to the Graphic 10 we can have an idea concerning the expected sales evolution
of OTFs until 2025. This prediction points to the launch of BlueOS1 in 2018, BlueOS2 in
2019, BlueOS3 in 2021 and BlueOS4 in 2022. It’s also easily spotted that BlueOS03 is by
the best-selling product, followed by BlueOS01. Another important point is the total
number of OTFs predicted for 2025 – near 100 millions of strips. Further we will see the
concrete numbers for each year and each product (Table 23)
At this point it’s important to remember that the method of calculation of the capacities,
as we’ve seen before, is different from coating to web converting and primary
packaging. In the first case the unit used is square meters of film (m2) and in the second
case the unit is the number of OTFs.
Once the forecasts provided by Bluepharma are represented in number of OTF, they can
just be directly compared with the primary packaging capacities. In order to use this
forecasts for a comparison with the coating capacities estimated, we must convert it
into area of film.
To do this we must follow the procedure explained in the Methodology chapter and
apply the Eq. 12:
BlueOS1
BlueOS2
BlueOS3
0
20
40
60
80
100
2016 2017 2018 2019 2020 2021 2022 2023 2024 2025
Mill
ion
s o
f O
TFs
Predicted Sales Volumes by Year
Blue1 Blue2 Blue3 Blue4

RESULTS AND DISCUSSION
82
𝑇𝑜𝑡𝑎𝑙 (𝑎𝑟𝑒𝑎) = 𝛴(𝑁(𝑂𝑇𝐹𝑠) ∗ 𝑂𝑇𝐹 𝐴𝑟𝑒𝑎) + 20%
The Table 22 - Bluepharma OTFs sizes and areas.
Table 22 shows the different sizes and areas of the different BlueOS. As it possible to
see, not all of them have the final size approved, so we considered for those cases
(BlueOS3 and BlueOS4) a standard strip size of 20x30mm.
BlueOS1 BlueOS2 BlueOS3 BlueOS4
Strip Size (mm)
12,8x22
15x20 20x30* 20x30* 19,2x22
25,6x22
Strip Area (m2)
2,82E-04
3,00E-04 6,00E-04 6,00E-04 4,22E-04
5,63E-04
*standard strip
Table 22 - Bluepharma OTFs sizes and areas.
With the information of Table 22 we can now apply the Eq. 12 and convert Bluepharma’s
forecasts to area of film. The fact that the BlueOS1 presents 3 different sizes, it’s because
this product will be marketed in different doses and each size means a different dose of
the product.
Thereby, in the next two tables (Table 23 and Table 24) it’s shown the company forecasts
in number of OTFs and area of film, respectively.
Year 2018 2019 2020 2021 2022 2023 2024 2025
BlueOS1 17.580.000 18.810.000 24.960.000 24.960.000 24.960.000 24.960.000 24.960.000 24.960.000
BlueOS2 3.782.352 4.181.968 4.571.476 4.749.556 4.917.556 5.085.556 5.253.556
BlueOS3 27.417.840 34.272.300 41.126.760 47.981.220 54.835.680
BlueOS4 4.048.400 6.072.600 8.069.700 10.120.900
TOTAL (OTFs) 17.580.000 22.592.352 29.141.968 56.949.316 68.030.256 77.076.916 86.096.476 95.170.136
Table 23 - Bluepharma's forecasts for each product.

RESULTS AND DISCUSSION
83
Year 2018 2019 2020 2021 2022 2023 2024 2025
BlueOS1 6.559 7.010 9.306 9.306 9.306 9.306 9.306 9.306
BlueOS2 1.362 1.506 1.646 1.710 1.770 1.831 1.891
BlueOS3 19.741 24.676 29.611 34.546 39.482
BlueOS4 2.915 4.372 5.810 7.287
TOTAL (m2) 6.559 8.372 10.812 30.693 38.607 45.060 51.494 57.966
Table 24 - Bluepharma's sales forecast converted to area of film.
The areas calculated (Table 24) will be used to analyze the capacities of the different
coating models while the values of Table 23 will be used to do the same exercise but
with the primary packaging equipment.
5.6 Equipment Capacity V.S. Bluepharma Forecasts
The purpose of this confrontation it’s to determine if the coating and primary packaging
equipment models analyzed in this project can guarantee, or not, the predicted
production of Bluepharma. For that, a series of timeline tables that display if a
determined machine can ensure the company’s forecast in each of the years, will be
presented.
5.6.1 Coating Equipment
Table 25 shows the forecast for the area of film that is necessary to be manufactured in
each year. Then, the models of the pilot coating equipment are considered at the left
side of the table, for 2 shift and 3 shift operations.
Year 2018 2019 2020 2021 2022 2023 2024 2025
TOTAL (m2) 6.559 8.372 10.812 30.693 38.607 45.060 51.494 57.966
Pilo
t sc
ale
2 Shift Operation
C.A-P1 n n n n n n n n
C.A-P2 y n n n n n n n
C.B-P1 n n n n n n n n
C.C-P1 n n n n n n n n
C.D-P1 n n n n n n n n
3 Shift Operation
C.A-P1 n n n n n n n n
C.A-P2 y y y n n n n n
C.B-P1 y y n n n n n n
C.C-P1 y y n n n n n n
C.D-P1 n n n n n n n n
Table 25 - Confrontation between the pilot coating equipment capacities and the company's forecasts.

RESULTS AND DISCUSSION
84
The green cells with a “y” means that the equipment in that line can ensure the
necessary production for that year. On the contrary, the red cells with an “n” means that
the equipment alone does not have the necessary capacity for the projected production
for that year. For example, the model C.A-P2 when working 2 shifts per day, can ensure
the full production of the year 2018, but not in any of the other years.
Looking again to Table 25, we conclude that with a 2 shift operation, only model C.A-P2
is able to produce the required quantity, but only in the first year (2018). Considering a
3 shift operation, this machine is able to assure the production of OTF until 2020, and
models C.B-P1 and C.C-P1 can assure it until 2019.
In conclusion we can say that pilot coating equipment is not a suitable option in the long
term, but it can be a possibility for the first years of production. Plus, it can be used to
produce pilot batches and niche products.
Year 2018 2019 2020 2021 2022 2023 2024 2025
TOTAL 6.559 8.372 10.812 30.693 38.607 45.060 51.494 57.966
Co
mm
erci
al s
cale
Eq
uip
men
t
2 Shift Operation
C.A-I1 y y y n n n n n
C.A-I2 y y y y y n n n
C.B-I1 y y y y y y y n
C.C-I1 y y y n n n n n
3 Shift Operation
C.A-I1 y y y y y y n n
C.A-I2 y y y y y y y y
C.B-I1 y y y y y y y y
C.C-I1 y y y y y n n n
Table 26 - Confrontation between the industrial coating equipment capacities and the company's
forecast.
When considering the industrial coating equipment, the results are totally different, as
showed in the Table 26. All the models have the necessary capacity for the full industrial
production of the projected amounts of OTFs until 2020, for a 2 shift operation, and until
2022, if 3 shits per day are considered. Nevertheless, it’s important to refer that in the
first case, none of the options can guarantee the production in all of the years, while in
the 3 shift operation, only two models (C.A-I2 and C.B-I1) can satisfy the full production

RESULTS AND DISCUSSION
85
until 2025. This evaluation is important not only to have an estimation of the overall
budget for the project but also for dividing the budget per year.
5.6.2 Primary Packaging Equipment
Table 27 displays if the different pilot scale models can or cannot support the predicted
full production for each year. As we know at this point, this analysis is made in number
of OTFs and not in area of film.
Year 2018 2019 2020 2021 2022 2023 2024 2025
TOTAL 17.580.000 22.592.352 29.141.968 56.949.316 68.030.256 77.076.916 86.096.476 95.170.136
Pilo
t Eq
uip
men
t
2 Shift Operation
P.A-P1 n n n n n n n n
P.B-P1 n n n n n n n n
P.C-P1 n n n n n n n n
P.D-P1 n n n n n n n n
3 Shift Operation
P.A-P1 n n n n n n n n
P.B-P1 n n n n n n n n
P.C-P1 n n n n n n n n
P.D-P1 n n n n n n n n
Table 27 - Confrontation between the pilot primary packaging equipment capacities and the
company's forecast.
None of the pilot scale equipment is able to ensure complete production in any year.
This tells already that the investment in an equipment like this is not enough even in the
short term for the packaging of the commercial scale production.
Year 2018 2019 2020 2021 2022 2023 2024 2025
TOTAL 17.580.000 22.592.352 29.141.968 56.949.316 68.030.256 77.076.916 86.096.476 95.170.136
Ind
ust
rial
sca
le E
qu
ipm
ent
2 Shift Operation
P.A-I1 y y y y y y n n
P.B-I1 y y y y y n n n
P.C-I1 y y y y y y y y
P.D-I1 y y y n n n n n
3 Shift Operation
P.A-I1 y y y y y y y y
P.B-I1 y y y y y y y y
P.C-I1 y y y y y y y y
P.D-I1 y y y y y n n n
Table 28 - Confrontation between the industrial primary packaging equipment capacities and the
company's forecast.
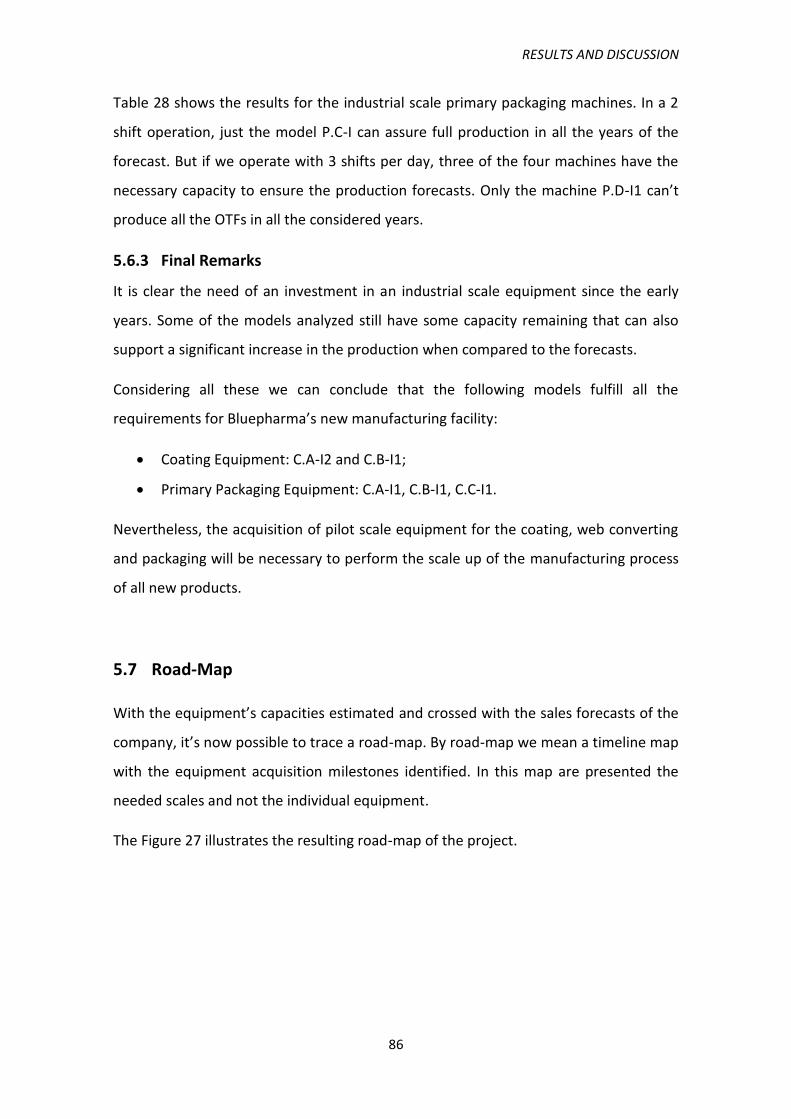
RESULTS AND DISCUSSION
86
Table 28 shows the results for the industrial scale primary packaging machines. In a 2
shift operation, just the model P.C-I can assure full production in all the years of the
forecast. But if we operate with 3 shifts per day, three of the four machines have the
necessary capacity to ensure the production forecasts. Only the machine P.D-I1 can’t
produce all the OTFs in all the considered years.
5.6.3 Final Remarks
It is clear the need of an investment in an industrial scale equipment since the early
years. Some of the models analyzed still have some capacity remaining that can also
support a significant increase in the production when compared to the forecasts.
Considering all these we can conclude that the following models fulfill all the
requirements for Bluepharma’s new manufacturing facility:
Coating Equipment: C.A-I2 and C.B-I1;
Primary Packaging Equipment: C.A-I1, C.B-I1, C.C-I1.
Nevertheless, the acquisition of pilot scale equipment for the coating, web converting
and packaging will be necessary to perform the scale up of the manufacturing process
of all new products.
5.7 Road-Map
With the equipment’s capacities estimated and crossed with the sales forecasts of the
company, it’s now possible to trace a road-map. By road-map we mean a timeline map
with the equipment acquisition milestones identified. In this map are presented the
needed scales and not the individual equipment.
The Figure 27 illustrates the resulting road-map of the project.
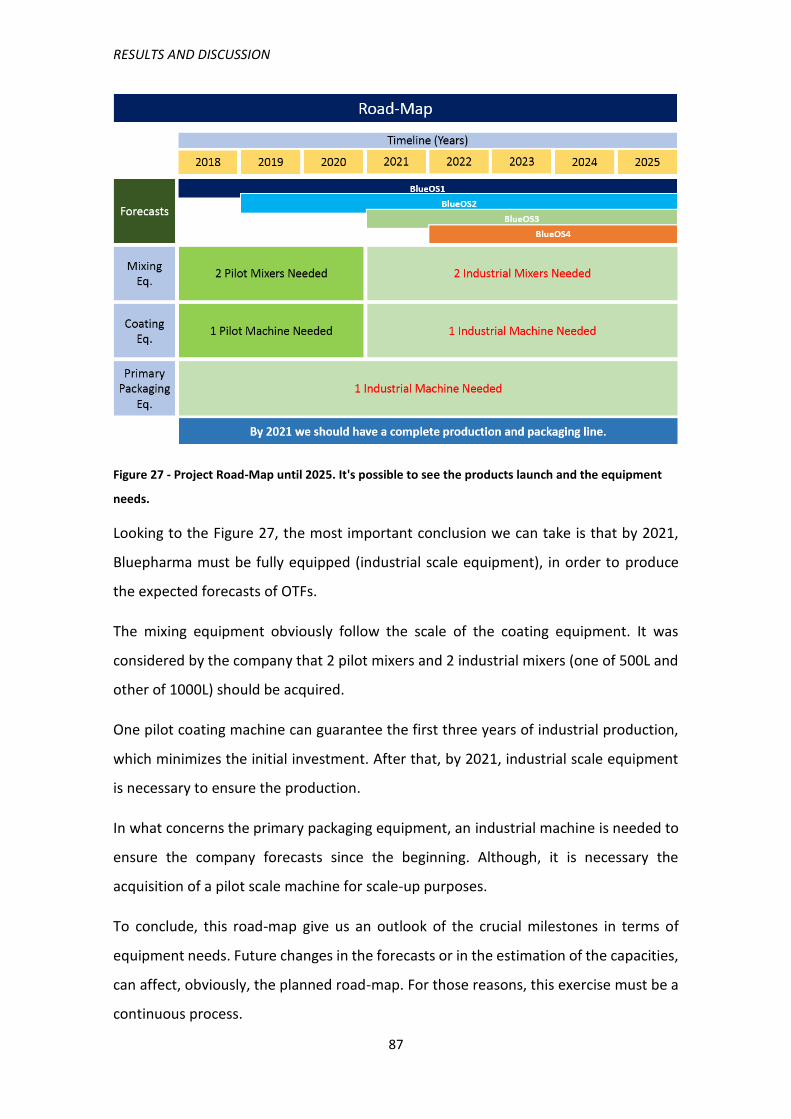
RESULTS AND DISCUSSION
87
Figure 27 - Project Road-Map until 2025. It's possible to see the products launch and the equipment
needs.
Looking to the Figure 27, the most important conclusion we can take is that by 2021,
Bluepharma must be fully equipped (industrial scale equipment), in order to produce
the expected forecasts of OTFs.
The mixing equipment obviously follow the scale of the coating equipment. It was
considered by the company that 2 pilot mixers and 2 industrial mixers (one of 500L and
other of 1000L) should be acquired.
One pilot coating machine can guarantee the first three years of industrial production,
which minimizes the initial investment. After that, by 2021, industrial scale equipment
is necessary to ensure the production.
In what concerns the primary packaging equipment, an industrial machine is needed to
ensure the company forecasts since the beginning. Although, it is necessary the
acquisition of a pilot scale machine for scale-up purposes.
To conclude, this road-map give us an outlook of the crucial milestones in terms of
equipment needs. Future changes in the forecasts or in the estimation of the capacities,
can affect, obviously, the planned road-map. For those reasons, this exercise must be a
continuous process.

RESULTS AND DISCUSSION
88
5.8 Investment Analysis
Table 26 shows the range of investment necessary for each type of equipment and
according to their scale. Due to confidential reasons it’s not possible to present the
prices for each one of the models analyzed.
Figure 28 - Investment range table. Each range displays the lowest and the highest budgetary
quotation received for that type of equipment and its respective scale.
Each range displays the lowest and the highest budgetary quotation for that equipment
type. All the models analyzed in this project were considered to this investment analysis.
Crossing this information with the road-map, we can get the investment road-map.

RESULTS AND DISCUSSION
89
Figure 29 - Road-Map of investment. Shows the necessary investment needed in order to fulfil the
sales forecasts. In the bottom it is also possible to see the global investment range (in equipment
only).
Figure 29 shows us when and how much the company has to invest in equipment, in
order to fulfill the expected production of OTFs.
As described above, there are two main investment milestones, the first is in 2018 and
the second is in 2021. The necessary investment in a pilot coating machine, in an
industrial primary packaging machine and in 2 pilot mixers of 50L represents an
investment ranging from approx. 1 Million Euros to approx. 2.7 Million Euros. Three
years from that, an industrial machine for coating is needed. The option for a mixer of
500L and another of 1000L was decided by the company. This investment may reach
approx. 2.2 Million Euros in the more expensive solution and around 1.2 Million if all the
less expensive equipment is acquired considering today’s quotations.
Concluding, the global investment range in equipment can go from 2.287.687,00 € to
4.956.750,00 €.
The investment described before represents only the investment in mixing, coating and
primary packaging equipment taking into account the company forecasts. These are not

RESULTS AND DISCUSSION
90
the only costs for the set-up of the new manufacturing facility. Building a facility involves
several other investments (e.g. building, air systems, etc) and other types of equipment
not included here such as the secondary packaging machines and the slitting machines.
Additionally, and as said before, it is also planned the acquisition of a pilot primary
packaging machine for scale-up purposes.
According to Bluepharma’s know-how, the additional estimated costs must be
considered:
Facility building costs: approx. 1.500.000,00€;
Other infrastructures: approx. 500.000,00 €;
Pilot primary packaging machine: from 494.800,00 € to 886.415,00 €;
Other equipment (i.e. secondary packaging machine): approx. 500.000,00 €
Adding these costs to the investment already considered, we will get the total
investment range necessary to implement a facility for the production of oral thin films
(Table 29).
Table 29 - Total investment range and average value for setting up the new manufacturing facility.
It’s important to refer that the facility building costs presented took into account the
space needs that resulted of our outline design of the manufacturing facility, which can
be seen in the next chapter.
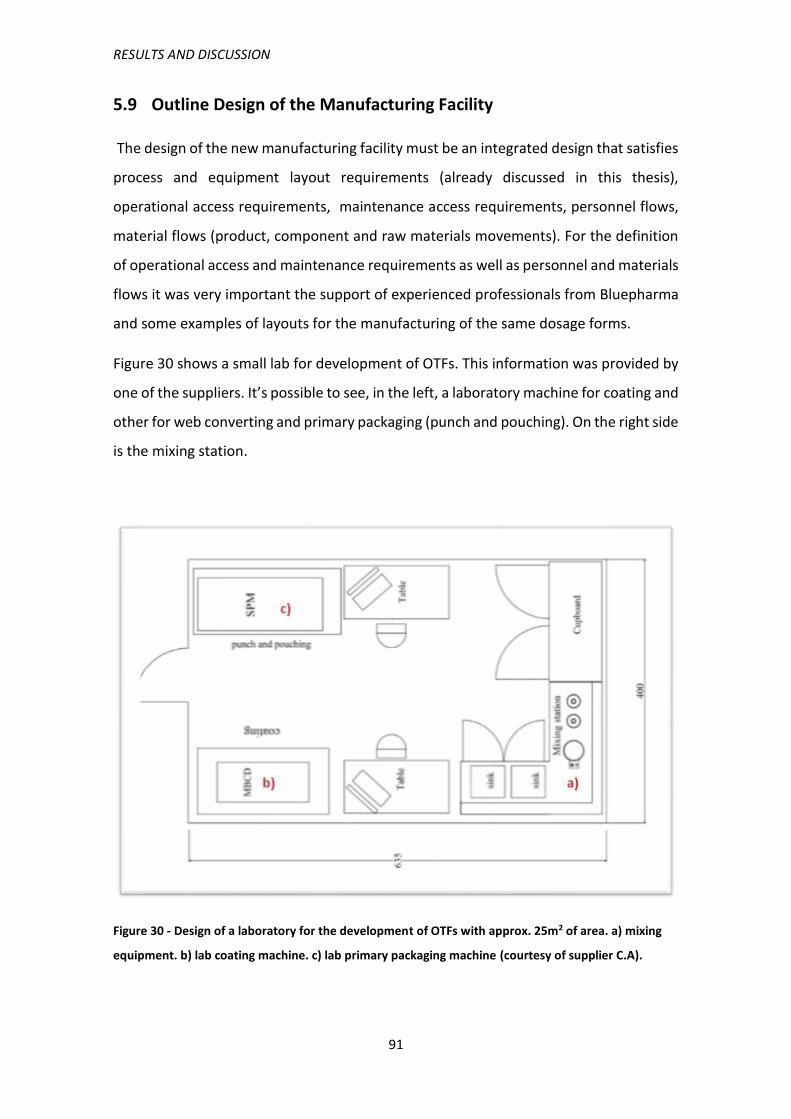
RESULTS AND DISCUSSION
91
5.9 Outline Design of the Manufacturing Facility
The design of the new manufacturing facility must be an integrated design that satisfies
process and equipment layout requirements (already discussed in this thesis),
operational access requirements, maintenance access requirements, personnel flows,
material flows (product, component and raw materials movements). For the definition
of operational access and maintenance requirements as well as personnel and materials
flows it was very important the support of experienced professionals from Bluepharma
and some examples of layouts for the manufacturing of the same dosage forms.
Figure 30 shows a small lab for development of OTFs. This information was provided by
one of the suppliers. It’s possible to see, in the left, a laboratory machine for coating and
other for web converting and primary packaging (punch and pouching). On the right side
is the mixing station.
Figure 30 - Design of a laboratory for the development of OTFs with approx. 25m2 of area. a) mixing
equipment. b) lab coating machine. c) lab primary packaging machine (courtesy of supplier C.A).

RESULTS AND DISCUSSION
92
Figure 31 - Draw of a medium industrial installation for the production of OTFs with approx. 432m2 of
area (courtesy of supplier C.A).
Figure 31 shows a medium size (432 m2 of total area) manufacturing facility for the
commercial scale of OTFs. The rooms A and B is where the release liner rolls and the
mixing ingredients are delivered. It must be separated rooms because each type of
product will follow a different flow - the release liner follows to the coating room E and
the mixing ingredients go to the mixing room C. The room D is the Quality Control (QC)
room. For our project it will not be considered because the QC will be in the actual
facility. On the center it’s possible to see the coating room (E) with the coating machine.
It has a technical room, one of the critical aspects as we will see. The room F is a depot
to store the coated film rolls before they go to conversion and packaging. The web
converting and primary packaging machine is located on room G and it is also possible
to find a cartoning machine for the secondary packaging, where the pouches are putted
inside of boxes. The final product (OTF box) it’s then put in pallets (room H) and stored
in the outgoing depot (I) to be shipped. This plant was also provided by the same supplier
that provided the laboratory plant.
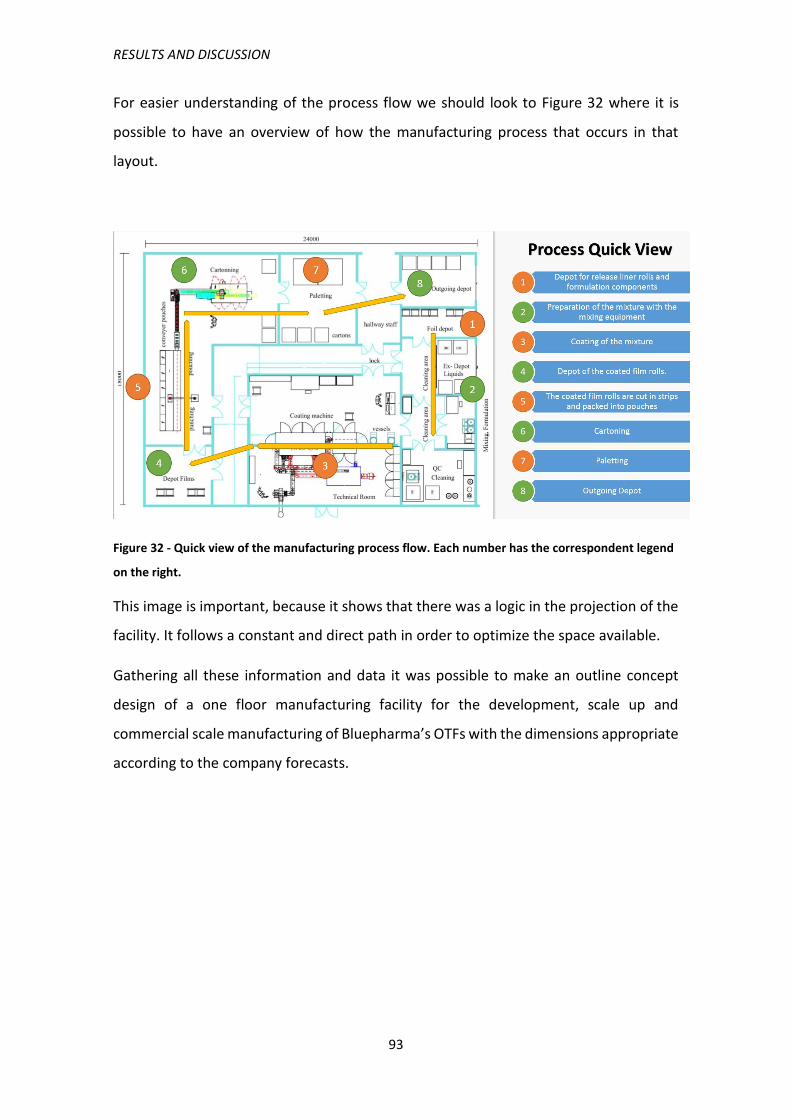
RESULTS AND DISCUSSION
93
For easier understanding of the process flow we should look to Figure 32 where it is
possible to have an overview of how the manufacturing process that occurs in that
layout.
Figure 32 - Quick view of the manufacturing process flow. Each number has the correspondent legend
on the right.
This image is important, because it shows that there was a logic in the projection of the
facility. It follows a constant and direct path in order to optimize the space available.
Gathering all these information and data it was possible to make an outline concept
design of a one floor manufacturing facility for the development, scale up and
commercial scale manufacturing of Bluepharma’s OTFs with the dimensions appropriate
according to the company forecasts.
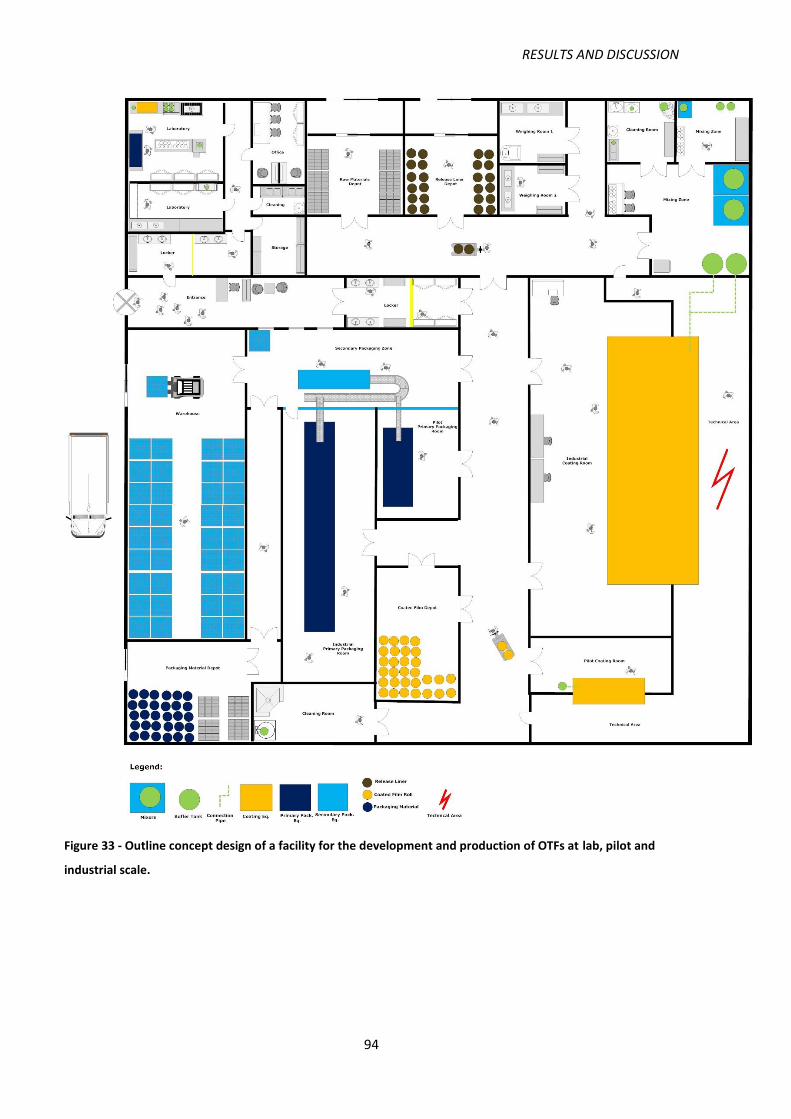
RESULTS AND DISCUSSION
94
Figure 33 - Outline concept design of a facility for the development and production of OTFs at lab, pilot and
industrial scale.

RESULTS AND DISCUSSION
95
Figure 34 - Outline concept design of a facility for the development and production. The letters and
number in this figure help to understand the following text
RESULTS AND DISCUSSION
96
Figure 33 and Figure 34 show the concept plant of the manufacturing facility designed
for this project. The second image has letters that will help to understand the next
paragraphs.
The first concern was, of course, the space. As we have seen, machines have very
different areas. Thereby, we decides to represent the ones with higher areas and
consider the possibility to expand the capacity in the future. The coating machines (pilot
and industrial) are represented in orange and the primary packaging equipment in dark
blue. Also, a secondary packaging machine it’s represented in light blue and the mixers
and buffer tanks in green.
Also in this image there are several rolls represented: the ones in brown represent the
release liner. The orange ones the coated film rolls, i.e. the release liner already with the
film on it. Finally the dark blue rolls represent the packaging material.
We separated the laboratory area from the rest. So it’s considered that pilot and
industrial scale are both in the production zone of the facility. This must be like this
because even though pilot scale represents a lower scale, it must also comply with the
GMP.
The staff entry (and exit) is made through Ent1/Exit1. People that work in the laboratory
enters to the lab zone (L) through the locker room L1 and the production personnel
through L2 locker room. These happens because lab and production have different
requirements. Plus, they are two independent activities and it’s recommended to have
them separated.
As already said before, a Quality Control (QC) room is not necessary in this plant,
because it will be located in other adjacent facility.
The second entry of the facility (Ent2) is the door for the entry of the production raw
materials and the release liner (for coating and mixing). The release liner is stored in the
depot room D1 and the materials for the mixing process are stored in a second depot,
D2. They must be separated first because they will follow different paths (the release
liner goes directly to the coating room (C) and the mixture ingredients to the mixing
RESULTS AND DISCUSSION
97
room (M)) and second because the mixing ingredients are often very sensitive and
should be stored in more controlled conditions.
The plant presents one more entry (Ent3) that is dedicated exclusively for the packaging
material. This happens due to the proximity to the packaging zone (PP and SP) but mainly
because this material should be separated from the production raw materials for safety
reasons. Much of this material is carton and paper for the secondary packaging and can
liberate dust and other particles that could contaminate other products. These materials
are stored in the depot D4.
The D3 depot is where the coated film rolls are kept after the coating process. They must
be stored in a controlled room in order to preserve the film. According with the
contacted suppliers if the film doesn’t contain organic components it can be stored for
a long period, normally more than six weeks. If there are organic components on the
film formulation, the conversion to strips and primary packaging should happen until
forty eight hours after end of coating process.
Looking again to the top of the plant, W1 and W2 are two weighing rooms to weigh the
different components of the formulation with weighing machines with different sizes
and precisions in order to serve the different scales. They are next to the mixing room
for convenience.
There are two cleaning rooms (Cl1 and Cl2). The first is located in the top of the plant
and serves the mixing area. The second is located near the coating and the packaging
areas and it’s supposed to be used to clean the mixture tanks after they are used in the
coating process and to clean other equipment or tools of the coating and packaging
processes.
In what concerns the mixing area (M), it must have the necessary space to accommodate
pilot scale and industrial scale mixing equipment. As we have seen industrial mixers can
go to thousands of liters. If we have only one pilot mixer it’s recommended to have two
portable buffer tanks. In this way, after the mixture in the reactor is finished it can be
discharged to a tank that will be transported and connected to the coating machine. The
reactor can then be cleaned and used again. When finished it can be discharged to the
other buffer tank as the first one goes to clean. For industrial mixers transportable buffer

RESULTS AND DISCUSSION
98
tanks can also be used, however it’s recommended that the mixture is discharged to big
buffer tanks that are fixed. These last ones in their turn, are directly connected to one
(or more) coating machine through a complex system of pipes and pumps that guide the
mixture directly from the deposit to the coating head pump. In the Figure the industrial
mixers are represented by the letter “m” and the buffer tanks, connected to the coating
room, by the letter “b”. Also, smaller mixers and buffer tanks (for pilot production) are
represented in this floor plan.
The coating rooms (C) are the areas where the coating equipment are placed. Due to
the contact with the suppliers we were also able to collect some important information
on the requisites of those zones:
Technical room (T): the coating machines often need small adjustments and
have a very complex air ducts. Thus, it’s recommended to have a physically
separated technical area from the coating room with an independent
entrance. The back of the coating machine should fit through the physical
barrier so it can be accessed through the technical room.
The place where the coating machine operates must be a closed cleanroom.
A cleanroom is a controlled environment normally used in the most diverse
industries, where the level of micro particles (as dust, pollutants, etc.) are
maintained at very low levels. To guarantee this, and as the suppliers
explained, HEPA (high-efficiency particulate arrestance) air filters systems
are placed in the room. In the case of OTF production this rooms must be
cleanrooms class 10.000 (by USA regulation) or Class B (by EU GMP
guidelines). This means, that an area of one cubic feet can’t have more than
10.000 particles equal or superior than 0,5um or, by the European guidelines,
on cubic meter can’t have more than 350.000 particles of 0,5um when the
machine is operating. Due to all this, these rooms should have proper air
handler units (AHU) that together with HEPA systems can regulate the quality
of air in the room and also its temperature and humidity.
Despite of the quality of the air in the room, the coating machines’ dryers are
closed systems with their own AHUs that suck the air from the room, heat it
and then the hot air is expelled (together with the solvents) to outside of the

RESULTS AND DISCUSSION
99
facility. Also inside the coating machine, the air quality should be class
10.000. This means that the air sucked from the room, which in theory is
already a “cleaned” air, passes again in the filters of the coating machine air
system. This happens because it’s crucial that the air is always clean and in
circulation, to reach a high quality drying process with hot air. Normally, the
volume of air changed every hour is 8 times the volume of the room.
The room pressure should be normal but the pressure inside the dryer of the
coating machine must be negative, this means lower than room pressure.
This happens mainly because of safety reasons, preventing contamination. If
a door of the dryer opens or there is a fugue, the air inside the dryer (that
may contains dangerous components for the health) will not escape to the
outside. On the contrary, the air of the room will get inside the dryer so the
pressure reaches an equilibrium. This is another reason why the air in the
room has the same quality as the air inside the coating machine.
The recommend temperature for the room is 22ºC and the humidity 55%.
Primary Packaging equipment doesn’t have a closed air system, like the coating
machines. Nevertheless, the web converting process is still considered part of the
production process. Thereby, for the rooms where these machines are placed (PP) all
the suppliers recommend to have the same cleanroom conditions as in the coating
process. This means that the room where the machines is placed should also be a clean
room class 10.000.
Also, there is no need for a technical area, because the adjustments on the machine are
made through the front part by opening the machine doors. Nevertheless there are
other manufacturing aspects that must be considered:
The secondary packaging room (SP) has the secondary packaging equipment where the
pouches are placed into carton boxes. All the suppliers told us that this area must be
physically separated from the primary packaging room (PP). This is explained by the fact
that the secondary packaging material (normally carton) may release dust and other
particles into the air that can contaminate the OTF strips before they’re sealed into the
pouch. To optimize the process, it’s normal that the physical barrier between the two

RESULTS AND DISCUSSION
100
rooms have a very small opening were the conveyor that comes from the primary
packaging machine passes through, connecting the two machines. The air pressure in
the primary packaging room should be higher than in the secondary packaging room, so
the air from this last one does not get into the primary packaging room though the
referred opening.
To conclude, the facility has approx. 35m by 36m, which represents a total area of
approx. 1260m2.
5.9.1 Final Remarks
It is important to refer that there are still many more things to consider. The
manufacturing of pharmaceutical products involves a lot of regulations, rules and well
defined procedures, like the implementation of the Good Manufacturing Procedures
(GMP). It was not an objective to look to all of these requirements and moreover,
Bluepharma have a considerable internal know-how in the production of oral dosage
forms with the highest standards of quality.

RESULTS AND DISCUSSION
101
CHAPTER 6
Conclusions

CONCLUSIONS
102
6 Conclusions
6.1 Main Conclusions
The following bullets resume the main conclusions of this dissertation:
There is a clear geographical division between the OTF manufacturers and the
equipment suppliers;
The models analyzed are comparable to each other and can assure a proper
scale-up;
The critical requisites were identified and will contribute to a deeper
understanding of the manufacturing process and to the design of a new facility,
the first in Portugal;
The output of the coating machines depend directly on the drying time and
conditions, while in the primary packaging machines the output it’s mainly
determined by the pouch characteristics. This means that the coating process it’s
directly related with the type of the formulation;
The limiting step of the manufacturing process it’s the primary packaging.
Thereby, the maximum annual capacity it’s approx. 150M OTFs;
The output of the industrial machines, when compared with the pilot equipment,
is ca. 8 times higher for the coating equipment and ca. 12 higher for the primary
packaging equipment;
The capacity estimation of the coating machines can be significantly increased,
but not for the primary packaging equipment;
There are equipments that can meet Bluepharma’ sales forecasts.
Pilot equipment it’s an option for the coating process but not for the primary
packaging process. However, by 2021 a complete industrial line it’s needed to
fulfill the company forecasts;
There is no direct relation between the output and the investment of the three
types of equipments analyzed;
The global investment range goes from 5,2M€ to 8,3M€ (approx.).
Considering the biggest equipment models, the facility must have approx.
1200m2 of area. The critical process requisites were also identified.

CONCLUSIONS
103
6.2 Personal Considerations
In what concerns the objectives of this project, I would say that the results are positive
and surpassed my expectations:
The major players in this area were identified as well as the principal suppliers of
equipment. I believe this information improves understanding that the company
has about the this particular environment;
Thirty nine different equipments were studied during the duration of this
project. For each one of those models it was received an official budgetary
quotation with very technical information and, of course, the investment
involved. Through the analysis of those long documents we were able to
understand more and more of each type of equipment and, thereby, identify the
most critical aspects and how they determine the output;
Consequently to the previous point, we were able to understand how to
estimate the capacities of the equipment by applying a consistent method. Even
though there are many factors that can contribute to the output of each
machine, I truly believe that the results we got were extremely accurate if we
take into account the internal information available at the time of this project.
The company has now the clear notion of what each scale of production
represents in terms of capacity.
It was determined the range of investment in equipment and was also estimated
the global investment of the complete facility. Even though that for confidential
reasons we can’t reveal the prices of each equipment, the results give a clear
notion of what the company should expect for this project in terms of
investment. I believe this an important legacy of this project that can help the
company in future decisions;
The outline of the new facility was a big challenge. It was not the objective to
have a detailed floor plan of it, but the result gives the company already
important information, like the space needed and can serve as a good basis for
the future. Additionally to the requirements in terms of space, it was possible to
identify several manufacturing requisites for this technology. This part was
another big challenge for me, which made me go into the field several times, talk

CONCLUSIONS
104
with very expert people in the company and make a lot of experiences until
achieving the presented result.
It was the main objective of this project to leave in the company a work that could serve
has basis for the future implementation of a new facility. I place my confidence that this
goal was accomplished. The results in this thesis were also presented to the company
and received very positive feedbacks.
These last nine months were undoubtedly an enormous challenge and one of the most
learning experiences I have ever had. I had full support of the company during my
trainee and freedom to develop my work. The guidance I had during the project was of
extreme quality and availability, which helped me in every step. I was also completely
integrated in the company’s routine and I was able to learn what means to work in a top
level company. For all this reason I’m extremely satisfied with the experience and the
resulting work.
6.3 Future Work
There is still a long way to go and more knowledge is still necessary. Thereby, several
tasks are suggested for future work in this project:
To reduce the number of suppliers and consequently the investment range,
through face-to-face meetings, visits to the factories and benchmarking;
To improve the manufacturing facility concept design through trained people in
architecture and engineering;
Start a procurement process for secondary packaging material and slitting
stations;
Gather information about the pouch size and material in order to determine
more accurately the sealing time;
To improve the accuracy of the considered drying time in the coating process.
It can be made, for example, in a pilot facility of a supplier.

CONCLUSIONS
105
CHAPTER 7
S.W.O.T. Analysis

S.W.O.T. ANALYSIS
106
7 S.W.O.T. Analysis
To conclude, S.W.O.T. analysis was made, to evaluate the strengths, the weaknesses,
the opportunities and threats of the OTFs project in the company.
Clearly the major weaknesses are the lack of know-how in this manufacturing process
and the investment that it represents. Also, economic factors should be taken into
account both for the opportunities and threats. If it’s true that the economy is starting
to grow again, uncertainty around the Greek situation and the agitated European
political scenario can affect negatively the economic and consequently the investment
capacity of the companies.
On the other side, Bluepharma has already a very substantial scientific knowledge
concerning this technology. The fact that it’s still a recent dosage form and that there
are few products on the market it’s an opportunity. Plus, Bluepharma it’s a company
dedicated to the external market, which together with its FDA approved manufacturing
facility can be a good advantage. Figure 35, bellow, displays the S.W.O.T. analysis made
for this project.

S.W.O.T. ANALYSIS
107
Figure 35 - Bluepharma's OTFs project S.W.O.T. analysis.
Bluepharma is a young and ambitious company, which has already a history of success.
The Oral Thin Film technology represents an opportunity which can take the company
to play in a completely different level. But like all great opportunities, there is a risk
associated. The path made so far resulted in good results and makes the company look
to the future with hope and expectation. It’s important that the good work can be
maintained, and that the market possibilities can be continuously updated and
evaluated. Only well based decisions can reduce its inherent risks.

S.W.O.T. ANALYSIS
108

S.W.O.T. ANALYSIS
109
CHAPTER 8
References
REFERENCES
110
8 References
[1] T. Forissier, “Patient Adherence: The Next Frontier in Patient Care,” 2011.
[2] P. Kardas, P. Lewek, and M. Matyjaszczyk, “Determinants of patient adherence: a review of systematic reviews.,” Front. Pharmacol., vol. 4, p. 91, Jan. 2013.
[3] “Digital Technologies to Boost Patient Compliance - a FirstWord Dossier report.” [Online]. Available: http://www.firstwordplus.com/FWD0510910.do. [Accessed: 26-Jun-2015].
[4] A. F. Borges, C. Silva, J. F. J. Coelho, and S. Simões, “Oral films: Current status and future perspectives: I - Galenical development and quality attributes.,” J. Control. Release, vol. 206, pp. 1–19, May 2015.
[5] “GLOBAL DELIVERY MARKET - Advanced Drug Delivery Systems: mAb, RNAi, & Breaking the Blood-Brain Barrier.” [Online]. Available: http://www.drug-dev.com/Main/Back-Issues/GLOBAL-DELIVERY-MARKET-Advanced-Drug-Delivery-Syst-804.aspx. [Accessed: 21-Jun-2015].
[6] R. J. Mrsny, “Oral drug delivery research in Europe.,” J. Control. Release, vol. 161, no. 2, pp. 247–53, Jul. 2012.
[7] H. Rosen and T. Abribat, “The rise and rise of drug delivery.,” Nat. Rev. Drug Discov., vol. 4, no. 5, pp. 381–5, May 2005.
[8] J. T. Schiele, R. Quinzler, H.-D. Klimm, M. G. Pruszydlo, and W. E. Haefeli, “Difficulties swallowing solid oral dosage forms in a general practice population: prevalence, causes, and relationship to dosage forms.,” Eur. J. Clin. Pharmacol., vol. 69, no. 4, pp. 937–48, Apr. 2013.
[9] M. Dahiya, S. Saha, and A. F. Shahiwala, “A review on mouth dissolving films.,” Current drug delivery, vol. 6, no. 5. pp. 469–476, 2009.
[10] N. G. R. Rao, I. J. Chem, P. Sci, N. Khatoon, and B. M. Reddy, “OVERVIEW ON FAST DISSOLVING ORAL FILMS,” Int. J. Chem. Pharm. Sci., vol. 1, no. 1, pp. 63–75, 2013.
[11] MP Advisors, “Innovative Drug Delivery Systems Opportunities for Generic & Specialty Pharmaceutical companies : ReportsnReports,” 2014.
[12] E. M. Hoffmann, A. Breitenbach, and J. Breitkreutz, “Advances in orodispersible films for drug delivery.,” Expert opinion on drug delivery, vol. 8, no. 3. pp. 299–316, 2011.
REFERENCES
111
[13] H. Kathpalia and A. Gupte, “An introduction to fast dissolving oral thin film drug delivery systems: a review.,” Curr. Drug Deliv., vol. 10, no. 6, pp. 667–84, Dec. 2013.
[14] M. D. N. Siddiqui, G. Garg, and P. K. Sharma, “A Short Review on ‘ A Novel Approach in Oral Fast Dissolving Drug Delivery System and Their Patents ’ Conventional oral Modified release Fast action oral solid,” vol. 5, no. 6, pp. 291–303, 2011.
[15] A. Mishra, Renuka, Amin, “Manufacturing Techniques of Orally Dissolving Films,” Pharm. Technol., vol. 35, no. 1, pp. 1–5, 2011.
[16] S. Malke, S. Shidhaye, J. Desai, and V. Kadam, “Oral Films - Patient Compliant Dosage Form For Pediatrics,” Internet J. Pediatr. Neonatol., vol. 11, no. 2, pp. 1–10, 2011.
[17] J. O. Morales and J. T. McConville, “Manufacture and characterization of mucoadhesive buccal films,” Eur. J. Pharm. Biopharm., vol. 77, no. 2, pp. 187–199, 2011.
[18] “Dissolving Films,” Particle Sciences. 2010.
[19] A. Arya, A. Chandra, V. Sharma, and K. Pathak, “Fast dissolving oral films: An innovative drug delivery system and dosage form,” Int. J. ChemTech Res., vol. 2, no. 1, pp. 576–583, 2010.
[20] S. Garg, D. Goldman, M. Krumme, L. C. Rohan, S. Smoot, and D. R. Friend, “Advances in development, scale-up and manufacturing of microbicide gels, films, and tablets,” Antiviral Res., vol. 88, no. SUPPL., pp. S19–S29, 2010.
[21] A. F. Borges, C. Silva, J. F. J. Coelho, and S. Simões, “Oral films: Current status and future perspectives II — Intellectual property, technologies and market needs,” J. Control. Release, vol. 206, pp. 108–121, 2015.
[22] IBISWorld, “Thin Film Drug Manufacturing in the US Market Research | IBISWorld,” 2014.
[23] R. Analysis, “Oral Thin Films Market, 2015-2025,” 2015.
[24] “OEE Overall Equipment Effectiveness Categories.” [Online]. Available: http://www.oee.com/oee-factors.html. [Accessed: 27-Jun-2015].
[25] Messekompakt, “Pharma Machinery ‘Made in Germany’ is the World’s leader.” 2014.
[26] Markets and Markets, “Pharmaceutical Packaging Equipment Market.”

REFERENCES
112
[27] “Top Pharmaceutical Companies in Germany.” [Online]. Available: http://finance.mapsofworld.com/company/pharmaceutical/germany.html. [Accessed: 01-Jun-2015].
[28] “Fast Dissolving Films: A Novel Approach to Oral Drug Delivery.” [Online]. Available: http://iomcworld.com/ijptp/files/Pandya Ketul et at., june 2013.pdf. [Accessed: 22-Jun-2015].
[29] W. Himmelsbach, D. Houlton, W. Keller, and M. Lovallo, “Mixing Systems : Design and Scale Up,” Chemical Engineering. 2006.
[30] I. Werke, “IKA Dispersing.” [Online]. Available: http://www.ika.com/Dispersing_appl-5.html. [Accessed: 18-Jun-2015].
[31] Silverson, “Solutions for Your Toughest Mixing Applications.”
[32] European Union, “‘ Atex Guidelines ,’” no. MARCH 1994, 2013.
[33] “The Growing Importance Of Release Liners In Pharmaceutical Manufacturing | Pharmaceutical Technology,” Pharmaceutical Technology. [Online]. Available: http://www.pharmtech.com/growing-importance-release-liners-pharmaceutical-manufacturing. [Accessed: 29-Jun-2015].
[34] “Difference Between Intermittent & Continuous Production System.” [Online]. Available: http://kalyan-city.blogspot.com/2013/02/difference-between-intermittent.html. [Accessed: 12-Jun-2015].
[35] M. Irfan, S. Rabel, Q. Bukhtar, M. I. Qadir, F. Jabeen, and A. Khan, “Orally disintegrating films: A modern expansion in drug delivery system,” Saudi Pharm. J., 2015.
[36] “Glossary of Pharmaceutical and Biotechnology Terminology |,” ISPE. [Online]. Available: http://www.ispe.org/glossary?term=Pilot+Scale+Batch. [Accessed: 16-Jun-2015].
[37] J. Butschli, “Tracking elusive OEE in pharmaceutical packaging,” Packaging World, 2009.

REFERENCES
113

REFERENCES
114


![FEUP | PDEEC | Decision Support January 3 rd, 2011 Metaheuristics: GRASP Group 1: Clara Gouveia Daniel Oliveira Fabrício Sperandio Filipe Sousa [Presenter]](https://img.dokumen.tips/doc/110x75/56649d2c5503460f94a02eba/feup-pdeec-decision-support-january-3-rd-2011-metaheuristics-grasp-group.jpg)