Embed Size (px)
Citation preview

StatisticsTrends
The Recording Industry in Japan
2012
日本のレコード産業 2012
StatisticsTrends
The Recording Industry in Japan
2012
RIAJ YEARBOOK 2012

Contents
Overview of Production of Recordings and Digital Music Sales in 2011............................ 1
Statistics by Format (Unit Basis — Value Basis)......................................................................... 4
. . 1..Total.Recorded.Music.—.Production.on.Unit.Basis.................................................................... 4
. . 2..Total.Audio.Recordings.—.Production.on.Unit.Basis................................................................... 4
. . 3..Total.CDs.—.Production.on.Unit.Basis....................................................................................... 4
. . 4..Total.Recorded.Music.—.Production.on.Value.Basis.................................................................. 5
. . 5..Total.Audio.Recordings.—.Production.on.Value.Basis................................................................ 5
. . 6..Total.CDs.—.Production.on.Value.Basis..................................................................................... 5
. . 7..CD.Singles.—.Production.on.Unit.Basis..................................................................................... 6
. . 8..5".CD.Albums.—.Production.on.Unit.Basis................................................................................ 6
. . 9..Music.Videos.—.Production.on.Unit.Basis................................................................................. 6
. . 10..CD.Singles.—.Production.on.Value.Basis................................................................................... 7
. . 11..5".CD.Albums.—.Production.on.Value.Basis.............................................................................. 7
. . 12..Music.Videos.—.Production.on.Value.Basis............................................................................... 7
. . 13..Digital.Music.Sales.................................................................................................................... 8
. . 14..Digital.Music.Sales.by.Contents................................................................................................. 8
. . 15..Recorded.Music.—.Production.on.Unit.Basis........................................................................... 10
. . 16..Recorded.Music.—.Production.on.Value.Basis........................................................................ 11
. . 17..Newly.Released.Audio.Recordings........................................................................................... 12
. . 18..Audio.Recording.Catalogue.Listings......................................................................................... 13
. . 19..Newly.Released.Audio.Recordings.(1957-2011)...................................................................... 14
. . 20..Audio.Recording.Catalogue.Listings.(1971-2011).................................................................... 15
. . 21..Newly.Released.Music.Videos................................................................................................. 16
. . 22..Music.Video.Catalogue.Listings............................................................................................... 16
. . 23..Number.of.Domestic.Debut.Artists........................................................................................... 17
. . 24..Number.of.Record.Rental.Shops.............................................................................................. 17
. . 25..Annual.Chart.of.Digital.Single.Tracks.for.Mobile.Phones.in.2011.............................................. 17
Related Data............................................................................................................................................ 18
. . 26..26th.Japan.Gold.Disc.Award.2012.......................................................................................... 18
. . 27..Certified.Million-selling.Titles................................................................................................... 20
. . 28..Certified.Million-selling.Titles.in.2011...................................................................................... 21
. . 29..Amount.Collected.for.Sound.Recordings.and.Others................................................................ 22
. . 30..Global.Share.of.Sales.of.Recorded.Music................................................................................. 23
. . 31..Global.Sales.of.Recorded.Music.by.Country.in.2010................................................................ 24
RIAJ Member Companies (in chronological order as of the date of joining RIAJ or Company foundation)........................................................................................................................... 25
N.B. 1.Thecurrentyear’sresultsarecompiledresultsofthemembercompaniesofRIAJ.AbovefiguresalsoincludeOEMsalesbyRIAJmembersfornon-RIAJmembers.
2.Figuresarerounded,hencethepossibledifferencebetweenbreakdownandtotal.

TheRecordingIndustryinJapan
1RIAJ Yearbook 2012
Digital Music20%
Music Videos20%
Digital Music23%
Music Videos16%
Digital Music22%
Music Videos17%
Audio61%
Audio61%
Audio60%
OverviewofProductionofRecordingsandDigitalMusicSalesin2011
[Reference]
Composition of Recorded Music and Digital Music — Value Basis
● 2009 ● 2010 ● 2011
(Millions/Billionsofyen)
Units vs. prev. yr Value vs. prev. yr
Audio 200 95% 211.7 94%
Music Videos 60 129% 70.2 120%
Recorded Music (Total of Audio/Music Videos) 260 101% 281.9 99%
Digital Music 367 83% 72.0 84%
N.B. 1.Thecurrentyear’sresultsarecompiledresultsofthe59membercompaniesofRIAJ.AbovefiguresalsoincluderecordedmusicimportedbyRIAJmembersaswellasOEMsalesbyRIAJmembersfornon-RIAJmembers.
2.Figuresarerounded,hencethepossibledifferencebetweenbreakdownandtotal.
Audio RecordingsRegarding audio recordings, unit production decreased 5% to 199.51 million units and fell 6% to 211.7 billion yen on a value basis from the previous year. Specifically, unit production and value of CD albums dropped 14% and 11%, respectively, while CD singles rose significantly, in which unit production increased 23% to 62.4 million units and value increased 16% to 43.2 billion yen. As a result, CD singles achieved steady growth and were up for the second consecutive year both in terms of unit production and value. Market share of domestic recorded music remained unchanged from the previous year, in which the composition of domestic and international recorded music respectively was 80% and 20% on a unit production basis and 82% and 18% on a value basis. Also, the percentage of domestic and international recorded music for the total of audio recordings and music videos was 84% and 16% (versus 83% and 17% in the previous year), respectively.
Music VideosProduction of music videos amounted to 60.17 million units with a value of 70.2 billion yen, an increase of 29% and 20%, respectively. As a result of numerous shipments for certain video titles, unit production of music DVDs rose 27% to 58.14 million units and 13% to 64.1 billion yen on a value basis from the previous year. Additionally, music Blu-ray Discs, for which
the market has been expanding in recent years, jumped dramatically by 364% to 2.02 million units on a unit production basis and 294% to 6.1 billion yen on a value basis, and thus were a key factor in realizing an increase in music videos.
Digital MusicDigital music sales amounted to 72.0 billion yen in value, repre-senting a decrease for the second consecutive year. This is largely attributable to a 22% decline both in unit and value of mobile digital contents, which account for 81% of the Japanese digital music market. Conversely, Internet downloads, including smartphones, recorded significant growth of 23% on a unit basis and 24% on a value basis. In terms of value by format, all formats were up from the previous year, in which sales of single track downloads rose 29%, album downloads increased 15% and music video downloads climbed 23%, thereby indicating a shifting trend from mobile phones, PC and smartphones. As a result, the percentage of sales of Internet downloads and mobile digital contents respectively was 18% and 82% (versus 12% and 88% in the previous year). Accordingly, the percentage of Internet downloads is expanding every year in the digital music market.
In.2011,.the.total.production.value.of.recorded.music.(audio.and.music.video.recordings).decreased.slightly.by.1%.to.281.9.billion.yen..Nonetheless,.unit.production.in.this.segment.performed.relatively.well.with.a.year-on-year.increase.of.1%.to.260.million.units,.thereby.surpassing.the.previous.year.for.the.first.time.in.six.years..At.the.same.time,.digital.music.was.down.16%.to.72.0.billion.yen.versus.the.previous.year..As.a.result,.the.production.value.of.recorded.music.and.digital.music.sales.decreased.4%.to.353.8.billion.yen.

The
Rec
ordi
ngIn
dust
ryin
Jap
an
2 RIAJ Yearbook 2012
N.B. Figuresarerounded,hencethepossibledifferencebetweenbreakdownandtotal.
● Recorded Music — Unit Basis ● Recorded Music — Value Basis
● Digital Music — Unit Basis ● Digital Music — Value Basis
OverviewofProductionofRecordingsandDigitalMusicSalesin2011
0
200,000
400,000
0
20,000
40,000
60,000
80,000
0
100
200
300
0
100
200
300
400
Millions of units Billions of yen
Thousands of units Millions of yen
273
214
59
319
267
52303
248
56
66.9
249.6
316.5
391.1
333.3
57.8361.8
296.1
65.6
30,983
433,996
16464,996
41,869
437,285
34479,188
46,813
421,349
468,22360
75,487
5,923
68,016
1,548
90,547
9,015
79,854
90,982
10,209
79,250
1,678 1,523
1,056
2009 2010 201120082007 2009 2010 201120082007
2009 2010 201120082007 2009 2010 201120082007
260
200
60
70.2
211.7
281.9
61,015
303,763
367,285
2,506
71,961
12,569
58,337
256
210
46
58.6
225.0
283.6
49,491
391,807
441,457159
85,990
10,123
74,745
1,121
Internet Downloads Mobile Others Internet Downloads Mobile Others
Audio Music Videos Audio Music Videos
Mobile81%
Others1%
Internet Downloads17%
Domestic84%
International16%
Audio75%
Music Videos25%
● Composition of Recorded Musicby Format in 2011 — Value Basis
● Composition of Digital Music by Format in 2011 — Value Basis
● Composition of Domestic and International Recorded Music in 2011 — Value Basis

TheRecordingIndustryinJapan
3RIAJ Yearbook 2012
● Production of Recorded Music in 2011
● Sales Figures of Digital Music in 2011
(Thousands/Millionsofyen)
Item Units Share vs. prev. yr Value Share vs. prev. yr
Audio
Singles
3" CDs
D. 3,146 2 2,953 225 0 570
I. 5 0 1,350 1 0 302
T. 3,152 2 2,947 225 0 568
5" CDs
D. 57,878 29 116 42,072 20 114
I. 1,369 1 267 943 0 258
T. 59,247 30 117 43,015 20 116
Sub-Total
D. 61,025 31 122 42,296 20 115
I. 1,374 1 267 944 0 258
T. 62,399 31 123 43,240 20 116
5" CD Albums
D. 96,669 48 84 128,253 61 89
I. 37,495 19 91 37,007 17 91
T. 134,164 67 86 165,260 78 89
CD Total
D. 157,693 79 96 170,550 81 94
I. 38,869 19 93 37,951 18 92
T. 196,563 99 95 208,501 99 94
Vinyl Discs
D. 125 0 243 202 0 241
I. 84 0 157 134 0 154
T. 210 0 199 336 0 197
Cassettes
D. 2,104 1 73 1,727 1 75
I. 0 0 0 0 0 0
T. 2,104 1 73 1,727 1 75
Others
D. 191 0 114 226 0 108
I. 445 0 221 864 0 303
T. 635 0 172 1,090 1 220
Total
D. 160,113 80 95 172,704 82 94
I. 39,399 20 94 38,949 18 94
T. 199,511 100 95 211,653 100 94
Music Videos
DVDs
D. 52,909 88 129 58,537 83 114
I. 5,233 9 106 5,519 8 106
T. 58,143 97 127 64,056 91 113
Blu-ray Discs, Tapes and Others 2,031 3 355 6,140 9 289
Total
D. 54,801 91 132 64,285 92 121
I. 5,373 9 107 5,911 8 106
T. 60,174 100 129 70,197 100 120
Recorded Music(Total of Audio/Music Videos)
Audio 199,511 77 95 211,653 75 94
Music Videos 60,174 23 129 70,197 25 120
Total 259,685 100 101 281,850 100 99
Video(inc. Music Videos)
DVDs 106,023 89 109 155,962 81 97
Blu-ray Discs, Tapes and Others 12,893 11 157 35,656 19 134
Total 118,916 100 113 191,618 100 103
Total of Audio/Video 318,427 100 101 403,271 100 98
N.B. 1.Thecurrentyear’sresultsarecompiledresultsofthe59membercompaniesofRIAJ.AbovefiguresalsoincluderecordedmusicimportedbyRIAJmembersaswellasOEMsalesbyRIAJmembersfornon-RIAJmembers.
2.Figuresarerounded,hencethepossibledifferencebetweenbreakdownandtotal. 3.OthersinAudio:TotalnumberofSACDs,DVDs-Audio,DVDs-MusicandMDs
(Thousands/Millionsofyen)
Jan. 2011 - Dec. 2011
Units Share vs. prev. yr Value Share vs. prev. yr
Internet Downloads 61,015 17% 123% 12,569 17% 124%
Mobile 303,763 83% 78% 58,337 81% 78%
Others 2,506 1% 1572% 1,056 1% 94%
Total 367,285 100% 83% 71,961 100% 84%
N.B. 1.Figuresrepresentdigitalmusicsalesincomederivedfromdirect,licenseorconsignmentsalesby59RIAJmembercompanies. 2.Definitions *InternetDownloads:Salesofsingles,albums,musicvideosandothermusic-relatedcontentsoverwirednetworks *Mobile:Salesoffullsingletracks,originalsoundrecordingringtones,ringbacktunes,musicvideosandothermusic-relatedcontentsoverwirelessnetworks 3.Unit:Figuresrepresentsinglesona“per-track”basisandalbumsona“per-album”basis.(Downloadtimesofanalbumwillbecountedasoneandnumberofsongswillnot
becounted.) Value:NetincomebyRIAJmembercompanies 4.SmartphonesareincludedinInternetDownloads.

The
Rec
ordi
ngIn
dust
ryin
Jap
an
4 RIAJ Yearbook 2012
0
2008 2009 201020062005200420032002 2007
2008 2009 201020062005200420032002 2007
2008 2009 201020062005200420032002 2007
2011
2011
2011
0
100
200
300
0
100
200
300
0
100
200
300
Millions of units
Millions of units
Millions of units
Total
Domestic
International
Total
Audio
Music Videos
Total
Domestic
International
43353215
328
361
343
358
313
347
310
353
49 52 56
298
347
267248
319303
59
214
273
63 56
204 192
267248
48
167
214
7779
251
328
265
343
79
234
313
82
228
310
81
217
298
62 56
198 187
260242
48
162
210
81
220
302
81
210
290
77
238
315
78
250
329
78
224
302
46
210
256
42
168
210
42
165
207
60
200
260
39
160
200
39
158
197
1.TotalRecordedMusic—ProductiononUnitBasis
2.TotalAudioRecordings—ProductiononUnitBasis
3.TotalCDs—ProductiononUnitBasis
StatisticsbyFormat(UnitBasis—ValueBasis)

TheRecordingIndustryinJapan
5RIAJ Yearbook 2012
0
2008 2009 201020062005200420032002 2007
2008 2009 201020062005200420032002 2007
2008 2009 201020062005200420032002 2007
2011
2011
2011
0
100
200
300
400
500
0
100
200
300
400
0
100
200
300
400
Total
Audio
Music Videos
Total
Domestic
International
Total
Domestic
International
Billions of yen
Billions of yen
Billions of yen
56.8
351.6
408.4
57.8 65.6
333.3296.1
391.1361.8
66.9
249.6
316.5
55.056.537.7 53.9
367.2399.7443.8
377.4
422.2456.2481.5
431.3
259.6
351.6
92.0
256.8231.6
333.3296.1
76.5 64.6
193.6
249.6
56.0
271.8292.9
333.4
273.1
367.2
399.7443.8
377.4
95.4106.8110.4 104.3
91.6
252.9
344.5
75.7 64.1
251.5227.1
327.2291.3
55.7
190.3
246.0
94.9105.9109.8 103.5
264.9282.1
322.0
265.1
359.8
388.0431.8
368.6
58.6
225.0
283.6
183.5
225.0
41.5
41.1
180.9
222.0
70.2
211.7
281.9
172.7
211.7
38.9
38.0
170.6
208.5
4.TotalRecordedMusic—ProductiononValueBasis
5.TotalAudioRecordings—ProductiononValueBasis
6.TotalCDs—ProductiononValueBasis

The
Rec
ordi
ngIn
dust
ryin
Jap
an
6 RIAJ Yearbook 2012
0
2008 2009 201020062005200420032002 2007
2008 2009 201020062005200420032002 2007
2008 2009 201020062005200420032002 2007
0
100
200
2011
2011
2011
0
20
40
60
80
0
10
20
30
40
50
60
Total
Domestic
International
Total
Domestic
International
Total
DVDs
Blu-ray Discs,Tapes and Others
Millions of units
Millions of units
Millions of units
48
49
1
5255
5256
0 0
59
59
0
42
43
1
30
32
2
34
35
1
62(5")
2 1 (5")1 (3")
66(5")
86
88
2 1 (5")0 (3")
73(5")
8(3")
81
83
20(3") 3
1 (5")2 (3")
65(5")
14(3")
79
82
64
65(5")
6761
53
1 1 (5")0 (3")
2(3")
2(3")
0(3")
65
1 0 (5")0 (3")
68
61(5")
1 1 (5")0 (3")
0(3")
53(5")
0 0 (5")0 (3")
62
54
44
0(3")
44(5")
1 1 (5")0 (3")
45
223
143
80
199189
137 134
62 55
165
118
47
237227246
220
156153169
145
817577 75
46
46
1
50
0(3")
50(5")
1 1 (5")0 (3")
51
156
115
41
11
4
15
58
60
2
61
3(3")
58(5")
1 1 (5")0 (3")
62
134
97
37
StatisticsbyFormat(UnitBasis—ValueBasis)
7.CDSingles—ProductiononUnitBasis
8.5"CDAlbums—ProductiononUnitBasis
9.MusicVideos—ProductiononUnitBasis
N.B.TheproductionvolumeofBlu-rayDiscsin2011amountedto2,020,000units.

TheRecordingIndustryinJapan
7RIAJ Yearbook 2012
0
20
40
60
2008 2009 201020062005200420032002 2007
2008 2009 201020062005200420032002 2007
2008 2009 201020062005200420032002 2007
2011
2011
2011
0
10
20
30
40
50
60
0
100
200
300
Total
DVDs
Blu-ray Discs,Tapes and Others
Total
Domestic
International
Total
Domestic
International
Billions of yen
Billions of yen
Billions of yen
0.4
50.5
50.8
50.1(5")
0.3(3")
0.3 (5")0.0 (3")
0.4 0.2
46.6
39.7
46.9
39.9
46.4(5")
39.6(5")
0.1(3")
0.1(3")
0.4 (5")0.0 (3")
0.2 (5")0.0 (3")
0.4
33.7
34.1
33.6(5")
0.1(3")
0.4 (5")0.0 (3")
53.4
55.0
1.6
55.8
56.8
1.0
57.4
65.257.8
65.6
0.4 0.4
65.7
66.9
1.1
50.6
56.5
28.5
5.99.2
37.7
91.2
202.4
293.7
75.3 63.9
204.9187.4
280.2251.3
55.3
156.6
211.9
94.4104.8108.7 102.6
216.5228.7
262.6
214.0
310.9333.6
371.3
316.6
0.5
48.4
48.9
48.0(5")
0.4(3")
0.5 (5")0.0 (3")
1.1
53.3
54.4
50.3(5")
3.1(3")
1.0 (5")0.1 (3")
1.1
59.4
60.5
55.6(5")
3.8(3")
1.1 (5")0.1 (3")
0.9
51.1
52.0
49.9(5")
1.2(3")
0.7 (5")0.2 (3")
51.8
53.9
2.1
0.4
36.9
37.3
36.9(5")0.0(3")
0.4 (5")0.0 (3")
56.5
58.6
2.1
40.7
144.0
184.8
0.9
42.3
43.2
42.1(5")0.2(3")
0.9 (5")0.0 (3")
64.1
70.2
6.1
37.0
128.3
165.3
10.CDSingles—ProductiononValueBasis
11.5"CDAlbums—ProductiononValueBasis
12.MusicVideos—ProductiononValueBasis
N.B.TheproductionvalueofBlu-rayDiscsin2011amountedto6.1billionyen.

The
Rec
ordi
ngIn
dust
ryin
Jap
an
8 RIAJ Yearbook 2012
13.DigitalMusicSales
StatisticsbyFormat(UnitBasis—ValueBasis)
● 2011
● Composition of Digital Music by Format — Value Basis
14.DigitalMusicSalesbyContents
Internet Downloads11%
Others2%
Mobile87%
2010 20112009Internet Downloads
12%Others
1%
Mobile87%
Internet Downloads17%
Others1%
Mobile81%
2005 20112008 2009 20102006 2007
9,001
9,46393
368
22,369
23,903
28,644
30,983829
402 38,105
41,8691,574
3
42,511
46,813 2,024
44,617
2,850
49,491
2,700
54,955
3,357
61,015
1,132
1,511
2,190
Thousands of units
Music Videos
Others
Single Track
Album
0
10,000
20,000
30,000
40,000
50,000
60,000
1,7482,555
● Internet Downloads — Unit Basis
N.B.Figuresarerounded,hencethepossibledifferencebetweenbreakdownandtotal.
(Thousands/Millionsofyen)
FormatJan. 2011 — Dec. 2011
Units Share vs. prev. yr Value Share vs. prev. yr
Internet Downloads
Single Track 54,955 15% 123% 8,112 11% 129%
Album 3,357 1% 118% 3,758 5% 115%
Sub-Total (Audio) 58,312 16% 123% 11,870 16% 124%
Music Videos 2,700 1% 133% 697 1% 123%
Others 3 0% – 2 0% –
Total 61,015 17% 123% 12,569 17% 124%
Mobile
Mastertones 87,268 24% 66% 8,708 12% 65%
Ringback Tunes 99,490 27% 88% 8,754 12% 87%
Single Track 108,849 30% 79% 37,378 52% 79%
Music Videos 6,150 2% 83% 2,423 3% 85%
Others 2,007 1% 100% 1,074 1% 115%
Total 303,763 83% 78% 58,337 81% 78%
Others
Subscriptions(Internet) 359 0% 95%
Subscriptions(Mobile) 259 0% 73%
Other Digital Music Contents 2,506 1% 1572% 438 1% 113%
Total 2,506 1% 1572% 1,056 1% 94%
Grand Total 367,285 100% 83% 71,961 100% 84%
N.B. PleaserefertonotesforSalesFiguresofDigitalMusicin2011onpage3.

TheRecordingIndustryinJapan
9RIAJ Yearbook 2012
● Internet Downloads — Value Basis
● Mobile — Unit Basis
● Mobile — Value Basis
N.B.FiguresformusicvideosareincludedinOthersuntilOctober-December2006andaccountedforasanindividualitemfromJanuary-March2007.
Music Videos
Others
Single Track
Album
2005 20112008 2009 20102006 2007
1,851
Millions of yen
Music Videos
Others
Ringback Tunes
Thousands of units
4541,383
14 3,524
5,027
1,3871,757
3,959
5,923207
116
5,872
2,682
4619,015
3,126
6,540
54310,209
567
6,295
3,261
10,123
697
8,112
3,758
12,569
7,1713,166
20,769
32,340
1,23424,609
48,240
17,952
2,688
2,992 34,376
6,143
24,857
68,016601
2,039
600 683931
8,509
20,249
47,629
79,854
49,447
9,801
16,426
79,250
10,082
13,299
47,590
74,745
196,244
23,41822,65016,064
258,376
3,2549,097
1,8199,669 1,376
7,976 2,0087,414
226,753
344,140
45,602
15,96155,824
86,638
223,922
111,085
433,996
101,030
182,498
142,269
437,285
157,081
112,021
142,896
421,349
137,836
131,247
113,302
391,807
2,0076,150
108,849
87,268
99,490
303,763
Single Track
Mastertones
Music Videos
Others
Ringback Tunes
Single Track
Mastertones
0
100,000
200,000
300,000
400,000
2005 20112008 2009 20102006 2007
2005 20112008 2009 20102006 2007
Millions of yen
0
20,000
40,000
60,000
80,000
2,867 2,8922,843
1,074
8,754
8,708
37,378
58,337
2,423
0
3,000
6,000
9,000
12,000 2

The
Rec
ordi
ngIn
dust
ryin
Jap
an
10 RIAJ Yearbook 2012
15.RecordedMusic—ProductiononUnitBasis
Thousandsofunits
DiscsSPs SPs SPs SPs SPs SPs
1929 10,483 1933 24,675 1937 26,409 1941 19,714 1947 8,847 1951 14,904
1930 14,400 1934 25,731 1938 19,634 1942 17,085 1948 11,962
1931 16,895 1935 28,927 1939 24,385 '43-'45 unknown 1949 16,860
1932 17,016 1936 29,638 1940 20,928 1946 6,420 1950 11,828
Thousandsofunits
Discs TapesOthers Total
SPs7" 10"/12" CDs
Cartridges Cassettes Open Reels33rpm 45rpm 33rpm 45rpm 3" 5"
1952 17,806 17,806
1953 19,357 52 19,409
1954 15,896 455 209 16,560
1955 12,781 1,172 547 14,500
1956 11,540 2,379 1,019 14,938
1957 9,877 3,889 1,821 15,587
1958 8,520 5,417 3,264 17,201
1959 5,536 8,726 5,127 19,389
1960 3,078 73 13,530 7,323 24,004
1961 1,976 765 19,428 10,653 32,822
1962 584 2,765 26,927 13,462 43,738
1963 25 6,606 39,234 13,730 59,595
1964 9,012 50,954 13,847 73,813
1965 14,693 61,887 14,354 90,934
1966 15,285 63,063 16,142 94,490
1967 15,686 65,338 18,863 213 100,100
1968 16,968 75,489 27,757 217 5,529 631 171 126,762
1969 16,712 78,473 38,332 55 12,394 1,250 206 147,422
1970 11,749 71,704 50,095 7 18,338 3,790 192 155,875
1971 10,453 81,414 58,443 1 14,844 5,837 279 171,271
1972 8,004 82,909 61,137 0 13,535 6,770 239 172,594
1973 6,997 86,744 78,520 0 15,606 10,591 242 198,700
1974 6,735 91,166 83,758 0 12,790 11,154 111 205,714
1975 6,307 86,399 84,665 0 12,160 14,090 44 203,665
1976 5,548 99,543 94,599 62 11,388 20,187 14 231,341
1977 5,896 85,759 92,189 219 9,055 25,612 15 218,745
1978 4,801 98,283 93,012 132 11,699 34,855 6 242,788
1979 4,036 106,302 88,346 120 15,087 46,220 2 260,113
1980 5,188 99,172 90,504 79 22,858 57,107 0 274,908
1981 2,756 84,929 80,383 466 26,152 60,627 255,313
1982 2,451 76,285 73,022 158 36,489 61,115 249,520
1983 2,569 76,649 69,049 469 33,113 64,618 246,467
1984 1,149 69,979 66,708 1,503 6,365 21,973 60,917 228,595
1985 1,180 60,959 58,057 4,320 20,638 13,826 60,694 219,673
1986 1,415 59,152 42,751 2,732 45,120 8,355 62,517 222,041
1987 818 45,432 25,996 1,749 64,992 5,893 68,925 213,804
1988 564 26,855 10,935 1,109 25,557 89,980 3,415 76,074 234,490
1989 910 6,770 2,182 194 47,094 143,424 1,666 72,301 274,542
1990 224 1,382 703 23 61,820 169,129 672 56,541 290,494
1991 9 87 885 1 88,776 210,497 254 44,579 345,087
1992 14 17 982 1 110,559 222,671 47 38,853 373,142
1993 0 76 766 0 153,795 227,756 4 35,333 417,730
1994 620 138,271 241,699 0 29,860 410,450
1995 534 164,581 275,369 25,031 465,515
1996 944 166,294 282,556 22,512 472,305
1997 1,034 167,827 289,313 22,534 480,706
1998 1,186 154,260 302,913 21,818 480,177
Singles Albums1999 2,985 86,333 61,145 276,279 17,608 444,351
2000 1,914 33,124 104,601 276,327 17,174 433,140
2001 1,297 9,788 99,605 259,233 15,160 Music Videos 385,083
2002 697 7,967 74,793 245,919 12,972 14,909 968 358,224
2003 580 20,815 67,323 227,129 11,733 32,183 807 360,570
2004 894 15,363 66,473 220,420 8,999 34,772 531 347,451
2005 306 1,943 62,745 237,116 7,425 43,267 418 353,219
2006 248 1,693 65,861 222,698 6,665 49,137 476 346,778
2007 324 371 61,324 198,646 5,557 51,846 594 318,662
2008 212 239 53,488 188,724 4,586 55,742 498 303,490
2009 102 155 44,742 165,162 3,777 59,164 391 273,492
2010 105 107 50,503 155,929 2,866 46,475 369 256,354
2011 210 3,152 59,247 134,164 2,104 60,174 635 259,685
N.B.1.Figuresarerounded,hencethepossibledifferencebetweenbreakdownandtotal. 2.7"and10"/12"analogrecordingswereconsolidatedin1994. 3.Others:TotalnumberofSACDs,DVDs-Audio,DVDs-MusicandMDs
StatisticsbyFormat(UnitBasis—ValueBasis)

TheRecordingIndustryinJapan
11RIAJ Yearbook 2012
Millionsofyen
Discs TapesOthers Total
SPs7" 10"/12" CDs
Cartridges Cassettes Open Reels33rpm 45rpm 33rpm 45rpm 3" 5"
1952 2,269
1953 3,016
1954 3,186
1955 3,018
1956 2,084 792 1,181 4,058
1957 1,774 1,191 2,007 4,972
1958 1,496 1,365 2,859 5,719
1959 962 1,870 4,089 6,921
1960 516 21 2,749 5,685 8,971
1961 334 206 3,789 8,233 12,562
1962 104 699 5,275 11,180 17,259
1963 4 1,760 7,722 11,433 20,919
1964 2,369 9,855 12,966 25,190
1965 4,140 12,557 12,696 29,393
1966 4,381 13,306 14,278 31,965
1967 3,983 14,009 16,413 242 34,646
1968 4,988 19,155 24,821 281 49,245
1969 5,114 20,830 34,352 73 60,369
1970 3,765 19,578 42,368 9 65,720
1971 3,249 22,498 50,829 1 30,434 4,879 352 112,242
1972 2,757 25,050 55,474 0 26,662 5,628 303 115,876
1973 2,535 29,706 75,310 0 33,475 10,007 280 151,314
1974 2,649 31,771 98,005 0 28,816 14,542 177 175,960
1975 2,533 30,159 104,442 0 26,674 20,997 78 184,883
1976 2,295 37,604 123,627 36 21,383 33,402 35 218,381
1977 2,495 34,745 126,030 269 14,334 44,723 42 222,638
1978 1,908 40,172 129,980 148 12,107 61,371 18 245,704
1979 1,659 43,753 125,884 103 14,191 76,993 6 262,589
1980 2,300 42,673 136,187 78 21,265 90,341 292,844
1981 1,191 39,766 130,652 798 24,529 91,718 288,654
1982 1,053 35,920 118,148 171 35,152 90,594 281,037
1983 1,366 36,724 114,092 500 32,290 96,691 281,663
1984 533 33,720 110,948 1,369 14,439 21,696 91,406 274,111
1985 1,150 29,425 95,910 3,761 47,931 13,708 89,453 281,337
1986 733 28,323 71,624 2,625 97,912 8,482 89,220 298,920
1987 448 21,956 45,967 1,562 139,016 6,340 96,295 311,584
1988 328 12,925 18,842 1,111 18,825 186,423 3,680 100,812 342,947
1989 400 3,107 3,349 286 29,756 257,005 1,678 87,752 383,332
1990 140 640 1,034 41 37,556 285,793 693 61,872 387,770
1991 5 38 1,441 0 53,967 345,829 259 47,714 449,252
1992 10 8 1,834 1 69,064 369,467 45 37,819 478,247
1993 0 43 1,479 0 97,710 382,754 4 31,689 513,679
1994 1,081 88,371 403,870 25,924 519,246
1995 881 100,565 450,604 21,982 574,031
1996 1,312 104,418 458,164 19,969 583,862
1997 1,369 103,891 463,187 19,573 588,019
1998 1,484 95,478 492,400 18,132 607,494
Singles Albums1999 3,575 54,077 46,850 450,369 14,680 569,551
2000 2,069 15,046 82,393 426,440 13,868 539,816
2001 1,351 3,885 76,432 409,261 12,132 Music Videos 503,061
2002 782 3,861 56,677 371,268 10,542 37,683 642 481,454
2003 676 3,128 51,310 333,550 9,867 56,489 1,159 456,179
2004 520 1,393 50,591 316,627 7,437 53,900 802 431,269
2005 406 424 48,431 310,945 6,322 54,973 710 422,210
2006 337 383 50,464 293,671 5,613 56,844 1,096 408,408
2007 563 156 46,788 280,230 4,506 57,823 1,046 391,113
2008 352 107 39,837 251,321 3,740 65,626 791 361,775
2009 190 58 33,999 211,914 2,943 66,883 527 316,515
2010 170 40 37,239 184,755 2,300 58,614 495 283,612
2011 336 225 43,015 165,260 1,727 70,197 1,090 281,850
N.B.1.Figuresarerounded,hencethepossibledifferencebetweenbreakdownandtotal. 2.7"and10"/12"analogrecordingswereconsolidatedin1994. 3.Others:TotalnumberofSACDs,DVDs-Audio,DVDs-MusicandMDs
16.RecordedMusic—ProductiononValueBasis
The
Rec
ordi
ngIn
dust
ryin
Jap
an
12 RIAJ Yearbook 2012
Titles
20112010 20112010 20112010 20112010 20112010 20112010
0
1,000
2,000
3,000
8,000
10,000
Domestic
International
3" CDs 5" CD Singles 5" CD Albums Vinyl Discs Cassette Singles Cassette Albums
0 0
3543
11,305
10,382
42 41
419 406
2,7182,945
2,6832,902
6,5135,877
419 406 99 8999 8928
13
4,792
4,505
00 0
0 366
StatisticsbyFormat(UnitBasis—ValueBasis)
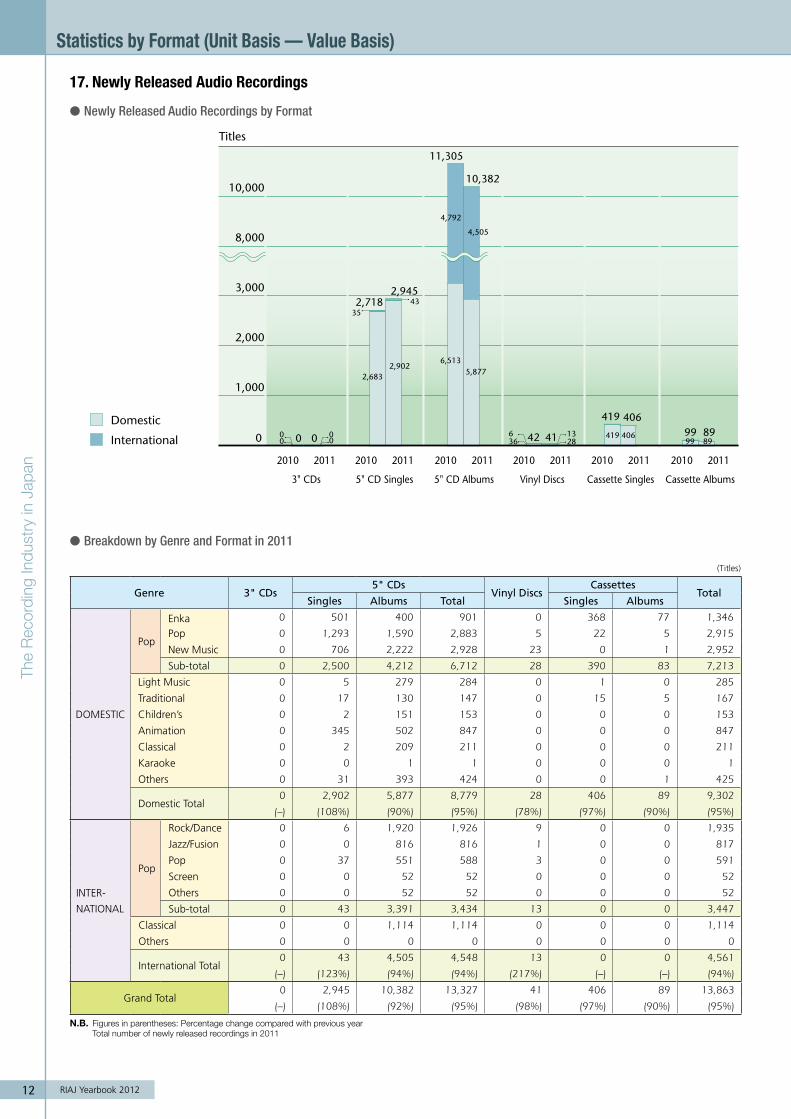
17.NewlyReleasedAudioRecordings
● Newly Released Audio Recordings by Format
● Breakdown by Genre and Format in 2011
(Titles)
Genre 3" CDs5" CDs
Vinyl DiscsCassettes
TotalSingles Albums Total Singles Albums
DOMESTIC
Pop
Enka 0 501 400 901 0 368 77 1,346
Pop 0 1,293 1,590 2,883 5 22 5 2,915
New Music 0 706 2,222 2,928 23 0 1 2,952
Sub-total 0 2,500 4,212 6,712 28 390 83 7,213
Light Music 0 5 279 284 0 1 0 285
Traditional 0 17 130 147 0 15 5 167
Children’s 0 2 151 153 0 0 0 153
Animation 0 345 502 847 0 0 0 847
Classical 0 2 209 211 0 0 0 211
Karaoke 0 0 1 1 0 0 0 1
Others 0 31 393 424 0 0 1 425
Domestic Total0 2,902 5,877 8,779 28 406 89 9,302
(–) (108%) (90%) (95%) (78%) (97%) (90%) (95%)
INTER-
NATIONAL
Pop
Rock/Dance 0 6 1,920 1,926 9 0 0 1,935
Jazz/Fusion 0 0 816 816 1 0 0 817
Pop 0 37 551 588 3 0 0 591
Screen 0 0 52 52 0 0 0 52
Others 0 0 52 52 0 0 0 52
Sub-total 0 43 3,391 3,434 13 0 0 3,447
Classical 0 0 1,114 1,114 0 0 0 1,114
Others 0 0 0 0 0 0 0 0
International Total0 43 4,505 4,548 13 0 0 4,561
(–) (123%) (94%) (94%) (217%) (–) (–) (94%)
Grand Total0 2,945 10,382 13,327 41 406 89 13,863
(–) (108%) (92%) (95%) (98%) (97%) (90%) (95%)
N.B. Figuresinparentheses:PercentagechangecomparedwithpreviousyearTotalnumberofnewlyreleasedrecordingsin2011

TheRecordingIndustryinJapan
13RIAJ Yearbook 2012
0
5,000
10,000
15,000
20,000
100,000
Titles
20112010 20112010 20112010 20112010 20112010 20112010
Domestic
International
3" CDs 5" CD Singles 5" CD Albums Vinyl Discs Cassette Singles Cassette Others
20
370
408
443
44
8 154,199
2,780
4,158 2,760
114,266118,937
19,121 23,401
64,938 71,671
49,328 47,266
5,332 5,886
5,328 5,882
19,491
23,809
6491,780
2066831,097
3,764 3,872
3,756 3,857
41
18.AudioRecordingCatalogueListings
● Audio Recording Catalogue Listings by Format
● Breakdown by Genre and Format in 2011
(Titles)
Genre 3" CDs5" CDs
MDs Vinyl DiscsCassettes
TotalSingles Albums Total Singles Others
DOMESTIC
Pop
Enka 560 3,735 4,127 7,862 0 7 4,631 1,835 14,895
Pop 727 11,057 17,794 28,851 5 712 274 175 30,744
New Music 1,097 6,017 23,663 29,680 1 360 61 55 31,254
Sub-total 2,384 20,809 45,584 66,393 6 1,079 4,966 2,065 76,893
Light Music 9 55 3,910 3,965 0 3 21 115 4,113
Traditional 33 141 2,167 2,308 0 0 776 956 4,073
Children’s 11 67 2,870 2,937 0 0 29 223 3,200
Animation 160 1,754 6,237 7,991 0 0 11 280 8,442
Classical 2 12 4,523 4,535 0 3 1 2 4,543
Karaoke 0 0 135 135 0 0 0 0 135
Others 161 563 6,245 6,808 0 12 78 216 7,275
Domestic Total2,760 23,401 71,671 95,072 6 1,097 5,882 3,857 108,674
(66%) (122%) (110%) (113%) (–) (248%) (110%) (103%) (111%)
INTER-
NATIONAL
Pop
Rock/Dance 13 261 19,392 19,653 0 583 0 2 20,251
Jazz/Fusion 0 13 5,817 5,830 0 48 1 0 5,879
Pop 6 117 3,917 4,034 0 3 0 7 4,050
Screen 1 2 746 748 0 0 0 1 750
Others 0 9 800 809 0 3 3 5 820
Sub-total 20 402 30,672 31,074 0 637 4 15 31,750
Classical 0 4 16,462 16,466 0 46 0 0 16,512
Others 0 2 132 134 0 0 0 0 134
International Total20 408 47,266 47,674 0 683 4 15 48,396
(49%) (110%) (96%) (96%) (–) (332%) (100%) (188%) (97%)
Grand Total2,780 23,809 118,937 142,746 6 1,780 5,886 3,872 157,070
(66%) (122%) (104%) (107%) (–) (274%) (110%) (103%) (106%)
N.B. Figuresinparentheses:PercentagechangecomparedwithpreviousyearNumberofcataloguesasof2011year-end

The
Rec
ordi
ngIn
dust
ryin
Jap
an
14 RIAJ Yearbook 2012
StatisticsbyFormat(UnitBasis—ValueBasis)
19.NewlyReleasedAudioRecordings(1957-2011)
*Tapes:Cassettes+Cartridges+OpenReels
(Titles)
Discs TapesTotal
SPs 7" 10"/12" 3" CDs 5" CDs Cassettes Cartridges Open Reels1957 1,673 1,651 1,070 4,3941958 1,451 1,789 1,493 4,7331959 964 2,074 2,202 5,2401960 414 2,433 2,769 5,6161961 139 2,475 3,483 6,0971962 15 3,425 5,187 8,6271963 4,231 5,281 9,5121964 5,053 4,379 9,4321965 4,954 4,111 9,0651966 5,414 4,030 9,4441967 5,416 4,366 9,7821968 5,382 4,704 10,0861969 4,807 5,451 10,2581970 5,159 7,346 12,5051971 5,006 8,415 2,162 2,933 295 18,8111972 4,378 8,884 1,834 2,353 211 17,6601973 3,818 9,186 1,767 1,781 157 16,7091974 3,286 9,210 2,437 1,821 106 16,8601975 3,930 11,198 2,720 1,816 23 19,6871976 4,042 11,452 3,614 1,746 15 20,8691977 4,681 11,075 3,891 1,110 26 20,7831978 4,021 11,185 4,607 915 15 20,7431979 4,233 11,358 5,526 818 3 21,9381980 4,049 8,851 6,393 1,270 1 20,5641981 3,224 8,119 6,504 1,672 19,5191982 3,224 7,965 7,674 2,667 21,5301983 3,246 7,052 788 7,277 2,543 20,9061984 2,761 6,503 2,097 7,047 2,133 20,5411985 2,668 5,750 4,546 6,504 1,845 21,3131986 2,535 4,593 6,719 6,768 1,310 21,9251987 2,547 3,661 8,772 7,872 1,520 24,3721988 2,066 2,299 2,468 9,053 7,671 1,164 24,7211989 993 528 2,780 12,155 7,691 642 24,7891990 155 198 2,549 14,203 5,655 276 23,0361991 229 2,933 16,451 4,188 160 23,9611992 4 350 2,502 15,135 3,049 24 21,0641993 MDs 9 439 2,556 15,697 2,362 DCCs 21,0631994 177 258 2,761 15,527 2,142 65 20,9301995 159 245 2,592 15,722 2,015 64 20,797
Singles Albums1996 117 183 2,540 371 16,385 1,702 2 21,3001997 252 242 2,431 428 15,497 1,710 20,5601998 119 248 2,659 599 15,208 1,746 20,5791999 33 396 1,795 1,225 12,573 1,436 17,4582000 17 338 929 1,760 11,333 1,388 15,7652001 1 253 575 1,904 10,808 1,141 14,6822002 188 557 1,677 10,734 923 14,0792003 157 419 2,094 10,933 1,165 14,7682004 177 21 2,581 12,019 870 15,6682005 144 3 2,769 14,136 833 17,8852006 74 3 2,954 15,377 793 19,2012007 195 1 2,977 16,146 704 20,0232008 68 1 2,917 15,823 636 19,4452009 1 117 2,860 15,054 629 18,6612010 42 2,718 11,305 518 14,5832011 41 2,945 10,382 495 13,863
0
5,000
10,000
15,000
20,000
2011200019901980197019601957
Titles
Total
Tapes
CDs (5")
CDs (3")
7"+10"/12"
SPs

TheRecordingIndustryinJapan
15RIAJ Yearbook 2012
20.AudioRecordingCatalogueListings(1971-2011)
*Tapes:Cassettes+Cartridges+OpenReels
(Titles)
DiscsMDs
TapesTotal
7" 10"/12" 3" CDs 5" CDs Cassettes Cartridges Open Reels1971 20,593 26,939 4,962 7,557 1,305 61,3561972 19,244 32,725 5,499 6,993 1,410 65,8711973 18,006 35,605 6,000 6,134 1,398 67,1431974 15,596 34,502 6,064 5,158 1,048 62,3681975 15,925 40,470 6,748 5,159 636 68,9381976 14,627 41,087 8,206 4,205 517 68,6421977 16,558 42,955 9,707 4,001 239 73,4601978 17,747 49,140 12,790 3,514 255 83,4461979 15,253 40,903 13,965 2,946 111 73,1781980 15,052 37,960 18,771 3,176 81 75,0401981 15,991 40,126 20,779 4,815 81,7111982 15,915 39,478 24,014 6,292 85,6991983 17,280 43,275 28,365 8,284 97,2041984 15,937 41,388 3,572 28,596 9,648 99,1411985 17,692 43,672 8,112 35,171 11,573 116,2201986 14,813 31,414 13,360 34,223 10,893 104,7031987 13,235 26,919 21,079 33,252 9,030 103,5151988 11,181 16,231 2,387 25,105 35,470 6,622 96,9961989 7,918 9,725 4,856 32,843 33,736 7,673 96,7511990 2,524 2,961 6,494 35,185 30,504 6,510 84,1781991 595 552 8,020 43,659 26,208 2,545 81,5791992 182 442 8,488 47,525 18,273 713 75,6231993 93 435 8,642 50,799 14,687 6 DCCs 74,6621994 24 548 10,353 62,108 635 14,979 6 550 89,2031995 11 613 10,417 62,970 801 12,481 562 87,8551996 576 11,277 79,009 917 13,438 192 105,4091997 741 11,866 90,066 1,038 10,874 82 114,6671998 1,214 12,276 92,313 773 10,932 11 117,519
Singles Albums1999 1,596 13,123 2,680 99,090 488 12,778 4 129,7592000 1,134 10,929 3,517 88,206 297 10,751 114,8342001 1,152 10,138 4,982 94,173 89 11,436 121,9702002 945 9,272 6,526 80,364 34 10,196 107,3372003 857 8,816 8,001 87,384 26 10,582 115,6662004 1,165 7,724 9,757 86,378 2 9,956 114,9822005 1,366 7,153 12,384 109,474 2 9,843 140,2222006 1,021 6,009 14,009 104,467 2 10,002 135,5102007 1,521 5,749 16,751 106,884 2 9,887 140,7942008 980 5,215 18,027 120,795 9,565 154,5822009 1,103 4,770 18,669 114,561 3 10,127 149,2332010 649 4,199 19,491 114,266 2 9,096 147,7032011 1,780 2,780 23,809 118,937 6 9,758 157,070
Total
Tapes
MDs
CDs (5")
CDs (3")
0
40,000
80,000
120,000
20112000199019801971
7"+10"/12"
Titles

The
Rec
ordi
ngIn
dust
ryin
Jap
an
16 RIAJ Yearbook 2012
StatisticsbyFormat(UnitBasis—ValueBasis)
21.NewlyReleasedMusicVideos
22.MusicVideoCatalogueListings
● Breakdown by Genre and Format in 2011● Newly Released Music Videos by Format
● Music Video Catalogue Listings by Format
*Totalnumberofnewlyreleasedmusicvideosin2011
*Numberofmusicvideocataloguesasof2011year-end
● Breakdown by Genre and Format in 2011
20112010 2010 2011 2010 2011 20112010 2010 2011 2010 2011
0 0
2,000
4,000
6,000
10,000
8,000
0
300
600
900
1,200
Titles Titles
DVDs Blu-ray Discsand Others
Tapes DVDs Blu-ray Discsand Others
Tapes
Domestic International Karaoke Domestic International Karaoke
453
155
646
1,254
378
158
684
1,220
91
74
177 0
0
7
0
200
2
180
149
310
9,516
5,601
3,530
385
1,593
1,261
331 1
183212
1,251
856
1,513
1,164
342 7
2867
569474
11,126
7,052
3,694
380
(Titles)
GenreDiscs
Tapes TotalDVDs
Blu-ray Discs
LDs
MUSIC
Domestic 684 149 0 2 835
International 378 31 0 0 409
Karaoke 158 0 0 0 158
Total1,220 180 0 2 1,402
(97%) (198%) (–) (29%) (104%)
N.B.Figuresinparentheses:Percentagechangecomparedwithpreviousyear
(Titles)
GenreDiscs
Tapes TotalDVDs
Blu-ray Discs and Others
MUSIC
Domestic 7,052 474 1,164 8,690
International 3,694 67 342 4,103
Karaoke 380 28 7 415
Total11,126 569 1,513 13,208
(117%) (45%) (95%) (107%)
N.B.Figuresinparentheses:Percentagechangecomparedwithpreviousyear

TheRecordingIndustryinJapan
17RIAJ Yearbook 2012
24.NumberofRecordRentalShops
23.NumberofDomesticDebutArtists
N.B.Groupiscountedasoneartist.ArtistsbelongtoRIAJmembercompanies.
0
200
400
20102007 2008 2009200620052004200320022001 2011
Debuts
Second Debuts
再デビュー数デビュー数
211263
171123
70
77
28
9
281
340
252
55
307
199
132 268
56
309
69
392
120
324
378
512
426
79
505
320
43363
305
56361
0
1,000
2,000
3,000
4,000
5,000
7,000
6,000
2011200520001995199019851980
3,422
3,305
3,1162,803
2,790
2,9693,179
3,225
3,572
3,661
3,864
4,116
4,3314,468
4,460
4,509
4,655
4,804
4,8895,491
5,9886,213
5,097
3,800
2,9212,393
1,910
1,8441,682
1,049
34
2,860
Rental record case appealed(Oct. ’81)
Out-of-court settlement (May ’84)
Temporary lawenforced
(Jun. ’84)
Revised copyright law enforced(Jan. ’85)Agreement enacted between concerned parties (Jun. ’85)
Basic agreement on new holdout period reached(Nov. ’90)
Since April 2009, RIAJ has been publishing weekly charts on digital single tracks for mobile phones based on the number of downloads with the aim of stimulating the digital music business.
25.AnnualChartofDigitalSingleTracksforMobilePhonesin2011
Title Artist
1 MARU MARU MORI MORI! KAORU TO TOMOKI、 TAMANI MUKKU。2 Sukidayo ~Hyakkai no koukai~ Sonar Pocket
3 flying get AKB48
4 Everyday, katyusha AKB48
5 100mankai No I love you Rake
Title Artist
6 MISTER KARA
7 Gee GIRLS’ GENERATION
8 Mata Ashita JUJU
9 HEAVY ROTATION AKB48
10 MR. TAXI GIRLS’ GENERATION
N.B.Theabovedataisforthenumberofdownloadsduringthe52-weekperiodfromDecember15,2010toDecember13,2011.
N.B.Numberofshopsisbasedonfiguresateachyear-end.

The
Rec
ordi
ngIn
dust
ryin
Jap
an
18 RIAJ Yearbook 2012
26.26thJapanGoldDiscAward2012(January2012)
RelatedData
Artist of the Year� Artists generating the highest net sales for works or songs released in 2011
Domestic AKB48 KING RECORD CO., LTD./Defstar Records Inc./AKS Co., Ltd.
International LADY GAGA UNIVERSAL MUSIC LLC
Best Asian Artist Among artists of the same category, the artists generating the highest net sales for works or songs released in 2011
Asia KARA UNIVERSAL MUSIC LLC
Best Enka/Kayokyoku Artist� Among artists of the same genre, the artist generating the highest net sales for works or songs released in 2011
HIKAWA KIYOSHI NIPPON COLUMBIA CO., LTD.
New Artist of the Year� Artists among New Artist award winners generating the highest net sales for works or songs
Domestic Kis-My-Ft2 avex marketing Inc.
International LMFAO UNIVERSAL MUSIC LLC
Asia 2PM Ariola Japan Inc.
Best 5 New Artists� Top five domestic debut artists with the largest net sales for works or songs
Domestic AYAMANJAPAN YOSHIMOTO R and C CO., LTD.
back number UNIVERSAL MUSIC LLC
KAORU TO TOMOKI、 TAMANI MUKKU。 UNIVERSAL MUSIC LLC
Kis-My-Ft2 avex marketing Inc.
NMB48 laugh out loud! records
Best 3 New Artists� Top three international debut artists with the highest net sales for works or songs
International Bruno Mars Warner Music Japan Inc.
LMFAO UNIVERSAL MUSIC LLC
Nicki Minaj UNIVERSAL MUSIC LLC
Best 3 New Artists� Top three debut artists from respective Asian countries with the largest net sales for works or songs
Asia BEAST UNIVERSAL MUSIC LLC
Jang Keun-Suk PONY CANYON INC.
2PM Ariola Japan Inc.
Best Enka/Kayokyoku New Artist� Among debut artists of the same genre, the artists generating the highest net sales for works or songs released in 2011
Park Hyun Bin Sony Music Direct (Japan) Inc.
Album of the Year� Albums released in 2011 with the most unit sales (set)
Domestic Ikimonobakari Members’ Best Selection Ikimono-gakari EPIC Records Japan Inc.
International BORN THIS WAY LADY GAGA UNIVERSAL MUSIC LLC
Asia GIRLS’ GENERATION GIRLS’ GENERATION UNIVERSAL MUSIC LLC
Best 5 Albums� Top five albums released in 2011 with the most unit sales (set)
Domestic KOKONIITAKOTO AKB48 KING RECORD CO., LTD.
Beautiful World ARASHI J Storm Inc.
NEGAINOTOU EXILE avex marketing Inc.
Ikimonobakari Members’ Best Selection Ikimono-gakari EPIC Records Japan Inc.
SENSE Mr.Children TOY’S FACTORY
Best 3 Albums� Top three albums released in 2011 with the most unit sales (set)
International Goodbye Lullaby Avril Lavigne Sony Music Japan International Inc.
GREATEST HITS BON JOVI UNIVERSAL MUSIC LLC
BORN THIS WAY LADY GAGA UNIVERSAL MUSIC LLC
Best 3 Albums� Top three albums released in 2011 with the most unit sales (set)
Asia GIRLS’ GENERATION GIRLS’ GENERATION UNIVERSAL MUSIC LLC
Girl’s Talk KARA UNIVERSAL MUSIC LLC
TONE TOHOSHINKI avex marketing Inc.
*Artistnameswithinthesameawardandworksofthesameartistarealllistedinalphabeticalorder.

TheRecordingIndustryinJapan
19RIAJ Yearbook 2012
Classic Album of the Year� Album released in 2011 with the most unit sales (set)
KAMISAMANO KARTE Tsujii Nobuyuki JISAKUSYU Tsujii Nobuyuki avex marketing Inc.
Jazz Album of the Year� Album released in 2011 with the most unit sales (set)
...Featuring Norah Jones Norah Jones EMI Music Japan Inc.
Instrumental Album of the Year� Album released in 2011 with the most unit sales (set)
THE BEST OF TARO HAKASE TARO HAKASE HATS UNLIMITED CO., LTD.
Soundtrack Album of the Year� Album released in 2011 with the most unit sales (set)
Burlesque Original Soundtrack Sony Music Japan International Inc.
Animation Album of the Year� Album released in 2011 with the most unit sales (set)
GINTAMA BEST II GINTAMA Aniplex Inc.
Traditional Japanese Music Album of the Year� Album released in 2011 with the most unit sales (set)
The 47th Columbia Ginei Contest Pieces “Odamaki” Columbia Ginei Ongakukai NIPPON COLUMBIA CO., LTD.
Concept Album of the Year� Album released in 2011 with the most unit sales (set)
Luv Songs Che’Nelle EMI Music Japan Inc.
Single of the Year� Singles released in 2011 with the most unit sales
Everyday, katyusha AKB48 KING RECORD CO., LTD.
Best 5 Singles� Top five singles released in 2011 with the most unit sales
Chancenojyunban AKB48 KING RECORD CO., LTD.
Everyday, katyusha AKB48 KING RECORD CO., LTD.
flying get AKB48 KING RECORD CO., LTD.
Kazewafuiteiru AKB48 KING RECORD CO., LTD.
Sakuranokininarou AKB48 KING RECORD CO., LTD.
Song of the Year By Download� Songs available for download in 2011 with the largest combined digital downloads (single track)
Domestic RYUSEI Kobukuro Warner Music Japan Inc.
International BORN THIS WAY LADY GAGA UNIVERSAL MUSIC LLC
Asia Jumping KARA UNIVERSAL MUSIC LLC
Best 5 Songs By Download� Top five songs available for download in 2011 with the largest combined digital downloads (single track)
Everyday, katyusha AKB48 KING RECORD CO., LTD.
MARU MARU MORI MORI! KAORU TO TOMOKI、TAMANI MUKKU。 UNIVERSAL MUSIC LLC
Jumping KARA UNIVERSAL MUSIC LLC
RYUSEI Kobukuro Warner Music Japan Inc.
Kono Yoru Wo Tomete Yo JUJU Sony Music Associated Records Inc.
Best Music Videos Top three domestic music videos/international and Asian music videos released in 2011 with the most unit sales (set)
Domestic AKBGAIPPAI ~THE BEST MUSIC VIDEO~ AKB48 AKS Co., Ltd.
ARASHI 10-11 TOUR “Scene” ~Kimi to Boku no Miteiru Fukei ~DOME plus ARASHI J Storm Inc.
ARASHI 10-11 TOUR “Scene” ~Kimi to Boku no Miteiru Fukei ~STADIUM ARASHI J Storm Inc.
International Michael Jackson VISION Michael Jackson Sony Music Japan International Inc.
Asia BEST CLIPS KARA UNIVERSAL MUSIC LLC
Special AwardSongs For Japan VARIOUS Sony Music Japan International Inc.
N.B.TheabovedatacovertheperiodfromNovember1,2010toOctober31,2011.

The
Rec
ordi
ngIn
dust
ryin
Jap
an
20 RIAJ Yearbook 2012
RelatedData
27.CertifiedMillion-sellingTitles
2010 201120092008200720062005200420032002
0
10
20
30
40
Number of titles
Albums Mastertones Mobile Single TrackSingles M Million
451M=402M=44M=1
24
1M=192M=33M=2
21M=2
17
1M=152M=2
11M=1
10
1M=72M=3
1 0 0 0
1M=1
25
1M=182M=7
6
1M=42M=13M=1
11M=1
21M=2
21
1M=142M=33M=4
101M=10
10
1M=82M=2
101M=10
5
1M=42M=1
7
1M=62M=1 8
1M=72M=1
31M=3
21M=2
11M=1
16
1M=122M=23M=14M=1
3
1M=22M=1
13
1M=102M=23M=1
31M=3
12
1M=102M=13M=1
41M=4
31M=3
51M=5
N.B. 1.Numberoftitlescertifiedintheyearsindicatedabove(includingthosereleasedpriortotheseyears.) 2.Certificationofdigitalmusic(Mastertones,MobileSingleTrack)startedfrom2006. 3.Thenumberoftitlescertifiedmaydifferfromthenumberindicatedupuntilthepreviousyearduetoachangeinthecalculationmethodfrom2011.
1st 1987������������������������������������������������������������������������������������������������● D AKINA NAKAMORI Warner-Pioneer● I MADONNA Warner-Pioneer2nd 1988 ����������������������������������������������������������������������������������������������● D REBECCA CBS-Sony Group● I THE BEATLES TOSHIBA-EMI3rd 1989������������������������������������������������������������������������������������������������● D BOØWY TOSHIBA-EMI, Victor Musical Inds, Tokuma Japan● I BON JOVI Nippon Phonogram4th 1990������������������������������������������������������������������������������������������������● D Southern All Stars Victor Musical Inds● I MADONNA Warner-Pioneer5th 1991������������������������������������������������������������������������������������������������● D Yumi Matsutoya TOSHIBA-EMI● I MADONNA Warner-Pioneer6th 1992������������������������������������������������������������������������������������������������● D CHAGE and ASKA PONY CANYON● I GUNS N’ ROSES Victor Musical Inds (MCA Victor)7th 1993������������������������������������������������������������������������������������������������● D CHAGE and ASKA PONY CANYON● I MADONNA WARNER MUSIC JAPAN8th 1994������������������������������������������������������������������������������������������������● D WANDS POLYDOR, TOSHIBA-EMI● I THE BEATLES TOSHIBA-EMI9th 1995������������������������������������������������������������������������������������������������● D trf NIPPON CROWN (AVEX D.D.)● I MARIAH CAREY Sony Music Entertainment10th 1996����������������������������������������������������������������������������������������������● D trf AVEX D.D.● I MARIAH CAREY Sony Music Entertainment11th 1997����������������������������������������������������������������������������������������������● D Namie Amuro AVEX D.D., TOSHIBA-EMI● I ME & MY TOSHIBA-EMI12th 1998����������������������������������������������������������������������������������������������● D GLAY PLATINUM RECORDS, POLYDOR● I Celine Dion Sony Music Entertainment13th 1999����������������������������������������������������������������������������������������������● D B’z ROOMS RECORDS● I Celine Dion Sony Music Entertainment
14th 2000����������������������������������������������������������������������������������������������● D UTADA HIKARU TOSHIBA-EMI● I Celine Dion Sony Music Entertainment15th 2001����������������������������������������������������������������������������������������������● D ayumi hamasaki AVEX● I THE BEATLES TOSHIBA-EMI16th 2002����������������������������������������������������������������������������������������������● D ayumi hamasaki AVEX● I BACKSTREET BOYS Zomba Records Japan17th 2003����������������������������������������������������������������������������������������������● D UTADA HIKARU TOSHIBA-EMI● I AVRIL LAVIGNE BMG FUNHOUSE18th 2004����������������������������������������������������������������������������������������������● D ayumi hamasaki AVEX● I TWELVE GIRLS BAND PLATIA ENTERTAINMENT19th 2005����������������������������������������������������������������������������������������������● D ORANGE RANGE Sony Music Records● I QUEEN TOSHIBA-EMI20th 2006����������������������������������������������������������������������������������������������● D Koda Kumi avex entertainment● I O-zone avex entertainment21st 2007����������������������������������������������������������������������������������������������● D Koda Kumi AVEX MARKETING COMMUNICATIONS● I Daniel Powter Warner Music Japan22nd 2008����������������������������������������������������������������������������������������������● D EXILE AVEX MARKETING● I AVRIL LAVIGNE BMG JAPAN23rd 2009����������������������������������������������������������������������������������������������● D EXILE avex marketing Inc.● I MADONNA Warner Music Japan Inc.24th 2010����������������������������������������������������������������������������������������������● D ARASHI J Storm Inc.● I THE BEATLES EMI Music Japan Inc.25th 2011����������������������������������������������������������������������������������������������● D ARASHI J Storm Inc.● I LADY GAGA UNIVERSAL MUSIC LLC
●1st - 25th Artists of the Year

TheRecordingIndustryinJapan
21RIAJ Yearbook 2012
28.CertifiedMillion-SellingTitlesin2011
Album
Single
Mastertones MobileSingleTrack
Million
Million
3 Million 2 Million Million Million
THE FAME LADY GAGA2009.05.20UNIVERSAL MUSIC LLC
SakuranokininarouAKB482011.02.16KING RECORD CO., LTD.
KOKONIITAKOTOAKB482011.06.08KING RECORD CO., LTD.
flying getAKB482011.08.24 KING RECORD CO., LTD.
NEGAINOTOUEXILE2011.03.09avex marketing Inc.
Everyday, katyushaAKB482011.05.25KING RECORD CO., LTD.
Beautiful World ARASHI2011.07.06J Storm Inc.
KazewafuiteiruAKB482011.10.26 KING RECORD CO., LTD.
UEKARA MARIKOAKB482011.12.07 KING RECORD CO., LTD.
N.B.Thedatesindicatedateofrelease.CD
N.B.Thedatesindicatestartdatesofdigitalrelease.DigitalMusic
Story AI2005.04.18 UNIVERSAL MUSIC LLC
MICHIEXILE2007.02.07 avex marketing Inc.
GINGA TETSUDOU 999EXILE2008.02.27 avex marketing Inc.
Best FriendNishino Kana2010.02.03 SME Records Inc.
ANPANMAN’S MARCHDreaming2003.05.19 VAP Inc.
AinoutaKoda Kumi2007.09.06 avex marketing Inc.
SAKURAKobukuro2005.11.02 Warner Music Japan Inc.
PEACH ai otsuka2007.05.18 avex marketing Inc.
Ichibu to ZenbuB’z2009.07.14 VERMILLION RECORDS
KimitteNishino Kana2010.10.06 SME Records Inc.
CHU-LIP ai otsuka2007.01.18 avex marketing Inc.
AI WO KOMETE HANATABAWOSuperfly2008.01.11 Warner Music Japan Inc.
Story AI2006.02.01 UNIVERSAL MUSIC LLC
Lovers Again EXILE2007.01.17 avex marketing Inc.
HEAVY ROTATIONAKB482010.08.04 KING RECORD CO., LTD.

The
Rec
ordi
ngIn
dust
ryin
Jap
an
22 RIAJ Yearbook 2012
RelatedData
29.AmountCollectedforSoundRecordingsandOthers
● Secondary Use Fees of Commercial Sound Recordings
● Compensation for Private Recordings
● Record Rental Remuneration
0
2
4
0
1
2
3
4
0
400
200
600
800
1,000
2006 2007 20082004200320022001 2005
2006 2007 20082004200320022001 2005
2006 2007 20082004200320022001 2005
2009
2009
2009
2010
2010
2010
Billions of yen
Billions of yen
Millions of yen
Video Recordings
Audio Recordings
4.14.4
3.8 3.9 3.9 3.84.3 4.3
3.7 3.7 3.9 4.0
4.64.8 4.8
5.7
5.4
18.2
2.8
33.0
44.3
48.1
1,001.0
820.8
692.8575.4
482.3365.8
1,003.8
826.2
711.0
608.4526.6
413.9
38.3
285.7
324.0
43.1
203.2
246.3
4.24.0
5.6 5.7
43.7
129.1
172.8
58.3
88.6
147.0
N.B.Theyearsshowninthechartsabovearefiscalyears(ApriltoMarch).
N.B.Secondaryusefeesincluderoyaltiesoncopiesforbroadcastinguseandlicensingfeesformakingtransmittable.

TheRecordingIndustryinJapan
23RIAJ Yearbook 2012
U.S.A.5,977.4 (25.4%)
Total23,490.0
Japan5,171.1 (22.0%)
Others4,072.3 (17.3%)
Spain 374.3 (1.6%)
Russia 395.2 (1.7%)
Italy 427.0 (1.8%)
Canada 530.0 (2.3%)
Australia 555.3 (2.4%)
France 1,342.5 (5.7%)
U.K. 2,274.9 (9.7%)
Germany 2,370.0 (10.1%)
U.S.A.9,651.4 (34.3%)
Japan4,495.2 (16.0%)
Others4,554.4 (16.2%)U.S.A.
11,195.0 (35.4%)
Total31,595.2
Japan4,883.5 (15.5%)
Others5,143.6 (16.3%)
Netherlands 423.1 (1.3%)
Spain 547.1 (1.7%)
Australia 637.7 (2.0%)
Italy 639.8 (2.0%)
Canada 708.3 (2.2%)
France 1,940.3 (6.1%)
Germany 2,146.4 (6.8%)
U.K. 3,330.4 (10.5%)
Total28,100.0
Russia 405.0 (1.4%)
Spain 464.8 (1.7%)
Italy 556.9 (2.0%)
Australia 583.6 (2.1%)
Canada 667.8 (2.4%)
France 1,661.7 (5.9%)
Germany 2,029.1 (7.2%)
U.K. 3,051.1 (10.8%)
U.S.A.4,562.0(24.5%)
Total18,606.2
Japan4,244.5(22.8%)
Others3,205.9(17.2%)
Spain 266.8 (1.4%)
Italy 293.8 (1.6%)
Netherlands 340.6 (1.8%)
Canada 401.6 (2.2%)
Australia 456.2 (2.5%)
France 1,158.5 (6.2%)
U.K. 1,730.5 (9.3%)
Germany 1,945.8 (10.5%)
U.S.A.7,985.6 (31.6%)
Japan4,174.5 (16.5%)
Others4,365.0 (17.3%)
Total25,258.4
Netherlands 385.0 (1.5%)
Russia 418.8 (1.7%)
Italy 493.3 (2.0%)
Canada 561.8 (2.2%)
Australia 564.8 (2.2%)
France 1,471.0 (5.8%)
Germany 2,142.2 (8.5%)
U.K. 2,696.4 (10.7%)
Japan4,096.9(25.4%)
Total16,146.8
U.S.A.3,635.2 (22.5%)
Others2757.9(17.1%)
Brazil 258.7 (1.6%)
Netherlands 270.2 (1.7%)
Italy 275.4 (1.7%)
Canada 343.2 (2.1%)
Australia 408.0 (2.5%)
France 999.6 (6.2%)
U.K. 1,388.1 (8.6%)
Germany 1,713.6 (10.6%)
30.GlobalShareofSalesofRecordedMusic(Millions of U.S. dollars)
● 2005 ● 2006
● 2007 ● 2008
● 2009 ● 2010

The
Rec
ordi
ngIn
dust
ryin
Jap
an
24 RIAJ Yearbook 2012
RelatedData
31.GlobalSalesofRecordedMusicbyCountryin2010
Country Singles(millions)
CDs(millions)
Music Videos Retail Value Annual Growth Value of Purchase per Person (US$)
Population(millions)DVDs
(millions)VHS Cassettes
(millions)US$
(millions)Local Currency
(millions) Units LocalCurrency
Japan 44.5 114.5 17.5 – 4,096.9 359,831.9 -7.9% -9.4% 32.3 126.8
U.S.A. 1.5 225.8 8.7 0.4 3,635.2 3,635.2 -22.3% -20.2% 11.7 310.2
Germany 6.8 98.7 8.7 – 1,713.6 1,285.2 -4.9% -8.3% 20.8 82.3
U.K. 2.4 99.8 3.5 – 1,388.1 902.3 -17.1% -18.5% 22.3 62.3
France 1.6 48.4 3.3 – 999.6 749.7 -5.6% -10.1% 15.4 64.8
Australia 0.0 24.5 2.6 0.0 408.0 444.7 -19.0% -23.8% 19.0 21.5
Canada 0.2 25.9 2.7 – 343.2 353.5 -13.9% -22.8% 10.2 33.7
Italy 0.1 16.0 0.6 – 275.4 206.6 0.7% -2.3% 4.7 58.1
Netherlands 0.5 16.7 2.0 – 270.2 202.6 -9.1% -17.4% 16.1 16.8
Brazil 0.0 20.7 7.3 – 258.7 457.9 -2.8% -7.7% 1.3 201.1
Belgium 0.2 10.3 0.7 – 187.6 140.7 -3.7% -3.7% 17.4 10.8
Austria 0.1 7.5 0.7 – 184.1 138.1 -11.2% -15.0% 22.5 8.2
Spain 0.0 10.5 1.3 0.1 183.2 137.4 -38.1% -28.5% 3.9 46.8
South Africa 0.9 16.0 2.1 0.0 171.8 1,261.0 -5.9% -8.2% 3.5 49.1
Switzerland 0.3 8.4 0.2 – 166.1 172.8 -14.9% -17.6% 21.6 7.7
Mexico 0.0 19.8 1.2 – 157.9 1,997.3 -11.3% -7.8% 1.4 112.5
Sweden 0.1 13.7 0.4 – 136.8 986.5 -0.3% -20.5% 15.0 9.1
Norway 0.0 7.5 0.2 – 131.4 794.7 -10.0% -21.1% 28.0 4.7
Russia – – – – 126.2 3,841.1 – -35.0% 0.9 139.4
Poland 0.0 8.9 0.6 – 124.4 375.6 -17.0% -2.3% 3.2 38.5
South Korea 0.0 9.5 – – 116.9 135,539.0 6.4% 13.6% 2.4 48.6
Denmark 0.1 6.2 0.1 – 95.9 539.2 -7.9% -20.7% 17.4 5.5
India 3.9 35.5 0.3 – 91.0 4,179.3 -31.6% -4.6% 0.1 1,173.1
Argentina 0.0 10.3 1.0 – 82.7 324.1 -6.4% -2.8% 2.0 41.3
Finland 0.1 5.2 0.3 – 79.5 59.6 1.6% -15.8% 15.0 5.3
Ireland 0.2 4.9 0.2 – 77.9 58.4 -22.5% -7.5% 17.7 4.4
Greece 0.0 4.4 0.2 0.0 74.1 55.6 -28.5% -28.0% 6.9 10.7
Turkey 0.3 10.4 – – 73.0 110.2 -1.1% -12.4% 0.9 77.8
New Zealand 0.0 3.6 0.4 – 57.4 79.8 -23.4% -27.9% 13.3 4.3
Taiwan 0.2 4.0 0.5 0.1 56.3 1,775.4 1.2% -0.3% 2.4 23.0
Portugal 0.1 5.3 0.5 – 43.8 32.8 -21.1% -35.8% 4.1 10.8
Thailand – 3.6 4.9 – 39.2 1,254.0 -24.6% -27.1% 0.6 67.1
Hong Kong 0.0 2.3 0.4 – 37.8 293.7 -14.7% -11.2% 5.3 7.1
Czech Republic – 4.9 0.1 – 31.9 610.0 -44.6% -28.5% 3.1 10.2
Indonesia 2.0 6.3 3.1 – 29.2 266,582.8 -18.5% -18.3% 0.1 243.0
Hungary 0.0 3.6 0.1 0.0 24.9 5,194.8 -0.5% -17.7% 2.5 10.0
Malaysia 0.0 2.1 0.6 0.0 23.9 77.1 -15.8% -19.8% 0.8 28.3
China – 4.1 0.1 – 23.2 157.6 -15.7% -20.0% 0.0 1,336.7
Colombia – 1.9 0.2 – 22.7 43,539.4 -18.2% -33.7% 0.5 44.2
Singapore 0.0 1.3 0.1 – 18.0 24.5 -15.7% -15.7% 3.8 4.7
Philippines 0.0 2.1 0.3 – 15.6 706.2 -20.6% -18.3% 0.2 99.9
Chile – 2.3 0.1 – 13.8 7,190.3 144.4% -8.0% 0.8 16.7
Venezuela – 1.0 0.1 – 13.3 55.9 -30.7% -19.9% 0.5 27.2
Croatia 0.0 1.3 0.1 0.0 11.0 60.5 -43.8% -17.9% 2.4 4.5
Slovak Republic – 1.3 0.0 – 9.6 7.2 -7.3% 20.5% 1.7 5.5
Iceland – 0.4 – – 7.5 938.3 -14.1% -4.8% 0.8 9.1
Central America – 0.8 0.0 – 6.8 6.8 62.0% -15.1% 0.2 41.1
Uruguay 0.0 0.4 0.0 – 5.3 107.8 -18.7% -36.9% 1.5 3.5
Bulgaria 0.0 0.3 0.0 – 2.4 3.6 -46.9% -44.2% 0.3 7.1
Peru – 0.2 0.0 – 2.2 2.2 35.3% -3.3% 0.1 29.9
Ecuador – 0.1 0.0 0.0 1.5 1.5 -13.4% -23.4% 0.1 14.8
Total 66.4 933.2 78.1 0.5 16,146.8 –
N.B. 1.Source:IFPI(InternationalFederationofthePhonographicIndustry) 2.TheU.S.dollarexchangerateisbasedontheaverageratefor2010(US$1=¥87.83). 3.CassettesinglesandCDsinglesareincludedinSingles. 4.Populationestimatedfromstatisticsofeachcountry. 5.Therearecaseswherecalculationoftheannualgrowthrateisnotpossibleduetosuchfactorsasforeignexchangetranslationsandchangesincomputationunits.

RIAJMemberCompanies(inchronologicalorderasofthedateofjoiningRIAJorCompanyfoundation)
[Full Members]
NIPPON.COLUMBIA.CO.,.LTD.
Victor.Entertainment,.Inc.
KING.RECORD.CO.,.LTD.
TEICHIKU.ENTERTAINMENT,.INC.
UNIVERSAL.MUSIC.LLC
EMI.Music.Japan.Inc.
NIPPON.CROWN.Co.,.Ltd.
TOKUMA.JAPAN.COMMUNICATIONS.CO.,.LTD.
Sony.Music.Entertainment.(Japan),.Inc.
PONY.CANYON.INC.
Warner.Music.Japan.Inc.
VAP.Inc.
Geneon.Universal.Entertainment.Japan,.LLC.
BEING,.INC.
Avex.Marketing.Inc.
FORLIFE.MUSIC.ENTERTAINMENT,.INC.
YAMAHA.MUSIC.COMMUNICATIONS.CO.,.LTD.
DREAMUSIC.Inc.
YOSHIMOTO.R.and.C.CO.,.LTD.
[Associate.Members]
PRYAID.RECORDS.INC.
Johnny’s.Entertainment.Inc.
LD&K.Inc.
Konami.Digital.Entertainment.Co.,.Ltd.
J.Storm.Inc.
EXIT.TUNES.Inc.
VENUS.RECORDS,.INC.
HATS.UNLIMITED.CO.,.LTD.
Naxos.Japan,.INC.
AMUSE.SOFT.ENTERTAINMENT.INC.
Lantis.Co.,.Ltd.
Village.Again.Association.Co.,.Ltd.
SPIRITUAL.BEAST.CO.,.LTD.
BANDAI.VISUAL.CO.,.LTD.
SPACE.SHOWER.NETWORKS.INC.
WARNER.ENTERTAINMENT.JAPAN.INC.
[Supporting Members]
Aniplex.Inc.
T-TOC.RECORDS
WARD.RECORDS,.INC
JEI.ONE.INC.
FREE.BOARD.Co.,.Ltd.
HOLIDAY.JAPAN.Co.,.Ltd.
TV.Asahi.Music.Co.,.Ltd.
NPP.DEVELOP.Inc.
KING.INTERNATIONAL.INC.
Bellwood.Records.Co.,.Ltd.
SME.Records.Inc.
Epic.Records.Japan.Inc.
Ki/oon.Records.Inc.
Sony.Music.Japan.International.Inc.
Sony.Music.Records.Inc.
Sony.Music.Associated.Records.Inc.
Sony.Music.Direct.(Japan).Inc.
Sony.Music.Distribution.(Japan).Inc.
Defstar.Records.Inc.
Avex.Entertainment.Inc.
CROWN.TOKUMA.music.distribution.Co.,.Ltd.
FlyingDog,.Inc.
Ariola.Japan.Inc.
Sony.Music.Artists.Inc.
EdomizakaMoriBldg.,4-1-40Toranomon,Minato-ku,Tokyo105-8482 81-3-6895-9001
9F·10F,ShibuyaFirstTower,1-2-20Higashi,Shibuya-ku,Tokyo150-0011 81-3-5467-5401
1-2-3Otowa,Bunkyo-ku,Tokyo112-0013 81-3-3945-2131
6F,KyoceraHarajukuBldg.,6-27-8Jingumae,Shibuya-ku,Tokyo150-8516 81-3-5778-1721
8-5-30Akasaka,Minato-ku,Tokyo107-8583 81-3-6406-3001
27F,AkasakaBizTower,5-3-1Akasaka,Minato-ku,Tokyo107-6327 81-3-6830-8300
6F,Toh-KenInternationalBldg.,2-12-19Shibuya,Shibuya-ku,Tokyo150-0002 81-3-6381-7730
7F,Toh-KenInternationalBldg.,2-12-19Shibuya,Shibuya-ku,Tokyo150-0002 81-3-6381-7750
4-5Rokuban-cho,Chiyoda-ku,Tokyo102-8353 81-3-3515-5050
2-5-10Toranomon,Minato-ku,Tokyo105-8487 81-3-5521-8000
3F,AoyamaBldg.,1-2-3Kita-Aoyama,Minato-ku,Tokyo107-8639 81-3-6439-8600
NTVYonban-choBldg.,1Go-Kan,5-6Yonban-cho,Chiyoda-ku,Tokyo102-0081 81-3-3234-5711
AkasakaParkBldg.,5-2-20Akasaka,Minato-ku,Tokyo107-6110 81-3-5544-3400
5-2-2Roppongi,Minato-ku,Tokyo106-0032 81-3-5411-8411
3-1-30Minami-Aoyama,Minato-ku,Tokyo107-0062 81-3-5413-8630
6F,Toh-KenNagaiBldg.,2-12-24Shibuya,Shibuya-ku,Tokyo150-0002 81-3-5466-4116
SumitomoFudosanHarajyukuBldg.,2-34-17Jingumae,Shibuya-ku,Tokyo150-0001 81-3-6894-0195
Bâtiment-Ikeda‚4thFloor,3-35-19Jingumae,Shibuya-ku,Tokyo150-0001 81-3-5775-7480
5-18-21Shinjuku,Shinjuku-ku,Tokyo160-0022 81-3-3209-8640
2F,HikawabashiBldg.,2-23-1Higashi,Shibuya-ku,Tokyo150-0011 81-3-6418-6029
3F,PARKWAYSQ’2,1-19-11Jinnan,Shibuya-ku,Tokyo150-0041
3F,NishiaoyamaBldg.,1-11-1,Shibuya,Shibuya-ku,Tokyo150-0002 81-3-5464-7411
9-7-2Akasaka,Minato-ku,Tokyo107-8324 81-3-5771-0573
MiyamasuTower,1-10-10Shibuya,Shibuya-ku,Tokyo150-0002
2-14-1-1603Nishi-Shinbashi,Minato-ku,Tokyo105-0003 81-3-3502-9819
2-8-7Kudanminami,Chiyoda-ku,Tokyo102-0074 81-3-3262-1777
4F,walker21,7-21-21Roppongi,Minato-ku,Tokyo106-0032 81-3-3796-8282
4F,1-32-12Kamiuma,Setagaya-ku,Tokyo154-0011 81-3-5486-5101
13F,ShibuyaInfossTower,20-1Sakuragaoka-cho,Shibuya-ku,Tokyo150-0031 81-3-5457-3445
1F,ASAX-HirooBldg.,1-3-14Hiroo,Shibuya-ku,Tokyo150-0012 81-3-5475-8131
302ShibuyaAtoBldg.,2-18-7Higashi,Shibuya-ku,Tokyo150-0011 81-3-6276-8725
3F,WEDGEMITAKA,3-29-10Shimorenjaku,Mitaka-city,Tokyo181-0013 81-422-40-1718
ShinagawaSeasideParkTower,4-12-4,Higashi-Shinagawa,Shinagawa-ku,Tokyo140-0002 81-3-6720-1601
3-16-35Roppongi,Minato-ku,Tokyo106-8011 81-3-3585-3242
HibiyaCentralBldg.,1-2-9Nishi-Shinbashi,Minato-ku,Tokyo105-0003 81-3-5251-6333
4-5Rokuban-cho,Chiyoda-ku,Tokyo102-8353 81-3-5211-7555
18F,YebisuGardenPlaceTower,4-20-3Ebisu,Shibuya-ku,Tokyo150-6018 81-3-5825-4371
4F,LunarHousePart4Bldg.,3-35-16Jingumae,Shibuya-ku,Tokyo150-0001 81-3-5775-3257
9F,1-21-1HonmachiShibuya-ku,Tokyo151-0071 81-3-3377-8081
301CentralAoyama,4-1-3Minami-Aoyama,Minato-ku,Tokyo107-0062 81-3-3478-8611
6F,ShibaDaimonMatsumotoBldg.,1-5-12ShibaDaimon,Minato-ku,Tokyo105-0012 81-3-3433-3933
12F,RoppongiHillsNorthTower,6-2-31Roppongi,Minato-ku,Tokyo106-8552 81-3-3796-7100
3F,NakajimaBldg.,3-17-15Nishi-Azabu,Minato-ku,Tokyo106-0031 81-3-5775-0122
1-2-3Otowa,Bunkyo-ku,Tokyo112-0013 81-3-3945-2333
1-2-3Otowa,Bunkyo-ku,Tokyo112-0013 81-3-3945-2303
4-5Rokuban-cho,Chiyoda-ku,Tokyo102-8353 81-3-3515-5561
9-6-35Akasaka,Minato-ku,Tokyo107-8301 81-3-5786-8555
9-6-35Akasaka,Minato-ku,Tokyo107-8301 81-3-5786-8435
9-6-35Akasaka,Minato-ku,Tokyo107-8301 81-3-5786-8705
4-5Rokuban-cho,Chiyoda-ku,Tokyo102-8353 81-3-3515-5558
4-5Rokuban-cho,Chiyoda-ku,Tokyo102-8353 81-3-3515-5321
4-5Rokuban-cho,Chiyoda-ku,Tokyo102-8353 81-3-3515-5591
4-5Rokuban-cho,Chiyoda-ku,Tokyo102-8353 81-3-3515-5400
4-5Rokuban-cho,Chiyoda-ku,Tokyo102-8353 81-3-3515-5820
3-1-30Minami-Aoyama,Minato-ku,Tokyo107-0062 81-3-5413-8670
7F,Toh-KenInternationalBldg.,2-12-19Shibuya,Shibuya-ku,Tokyo150-0002 81-3-6381-7777
10F,ShibuyaFirstTower,1-2-20Higashi,Shibuya-ku,Tokyo150-0011 81-3-5467-9200
4-5Rokuban-cho,Chiyoda-ku,Tokyo102-8353 81-3-3515-5848
6F,3-1-30Jingumae,Shibuya-ku,Tokyo150-8518 81-3-5414-7311
■ Total Number of Member Companies: 59 as of March 2012
Recording Industry Association of Japan9F, Kyodo Tsushin Kaikan Bldg., 2-2-5 Toranomon, Minato-ku, Tokyo 105-0001Phone: +81-3-5575-1301 Fax: +81-3-5575-1313 URL: http://www.riaj.or.jp
©2012 Recording Industry Association of Japan

StatisticsTrends
The Recording Industry in Japan
2012
日本のレコード産業 2012
このエルマークは、レコード会社・映像製作会社が提供するコンテンツを示す一般社団法人 日本レコード協会の登録商標です
StatisticsTrends
The Recording Industry in Japan
2012
RIAJ YEARBOOK 2012