Embed Size (px)
Citation preview

1

2
Rhode Island Sees Increase in Number of Clean Energy Jobs, Evidence of Continued Growth The Executive Office of Commerce and the Rhode Island
Office of Energy Resources (OER) are pleased to present the
results of the 2015 Rhode Island Clean Energy Jobs Report. As
a leader in energy efficiency, Rhode Island has taken bold action to support and grow clean
energy jobs while reducing the state’s carbon footprint. Governor Raimondo and the General
Assembly have demonstrated visionary leadership by implementing local and regional policy
initiatives that enable Rhode Island to support local clean energy sector and job growth
opportunities; work with its neighbors in pursuit of longer-term energy infrastructure solutions;
place energy efficiency and least-cost procurement at the heart of our energy supply strategy;
create competitive processes that balance cost concerns with the expansion of clean energy
resources needed to diversify supply; and advance important environmental goals.
The report finds that Rhode Island’s clean energy economy currently supports 9,832 jobs, a
remarkable fact considering that 40 percent of firms began providing clean energy services in just
the last five years. This sector of the state’s economy added 613 jobs over the last 12 months and
should continue to grow -- with an additional 1,600 jobs new clean energy jobs projected in the
next 12 months.
Small business is a pillar of our economy, and the clean energy sector illustrates the vitality of the
small business sector within our borders: some 87 percent of clean energy firms in Rhode Island
employ fewer than 25 employees.
Moreover, employment in the clean energy space is representative of Rhode Island’s diverse
population, with higher than average employment of ethnic and racial minorities, veterans, and
older workers. Of clean energy hires in the past 12 months, 36.6 percent were ethnic or racial
minorities, 21.8 percent were over the age of 55 and 14.6 percent were veterans. These
impressive numbers reflect the diversity of our state and its workforce. However, as our state
looks to support continued growth in the clean energy sector, we are mindful that there is room
for improvement. Rhode Island is committed to gender equality and aims to attract more talented,
skilled women to this important segment of the workforce.
We are grateful to Governor Raimondo and the General Assembly for their commitment to
leading Rhode Island towards a secure, cost-effective, and sustainable energy future. Investments
in this growing part of our economy will create jobs, expand opportunities for small businesses,
and reduce our state’s carbon footprint. We must also continue to work closely with private and
public stakeholders to create clean energy jobs to spur economic growth, increase the reliability
and security of our energy supply, reduce energy costs, mitigate price volatility, and improve
environmental quality. Rhode Island is a leader in energy efficiency and renewable energy -- and
we aim to enhance that reputation in the years ahead.
Sincerely,
Marion Gold
Commissioner
Office of Energy Resources
Stefan Pryor
Rhode Island Secretary of Commerce

3
Acknowledgements
The 2015 Rhode Island Clean Energy Industry Report is the result of an extensive
research process that included a survey of more than 678 respondents (more than 4,400
potential respondents were contacted). The Rhode Island Office of Energy Resources
and the Executive Office of Commerce would like to thank all of the respondents’ for
engaging with us to gather this important data. Researchers could only gather this data
because of respondent’s willingness to generously share their time and insights.
OER and Commerce RI would like to thank The New England Clean Energy Council for
encouraging their members to participate in the research effort. We would also like to
acknowledge the Peregrine Energy Group for their efforts prior to the launch of this
study.
The publication of this report would not be possible without the hard work and dedication
of the following individuals:
BW Research Partnership
Phil Jordan, BW Partnership
Kevin Doyle, Green Economy
Josh Williams, BW Research
Ryan Young, BW Research
Veronica Williams, BW Research
Sarah Lehmann, BW Research
Rhode Island Office of Energy Resources Staff
Shauna Beland
Danny Musher
Chris Kearns
Nick Ucci
Ryan Crowley
Commerce RI Staff
Hannah Morini
Melissa Czerwein
OER would like to acknowledge the hard work on the early efforts of this report by Sue
AnderBois of the New England Clean Energy Council.

4
I. Executive Summary
Although a recent addition to statewide business ventures, Rhode Island’s clean energy
economy already supports 9,832 jobs across 1,295 business establishments. The sector
grew by 6.6% between 2014 and 2015, creating an additional 613 new jobs, significantly
faster than overall Rhode Island employment growth of less than 1% over the same
period.1 While only 40% of firms began conducting clean energy services in just the last
five years, the industry supports 2.1% of all jobs in Rhode Island and employers expect to
add an additional 1,600 new workers, a nearly 17% increase by 2016.
Installation represents the largest value chain activity2; nearly 54% of clean energy
employees, or 5,259 workers, support this clean energy subsector. The industry is largely
involved in energy efficiency and building envelope retrofits, employing a majority
(52.5%) of the clean energy workforce.3 Renewable energy accounts for 1,000
employees, or 11% of the workforce.
The sector is dominated by small businesses; a majority (87%) of establishments employ
fewer than 25 employees and nearly 61% report five or fewer workers. Clean energy
supports opportunities for firms in traditional industries, as many businesses do not earn
revenue from clean energy activity alone. Only 24.1% of firms report earning 100% of
their revenue from clean energy products and services and about one-third (33.5%) noted
less than a quarter of business from clean energy activity.
The state has a significant export market. While more than two-thirds (68.1%) of clean
energy firms report a primarily in-state customer base, nearly 32% export clean energy
products and services outside the state. The Ocean State also has a fairly localized supply
chain, as nearly 43% of firms support in-state vendors and suppliers and 30% report
suppliers in other parts of New England.
Clean energy businesses overwhelmingly cite the importance of consumer financial
incentives. Nearly 72% of firms note that financial incentives have the greatest impact on
the adoption of clean energy goods and services; reported reasons for past growth
similarly include customer rebates (17.6%) and other financial incentives (16.2%). About
22% of firms added that lack of consumer incentives are currently the greatest barrier to
growth.
Rhode Island’s clean energy industry supports employment across a range of experience
and education. About 56% of new hires are experienced, but nearly 44% were entry-level
workers. While 38% of new workers have a high school diploma, recent hires with a high
school diploma, post-secondary certificate, or associate’s degree comprise nearly 52% of
the workforce. About 35% have a bachelor’s degree and 13% have a graduate degree.
1 Current Employment Statistics, Bureau of Labor Statistics. 2 Value chain activities are defined as installation, engineering and research, consulting and finance, sales and distribution,
manufacturing, and other. 3 Clean energy industry sectors include energy efficiency and building envelope (smart grid and energy storage), renewable and efficient heating and cooling, renewable energy (electric power generation), alternative transportation, and other.
5
II. Introduction
Rhode Island’s clean energy economy highlights a promising future. This past year, the
American Council for an Energy Efficient Economy (ACEEE) ranked Rhode Island the
third most energy efficient state in the nation, an advancement from its ranking as
number six in 2013. The State received high marks for energy efficiency policies and
programs, particularly its stringent energy codes, effective enforcement, and high
compliance rates. In 2013, the State adopted the latest 2012 International Energy
Conservation Code (IECC) with mandatory statewide enforcement for commercial and
residential buildings.4 This past May, National Grid named the Rhode Island number one
in the nation for electricity savings as a percentage of demand.5
Statewide clean energy leadership is not limited to energy efficiency. In 1997, the state
created a Renewable Energy Fund; currently under the direction of Commerce RI, the
fund provides grants and loans for renewable energy projects and demand-side
management.6 In 2014, the Rhode Island General Assembly passed the Renewable
Energy Growth (REG) Program. The REG program launched in June 2015 and will be in
place over the next 4 years. The program will provide long-term performance-based
incentives for small- to large-scale renewable energy projects.7 The state’s governor and
treasurer, Gina Raimondo and Seth Magaziner, proposed the creation of the Rhode Island
Infrastructure Bank (RIIB) in the FY2016 Rhode Island State Budget. The RIIB will
finance both local job creation and the statewide shift to clean and efficient energy
production. In June 2015, the Rhode Island General Assembly overwhelmingly passed
and supported the budget article; RIIB and associated renewable and efficiency energy
programs scheduled to launch in 2016 including the extension of the State’s Least-Cost
procurement law until the end of 2023.8
Given recent policy efforts, as well as existing and upcoming programs designed to foster
clean energy growth, the Rhode Island Office of Energy Resources and Commerce RI
commissioned a study to determine the size and scope of the state’s clean energy
industry. This report provides data on both business establishments and employees that
are directly engaged in the research, development, manufacture, sale, distribution,
installation, or maintenance of energy efficiency and building envelope (including smart
grid and energy storage), renewable energy, renewable and efficient heating and cooling,
and alternative transportation.
The data in this report was collected from a comprehensive and representative sample of
businesses throughout Rhode Island. BW Research Partnership, an independent research
organization that has conducted similar studies in eleven other states, placed 4,450
telephone calls and sent 679 emails. A total of 728 employers provided information
4 2014 State Energy Efficiency Scorecard (www.aceee.org) 5 http://www.nationalgridus.com/aboutus/a3-1_news2.asp?Document=9493 6 http://programs.dsireusa.org/system/program/detail/461 7 http://programs.dsireusa.org/system/program/detail/5523 8 http://www.ginaraimondo.com/sites/ginaraimondo/files/gina-raimondo-infrastructure-plan.pdf
6
regarding their clean energy activities, resulting in a margin of error of +/-3.31% at a
95% confidence interval. For more detailed information, please see Appendix A.
III. Industry Overview
Rhode Island is home to a significant – and expanding – clean energy industry
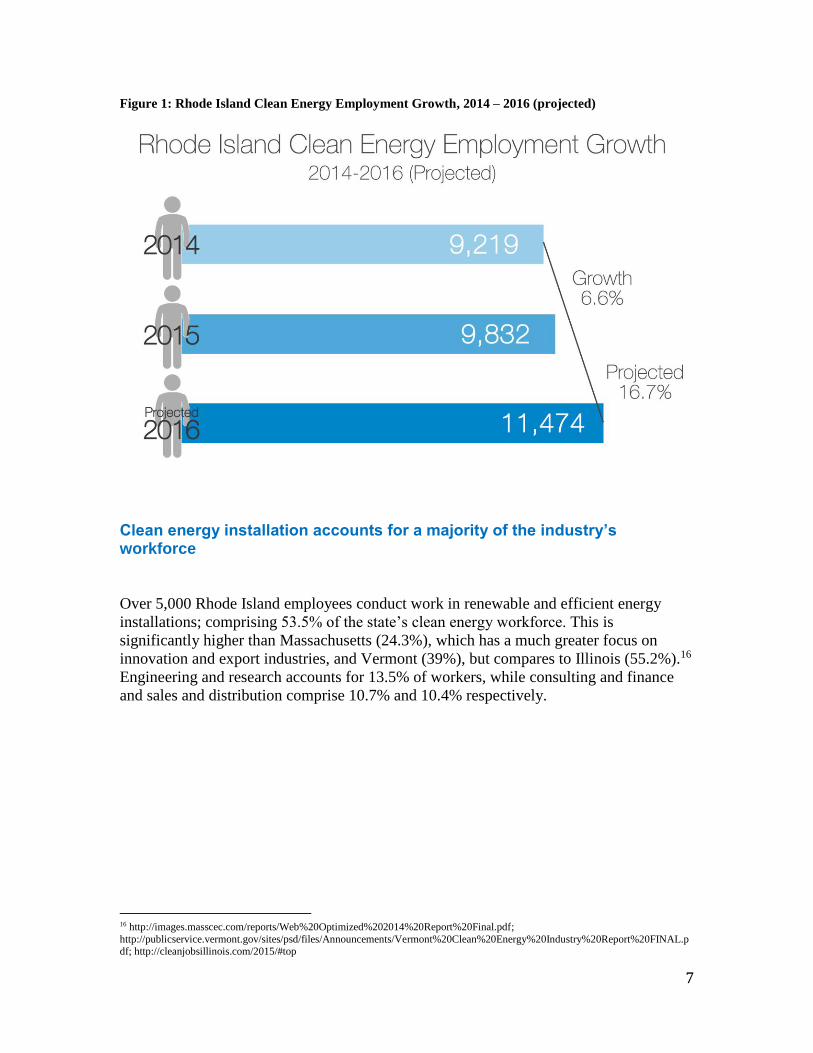
At the end of the first quarter of 2015, Rhode Island’s clean energy industry employed
9,832 clean energy workers9 at 1,295 business establishments10. Between the first
quarters of 2014 and 2015, clean energy employment increased by 6.6%, for an
additional 613 new jobs. This growth rate was 3.6 times greater than Rhode Island’s
overall employment growth of 1.8%. The state’s clean energy cluster supports 2.1% of all
jobs in Rhode Island11; this is the fourth highest percentage of the twelve states studied
using BW Research methodology.12 For comparison, the state’s two largest industries,
healthcare and tourism13, respectively accounted for 16.9% and 11.5% of statewide
employment in the first quarter of 2014. Between the first quarters of 2014 and 2015, the
healthcare industry shrank by 0.1% and hospitality grew by only 0.2%.14
Of the more than 9,800 clean energy workers in the state, 69.6% spend a majority of their
time on clean energy activities, while 63.7% spend all of their time delivering clean
energy products and services, such as solar panels, air and ground source heat pumps,
energy efficient lighting and building materials, wind turbines, and electric vehicles and
components.
Rhode Island employers are optimistic about the industry’s future growth, expecting
1,600 new workers by the end of the first quarter in 2016. This represents a 16.7% annual
increase, pushing the state’s total clean energy workforce to a projected 11,474
employees.15
9 Defined as workers who are involved in the clean energy segment of business. 10 Defined as firms that are directly engaged in the research, development, manufacture, sale, distribution, installation, or maintenance of energy efficiency and building envelope (including smart grid and energy storage), renewable energy, renewable and efficient
heating and cooling, and alternative transportation. 11 Current Employment Statistics, Bureau of Labor Statistics 12 Rhode Island ranks behind only Vermont, California and Massachusetts, but ahead of Florida, Ohio, Pennsylvania, Iowa, Missouri,
Tennessee, and Illinois. 13 Defined as “leisure and hospitality” 14 Rhode Island Department of Labor and Training, Labor Market Information 15 While this represents employers’ best estimates of their growth over the coming year, many factors contribute to employment
growth. The reported projections should therefore be seen as a general optimism among employers as opposed to a definitive projection.
7
Figure 1: Rhode Island Clean Energy Employment Growth, 2014 – 2016 (projected)
Clean energy installation accounts for a majority of the industry’s workforce
Over 5,000 Rhode Island employees conduct work in renewable and efficient energy
installations; comprising 53.5% of the state’s clean energy workforce. This is
significantly higher than Massachusetts (24.3%), which has a much greater focus on
innovation and export industries, and Vermont (39%), but compares to Illinois (55.2%).16
Engineering and research accounts for 13.5% of workers, while consulting and finance
and sales and distribution comprise 10.7% and 10.4% respectively.
16 http://images.masscec.com/reports/Web%20Optimized%202014%20Report%20Final.pdf;
http://publicservice.vermont.gov/sites/psd/files/Announcements/Vermont%20Clean%20Energy%20Industry%20Report%20FINAL.pdf; http://cleanjobsillinois.com/2015/#top

8
Figure 2: Rhode Island Clean Energy Employment by Value Chain Activity
Clean energy installation jobs pay a small but significant premium
According to the Bureau of Labor Statistics, installation, maintenance and repair jobs pay
an average of $22.62 per hour. Clean energy employers report paying a premium of up to
nearly $3.50 per hour, with averages ranging from $24-26 per hour.

9
Energy efficiency retrofits comprise the bulk of the state’s clean energy industry
The energy efficiency and building envelope sector17 employs 5,163 Rhode Island
workers, or 52.5% of the clean energy workforce. More than a quarter (27.3%) of total
employment in the state is found at firms whose primary service is delivering “renewable
and efficient heating and cooling”.
Businesses whose primary clean energy sector was electric power generation from
renewable energy (e.g. wind and solar) employ 1,079 workers, or 11% of the state’s clean
energy industry.
Figure 3: Employment by Primary Clean Energy Focus
17 Includes smart grid and energy storage.

10
Clean energy creates opportunities for small businesses
The majority of clean energy establishments are small firms, with 87% employing fewer
than 25 employees, and 60.9% reporting five or fewer clean energy workers. There are a
few firms (3.1%) that have 100 to 249 clean energy workers. These numbers are
comparable to other states in the northeast. Nearly 62% of Vermont’s clean energy firms
employ five or fewer workers; 87.5% employ less than 25.18 About 58% of
Massachusetts’ clean energy firms report five or fewer employees and nearly 85%
employ less than 25.19
Figure 4: Permanent Clean Energy Workers
Clean energy provides new revenue opportunities for traditional industries
The industry strengthens in-state manufacturing, building trades, and professional
services. Businesses rarely obtain total revenue from clean energy activity alone. In 2015,
only 24.1% of surveyed firms reported that all of their revenue came from providing
clean energy products and services. One-third (33.5%) of respondents said that less than a
quarter of the firm’s business came from clean energy activities.
18http://publicservice.vermont.gov/sites/psd/files/Announcements/Vermont%20Clean%20Energy%20Industry%20Report%20FINAL.
19 http://www.masscec.com/content/2014-clean-energy-industry-report

11
Figure 5: Percentage of firm’s work related to clean energy products or services
Clean energy is a recent addition to statewide business ventures
Nearly 40% of firms began conducting clean energy services in just the last five years.
Another 36% began work in the sector within the past 15 years.
Figure 6: Year that firms first began conducting clean energy activities

12
Rhode Island has a significant clean energy export market
While over two-thirds (68.1%) of the state’s clean energy firms report primarily in-state
consumers, nearly 32% export clean energy products and services outside the state.
Primary customer base is comparable to other states in the northeast. About 69% of firms
in Vermont reported primarily in-state customers.20 Similarly, 67% of energy efficiency
firms and 61.3% of renewable energy firms in Massachusetts have primarily in-state
customer bases.21
Figure 7: Primary location of clean energy customers
Rhode Island has the opportunity to grow its export and innovation cluster
Installation may provide the most number of jobs, but industries that export goods and
services direct revenue from out-of-state markets into Rhode Island’s economy. Thus,
export industries, often focused in research and development, finance, manufacturing,
and wholesale trade and distribution can access larger markets and provide greater
economic multipliers than firms supporting in-state consumption.
Just over a third (34.6%) of the industry workforce in the state is distributed almost
equally among engineering and research, consulting and finance, and sales and
distribution. Clean energy manufacturers employ 759 workers, or 7.7% of the state’s
clean energy industry.
20http://publicservice.vermont.gov/sites/psd/files/Announcements/Vermont%20Clean%20Energy%20Industry%20Report%20FINAL.
pdf 21 http://images.masscec.com/reports/Web%20Optimized%202014%20Report%20Final.pdf

13
Clean energy strengthens the local ecosystem of vendors and suppliers
Many clean energy firms (42.9%) report their vendors and suppliers to be primarily in
Rhode Island; 30% of businesses have suppliers in other parts of New England and
25.7% are supporting vendors in other parts of the nation. This compares to both
Tennessee (43.6% support in-state suppliers) and Massachusetts (49%), but is
significantly higher than Vermont (22.2%)
Figure 8: Supplier and vendor location
Rhode Island’s location, culture, landscape, and quality of life are advantages
Nearly 48% of firms report state size and location as the main advantage for operating in
Rhode Island, noting particularly the ease of networking opportunities within the state.
Nearly 20% indicated culture, landscape, and quality of life as the greatest advantage and
6.3% cited access to markets and supply chains.

14
Figure 9: Greatest advantage to operating in Rhode Island22
Figure 10: Greatest disadvantage to operating in Rhode Island
Clean energy businesses benefit from consumer financial incentives
Nearly 72% of firms cite financial incentives to have the greatest impact on adoption of
clean energy goods and services. Reported reasons for past growth similarly include
customer rebates (17.6%) and other financial incentives (16.2%).
22 For “Other” category, no single subcategory is greater than 2%

15
Figure 11: Policy or program that would have “greatest impact” on adoption of clean energy
Figure 12: Reported Reasons for Past Growth23
Disadvantages to operating in Rhode Island include the high cost of business and lack of
incentive programs or political support (Figure 10). Nearly three-quarters (71.7%) of
clean energy businesses reported that financial incentives for consumers would best
accelerate the adoption of clean energy goods and services (Figure 11); 22.1% added that
lack of consumer incentives are currently the greatest barrier to growth (Figure 13).
23 For “Other” category, no single subcategory is greater than 2%

16
Figure 13: Biggest barriers to company growth (can name up to 2)
Figure 14: Recommendations for Rhode Island State Government

17
IV. Hiring, Workforce Development and Training Needs
Statewide clean energy employees represent a wide range of demographic profiles
Firms reported employment across various backgrounds including race, age, and gender;
36.6% of recent hires are ethnic or racial minorities, 21.2% are women, 14.8% are 55 and
over, and 14.6% are veterans of the U.S. Armed Forces. Roughly 28% of all clean energy
employees are ethnic or racial minorities, 24% are over 55, 20% are women, and 15% are
veterans.
Numbers are moderately comparable to Massachusetts where ethnic and racial minorities
account for 22% of clean energy hires and 26% of new employees are women.24
Figure 15: Clean energy new hire demographics
Figure 16: Permanent clean energy employee demographics
24 http://images.masscec.com/reports/Web%20Optimized%202014%20Report%20Final.pdf
18
Clean energy supports employment across a range of experience and education
A majority (56.3%) of new hires have experience, while 43.8% were entry-level
employees.
Among the types of experience employers were looking for, companies specifically noted
that some of the “feeder” industries and sources for recent hires were:
Construction (including carpentry, plumbing, heating technicians, etc.)
Electricians (including energy efficiency and solar-specific knowledge)
Engineering
Apprenticeships and training programs
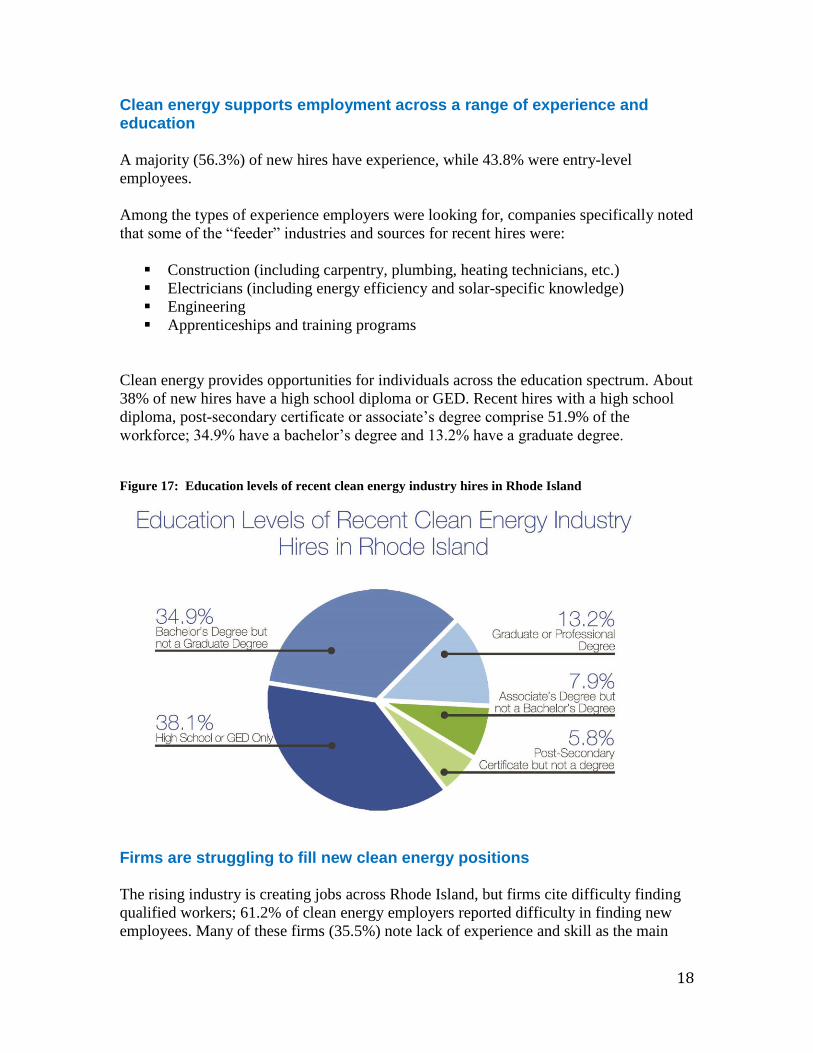
Clean energy provides opportunities for individuals across the education spectrum. About
38% of new hires have a high school diploma or GED. Recent hires with a high school
diploma, post-secondary certificate or associate’s degree comprise 51.9% of the
workforce; 34.9% have a bachelor’s degree and 13.2% have a graduate degree.
Figure 17: Education levels of recent clean energy industry hires in Rhode Island
Firms are struggling to fill new clean energy positions
The rising industry is creating jobs across Rhode Island, but firms cite difficulty finding
qualified workers; 61.2% of clean energy employers reported difficulty in finding new
employees. Many of these firms (35.5%) note lack of experience and skill as the main

19
reason for difficulty. While the majority said they had hiring difficulties, over a third of
employers (36.7%) reported no problems.
These results are roughly comparable to clean energy employers in Pennsylvania; 80%
encountered challenges, 20% of which identified lack of experience or knowledge as the
main reason.25 In Florida, nearly 76% of businesses reported hiring challenges.26
About 66% of Massachusetts renewable energy firms reported difficulty finding entry-
level workers and 79% reported difficulty finding experienced employees. These
numbers are comparable to energy efficiency firms; 63% reported challenges filling
entry-level positions and 73% had difficulty finding experienced candidates.27
Figure 18: Level of difficulty in hiring new workers
25 https://www.e2.org/ext/doc/CleanJobsPennsylvania.pdf 26 http://cleanenergyworksforus.org/wp-content/uploads/2014/10/CleanJobsFlorida.pdf 27http://images.masscec.com/reports/Web%20Optimized%202014%20Report%20Final.pdf

20
Figure 19: Reasons for hiring difficulty
Current education and training programs do not meet employer standards
Only 27.6% of respondents said that both the quality and quantity of Rhode Island
graduates was sufficient, while a majority (58.5%) had issues with either quality,
quantity, or both. This is significantly higher than other statewide clean energy studies.28
Figure 20: Opinion of Rhode Island Education and Training Programs
28 See generally, Massachusetts Clean Energy Industry Report; San Diego County Clean Energy Priority Sector Report
21
V. Conclusions and Recommendations
This study is the first comprehensive analysis of the size and composition of Rhode
Island’s clean energy industry. It is based on detailed surveys received from clean energy
establishments in every part of the state and every sector of the clean energy economy.
The survey responses provide evidence that the Ocean State has a significant – and
rapidly growing – industry of clean energy firms. The sector is a vital part of the overall
Rhode Island economy, and its jobs pay sustainable wages across the state.
Statistics from this inaugural study are encouraging. At the end of the first quarter of
2015, Rhode Island’s industry employed 9,832 clean energy workers at 1,295
establishments. The industry’s annual growth rate of 6.6% was more than 3.6 times better
than the state’s overall employment growth of 1.8%. Clean energy employers support
2.1% of all jobs in Rhode Island.
More than half of Rhode Island’s clean energy workers (52.5%) were employed in energy
efficiency related jobs, with 27.3% involved in renewable and efficient heating and
cooling, and 11% working in renewable energy electric power generation. The remaining
9.2% is divided among other small sectors.
Rhode Island’s clean energy firms prosper under financial incentives that promote cost-
effective clean energy decisions for residents, businesses and government consumers.
Firms report that the primary reason for past growth are strong consumer incentives and
other policy support, citing incentive programs as the single most important action that
can strenghen the industry and create jobs. To maintain this growth, Rhode Island
could focus on continuing and expanding programs that incentivize clean energy
technologies among consumers.
The industry draws from a strong in-state customer base and supports an equally strong
group of in-state vendors and suppliers. Clean energy businesses also draw a significant
percentage of customers from other states in New England, and beyond. Alternatively,
business directed to out-of-state suppliers might signal opportunity for in-state vendors to
serve this growing sector.
Given limited in-state market potential, Rhode Island might consider developing
export and innovation segments of its clean energy economy. Innovation is critical;
early-stage firms attract investment dollars and generate economic activity. Supportive
policies may signal global firms to establish business operations in Rhode Island, while
existing in-state manufacturing and sales could benefit from increased access to out-of-
state markets. A network of clean energy trade could significantly impact the local
economy, expanding revenues for Rhode Island’s businesses.
Rhode Island could examine its strategic opportunities in manufacturing,
professional services, and research to leverage regional strength. With proximity to
22
dozens of highly regarded engineering, science, and technology-focused educational
institutions, the state could maximize talent potential by developing incubators,
facilitating technology transfer, and assisting start-ups.
This baseline study illustrates strong employment, but Rhode Island clean energy firms
maintain opportunities for growth. A major challenge to growth is the availability of
adequate talent. Over 60% of firms report difficulty finding and hiring candidates; many
note a shortage of people with appropriate experience and skills. Clean energy firms are
less than pleased with both the quality and quantity of graduates from the state’s
educational and training institutions. This is an opportunity to collaborate with local
employers and develop meaningful career pathways and training programs. Talent
development will serve the growing industry’s needs and provide sustainable
careers for under or unemployed residents.
Results from the 2015 survey of clean energy businesses in Rhode Island reveal an
industry that is strong, growing, and very optimistic about the future. Survey respondents
project employment growth at 16.7% for the following year.
Recent passage of the governor’s budget added powerful tools to grow the economy.
Rhode Island has an opportunity; clean energy can be a significant economic engine to
create jobs and build an ecosystem of innovative exporters that will expand the state’s
economy. The state can capture this opportunity with renewed investment in consumer
incentives, programs to support start-up activity and enterprise expansion, and a
commitment to developing local talent. With these programs in place, Rhode Island is
poised for economic growth and job creation.
23
Appendix A: Methodology
Glossary of Terms
Activity
For the purposes of this report, an establishment’s activity refers to the primary value-
chain industry to which it most associates its work. Activities include research,
development and engineering, manufacturing, sales and distribution, installation and
maintenance, legal, finance, and other professional services, and other.
Alternative Transportation
Alternative Transportation includes non-fossil fuel related vehicles, including electric rail
and electric vehicles. This includes:
Electric Vehicles Passenger or freight cars, trucks or buses that use electric drive systems and
electric motors for propulsion.
Electric Rail
Passenger or freight trains or trolleys that operate with electric motors for
propulsion.
Clean Energy Industry
The aggregate of establishments that are directly involved with researching, developing,
producing, manufacturing, distributing or implementing components, goods or services
related to Renewable Energy, Energy Efficiency or Conservation, Smart Grid, Energy
Storage, Carbon Management and/or Electric or Hybrid Vehicles.
Clean Energy Firm
For the purposes of this report, an establishment or firm that is involved with an activity
related to the clean energy industry.
Clean Energy Worker Full-time and part-time permanent employees who support the clean energy portion of
the business, including administrative staff, excluding interns and other temporary
workers.
Cluster
A geographic concentration of interconnected businesses in related industries.
Energy Efficiency
Goods and services that reduce energy demand. Energy Efficiency includes the
following technologies:
24
Lighting
Light emitting sources that use less energy to operate than traditional
incandescent or halogen bulbs. Includes fluorescent, LED and other lower-
energy light bulbs and fixtures.
HVAC and Building Controls
Heating, ventilation, and air conditioning systems (HVAC), including
building retro-commissioning and retrofits connected to heating and cooling.
Energy Efficient Appliances
Development, production, sale, installation and maintenance of ENERGY
STAR or other similarly designated appliance that uses less energy than
traditional models.
Energy Efficient Processes and Machinery
Energy saving measures and production equipment. Most typically applicable
to manufacturing and data centers.
Energy Storage
Devices or physical media that store energy.
Demand Response Services
Operations that balance energy supply and demand. Include offering time-
based rates such as time-of-use pricing, critical peak pricing, variable peak
pricing, real time pricing and critical peak rebates. It also includes direct load
control programs which provide the ability for power companies to cycle air
conditioners and water heaters on and off during periods of peak demand in
exchange for a financial incentive and lower electric bills.
Smart Grid
Automated, computer-based electricity delivery, including smart computing
and software.
Weatherization Services Energy Efficiency improvements to a building’s envelope, including air-
sealing, caulking, window repair/replacement and insulation
Energy Efficient Building Materials Any materials that reduce total building energy use.
Water and Wastewater Technologies related to Conserving Energy Products related to reducing energy for water purification, distribution or
treatment.
Establishment
For the purposes of this report, a business location in Rhode Island with at least one
employee.
Greenhouse Gas Emissions Accounting and Management
Primarily includes carbon capture and storage, secondary carbon markets (such as RGGI)
and coal gasification. This includes:
Carbon Capture and Storage
The process of capturing waste carbon dioxide from large point source emitters
and depositing it in a location that cannot enter the atmosphere, such as in deep
geological formations. Also referred to as sequestration.

25
Secondary Carbon Markets
Trade of carbon credits in a cap and trade or similar system.
Coal Gasification
The production of synthetic gas from coal via thermo-chemical processes.
Pre-Commercial
Work that has yet to reach market or products that are in the development phase.
Production/Technician Hires
Workers in the field or on the floor, generally working in assembly, installation, or other
technical, non-managerial tasks.
Pure-Play
Refers to a company or establishment that has or is very close to possessing a single
business focus, i.e. a “pure-play” Energy Efficiency firm would be only associated with
Energy Efficiency work.
Renewable Energy (Renewable Electricity Generation)
Renewable Energy refers to electricity and/or heat generated from sustainable sources.
Renewable Energy primarily includes the following technologies:
Solar
Electricity, heat, or cooling provided by the sun. Includes photovoltaic (PV),
thermal and concentrated (CSP)
Wind Power
Conversion of wind energy to electricity.
Fuel Cell Device that converts fuel to electricity via chemical conversion.
Woody and Non-Woody Bioenergy Energy produced from organic, biological sources.
Hydropower or Hydrokinetic Electricity generated from the movement of water. Includes river, wave and
tidal sources.
Geothermal Production of electricity from subsurface heat. Differs from ground-source
heat pumps, which are considered Energy Efficiency products for the
purposes of this study.
Hydrogen Generation Production of energy using hydrogen as a fuel source.
Thermal to Energy Conversion Production of electricity by using temperature differential. Includes ocean,
solar and chemical sources.
Renewable Combined Heat and Power Production of electricity and usable heat from renewable sources. Also called
cogeneration.

26
Renewable and Efficient Heating and Cooling
Refers to establishments that are involved with heating, ventilation and air conditioning
(HVAC) from Renewable Energy sources or work that increases the Energy Efficiency of
HVAC systems.
Retrocommissioning
Refers to the process of improving a building or structures operating process by
increasing occupant comfort and saving energy usually through Energy Efficiency
measures (weatherization, lighting, etc.).
Technology
For the purposes of this report, technology refers to the primary application or end use of
a firm’s produced goods or services. Technologies include Energy Efficiency,
Renewable Energy, alternative transportation, greenhouse gas management and
accounting, or other.
Sub-Technology
For the purposes of this report, sub-technology refers to the specific technologies with
which an establishment works, within each technology area. The sub-technologies for
Energy Efficiency and Renewable Energy are listed under the respective definitions.
Survey Methodology The primary data included in this study are derived from a comprehensive survey of
business establishments in Rhode Island. Surveys were administered online and by
telephone to a list of known employers as well as to a representative, clustered sample of
companies from the North American Industry Classification System (NAICS) identified
by the Bureau of Labor Statistics (BLS) and BW Research Partnership as being
potentially related to the Renewable Energy, Energy Efficiency and alternative
transportation technologies. The research methodology employed for this report has been
used increasingly as a tool for measuring clean energy industry jobs and businesses,
including in Massachusetts, California, Florida, Illinois, Iowa, Missouri, Ohio,
Pennsylvania, Tennessee, and Vermont.
In 2015, the research team placed 4,406 telephone calls and sent 679 emails to employers
in Rhode Island. The survey effort, with a combined margin of error of approximately
+/-3.44% at a 95% confidence interval, yielded 678 survey responses. The survey fielded
from April 15 to May 1 and averaged 14.2 minutes in length.
In addition to providing overall totals; survey respondents were asked to select the
technology to which their firm’s work is most closely associated, from a list including
Renewable Energy, Energy Efficiency, alternative transportation, or greenhouse gas
emissions accounting and sequestration. Based on their selection(s), respondents were
offered lists of specific sub-technologies that fit within each technology. Respondents
were provided the following descriptions upon request.

27
“Known Universe” – Firms Previously Identified by Researchers as Clean Energy
Companies
The original list, developed from previous work efforts and databases from the
Commerce Rhode Island, the Rhode Island Office of Energy Resources, and partner
organizations (including utilities), contains companies that are more likely to be active in
the clean energy economy. After duplicate cleaning and applying estimates from the
survey data to account for companies that are no longer in business, do not have at least
one Rhode location or do not identify as in the clean energy industry, as well as
improvements and additions since the first survey effort, the 2015 “known universe” of
firms is estimated at 732 companies.
All firms in the database with addresses were sent a letter from Commerce RI and OER
with respondent-specific instructions for taking the survey. In addition, all businesses
with email information were sent multiple online invitations. Firms in the database that
did not complete an online survey and those without email information were called up to
six times and asked to complete by telephone.
Of the estimated 732 firms in the known universe, 161 completed a survey. The 2015
data show that there are 6,793 workers in the known universe.
“Unknown Universe” – Firms Not Previously Identified by Researchers as Clean
Energy Companies
This database for the “unknown universe” was drawn from BLS NAICS industries and
InfoUSA business listings. The incidence rates (i.e., the percentage of firms that
identified as clean energy) for the 18 NAICS industries were calculated by surveying the
previously unknown 443 firms (that indicated whether or not they were in clean energy).
In addition, 66 firms from the “unknown universe” identified as clean energy and
completed full surveys. Compared to the known universe, the mean number of clean
energy employees at “unknown” establishments is lower by a significant margin,
depending on the specific industry.
Surveys were administered in accordance with the Code of Standards and Ethics for
Survey Research (CASRO), which includes stringent guidelines for maintaining
respondent confidentiality. As a result, employer lists and disaggregated data are not
available for public release.