Embed Size (px)
DESCRIPTION
CB 4 will hold a public hearing and vote on Forrest Lots' ULURP proposal to put 1000 units of mostly market-rate rental housing on the old Rheingold Brewery site. To those who would like to have a voice in shaping the next big developer-driven proposal in Bushwick, please attend this meeting!When: Monday, July 29, 6 pmWhere: Audrey Johnson Day Care Center, 272 Moffat Street in Bushwick.
Citation preview

RHEINGOLD DEVELOPMENT
REZONING
ENVIRONMENTAL ASSESSMENT STATEMENT
CEQR# 09DCP002K
Prepared for: Forrest Lots, LLC
Prepared by: Philip Habib & Associates
July 27, 2012

RHEINGOLD DEVELOPEMNT REZONING
ENVIRONMENTAL ASSESSMENT STATEMENT
CEQR# 09DCP002K
Table of Contents
Environmental Assessment Statement
Full Form Attachment A: Project Description Additional Technical Information for EAS Part II
Appendices
Appendix A: LPC Environmental Review Letters Appendix B: Transportation Planning Factors Memorandum

TM City Environmental Quality ReviewENVIRONMENTAL ASSESSMENT STATEMENT FULL FORMPlease fill out, print and submit to the appropriate agency (see instructions)
PART I: GENERAL INFORMATION
PROjECT NAME
1. Reference Numbers
CEQR REFERENCE NUMBER (To Be Assigned by Lead Agency) BSA REFERENCE NUMBER (If Applicable)
ULURP REFERENCE NUMBER (If Applicable)) OTHER REFERENCE NUMBER(S) (If Applicable) (e.g. Legislative Intro, CAPA, etc)
2a. Lead Agency InformationNAME OF LEAD AGENCY
2b. Applicant InformationNAME OF APPLICANT
NAME OF LEAD AGENCY CONTACT PERSON NAME OF APPLICANT’S REPRESENTATIVE OR CONTACT PERSON
ADDRESS ADDRESS
CITY STATE ZIP CITY STATE ZIP
TELEPHONE FAX TELEPHONE FAX
EMAIL ADDRESS EMAIL ADDRESS
3. Action Classification and Type
SeqRA Classification
UNLISTED TYPE I; SPECIFY CATEGORY (see 6 NYCRR 617.4 and NYC Executive Order 91 of 1977, as amended):
Action Type (refer to Chapter 2, “Establishing the Analysis Framework” for guidance)
LOCALIZED ACTION, SITE SPECIFIC LOCALIZED ACTION, SMALL AREA GENERIC ACTION
4. Project Description:
4a. Project Location: Single Site (for a project at a single site, complete all the information below)
ADDRESS NEIGHBORHOOD NAME
TAX BLOCK AND LOT BOROUGH COMMUNITY DISTRICT
DESCRIPTION OF PROPERTY BY BOUNDING OR CROSS STREETS
EXISTING ZONING DISTRICT, INCLUDING SPECIAL ZONING DISTRICT DESIGNATION IF ANY: ZONING SECTIONAL MAP NO:
4b. Project Location: Multiple Sites (Provide a description of the size of the project area in both City Blocks and Lots. If the project would apply to the entire city or to areas that are so extensive that a site-specific description is not appropriate or practicable, describe the area of the project, including bounding streets, etc.)
5. REQUIRED ACTIONS OR APPROVALS (check all that apply)
City Planning Commission: YES NO Board of Standards and Appeals: YES NO
CITY MAP AMENDMENT ZONING CERTIFICATION SPECIAL PERMIT
ZONING MAP AMENDMENT ZONING AUTHORIZATION EXPIRATION DATE MONTH DAY YEAR
ZONING TEXT AMENDMENT HOUSING PLAN & PROjECT
UNIFORM LAND USE REVIEW PROCEDURE (ULURP) SITE SELECTION — PUBLIC FACILITY VARIANCE (USE)
CONCESSION FRANCHISE
UDAAP DISPOSITION — REAL PROPERTY VARIANCE (BULK)
REVOCABLE CONSENT
ZONING SPECIAL PERMIT, SPECIFY TYPE: SPECIFY AFFECTED SECTION(S) OF THE ZONING RESOLUTION
MODIFICATION OF
RENEWAL OF
OTHER

eas full form page 2
Department of environmental Protection: YES NO
Other City Approvals: YES NO
LEGISLATION RULEMAKING
FUNDING OF CONSTRUCTION; SPECIFY CONSTRUCTION OF PUBLIC FACILITIES
POLICY OR PLAN; SPECIFY FUNDING OF PROGRAMS; SPECIFY
LANDMARKS PRESERVATION COMMISSION APPROVAL (not subject to CEQR) PERMITS; SPECIFY:
384(b)(4) APPROVAL OTHER; EXPLAIN
PERMITS FROM DOT’S OFFICE OF CONSTRUCTION MITIGATION AND COORDINATION (OCMC) (not subject to CEQR)
6. State or Federal Actions/Approvals/Funding: YES NO IF “YES,” IDENTIFY
7. Site Description: Except where otherwise indicated, provide the following information with regard to the directly affected area. The directly affected area consists of the project site and the area subject to any change in regulatory controls.GRAPhICS The following graphics must be attached and each box must be checked off before the EAS is complete. Each map must clearly depict the boundaries of
the directly affected area or areas and indicate a 400-foot radius drawn from the outer boundaries of the project site. Maps may not exceed 11×17 inches in size and must be folded to 8.5 ×11 inches for submission.
Site location map Zoning map Photographs of the project site taken within 6 months of EAS submission and keyed to the site location map
Sanborn or other land use map Tax map For large areas or multiple sites, a GIS shape file that defines the project sites
PhySICAL SETTINg (both developed and undeveloped areas)
Total directly affected area (sq. ft.): Type of waterbody and surface area (sq. ft.): Roads, building and other paved surfaces (sq. ft.)
Other, describe (sq. ft.):
8. Physical Dimensions and Scale of Project (if the project affects multiple sites, provide the total development below facilitated by the action)
Size of project to be developed: (gross sq. ft.)
Does the proposed project involve changes in zoning on one or more sites? YES NO
If ‘Yes,’ identify the total square feet owned or controlled by the applicant : Total square feet of non-applicant owned development:
Does the proposed project involve in-ground excavation or subsurface disturbance, including but not limited to foundation work, pilings, utility lines, or grading? YES NO
If ‘Yes,’ indicate the estimated area and volume dimensions of subsurface disturbance (if known):
Area: sq. ft. (width × length) Volume: cubic feet (width × length × depth)
Does the proposed project increase the population of residents and/or on-site workers? YES NO Number of additional residents?
Number of additional workers?
Provide a brief explanation of how these numbers were determined:
Does the project create new open space? YES NO If Yes: (sq. ft)
Using Table 14-1, estimate the project’s projected operational solid waste generation, if applicable: (pounds per week)
Using energy modeling or Table 15-1, estimate the project’s projected energy use: (annual BTUs)
9. Analysis Year CEQR Technical Manual Chapter 2ANTICIPATED BUILD YEAR (DATE THE PROjECT WOULD BE COMPLETED AND OPERATIONAL): ANTICIPATED PERIOD OF CONSTRUCTION IN MONTHS:
WOULD THE PROjECT BE IMPLEMENTED IN A SINGLE PHASE? YES NO IF MULTIPLE PHASES, HOW MANY PHASES:
BRIEFLY DESCRIBE PHASES AND CONSTRUCTION SCHEDULE:
10. What is the Predominant Land Use in Vicinity of Project? (Check all that apply)
RESIDENTIAL MANUFACTURING COMMERCIAL PARK/FOREST/OPEN SPACE OTHER, Describe:

GEORGEST
JEFF
ERSONST
MEL
ROSEST
NOLLST
TROUTM
ANST
WILSON AV
ROCK ST
THAMES ST
CENTRAL AV
FLUSHING AV
FORRES
TST
CHARLESPL
ARIO
NPL
BUSHWICK
JEFF
ERSO
NST
JEFFERSON ST
MEL
ROSE
STMELROSE ST
TROUTM
ANST
WILLOUGHBY AV
FLUSHING AV
COOK ST
EVERG
REEN
AV
MOORE ST
VARET ST
BUS
HW
ICK
AV
EVERG
REEN
AV
STANW
IX ST
LOCUST
ST
LEW
ISA
VSTOCKTON ST
BELV
IDER
EST
FORREST ST
GARDEN ST
MONTIETH ST
FAYET
TEST
ELLERY ST
MAR
CU
SG
AR
VEY
BLVD
PARK AV
BEAVER ST
BROADWAY
ELLE
RYST
PARK
ST
SUM
NERPL
BROADWAY
DEBEVOISE ST
Rheingold Development Rezoning EAS Figure 1Project Location
Legend400 Foot Radius Proposed Rezoning Area
°
Project Site
Brooklyn
0 300 600 900150Feet

Rheingold Development Rezoning EAS Figure 2Zoning Map

MYRTLE AV
FLUSHING AV
BROADWAY
BUSHWICK AV
EVERG
REEN
AV
VERNON AV
CENTRAL AV
NOLLST
WILLOUGHBY AV
PARK AV
GEORGEST
HART ST
WILSON AV
COOK ST
MOORE ST
VARET ST
MELR
OSEST
CEDARST
GR
AH
AMAV
SEIGEL ST
BEAVER ST
LEW
ISAV
STAR
RST
HU
MB
OLD
TST
DEKALB
AV
JEFF
ERSONST
MA
RC
US
GA
RV
EY
BL
THR
OO
PAV
TROUTMAN ST
SUYDAMST
WH
ITES
T
PARK
ST
ARIO
NPL
BOG
AR
TS
T
KNICKERBOCKER AV
GARDEN ST
ELLE
RYST
ROCK ST
DEBEVOISE ST
LOCUST
ST
FAYE
TTE
ST
THAMES ST
FORREST
ST
DITM
ARS
ST
MO
RG
AN
AV
BELV
EDER
EST
MONTIETH ST
STUY
VE
SAN
TAV
STOCKHOLM
ST
STANW
IXS
T
STOCKTON ST
SUM
NERPL
LAW
TON
ST
THORNTONST
CHARLESPL
NO NAME
NOLL ST
MELROSE ST
VARET ST
TROUTM
ANST
HART
ST
ELLERY ST
MELR
OSEST
MOORE ST
SUYDAMST
SEIGEL ST
JEFF
ERSONST
WIL
LOUGHBY
AV
COOK ST
SUYDAM
ST
VAN
DE
RV
OO
RT
PL
DODWORTH
ST
BUSHWICK CT
MC
KIBB
INC
T
WHIPPLE ST
STANW
IXST
EX
POR
TER
AV
NO NAME
HART
ST
STANW
IXST
STANW
IXS
T
Rheingold Development Rezoning
°
Figure 3Land Use Map
Legend
400 Foot Radius
1 & 2 Family Walk-Up
Multi-Family Walk-Up
Multi-Family Elevator
Mixed-Use
Commercial
Industrial
Transportation & Warehousing
Institutional
Open Space
Parking Facilities
Vacant LandProposed Rezoning Area
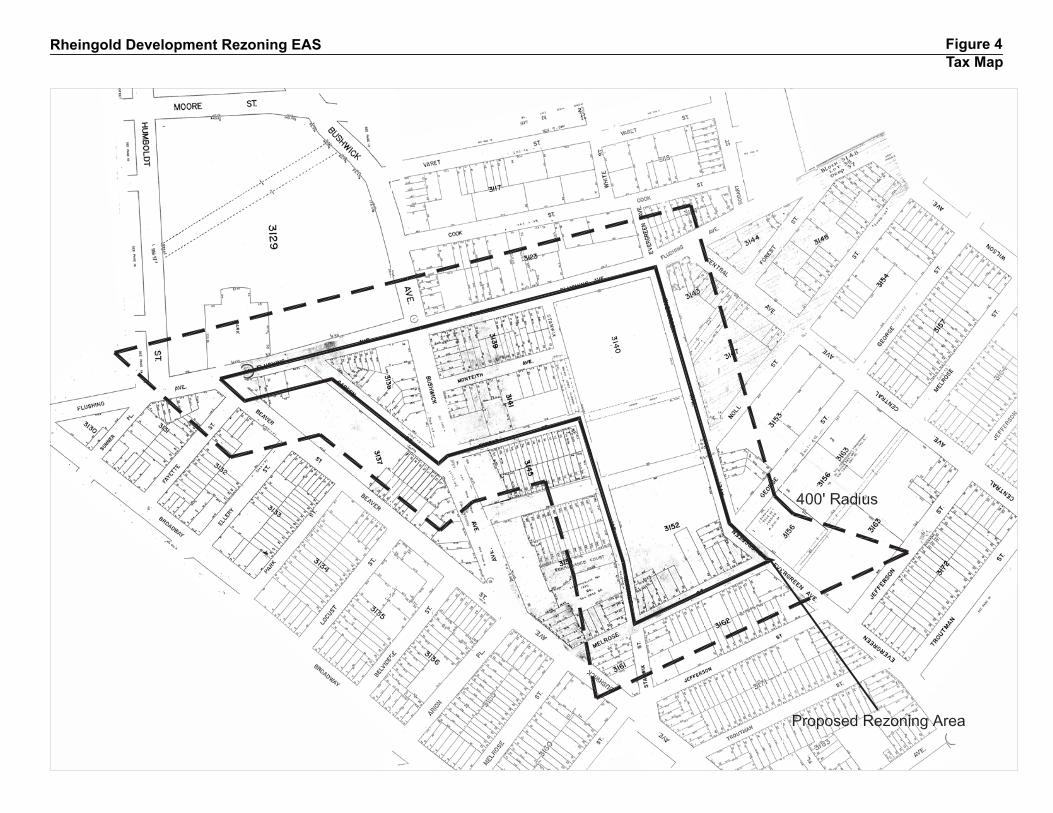
Figure 4Tax Map
Rheingold Development Rezoning EAS
eas full form page 3
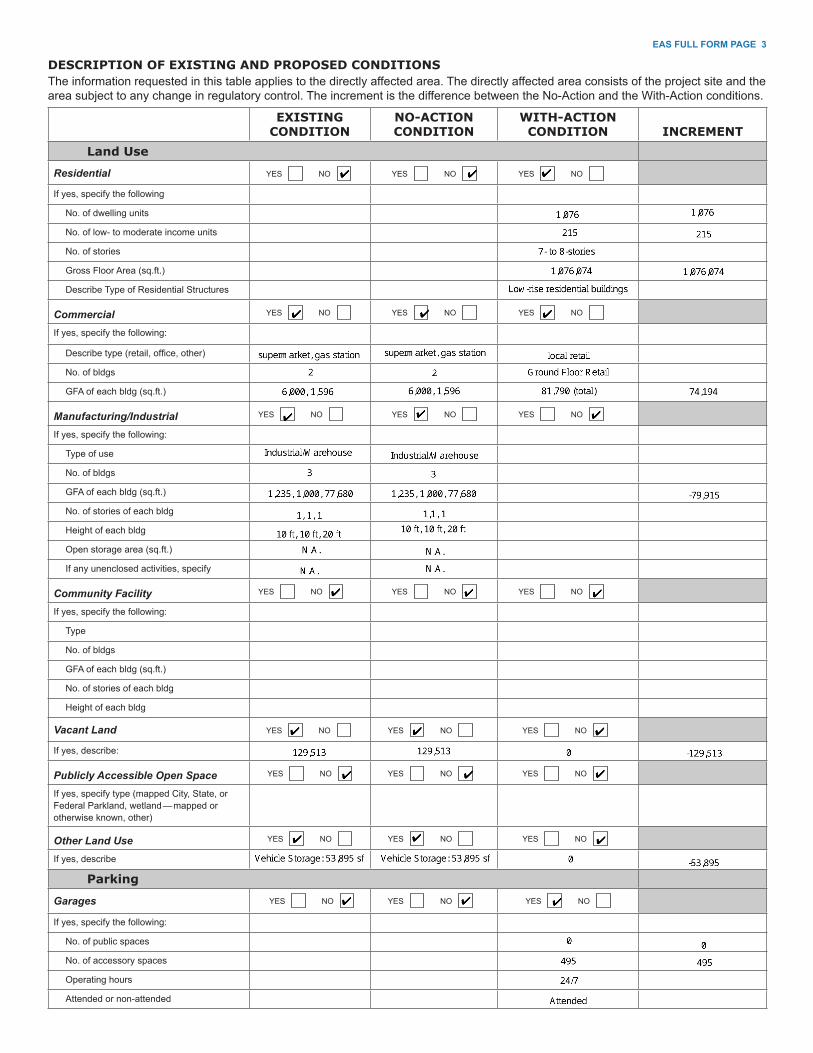
DESCRIPTION OF EXISTING AND PROPOSED CONDITIONSThe information requested in this table applies to the directly affected area. The directly affected area consists of the project site and the area subject to any change in regulatory control. The increment is the difference between the No-Action and the With-Action conditions.
EXISTING CONDITION
NO-ACTIONCONDITION
WITH-ACTION CONDITION INCREMENT
Land Use
Residential YES NO YES NO YES NO
If yes, specify the following
No. of dwelling units
No. of low- to moderate income units
No. of stories
Gross Floor Area (sq.ft.)
Describe Type of Residential Structures
Commercial YES NO YES NO YES NO
If yes, specify the following:
Describe type (retail, office, other)
No. of bldgs
GFA of each bldg (sq.ft.)
Manufacturing/Industrial YES NO YES NO YES NO
If yes, specify the following:
Type of use
No. of bldgs
GFA of each bldg (sq.ft.)
No. of stories of each bldg
Height of each bldg
Open storage area (sq.ft.)
If any unenclosed activities, specify
Community Facility YES NO YES NO YES NO
If yes, specify the following:
Type
No. of bldgs
GFA of each bldg (sq.ft.)
No. of stories of each bldg
Height of each bldg
Vacant Land YES NO YES NO YES NO
If yes, describe:
Publicly Accessible Open Space YES NO YES NO YES NO
If yes, specify type (mapped City, State, or Federal Parkland, wetland — mapped or otherwise known, other)
Other Land Use YES NO YES NO YES NO
If yes, describe
Parking
Garages YES NO YES NO YES NO If yes, specify the following:
No. of public spaces
No. of accessory spaces
Operating hours
Attended or non-attended

eas full form page 4
EXISTING CONDITION
NO-ACTIONCONDITION
WITH-ACTION CONDITION INCREMENT
Parking (continued)
Lots YES NO YES NO YES NO If yes, specify the following:
No. of public spaces
No. of accessory spaces
Operating hours
Other (includes street parking) YES NO YES NO YES NO If yes, describe
Storage Tanks
Storage Tanks YES NO YES NO YES NO If yes, specify the following:
Gas/Service stations YES NO YES NO YES NO
Oil storage facility YES NO YES NO YES NO
Other, identify: YES NO YES NO YES NO If yes to any of the above, describe:
Number of tanks
Size of tanks
Location of tanks
Depth of tanks
Most recent FDNY inspection date
Population
Residents YES NO YES NO YES NO
If any, specify number
Briefly explain how the number of residents was calculated:
Businesses YES NO YES NO YES NO
If any, specify the following:
No. and type
No. and type of workers by business
No. and type of non-residents who are not workers
Briefly explain how the number of businesses was calculated:
Zoning*
Zoning classification
Maximum amount of floor area that can be developed (in terms of bulk)
Predominant land use and zoning classifications within a 0.25 mile radius of proposed project
Attach any additional information as may be needed to describe the project.
If your project involves changes in regulatory controls that affect one or more sites not associated with a specific development, it is generally appropriate to include the total development projections in the above table and attach separate tables outlining the reasonable development scenarios for each site.
*This section should be completed for all projects, except for such projects that would apply to the entire city or to areas that are so extensive that site-specific zoning information is not appropriate or practicable.

eas full form page 5
PART II: TECHNICAL ANALySES
INSTRUCTIONS: For each of the analysis categories listed in this section, assess the proposed project’s impacts based on the thresholds and criteria presented in the CEQR Technical Manual. Check each box that applies.
If the proposed project can be demonstrated not to meet or exceed the threshold, check the ‘• No’ box.
If the proposed project will meet or exceed the threshold, or if this cannot be determined, check the ‘• Yes’ box.
For each ‘Yes’ response, answer the subsequent questions for that technical area and consult the relevant chapter of the CEQR •Technical Manual for guidance on providing additional analyses (and attach supporting information, if needed) to determine whether the potential for significant impacts exists. Please note that a ‘Yes’ answer does not mean that an EIS must be prepared—it often only means that more information is required for the lead agency to make a determination of significance.
The lead agency, upon reviewing Part II, may require an applicant to either provide additional information to support the Full EAS •Form. For example, if a question is answered ‘No,’ an agency may request a short explanation for this response.
YES NO
1. LAND USE, ZONINg AND PUbLIC POLICy: CEQR Technical Manual Chapter 4
(a) Would the proposed project result in a change in land use or zoning that is different from surrounding land uses and/or zoning?Is there the potential to affect an applicable public policy? If “Yes”, complete a preliminary assessment and attach.
(b) Is the project a large, publicly sponsored project? If “Yes”, complete a PlaNYC assessment and attach.
(c) Is any part of the directly affected area within the City’s Waterfront Revitalization Program boundaries?If “Yes”, complete the Consistency Assessment Form.
2. SOCIOECONOmIC CONDITIONS: CEQR Technical Manual Chapter 5
Would the proposed project: (a)
Generate a net increase of 200 or more residential units?•
Generate a net increase of 200,000 or more square feet of commercial space?•
Directly displace more than 500 residents?•
Directly displace more than 100 employees?•
Affect conditions in a specific industry?•
(b) If ‘Yes’ to any of the above, attach supporting information to answer the following questions, as appropriate. If ‘No’ was checked for each category above, the remaining questions in this technical area do not need to be answered.
(1) Direct Residential Displacement
If more than 500 residents would be displaced, would these displaced residents represent more than 5% of the primary • study area population?
If ‘Yes,’ is the average income of the directly displaced population markedly lower than the average income of the rest of the • study area population?
(2) Indirect Residential Displacement
Would the expected average incomes of the new population exceed the average incomes of the study area populations?•
If ‘Yes,’ would the population increase represent more than 5% of the primary study area population or otherwise potentially • affect real estate market conditions?
If ‘Yes,’ would the study area have a significant number of unprotected rental units?•
Would more than 10 percent of all the housing units be renter-occupied and unprotected?
Or, would more than 5 percent of all the housing units be renter-occupied and unprotected where no readily observable trend toward increasing rents and new market rate development exists within the study area?

eas full form page 6
YES NO(3) Direct Business Displacement
Do any of the displaced businesses provide goods or services that otherwise could not be found within the trade area, either • under existing conditions or in the future with the proposed project?
Do any of the displaced businesses provide goods or services that otherwise could not be found within the trade area, either • under existing conditions or in the future with the proposed project?
Or, is any category of business to be displaced the subject of other regulations or publicly adopted plans to preserve, enhance, • or otherwise protect it?
(4) Indirect Business Displacement
Would the project potentially introduce trends that make it difficult for businesses to remain in the area?•
Would the project capture the retail sales in a particular category of goods to the extent that the market for such goods would • become saturated as a result, potentially resulting in vacancies and disinvestment on neighborhood commercial streets?
(5) Affects on Industry
Would the project significantly affect business conditions in any industry or any category of businesses within or outside the • study area?
Would the project indirectly substantially reduce employment or impair the economic viability in the industry or category of • businesses?
3. COmmUNITy FACILITIES: CEQR Technical Manual Chapter 6
(a) Would the project directly eliminate, displace, or alter public or publicly funded community facilities such as educational facilities, libraries, hospitals and other health care facilities, day care centers, police stations, or fire stations?
(b) Would the project exceed any of the thresholds outlined in Table 6-1 in Chapter 6?
(c) If ‘No’ was checked above, the remaining questions in this technical area do not need to be answered. If ‘Yes’ was checked, attach supporting information to answer the following, if applicable.
(1) Child Care Centers
Would the project result in a collective utilization rate of the group child care/Head Start centers in the study area that is • greater than 100 percent?
If Yes, would the project increase the collective utilization rate by 5 percent from the No-Action scenario?•
(2) Libraries
Would the project increase the study area population by 5 percent from the No-Action levels?•
If Yes, would the additional population impair the delivery of library services in the study area?•
(3) Public Schools
Would the project result in a collective utilization rate of the elementary and/or intermediate schools in the study area that is • equal to or greater than 105 percent?
If Yes, would the project increase this collective utilization rate by 5 percent from the No-Action scenario?•
(4) Health Care Facilities
Would the project affect the operation of health care facilities in the area?•
(5) Fire and Police Protection
Would the project affect the operation of fire or police protection in the area?•
4. OPEN SPACE: CEQR Technical Manual Chapter 7
(a) Would the project change or eliminate existing open space?
(b) Is the project located within an underserved area in the Bronx, Brooklyn, Manhattan, Queens, or Staten Island?
(c) If ‘Yes,’ would the proposed project generate more than 50 additional residents or 125 additional employees?
(d) Is the project located within a well-served area in the Bronx, Brooklyn, Manhattan, Queens, or Staten Island?
(e) If ‘Yes,’ would the project generate more than 350 additional residents or 750 additional employees?
( f ) If the project is not located within an underserved or well-served area, would it generate more than 200 additional residents or 500 additional employees?
(g) If ‘Yes’ to any of the above questions, attach supporting information to answer the following:Does the project result in a decrease in the open space ratio of more then 5%?•
If the project is within an underserved area, is the decrease in open space between 1% and 5%?•
If ‘Yes,” are there qualitative considerations, such as the quality of open space, that need to be considered?•

eas full form page 7
YES NO5. ShADOWS: CEQR Technical Manual Chapter 8
(a) Would the proposed project result in a net height increase of any structure of 50 feet or more?
(b) Would the proposed project result in any increase in structure height and be located adjacent to or across the street from a sunlight-sensitive resource?
(c) If ‘Yes’ to either of the above questions, attach supporting information explaining whether the project’s shadow reach any sunlight-sensitive resource at any time of the year.
6. hISTORIC AND CULTURAL RESOURCES: CEQR Technical Manual Chapter 9(a) Does the proposed project site or an adjacent site contain any architectural and/or archaeological resource that is eligible for, or
has been designated (or is calendared for consideration) as a New York City Landmark, Interior Landmark or Scenic Landmark; is listed or eligible for listing on the New York State or National Register of Historic Places; or is within a designated or eligible New York City, New York State, or National Register Historic District? If “Yes,” list the resources and attach supporting information on whether the proposed project would affect any of these resources.
7. URbAN DESIgN AND VISUAL RESOURCES: CEQR Technical Manual Chapter 10(a) Would the proposed project introduce a new building, a new building height, or result in any substantial physical alteration to the
streetscape or public space in the vicinity of the proposed project that is not currently allowed by existing zoning?
(b) Would the proposed project result in obstruction of publicly accessible views to visual resources that is not currently allowed by existing zoning?
(c) If “Yes” to either of the above, please provide the information requested in Chapter 10.8. NATURAL RESOURCES: CEQR Technical Manual Chapter 11
(a) Is any part of the directly affected area within the jamaica Bay Watershed? If “Yes”, complete the jamaica Bay Watershed Form.
(b) Does the proposed project site or a site adjacent to the project contain natural resources as defined in Section 100 of Chapter 11?If “Yes,” list the resources: Attach supporting information on whether the proposed project would affect any of these resources.
9. hAZARDOUS mATERIALS: CEQR Technical Manual Chapter 12(a) Would the proposed project allow commercial or residential use in an area that is currently, or was historically, a manufacturing
area that involved hazardous materials? (b) Does the proposed project site have existing institutional controls (e.g. (E) designations or a Restrictive Declaration) relating to
hazardous materials that preclude the potential for significant adverse impacts?(c) Does the project require soil disturbance in a manufacturing zone or any development on or near a manufacturing zone or
existing/historic facilities listed in Appendix 1 (including nonconforming uses)?(d) Does the project result in the development of a site where there is reason to suspect the presence of hazardous materials,
contamination, illegal dumping or fill, or fill material of unknown origin?(e) Does the project result in development where underground and/or aboveground storage tanks (e.g. gas stations) are or were on
or near the site?(f) Does the project result in renovation of interior existing space on a site with potential compromised air quality, vapor intrusion
from on-site or off-site sources, asbestos, PCBs or lead-based paint?(g) Does the project result in development on or near a government-listed voluntary cleanup/brownfield site, current or former power
generation/transmission facilities, municipal incinerators, coal gasification or gas storage sites, or railroad tracks and rights-of-way?(h) Has a Phase I Environmental Site Assessment been performed for the site?
If ‘Yes,” were RECs identified? Briefly identify:(i) Based on a Phase I Assessment, is a Phase II Assessment needed?
10. WATER AND SEWER INFRASTRUCTURE: CEQR Technical Manual Chapter 13(a) Would the project result in water demand of more than one million gallons per day?
(b) Is the proposed project located in a combined sewer area and result in at least 1,000 residential units or 250,000 SF or more of commercial space in Manhattan or at least 400 residential units or 150,000 SF or more of commercial space in the Bronx, Brooklyn, Staten Island or Queens?
(c) Is the proposed project located in a separately sewered area and result in the same or greater development than that listed in Table 13-1 in Chapter 13?
(d) Does the proposed project involve development on a site five acres or larger where the amount of impervious surface would increase?
(e) Would the proposed project involve development on a site one acre or larger where the amount of impervious surface would increase and is located within the jamaica Bay Watershed or in certain specific drainage areas including: Bronx River, Coney Island Creek, Flushing Bay and Creek, Gowanus Canal, Hutchinson River, Newtown Creek, or Westchester Creek?
(f) Would the proposed project be located in an area that is partially sewered or currently unsewered?
(g) Is the project proposing an industrial facility or activity that would contribute industrial discharges to a WWTP and/or generate contaminated stormwater in a separate storm sewer system?
(h) Would the project involve construction of a new stormwater outfall that requires federal and/or state permits?
(i) If “Yes” to any of the above, conduct the appopriate preliminary analyses and attach supporting documentation.11. SOLID WASTE AND SANITATION SERVICES: CEQR Technical Manual Chapter 14(a) Would the proposed project have the potential to generate 1000,000 pounds (50 tons) or more of solid waste per week? (b) Would the proposed project involve a reduction in capacity at a solid waste management facility used for refuse or recyclables
generated within the City?

eas full form page 8
YES NO12. eNeRGY: CEQR Technical Manual Chapter 15
(a) Would the proposed project affect the transmission or generation of energy?
13. TRANSPORTATION: CEQR Technical Manual Chapter 16
(a) Would the proposed project exceed any threshold identified in Table 16-1 in Chapter 16?
(b) If “Yes,” conduct the screening analyses, attach appropriate back up data as needed for each stage, and answer the following questions:
(1) Would the proposed project result in 50 or more Passenger Car Equivalents (PCEs) per project peak hour? If “Yes,” would the proposed project result in 50 or more vehicle trips per project peak hour at any given intersection? **It should be noted that the lead agency may require further analysis of intersections of concern even when a project generates fewer than 50 vehicles in the peakhour. See Subsection 313 in Chapter 16 for more information.
(2) Would the proposed project result in more than 200 subway/rail or bus trips per project peak hour? If “Yes,” would the proposed project result, per project peak hour, in 50 or more bus trips on a single line (in one direction) or 200 subway trips per station or line?
(3) Would the proposed project result in more than 200 pedestrian trips per project peak hour? If “Yes,” would the proposed project result in more than 200 pedestrian trips per project peak hour to any given pedestrian
or transit element, crosswalk, subway stair, or bus stop?
14. AIR QUALITy: CEQR Technical Manual Chapter 17
(a) Mobile Sources: Would the proposed project result in the conditions outlined in Section 210 in Chapter 17?
(b) Stationary Sources: Would the proposed project result in the conditions outlined in Section 220 in Chapter 17? If ‘Yes,’ would the proposed project exceed the thresholds in the Figure 17-3, Stationary Source Screen Graph? (attach
graph as needed)
(c) Does the proposed project involve multiple buildings on the project site?
(d) Does the proposed project require Federal approvals, support, licensing, or permits subject to conformity requirements?
(e) Does the proposed project site have existing institutional controls (e.g. E) designations or a Restrictive Declaration) relating to air quality that preclude the potential for significant adverse impacts?
(f) If “Yes,” conduct the appropriate analyses and attach any supporting documentation.
15. gREENhOUSE gAS EmISSIONS: CEQR Technical Manual Chapter 18
(a) Is the proposed project a city capital project, a power plant, or would fundamentally change the City’s solid waste management system?
(b) If “Yes,” would the proposed project require a GHG emissions assessment based on the guidance in Chapter 18?
(c) If “Yes,” attach supporting documentation to answer the following; Would the project be consistent with the City’s GHG reduction goal?
16. NOISE: CEQR Technical Manual Chapter 19
(a) Would the proposed project generate or reroute vehicular traffic?
(b) Would the proposed project introduce new or additional receptors (see Section 124 in Chapter 19) near heavily trafficked roadways, within one horizontal mile of an existing or proposed flight path, or within 1,500 feet of an existing or proposed rail line with a direct line of site to that rail line?
(c) Would the proposed project cause a stationary noise source to operate within 1,500 feet of a receptor with a direct line of sight to that receptor or introduce receptors into an area with high ambient stationary noise?
(d) Does the proposed project site have existing institutional controls (e.g. E-designations or a Restrictive Declaration) relating to noise that preclude the potential for significant adverse impacts?
(e) If “Yes,” conduct the appropriate analyses and attach any supporting documentation.
17. PUbLIC hEALTh: CEQR Technical Manual Chapter 20
(a) Would the proposed project warrant a public health assessment based upon the guidance in Chapter 20?
18. NEIghbORhOOD ChARACTER: CEQR Technical Manual Chapter 21
(a) Based upon the analyses conducted for the following technical areas, check Yes if any of the following technical areas required a detailed analysis: Land Use, Zoning, and Public Policy, Socioeconomic Conditions, Open Space, Historic and Cultural Resources, Urban Design and Visual Resources, Shadows, Transportation, Noise.
(b) If “Yes,” explain here why or why not an assessment of neighborhood character is warranted based on the guidance in Chapter 21, “Neighborhood Character.” Attach a preliminary analysis, if necessary.

19.1 CONSTRUCTION IMPACTS: CEQR Technical Manual Chapter2 Would the projects construction activities involve (check all that apply):
Construction activities lasting longer than two years:
Construction activities within a Central Business District or along an arterial or major thoroughfare:
EAS FULL FORM PAGE 9
YES NO
/
/ • Require closing, narrowing, or otherwise impeding traffic, transit or pedestrian elements (roadways, parking spaces, bicycle
routes, sidewalks, crosswalks, corners, etc): • Construction of multiple buildings where there is a potential for on-site receptors on buildings completed before the final
build-out: • The operation of several pieces of diesel equipment in a single location at peak construction:
• Closure of community facilities or disruption in its service:
• Activities within 400 feet of a historic or cultural resource: or
• Disturbance of a site containing natural resources.
/
I
I
I
I
I
If any boxes are checked, explain why or why not a preliminary construction assessment is warranted based on the guidance of in Chapter 22, "Construction." It should be noted that the nature and extent of any commitment to use the Best Available Technology for construction equipment or Best Management Practices for construction activities should be considered when making this determination.
The RWCDS for the Proposed Action identifies 8 projected development sites, which are are expected to accommodate new development. In addition, there are 3 potential development sites that are considered less likely to be developed over the 4 year analysis period with a full build-out by 2016. An analysis of construction impacts will be provided in the EIS.
20.1 APPLICANT'S CERTIFICATION
I swear or affirm under oath and subject to the penalties for perjury that the information provided in this Environmental Assessme
Statement (EAS) is true and accurate to the best of my knowledge and belief, based upon my personal knowledge and familiari
with the information described herein and after examination of pertinent books and records and/or after inquiry of persons who ha
personal knowledge of such information or who have examined pertinent books and records.
Still under oath, I further swear or affirm that I make this statement in my capacity as the
Aaron Klein of Forrest Lots, LLC
APPLtcANT/SP0NS0R
NAME THE ENTITY OR OWNER
the entity which seeks the permits, approvals, funding or other governmental action described in this EAS.
Check if prepared by: FVI APPLICANT/REPRESENTATIVE or LEAD AGENCY REPRESENTATIVE IFOR CITY-SPONSORED PROJECTSI
Mitchell Korbey, Legal Counsel, Herrick, Feinstein LLP
APPbCANT PONSOR NAME. LEAD AGENCY REPRESENTATIVE NAME.
_ DeewATE:

ATTACHMENT A
PROJECT DESCRIPTION

A-1
Rheingold Development Rezoning EAS
ATTACHMENT A: PROJECT DESCRIPTION
I. INTRODUCTION
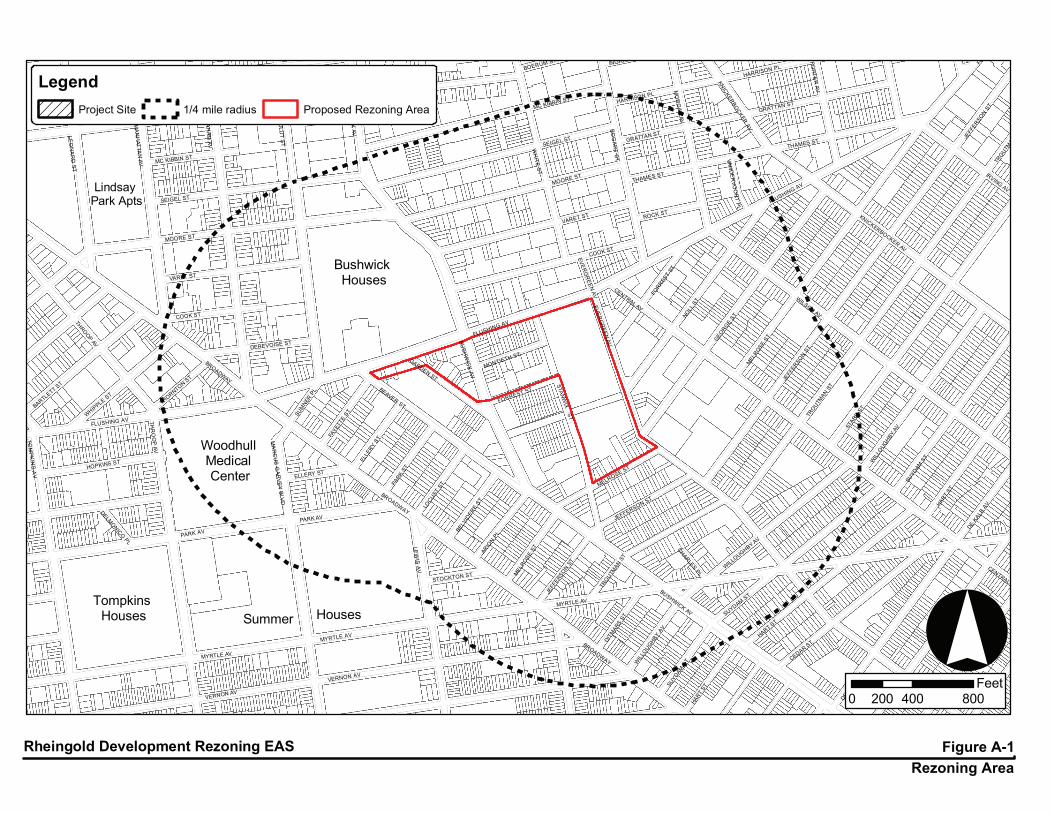
The applicant, Forrest Lots, LLC, is requesting zoning map and zoning text amendments affecting five full blocks and a portion of one block and a change in the official City map to map two new street segments in the Bushwick neighborhood of Brooklyn Community District 4 (collectively, the “Proposed Action”). The proposed rezoning action affects the area bounded by Flushing Avenue on the north and Melrose Street and Forrest Street on the south, between Evergreen Avenue and Garden, Stanwix and Beaver Streets (see Figure A-1). The applicant is proposing a rezoning of its owned properties within the rezoning area, which consists of all of Blocks 3140, 3141, and Block 3139 lots 18-21 and 23-36 and Block 3152 lots 1-3, 45, 48, 56, 58, 62-64, 66 and 100. In addition to the sites controlled by the applicant, the rezoning would also affect all of Block 3138, the remainder of the lots on Blocks 3139 and 3152 and lots 26 (portion), 49 (portion), 51 and 56 on Block 3137. The block zoned M3-1 would be rezoned to an M1-2 district and the blocks zoned M1-1 would be rezoned to R6A and R7A residential districts with a C2-4 commercial overlay mapped along portions of the Bushwick, Flushing and Evergreen Avenue frontages to a depth of 100 feet. The Proposed Action also includes a zoning text amendment, which modifies Section 23-922 of the NYC Zoning Resolution to make the appropriate R6A and R7A districts “Inclusionary Housing designated areas.” This will establish an inclusionary floor area ratio (FAR) bonus, providing opportunity and incentive for the development of affordable housing.
The proposed mapping action would map and formally bestow to the City the unbuilt section of Stanwix Street between Montieth Street and Forrest Street and the unbuilt section of Noll Street between Evergreen Avenue and Stanwix Street, thereby creating network connectivity by opening them to public traffic. In conjunction with this expanded network, new signage and other traffic control devices would be installed by the applicant and maintained by the New York City Department of Transportation.
The Proposed Action would facilitate a proposal by the applicant to develop ten residential buildings with ground floor local retail uses. The applicant intends to develop 32,273 zsf of local retail space and 881 dwelling units (DUs), 24 percent of which would be affordable to low-to-moderate-income households, per the Inclusionary Housing regulations (214 DUs) of which 47 units would be set aside for senior housing. However, for conservative analysis purposes, this environmental review will consider the reasonable worst-case development scenario (RWCDS) for the four applicant controlled projected development sites. Therefore, under the RWCDS, the applicant’s sites would result in a net increase of 54,182 zsf of local retail and 977 dwelling units, 20 percent of which are expected to be affordable to low-to moderate-income households (195 dwelling units), per the Inclusionary Housing Program. With the adoption of the Proposed Action, the proposed development is expected to be completed and occupied by 2016.
Four additional projected developments sites besides the applicant’s proposed development within the proposed rezoning area that could result in up to 99 DUs, of which 20 would be affordable, per the Inclusionary Housing regulations, and 27,609 zsf of ground floor retail on Block 3152, Lots 36, 37, 38, 41, 43; Block 3138, Lots 20, 22, 32; Block 3137, Lot 56. There are also 3 potential development sites (sites that are also rezoned but which are less likely to be developed), which will be discussed in detail in this section. The other lots in the proposed rezoning area are not expected to be redeveloped as a result of the Proposed Action within the 2016 analysis timeframe. The area to be rezoned from M3-1 to the more restricted M1-2 is also not expected to be redeveloped as a result of the Proposed Action. It should be
TROUTM
ANST
IRVING AV
JEFF
ERSONST
SUYDAM
ST
CENTRAL AV
DEKALB
AVHARTST
MY
WIL
LOUG
HBYAV
FLUSH
CEDAR ST
DEKA
LBAV EVERGREEN AV
DITM
ARS
ST
HART ST
HART
ST
SUYD
AMST
SUYDAMST
WIL
LOUGHBY
AV
VERNON AV
BROADWAY
MYRTLE AV
GEORGEST
JEFF
ERSONST
MEL
ROSEST
NOLLST
STARR
ST
TROUTM
ANST
GRATTAN ST
HARRISON PL
KNICKERBOCKER
AV
MO
RG
ANAV
POR
TER
AV
THAMES ST
VAN
DE
RVO
OR
TP
L
WILSON AV
ROCK ST
THAMES ST
CENTRAL AV
FLUSHING AV
FORRES
TST
KNICKERBOCKER AV
CHARLESPL
ARIO
NPL
BUSHWICK AV
JEFF
ERSONST
JEFFERSON ST
MEL
ROSE
ST
MELROSE ST
TRO
UTMAN
ST
WILLOUGHBY AV
FLUSHING AV
COOK ST
EVERG
REEN
AV
MOORE ST
VARET ST
BUS
HW
ICK
AV
EVERG
REEN
AV
STANWIX
ST
BOERUM ST
BOG
AR
TS
T
BUS
HW
ICK
AV
GRATTAN ST
HARRISON PL
INGRAHAM ST
MC KIBBIN ST
SEIGEL ST
WH
ITES
T
LOCUST
ST
LEW
ISA
V
STOCKTON ST
BELV
IDER
EST
FORREST ST
GARDEN ST
MONTIETH ST
FAYET
TEST
ELLERY ST
MA
RC
US
GA
RV
EY
BLV
D
PARK AV
BEAVER ST
BROADWAY
ELLE
RYST
PARK
ST
SUM
NERPL
BOERUM ST
GR
AH
AMAV
HU
MB
OLD
TS
T
JOHNSON AV
MA
NH
ATTAN
AV MC KIBBIN ST
MOORE ST
SEIGEL ST
THR
OO
PAV
BROADWAY
COOK ST
DEBEVOISE ST
FLUSHING AV
THORNTON ST
THROOPAV
PARK AV
TOM
PK
INS
AV
MYRTLE AV
MYRTLE AV
VERNON AV
LEO
NA
RD
ST
VARET ST
HOPKINS ST
BARTLETT ST
WHIPPLE ST
DELMONICOPL
Rheingold Development Rezoning EAS Figure A-1Rezoning Area
LegendProject Site 1/4 mile radius Proposed Rezoning Area
°
LindsayPark Apts
WoodhullMedicalCenter
TompkinsHouses Summer Houses
BushwickHouses
0 400 800200Feet

Rheingold Development Rezoning EAS Attachment A: Project Description.
A-2
noted that M1-2 districts permit applications for special permits, whereas M3-1 districts do not. Therefore, overall, the Proposed Action would result in an incremental increase of approximately 1,076 DUs, of which 215 would be affordable, per the Inclusionary Housing regulations, and approximately 74,194 zsf of local retail by 2016. As part of the Proposed Action, the portion of Stanwix Street between Montieth Street and Forrest Street and the portion of Noll Street between Stanwix Street and Evergreen Avenue would become mapped streets to complete the street network around the project site and reconnect the existing neighborhoods with the proposed development sites.
II. EXISTING CONDITIONS The decline of the New York City industrial/manufacturing sector during the past three decades has left many properties in this part of Brooklyn vacant or underutilized. While the industrial sector has declined, residential populations in adjacent communities have substantially increased, leading to greater housing demand.
These trends of previous growth and then subsequent decline of the industrial sector are evident in the historic uses of the proposed rezoning area. Historic Sanborn maps indicate that in 1898 a portion of projected development site 2 was occupied by the Claus Lipsius Brewery. The rest of the projected and potential development sites were occupied by residential buildings. Later, in 1908, a factory occupied projected development site 3 although the area remained dominated by breweries and residential uses. Also in the early 1900’s, Block 3140, currently occupied by the warehouse, used to house the S. Liebmans Sons Brewery in three separate blocks. More recently, in 1995, the warehouse on Block 3152 was used for beer storage and shipping, this was the last brewery related use in the area, the warehouse has since been retrofitted for wholesale business use. As shown in Figure A-1, the proposed rezoning area is bounded by Flushing Avenue, Evergreen Avenue, Melrose Avenue, Stanwix Street, Forrest Street, Garden Street, and Beaver Street. It includes approximately 6 blocks, which encompass a total of approximately 623,080 sf. Table A-1 provides a list of all the blocks and lots included within the proposed rezoning area. The 8 projected and 3 potential development sites are shown in Figure A-1. Table A-2 shows the existing use of the projected and potential development sites. The majority of the projected development sites are vacant or utilized as vehicle storage. There are 8 businesses located on the projected development sites with a total of 46 employees. These businesses include industrial/warehouse uses, vehicle storage, auto repair, a gas station, and food market. As shown in the table, projected development sites 1-4 are owned by the applicant. TABLE A‐1 List of Block and Lots Included Within the Proposed Rezoning Area
Block Lots
3137 26 (portion), 49 (portion), 51, 56
3138 1, 7, 9, 10, 11, 13, 17, 18, 20, 22, 23, 24, 25, 27, 32, 36, 38, 40, 41
3139 1, 2, 3, 4, 5, 6, 7, 8, 9, 10, 11, 12, 15, 16, 17, 18*, 19*, 20*, 21*, 23*, 24*, 25*, 26*, 27*, 28*, 29*, 30*, 31*, 32*, 33*, 34*, 35*, 36*
3140* 1, 50
3141* 1, 5, 6, 7, 8, 10, 11, 12, 14, 15, 18, 20, 21, 22, 23, 36
3152 1*, 2*, 3*, 35, 36, 37, 38, 41, 43, 44, 45*, 48*, 56*, 58*, 62*, 63*, 64*, 66*, 100* Notes: * Lots owned by the applicant

Table A‐2
Projected and Potential Development Sites Existing Land Use and Zoning
Site No. Block Lot Address Land Use Category Zoning
Lot Area
(sf)
Gross Floor
Area
No.
Bldg.
No.
Stories
Residential
(sf)
Dwelling
Units
Commercial
(sf)
Industrial/
Warehouse
(sf)
Vacant
Land
Build
FAR
Applicant Owned Projected Development Sites
Projected 1 3139 18 902 Flushing Ave. Vehicle Storage/Parking Lot M1‐1 1,450 0 0 0 0 0 0 0 0 0.00
19 904 Flushing Ave. Vehicle Storage/Parking Lot M1‐1 2,060 0 0 0 0 0 0 0 0 0.00
20 906 Flushing Ave. Vehicle Storage/Parking Lot M1‐1 2,050 0 0 0 0 0 0 0 0 0.00
21 908 Flushing Ave. Vehicle Storage/Parking Lot M1‐1 2,050 0 0 0 0 0 0 0 0 0.00
23 Montieth St. Vehicle Storage/Parking Lot M1‐1 1,875 0 0 0 0 0 0 0 0 0.00
24 35 Montieth St. Vehicle Storage/Parking Lot M1‐1 1,875 0 0 0 0 0 0 0 0 0.00
25 Montieth St. Vehicle Storage/Parking Lot M1‐1 1,875 0 0 0 0 0 0 0 0 0.00
26 31 Montieth St. Vehicle Storage/Parking Lot M1‐1 2,500 0 0 0 0 0 0 0 0 0.00
27 29 Montieth St. Vehicle Storage/Parking Lot M1‐1 1,600 0 0 0 0 0 0 0 0 0.00
28 27 Montieth St. Vehicle Storage/Parking Lot M1‐1 1,833 0 0 0 0 0 0 0 0 0.00
29 25 Montieth St. Vehicle Storage/Parking Lot M1‐1 1,833 0 0 0 0 0 0 0 0 0.00
30 23 Montieth St. Vehicle Storage/Parking Lot M1‐1 1,833 0 0 0 0 0 0 0 0 0.00
31 21 Montieth St. Vehicle Storage/Parking Lot M1‐1 2,500 0 0 0 0 0 0 0 0 0.00
32 19 Montieth St. Vehicle Storage/Parking Lot M1‐1 2,500 0 0 0 0 0 0 0 0 0.00
33 17 Montieth St. Vehicle Storage/Parking Lot M1‐1 2,500 0 0 0 0 0 0 0 0 0.00
34 15 Montieth St. Vehicle Storage/Parking Lot M1‐1 1,875 0 0 0 0 0 0 0 0 0.00
35 13 Montieth St. Vehicle Storage/Parking Lot M1‐1 1,875 0 0 0 0 0 0 0 0 0.00
36 11 Montieth St. Vehicle Storage/Parking Lot M1‐1 1,875 0 0 0 0 0 0 0 0 0.00
Total 35,959 0 0 N.A. 0 0 0 0 0 0.00
Projected 2 3141 1 501 Bushwick Ave. Vacant Land M1‐1 12,252 0 0 0 0 0 0 0 12,252 0.00
5 489 Bushwick Ave. Vacant Land M1‐1 1,775 0 0 0 0 0 0 0 1,775 0.00
6 485 Bushwick Ave. Vehicle Storage/Parking Lot M1‐1 1,775 0 0 0 0 0 0 0 0 0.00
7 483 Bushwick Ave. Vacant Land M1‐1 1,760 0 0 0 0 0 0 0 1,760 0.00
8 479 Bushwick Ave. Industrial M1‐1 1,730 1,235 1 0 0 0 0 1,235 0 0.71
10 10 Montieth St. Vacant Land M1‐1 2,500 0 0 0 0 0 0 0 2,500 0.00
11 12 Montieth St. Vacant Land M1‐1 2,500 0 0 0 0 0 0 0 2,500 0.00
12 14 Montieth St. Vacant Land M1‐1 2,810 0 0 0 0 0 0 0 2,810 0.00
14 18 Montieth St. Vacant Land M1‐1 2,620 0 0 0 0 0 0 0 2,620 0.00
15 20‐24 Montieth St. Vacant Land M1‐1 7,500 0 0 0 0 0 0 0 7,500 0.00
18 Montieth St. Vacant Land M1‐1 3,750 0 0 0 0 0 0 0 3,750 0.00
20 Montieth St. Vacant Land M1‐1 3,750 0 0 0 0 0 0 0 3,750 0.00
21 32 Montieth St. Vacant Land M1‐1 2,500 0 0 0 0 0 0 0 2,500 0.00
22 34 Montieth St. Vacant Land M1‐1 2,500 0 0 0 0 0 0 0 2,500 0.00
23 36 Montieth St. Vacant Land M1‐1 24,300 0 0 0 0 0 0 0 24,300 0.00
36 15 Forrest St. Vacant Land M1‐1 10,200 0 0 0 0 0 0 0 10,200 0.00
Total 84,222 1,235 1 N.A. 0 0 0 1,235 80,717 0.71
Projected 3 3152 3 1 80 Evergreen Ave Industrial/Warehouse M1‐1 74,900 77,680 2 1 0 0 0 77,680 0 1.04
Projected 4 3152 1 28‐32 Stanwix St Vacant Land M1‐1 1,348 0 0 0 0 0 0 0 1,348 0.00
2 Stanwix St Vacant Land M1‐1 2,068 0 0 0 0 0 0 0 2,068 0.00
3 1 80 Evergreen Ave Vacant Land M1‐1 23,115 0 0 0 0 0 0 0 23,115 0.00
45 127 Melrose St Vacant Land M1‐1 2,500 0 0 0 0 0 0 0 2,500 0.00
48 123 Melrose St Vacant Land M1‐1 10,050 0 0 0 0 0 0 0 10,050 0.00
56 109 Melrose St Vehicle Storage/Parking Lot M1‐1 2,500 0 0 0 0 0 0 0 0 0.00
58 107 Melrose St Vehicle Storage/Parking Lot M1‐1 5,000 0 0 0 0 0 0 0 0 0.00
62 Melrose St Vehicle Storage/Parking Lot M1‐1 2,500 0 0 0 0 0 0 0 0 0.00
63 97 Melrose St Vehicle Storage/Parking Lot M1‐1 1,975 0 0 0 0 0 0 0 0 0.00
64 95 Melrose St Vehicle Storage/Parking Lot M1‐1 2,135 0 0 0 0 0 0 0 0 0.00
66 Melrose St Vehicle Storage/Parking Lot M1‐1 2,050 0 0 0 0 0 0 0 0 0.00
100 856 Stanwix Vacant Land M1‐1 17,500 0 0 0 0 0 0 0 17,500 0.00
Total 72,741 0 0 N.A. 0 0 0 0 56,581 0.00
Projected Development Sites
Projected 5 3152 36 96 Evergreen Ave Vacant Land M1‐1 1,865 0 0 0 0 0 0 0 1,865 0.00
37 98 Evergreen Ave Vacant Land M1‐1 2,200 0 0 0 0 0 0 0 2,200 0.00
380‐108 Evergreen Ave Vacant Land M1‐1 2,400 0 0 0 0 0 0 0 2,400 0.00
41 Evergreen Ave Vacant Land M1‐1 790 0 0 0 0 0 0 0 790 0.00
43 Melrose St Vacant Land M1‐1 2,500 0 0 0 0 0 0 0 2,500 0.00
Total 9,755 0 0 N.A. 0 0 0 0 9,755 0.00
Projected 6 3138 20 846 Flushing Ave Automotive Repair M1‐1 3,300 1,000 1 1 0 0 0 1,000 0 0.00
22 848 Flushing Ave Automotive Repair M1‐1 2,275 0 0 0 0 0 0 0 0 0.00
Total 5,575 1,000 1 N.A. 0 0 0 1,000 0 0.00
Projected 7 3138 32 860 Flushing Ave Gas Station M1‐1 10,600 1,596 1 1 0 0 1,596 0 0 0.15
Projected 8 3137 56 832 Flushing Ave Commercial/Supermarket M1‐1 6,550 6,000 1 1 0 0 6,000 0 0 0.92
Projected Sites Total 300,302 87,511 6 N.A. 0 0 7,596 79,915 147,053 2.82
Potential Development Sites
Potential 9 3152 44 131 Melrose St. Industrial M1‐1 2,500 3,400 1 2 0 0 0 3,400 0 1.36
Potential 10 3138 11 31 Garden St. Residential M1‐1 4,000 2,475 1 3 2,475 9 0 0 0 0.62
Potential 11 3137 51 818 Flushing Ave. Commercial M1‐1 2,880 2,880 1 1 0 0 2,880 0 0 1.00
Notes:
1 Projected development site 3 comprises an approximately 74,900 sf portion of Lot 3, which occupies 98,015 sf in its entirety.
Rheingold Development Rezoning EAS Attachment A: Project Description.
A-3
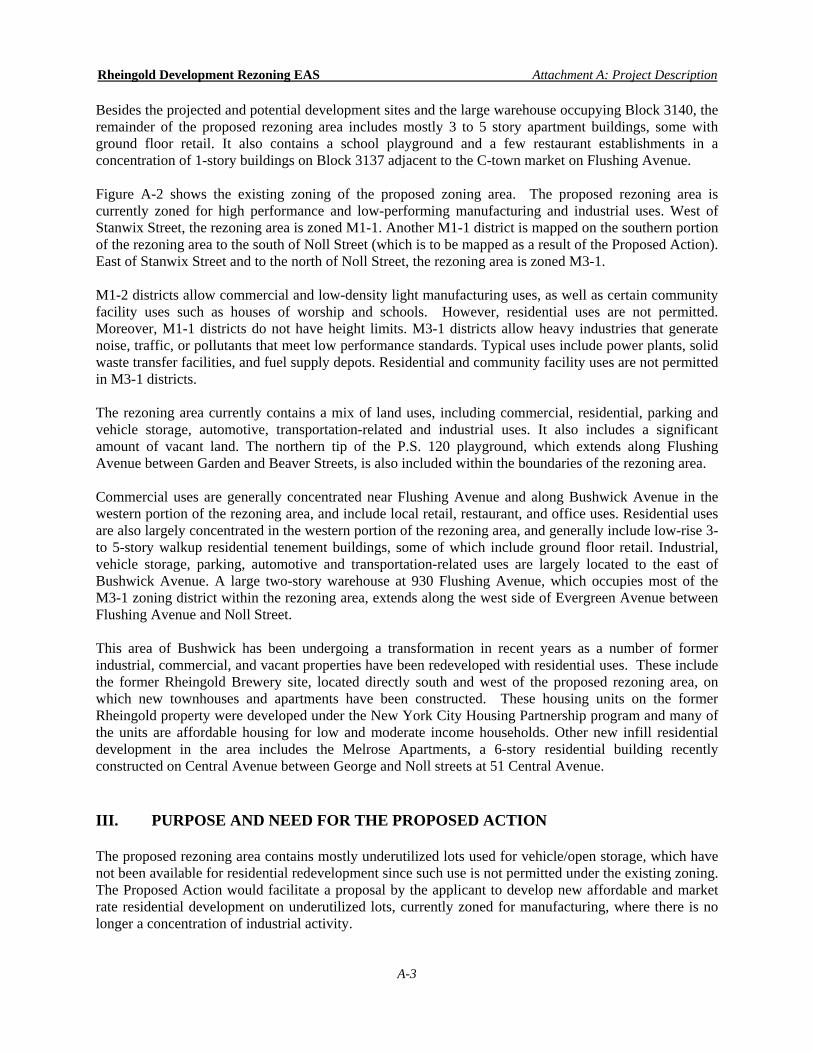
Besides the projected and potential development sites and the large warehouse occupying Block 3140, the remainder of the proposed rezoning area includes mostly 3 to 5 story apartment buildings, some with ground floor retail. It also contains a school playground and a few restaurant establishments in a concentration of 1-story buildings on Block 3137 adjacent to the C-town market on Flushing Avenue. Figure A-2 shows the existing zoning of the proposed zoning area. The proposed rezoning area is currently zoned for high performance and low-performing manufacturing and industrial uses. West of Stanwix Street, the rezoning area is zoned M1-1. Another M1-1 district is mapped on the southern portion of the rezoning area to the south of Noll Street (which is to be mapped as a result of the Proposed Action). East of Stanwix Street and to the north of Noll Street, the rezoning area is zoned M3-1. M1-2 districts allow commercial and low-density light manufacturing uses, as well as certain community facility uses such as houses of worship and schools. However, residential uses are not permitted. Moreover, M1-1 districts do not have height limits. M3-1 districts allow heavy industries that generate noise, traffic, or pollutants that meet low performance standards. Typical uses include power plants, solid waste transfer facilities, and fuel supply depots. Residential and community facility uses are not permitted in M3-1 districts. The rezoning area currently contains a mix of land uses, including commercial, residential, parking and vehicle storage, automotive, transportation-related and industrial uses. It also includes a significant amount of vacant land. The northern tip of the P.S. 120 playground, which extends along Flushing Avenue between Garden and Beaver Streets, is also included within the boundaries of the rezoning area. Commercial uses are generally concentrated near Flushing Avenue and along Bushwick Avenue in the western portion of the rezoning area, and include local retail, restaurant, and office uses. Residential uses are also largely concentrated in the western portion of the rezoning area, and generally include low-rise 3-to 5-story walkup residential tenement buildings, some of which include ground floor retail. Industrial, vehicle storage, parking, automotive and transportation-related uses are largely located to the east of Bushwick Avenue. A large two-story warehouse at 930 Flushing Avenue, which occupies most of the M3-1 zoning district within the rezoning area, extends along the west side of Evergreen Avenue between Flushing Avenue and Noll Street.
This area of Bushwick has been undergoing a transformation in recent years as a number of former industrial, commercial, and vacant properties have been redeveloped with residential uses. These include the former Rheingold Brewery site, located directly south and west of the proposed rezoning area, on which new townhouses and apartments have been constructed. These housing units on the former Rheingold property were developed under the New York City Housing Partnership program and many of the units are affordable housing for low and moderate income households. Other new infill residential development in the area includes the Melrose Apartments, a 6-story residential building recently constructed on Central Avenue between George and Noll streets at 51 Central Avenue.
III. PURPOSE AND NEED FOR THE PROPOSED ACTION The proposed rezoning area contains mostly underutilized lots used for vehicle/open storage, which have not been available for residential redevelopment since such use is not permitted under the existing zoning. The Proposed Action would facilitate a proposal by the applicant to develop new affordable and market rate residential development on underutilized lots, currently zoned for manufacturing, where there is no longer a concentration of industrial activity.

GEORGE
ST
MEL
ROSEST
NOLLST
FORRES
TST
CHAR
JEFFERSON ST
MELROSE ST
FLUSHING AV
COOK ST
VARET
BUSH
WIC
KAV
EVERG
REEN
AV
STANW
IX ST
LOCUST
ST
LEW
BELV
IDER
EST
FORREST ST
MONTIETH ST
FAYE
TTE
ST
ELLERY ST
MAR
CU
SG
AR
VEY
BLVD
PARK AV
BEAVER ST
BROADWAY
ELLE
RYST
PARK
ST
SUM
NERPL
R6
R6
M3-1
R6M1-1
C4-3R7-2
M1-1
M1-2
M1-1
M1-1
C8-2
Rheingold Development Rezoning EAS Figure A-2Existing Zoning
LegendProposed Rezoning Area
Existing Zoning Districts
°l
0 300 600 900150Feet
GARDEN ST
CENTRAL AV

Rheingold Development Rezoning EAS Attachment A: Project Description.
A-4
The existing low-density M1-1 zoning designations in the rezoning area would be replaced with contextual medium-density R6A and R7A residential zoning districts, which would allow residential development. The proposed rezoning area is located adjacent to an existing R7-2 zoning district to west of Stanwix Street and an existing R6 zoning district to north of Flushing Avenue. The Proposed Action would bring into compliance 23 noncompliant existing residential uses with approximately 172 DUs, located within the M1-2 manufacturing district along Evergreen Avenue, Flushing Avenue, Garden Street, and Bushwick Avenue within the rezoning area. In order to incentivize the creation of affordable housing, the Proposed Action would designate the proposed zoning districts as Inclusionary Housing designated areas. With the rezoning to residential in most of the M1-1 zone, the mapping of the M1-2 district in place of the M3-1 district on Block 3140 would provide a more appropriate zoning designation for an area adjacent to residential zoning districts where existing uses are expected to remain. M1 districts often function as buffer zones between residential and heavy manufacturing uses such as those found in M3 zones. M3 zones permit heavy manufacturing uses while M1-2 zones permit light manufacturing and commercial uses. M1-2 districts also permit certain large retail uses, and community facility uses, by City Planning Commission special permit, whereas M3-1 districts do not. In addition, the proposed M1-2 district would be an extension of the existing M1-2 zoning district located just north of the rezoning area, across Flushing Avenue. Uses on Block 3140 (warehousing) would conform to the M1 designation.
The proposed mapping action would connect the neighborhoods to the east and west of the project site. New access to the existing and proposed housing on Stanwix Street, Forrest Street and Noll Street would be provided through the proposed Stanwix Street extension. New sidewalks and streets would connect the proposed new neighborhood with neighborhoods to the east and allow for pedestrian and vehicle use. In addition, new infrastructure to support the existing and proposed developments can be placed in the newly mapped public streets. IV. THE PROPOSED ACTION
In the Proposed Action area, the existing light manufacturing zoning designation would be changed to permit residential uses and the existing heavy manufacturing zoning would be changed to light manufacturing zoning. The existing M3-1 zoning is a heavy manufacturing use district, which permits use groups 5-18 as-of-right and has a maximum floor area ratio (FAR) of 2.0. The existing M1-1 zoning is a light manufacturing use district, which permits use groups 5-14, 16 and 17 as-of-right and has a maximum FAR of 1.0. This light manufacturing district usually acts as a buffer between M2 and M3 heavy manufacturing districts and adjacent residential or commercial districts. Figure A-3 illustrates the proposed zoning designations, and the following provides a more detailed discussion of the zoning changes. Table A-3 below summarizes the key bulk controls regulations for the proposed zoning districts. A section of the M1-1 zoning would be replaced with R6A zoning on Blocks 3137 and 3138 as well as on the midblock of Block 3141 and the western portion of Block 3152. R6A is a contextual residential district, which permits use groups 1-4 as-of-right and has a maximum FAR of 3.0 (2.7 to 3.6 with an Inclusionary Housing bonus). This zoning restricts building height to a maximum of 70 feet.

R7A
GEORGE
ST
MEL
ROSEST
NOLLST
R
CENTRAL AV
FORRES
TST
CHAR
ARIO
NPL
JEFFERSON ST
MELROSE ST
FLUSHING AV
COOK ST
VARET
BUSH
WIC
KAV EVER
GR
EEN AV
STANW
IX ST
LOCUST
ST
LEW
BELV
IDER
EST
FORREST ST
GARDEN ST
FAYE
TTE
ST
ELLERY ST
MAR
CU
SG
AR
VEY
BLVD
PARK AV
BEAVER ST
BROADWAY
ELLE
RYST
PARK
ST
SUM
NERPL
MONTIETH ST
R6
R6
M3-1
R6M1-1
C4-3R7-2
M1-2
M1-1
M1-1
C8-2
Rheingold Development Rezoning EAS Figure A-3Proposed Zoning
LegendProposed Zoning
Existing Zoning Districts
°
R6A
M1-2
R6A
R6A
0 300 600 900150Feet
R7A
C2-4 Overlay
C1-2 Overlay
C2-5 Overlay

Rheingold Development Rezoning EAS Attachment A: Project Description.
A-5
TABLE A‐3 Summary of Proposed Zoning Districts and Regulations
District Maximum FAR Streetwall (Min. base height/ Max. base Height
Maximum Building Height
Proposed R6A
Residential: 3.0 (2.7 to 3.6 FAR with Inclusionary Housing) Community Facility: 3.0 Commercial (when mapped with C2‐4 overlay): up to 2.0
40 feet min. 60 feet max.
70 feet
Proposed R7A
Residential: 4.0 (3.45 to 4.6 FAR with Inclusionary Housing) Community Facility: 4.0 Commercial (when mapped with C2‐4 overlay): up to 2.0
40 feet min. 65 feet max.
80 feet
Proposed M1‐2
Community Facility: 4.8 Commercial/manufacturing: 2.0
Max. base height of 60 feet or four stories, whichever is less.
Controlled by sky exposure plane.
The M1-1 zoning on Block 3139 would be replaced by an R7A district along the Flushing Avenue, Bushwick Avenue, Stanwix Street, and a portion of the Montieth Street frontages. An R6A district would also be mapped on Block 3139 along Montieth Street at a depth of 100 feet. Another part of the M1-1 zoning would be replaced with R7A zoning on the majority of Block 3139. An R7A district would replace the M1-1 zoning along the Evergreen Avenue, Stanwix Street, and Noll Street frontages of Block 3152 and the Stanwix Street and Bushwick Avenue frontages of Block 3141, all to a depth of 100 feet. R7A is also a contextual residential district, which also permits use groups 1-4 as-of-right but has a higher FAR than the R6A district with a maximum FAR of 4.0 (3.45 to 4.6 with an Inclusionary Housing bonus). This zoning district restricts building height to a maximum of 80 feet.
A C2-4 commercial overlay would be mapped on the Proposed Action area blocks that have frontage on Flushing Avenue, Bushwick Avenue and a portion of Garden Street and Evergreen Avenue to a depth of 100 feet. The C2-4 commercial overlay permits certain commercial uses on the first two floors with a maximum FAR of 2.0, when mapped in R6 and R7 districts. C2-4 commercial districts are mapped close to the Proposed Action area on Bushwick Avenue, Melrose Street and Beaver Street.
The M3-1 zoning on Block 3140 would be replaced with an M1-2 light manufacturing district, which, allows use groups 5-14, 16 and 17 as-of-right and has a maximum FAR of 2.0. The M1-2 zoning light manufacturing district would be an appropriate buffer zoning district between the heavier industrial M3-1 zoning district to the east and the proposed R6A and R7A residential districts to the west and south. As shown in Figure A-3, the proposed rezoning area is adjacent to an existing R7-2 district located west of Stanwix Street and an R6 district south of Jefferson Street, one block from the project site; therefore, the proposed rezoning would extend residential zoning with a similar district (R7A, R6A) onto an additional four and a quarter block area. As also shown in the zoning figures, the proposed C2-4 commercial overlay district along the Bushwick, Flushing and Evergreen Avenue frontages of Blocks 3137, 3138, 3139, 3141 and 3152 would extend the existing C2-4 overlay districts along Bushwick Avenue, immediately to the south of the rezoning area, and be similar to C1-3 overlay districts mapped along Central Avenue on the west side, between Troutman Street and Willoughby Avenue and on the east side between Starr Street and Dekalb Avenue.

Rheingold Development Rezoning EAS Attachment A: Project Description.
A-6
V. REASONABLE WORST-CASE DEVELOPMENT SCENARIO (RWCDS)
In order to assess the possible effects of the Proposed Action, a reasonable worst-case development scenario was established for both the current zoning (Future No-Action) and proposed zoning (Future With-Action) conditions projected to the build year of 2016. The incremental difference between the Future No-Action and Future With-Action conditions are the basis of the impact category analyses of this Environmental Assessment Statement. To determine the With-Action and No-Action conditions, standard methodologies have been used following the CEQR Technical Manual guidelines employing reasonable assumptions. These methodologies have been used to identify the amount and location of future development, as discussed below. Development Site Criteria In projecting the amount and location of new development, several factors have been considered in identifying likely development sites. These include known development proposals, past development trends, and the development site criteria described below. Generally, for an area-wide rezoning, new development can be expected to occur on selected, rather than all, sites within the rezoning area. The first step in establishing the development scenario was to identify those sites where new development could reasonably occur. Development sites were identified based on the following criteria:
Lots located in areas where an increase in permitted Floor Area Ratio (FAR) is proposed; AND
with a total lot size greater than or equal to approximately 2,500 square feet (including potential assemblages totaling 2,500 square feet or more if assemblage seems probable); AND
constructed to less than half of the FAR allowed by the proposed zoning.
Vacant, partially vacant and underutilized buildings that have not been recently improved.
Auto-related uses including: parking lots, auto repair shops and gas stations. The development scenario's universe of sites was further refined by eliminating sites with the following conditions:
Schools (public and private), municipal libraries, government offices, community gardens, and houses of worship.
Recent major investment, including new construction, conversion, or renovation.
Buildings with six or more residential units, due to required relocation of tenants in rent-stabilized units.
Buildings within the historic district which, under advisement from the Landmarks Preservation Commission (LPC), could not be demolished or receive significant enlargements.

Rheingold Development Rezoning EAS Attachment A: Project Description.
A-7
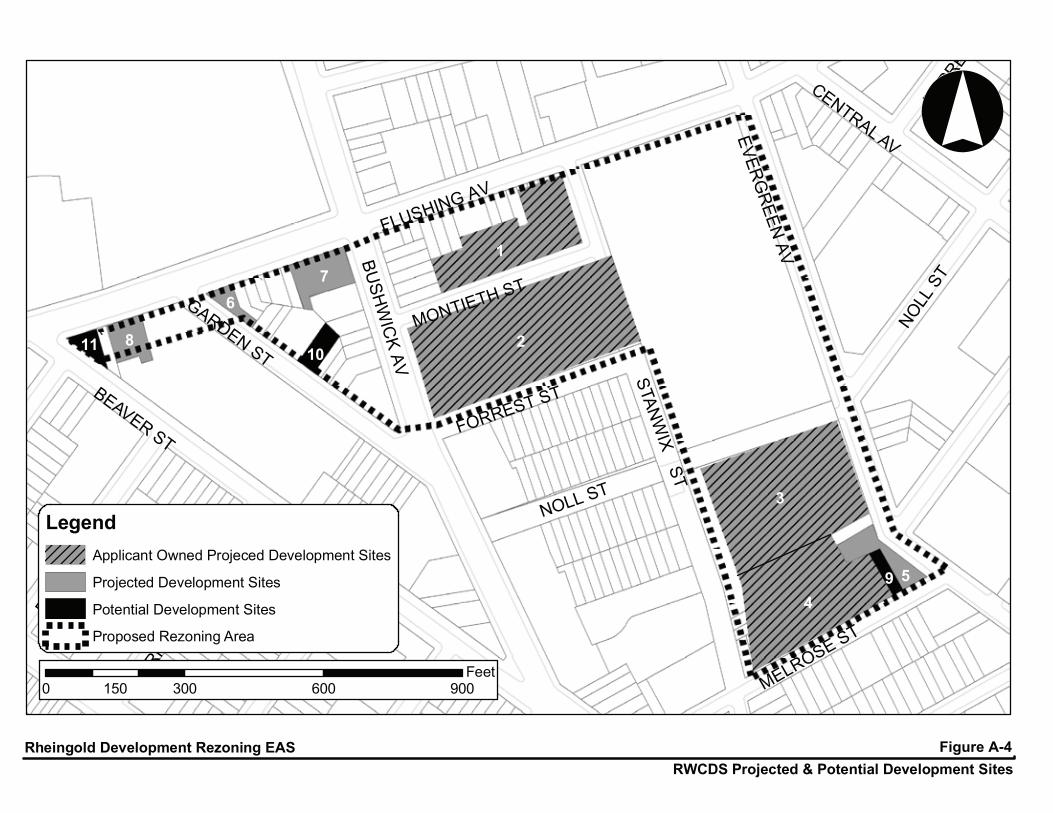
Definition of Projected and Potential Development To produce a reasonable, conservative estimate of future growth, the development sites were further divided into two categories - projected development sites and potential development sites. The projected development sites are considered more likely to be developed within the analysis period (build year 2016) because of known development plans for such sites, their relatively low FAR and current utilization, and relatively large size. Potential sites are considered less likely to be developed over the same period because of their relatively higher FARs, existing utilization, and generally more cumbersome means of development. This Environmental Assessment Statement assesses both density-related and site specific potential impacts from the development on all projected development sites. Density-related impacts are dependent on the amount and type of development projected on a site and the resulting impact on traffic, air quality, community facilities, and open space. Site specific impacts relate to individual site conditions and are not dependent on the density of projected development. Site specific impacts include potential noise impacts from development, and the possible presence of hazardous materials. Development is not anticipated on the potential development sites by the build year; therefore, these sites have not been included in the density-related impact assessments. However, specific review of site specific impacts for these sites has been conducted in order to ensure a conservative analysis. Eleven development sites (8 projected and 3 potential) have been identified in the rezoning area. Figure A-4 shows these projected and potential development sites, and Table A-4 at the end of this attachment identify the uses expected to occur on each of those sites under future No-Action and future With-Action conditions. Table A-5 below provides a summary of the RWCDS for each analysis scenario. The Future Without the Proposed Action (No-Action Conditions) Within the proposed rezoning area, little change in manufacturing development has occurred over the last two decades, even with the presence of available vacant sites. Absent the Proposed Action, it is projected that no new development would occur on the projected and potential development sites and existing uses are expected to remain. The Future With the Proposed Action (With-Action Conditions) Defining the Reasonable Worst Case Development Scenario for Environmental Analysis The Proposed Action would allow for the development of new uses and higher densities at the projected and potential development sites. In the future with the Proposed Action, it is expected that a total of approximately 1,076 dwelling units and 74,194 zsf (net) of local retail Table A-5 below provides a summary of the RWCDS (increment) for projected development sites. Detailed information on the RWCDS for each of the 8 projected development sites, as well as the 3 potential development sites, is provided in Table A-4. The reasonable worst-case development scenarios defined above represent the upper bounds of residential, retail, and parking uses for the purposes of impact analysis.
CENTRAL AV
FORRES
T
MELROSE ST
FLUSHING AV
STANW
IXST
FORREST ST
GARDEN ST
MONTIETH ST
BEAVER ST
ELLE
RYST
PARK
ST
Rheingold Development Rezoning EAS Figure A-4RWCDS Projected & Potential Development Sites
°
LegendApplicant Owned Projeced Development Sites
Projected Development Sites
Potential Development Sites
Proposed Rezoning Area
0 300 600 900150Feet
1
2
3
45
67
8
9
1011
EVERG
REEN
AVBUSH
WIC
K AV
NOLL ST
NOLL S
T

Rheingold Development Rezoning EAS Attachment A: Project Description.
A-8
Table A‐5: Summary of RWCDS (Increment)
Site Residential (zsf) DUs Inclusionary
DUs Retail (zsf) Accessory Parking Spaces
1* 132,290 132 26 16,058 60 2* 326,426 326 65 17,010 150 3* 299,149 300 60 17,960 137 4* 219,134 219 44 3,154 103
5 36,581 37 7 8,292 16 6 15,331 15 3 4,739 7 7 29,150 29 6 7,414 14 8 18,013 18 4 ‐433 8
TOTAL 1,076,074 1,076 215 74,194 495
*Applicant’s site A total of 3 other sites were considered less likely to be developed within the foreseeable future, and were thus considered potential development sites (Table A-4). The potential sites are deemed less likely to be developed because they did not closely meet the criteria listed above. However, as discussed above, the analysis recognizes that a number of potential sites could be developed under the Proposed Action in lieu of one or more of the projected sites in accommodating the development anticipated in the RWCDS. The potential sites are therefore also addressed in the EAS for site-specific effects. As such, the environmental impact statement document will analyze the projected developments for all technical areas of concern and also evaluate the effects of the potential developments for site-specific effects such as shadows, hazardous materials, air quality, and noise. Project Site The proposal by the applicant consists of approximately 977 units and 54,182 zsf of retail contained in ten residential and mixed-use buildings. Twenty percent of the units would be affordable (195 units), 47 of which would be set aside for senior housing. However, for conservative analysis purposes, the 47 senior units will be analyzed as typical affordable units. The height of the applicant’s proposed developments is expected to be 4 stories for the low rise building facing Forrest Street, 5-7 stories for the buildings facing local streets (Montieth St., Stanwix St., Noll St. and Melrose St.) and 7-8 stories for the apartment buildings facing major avenues (Bushwick Av. and Evergreen Av.). However, for conservative analysis purposes, it is assumed that all buildings on the applicant’s property would be built to the maximum permitted height of 70 to 80 feet (see Figure A-5). The proposed project would also include a total of 450 accessory parking spaces. Projected Development Sites In addition to the applicant owned sites, it is anticipated that the proposed action would result in the development of sites 5-8. Sites 5-8 are projected to be developed with 99 DUs (of which 20 will be affordable). This development would be required to provide 45 accessory parking spaces. Sites 5-8 would be mapped with a C2-4 commercial overlay and would result in approximately 20,013 zsf (net) of local retail. It is assumed for analysis purposes that these buildings would be developed pursuant to the maximum permitted FAR and height of the R6A and R7A zoning regulations.

Rheingold Development Rezoning EAS Figure A-5
Proposed Site Plan for Applicant’s Site
For Illustrative Purposes Only
7
7
7
8
8
7

Rheingold Development Rezoning EAS Attachment A: Project Description.
A-9
The incremental difference between the future with-action and future no-action development scenarios (build year 2016) for all projected development sites is an increase of 1,076 DUs (of which 215 would be considered affordable), 74,194 zsf of local retail, and a decrease of 129,513 of vacant lot area, 53,895 sf of vehicle/open storage/parking, and 79,915 zsf of industrial/manufacturing (mainly accessory manufacturing uses and a vacant manufacturing building) (see Table A-4). Based on 2010 Census Data for a half mile radius around the rezoning area, it is projected that the average household size for the projected residential development would be approximately 2.95 persons per dwelling unit. With the projected developments combined, the Proposed Action would add approximately 3,174 new residents. In addition, applying space occupancy rates typically used in CEQR documents (3 employees/1,000 sf of retail), the Proposed Action would generate approximately 223 new employees. Also using typical rates, the Proposed Action would remove 46 employees from the projected development sites. This would result in a net increase of 177 employees in the proposed rezoning area. It is assumed that the average dwelling unit size would be 1,000 sf, per DCP’s standard guidelines. Street Mapping As part of the proposed project, in the future with the Proposed Action, portions of Stanwix Street and Noll Street would be remapped and opened to through traffic (see Figure A-5). The mapping would allow better access to the proposed mixed use development and restore the street grid at this location. The applicant proposes to map and formally bestow to the City the unbuilt section of Stanwix Street between Montieth Street and Forrest Street and the unbuilt section of Noll Street between Evergreen Avenue and Stanwix Street. At present, these portions of the unmapped Stanwix and Noll Streets are inaccessible to the public and to public traffic. Stanwix Street would have a mapped width of 50 feet, including a 30-foot travel way and two 10-foot sidewalks. Noll Street would also have a width of 50 feet, including a 30-foot travel way and two 10-foot sidewalks. These widths are consistent with the adjacent streets connecting to these newly mapped street segments. The NYCDCP and NYCDOT have consulted on the area’s circulation plan and recommended the opening of these newly mapped streets. In conjunction with this mapping, selected one-way streets within the study area would change in direction. Montieth Street would change from eastbound operation to westbound operation, Forrest Street would change from westbound operation to eastbound operation and Stanwix Street would change from northbound operation to southbound operation in the vicinity of the project site. As discussed above, the street mapping would achieve a number of benefits: the neighborhoods to the east and west of the project site would be visually connected. New access to the existing and proposed housing on Stanwix Street, Forrest Street and Noll Street would be provided through the proposed Stanwix Street. New sidewalks and streets would connect the proposed new neighborhood with neighborhoods to the east and allow for pedestrian and vehicle use. In addition, new infrastructure to support the proposed developments can be placed in the newly mapped public streets. VI. REQUIRED APPROVALS AND REVIEW PROCEDURES The Proposed Actions require City Planning Commission (CPC) and City Council approvals through the Uniform Land Use Review Procedure (ULURP), and include the following:
A zoning map amendment to change the zoning in an approximately 6 block area from M3-1 and M1-1 to M1-2, R6A and R7A with a C2-4 commercial overlay district mapped along the

Rheingold Development Rezoning EAS Attachment A: Project Description.
A-10
Bushwick, Flushing and Evergreen Avenue frontages of Blocks 3137, 3138, 3139, 3141 and 3152 to a depth of 100 feet (portions of Flushing Avenue east of Bushwick Avenue would be mapped to a depth of 87 feet).
A change to the official City Map to establish the section of Stanwix Street from Montieth Street to Forrest Street and the section of Noll Street between Evergreen Avenue and Stanwix Street as mapped streets.
A zoning text amendment, which modifies Section 23-922 of the NYC Zoning Resolution to make the appropriate R6A and R7A districts “Inclusionary Housing designated areas.”
These actions are subject to the City Environmental Quality Review (CEQR) procedures, as well as the Uniform Land Use Review Procedure (ULURP). ULURP is a process that allows public review of Proposed Actions at four levels: the Community Board, the Borough President, the City Planning Commission and, if applicable, the City Council. The procedure has mandated time limits for review at each stage to ensure a maximum review period of seven months. Through CEQR, agencies review discretionary actions for the purpose of identifying the effects those actions have on the environment.

Table A-4RWCDS for Projected and Potential Development Sites
Site Number Block Lot Address Lot Area Bldg Area FAR Land Use Description ZoningIndustrial/
Manufacturing/ Warehouse
Vacant Land
WholesaleCommercial
(Office)
Commercial (Retail/ Other)
(ZSF)
Public / Community
Use
Residential (ZSF)
DUsVehicle/Open
Storage
3139 18 902 Flushing Ave 1,452 0 0.00 Vehicle Storage/Parking Lot M1-1 1,45219 904 Flushing Ave 2,065 0 0.00 Vehicle Storage/Parking Lot M1-1 2,06520 906 Flushing Ave 2,053 0 0.00 Vehicle Storage/Parking Lot M1-1 2,05321 908 Flushing Ave 2,041 0 0.00 Vehicle Storage/Parking Lot M1-1 2,04123 Montieth St 1,875 0 0.00 Vehicle Storage/Parking Lot M1-1 1,87524 35 Montieth St 1,875 0 0.00 Vehicle Storage/Parking Lot M1-1 1,87525 Montieth St 1,875 0 0.00 Vehicle Storage/Parking Lot M1-1 1,87526 31 Montieth St 2,500 0 0.00 Vehicle Storage/Parking Lot M1-1 2,50027 29 Montieth St 1,600 0 0.00 Vehicle Storage/Parking Lot M1-1 1,60028 27 Montieth St 1,833 0 0.00 Vehicle Storage/Parking Lot M1-1 1,83329 25 Montieth St 1,833 0 0.00 Vehicle Storage/Parking Lot M1-1 1,83330 23 Montieth St 1,833 0 0.00 Vehicle Storage/Parking Lot M1-1 1,83331 21 Montieth St 2,500 0 0.00 Vehicle Storage/Parking Lot M1-1 2,50032 19 Montieth St 2,500 0 0.00 Vehicle Storage/Parking Lot M1-1 2,50033 17 Montieth St 2,500 0 0.00 Vehicle Storage/Parking Lot M1-1 2,50034 15 Montieth St 1,875 0 0.00 Vehicle Storage/Parking Lot M1-1 1,87535 13 Montieth St 1,875 0 0.00 Vehicle Storage/Parking Lot M1-1 1,87536 11 Montieth St 1,875 0 0.00 Vehicle Storage/Parking Lot M1-1 1,875
35,960 35,9602 3141 1 501 Bushwick Ave 12,204 0 0.00 Vacant Land M1-1 12,252
5 489 Bushwick Ave 1,782 0 0.00 Vacant Land M1-1 1,7756 485 Bushwick Ave 1,768 0 0.00 Vehicle Storage/Parking Lot M1-1 1,7757 483 Bushwick Ave 1,753 0 0.00 Vacant Land M1-1 1,7608 479 Bushwick Ave 1,739 1,235 0.71 Industrial M1-1 1,235
10 10 Montieth St 2,500 0 0.00 Vacant Land M1-1 2,50011 12 Montieth St 2,500 0 0.00 Vacant Land M1-1 2,50012 14 Montieth St 2,815 0 0.00 Vacant Land M1-1 2,81014 18 Montieth St 2,646 0 0.00 Vacant Land M1-1 2,62015 20-24 Montieth St 7,500 0 0.00 Vacant Land M1-1 7,50018 Montieth St 3,750 0 0.00 Vacant Land M1-1 3,75020 Montieth St 3,750 0 0.00 Vacant Land M1-1 3,75021 32 Montieth St 2,500 0 0.00 Vacant Land M1-1 2,50022 34 Montieth St 2,500 0 0.00 Vacant Land M1-1 2,50023 36 Montieth St 24,409 0 0.00 Vacant Land M1-1 24,30036 15 Forrest St 10,168 0 0.00 Vacant Land M1-1 10,200
84,284 1,235 1,235 80,717 1775
3 3152 3 1 80 Evergreen Ave 74,639 77,680 1.04 Industrial M1-1 77,680
48 1 123 Melrose St 632 0 0.00 Vacant Land M1-1 632
75,271 77,680 77,680 6324 3152 1 28-32 Stanwix St 1,348 0 0.00 Vacant Land M1-1 1,348
2 Stanwix St 2,068 0 0.00 Vacant Land M1-1 2,068
3 1 80 Evergreen Ave 29,223 0 0.00 Vacant Land M1-1 23,115
45 127 Melrose St 2,500 0 0.00 Vacant Land M1-1 2,500
48 1 123 Melrose St 9,378 0 0.00 Vacant Land M1-1 9,378
56 109 Melrose St 2,500 0 0.00 Vehicle Storage/Parking Lot M1-1 2,50058 107 Melrose St 5,000 0 0.00 Vehicle Storage/Parking Lot M1-1 5,00062 Melrose St 2,500 0 0.00 Vehicle Storage/Parking Lot M1-1 2,50063 97 Melrose St 1,975 0 0.00 Vehicle Storage/Parking Lot M1-1 1,97564 95 Melrose St 2,163 0 0.00 Vehicle Storage/Parking Lot M1-1 2,13566 Melrose St 2,061 0 0.00 Vehicle Storage/Parking Lot M1-1 2,050
60,716 38,409 16,1605 3152 36 96 Evergreen Ave 1,865 0 0.00 Vacant Land M1-1 1,865
37 98 Evergreen Ave 2,200 0 0.00 Vacant Land M1-1 2,20038 100-108 Evergreen Ave 2,400 0 0.00 Vacant Land M1-1 2,40041 Evergreen Ave 790 0 0.00 Vacant Land M1-1 79043 Melrose St 2,500 0 0.00 Vacant Land M1-1 2,500
9,755 9,7556 3138 20 846 Flushing Ave 3,300 1,000 0.30 Auto Repair M1-1 1,000
22 848 Flushing Ave 2,275 0 0.00 Auto Repair M1-15,575 1,000 1,000
7 3138 32 860 Flushing Ave 10,600 1,596 0.15 Gas Station M1-1 1,5968 3137 56 832 Flushing Ave 6,550 6,000 0.92 Commercial/Supermarket M1-1 6,000
Projected Sites Total 288,711 87,511 79,915 129,513 0 0 7,596 0 0 0 53,895
POTENTIAL SITES EXISTING CONDITION
Site Number Block Lot Address Lot Area Bldg Area FAR Land Use Description ZoningIndustrial/
Manufacturing/ Warehouse
Vacant Space in
Bldg
Commercial (Wholesale)
Commercial (Office)
Commercial (Retail/ Other)
(ZSF)
Public / Community
Use
Residential (ZSF)
DUsPublic
Parking Spaces
9 3152 44 131 Melrose St 2,500 3,400 1.36 Industrial M1-1 3,400
10 3138 11 31 Garden St 4,000 2,475 0.62 Residential M1-1 2,475 9
11 3137 51 818 Flushing Ave 2,880 2,880 1.00 Commercial M1-1 2,880
Potential Sites Total 9,380 8,755 3,400 2,880 2,475 9
Site Data Existing Condition
1

Table A-4aRWCDS for Projected and Potential Development Sites
Site NumberMAX
Allowable FAR
Built FAR
Sites with Change from
Existing to No-Action
Building Area (SF)
Industrial/ Manufacturing/
WarehouseVacant Land Wholesale
Commercial (Office)
Commercial (Retail/ Other)
(ZSF)
Public/ Community
Use
Residential (ZSF)
DUsVehicle/Open
StorageAccessoryParking
Spaces
1.0 0.00 0 1,4521.0 0.00 0 2,0651.0 0.00 0 2,0531.0 0.00 0 0 2,0411.0 0.00 0 1,8751.0 0.00 0 1,8751.0 0.00 0 1,8751.0 0.00 0 2,5001.0 0.00 0 1,6001.0 0.00 0 1,8331.0 0.00 0 1,8331.0 0.00 0 1,8331.0 0.00 0 2,5001.0 0.00 0 2,5001.0 0.00 0 2,5001.0 0.00 0 1,8751.0 0.00 0 1,8751.0 0.00 0 1,875
35,9602 1.0 0.00 0 12,252
1.0 0.00 0 1,7751.0 0.00 0 1,7751.0 0.00 0 1,7601.0 0.71 1,235 12351.0 0.00 0 2,5001.0 0.00 0 2,5001.0 0.00 0 2,8101.0 0.00 0 2,6201.0 0.00 0 7,5001.0 0.00 0 3,7501.0 0.00 0 3,7501.0 0.00 0 2,5001.0 0.00 0 2,5001.0 0.00 0 24,3001.0 0.00 0 10,200
1235 80,717 1,7753 1.0 1.04 77,680 77,680
1.0 0.00 0 632
77,680 6324 1.0 0.00 0 1,348
1.0 0.00 0 2,068
1.0 0.00 0 23,115
1.0 0.00 0 2,500
1.0 0.00 0 9,378
1.0 0.00 0 2,5001.0 0.00 0 5,0001.0 0.00 0 2,5001.0 0.00 0 1,9751.0 0.00 0 2,1351.0 0.00 0 2,0501.0 0.00 0
38,409 16,1605 1.0 0.00 0 1,865
1.0 0.00 0 2,2001.0 0.00 0 2,4001.0 0.00 0 7901.0 0.00 0 2,500
9,7556 1.0 0.30 1,000 1,000
1.0 0.00 01,000 1,000
7 1.0 0.15 1,596 15968 1.0 0.92 6,000 6,000
88,511 79,915 129,513 0 0 7,596 0 0 0 53,895 0
POTENTIAL SITES
Site NumberMAX
Allowable FAR
Built FAR
Sites with Change from
Existing to No-Action
Building Area (SF)
Industrial/ Manufacturing/
WarehouseVacant Land Wholesale
Commercial (Office)
Commercial (Retail/ Other)
(ZSF)
Public/ Community
Use
Residential (ZSF)
DUsPublic Parking
SpacesAccessoryParking
Spaces
9 1 0.11 3,400 3,400
10 1 0.10 2,475 2,475 9
11 1 0.09 2,880 2,880
8,755 3,400 2,880 2,475 9
Future Without -Action Condition
1
Potential Sites Total

Table A-4bRWCDS for Projected and Potential Development Sites
PROJECTED SITES
Site Number Development Type Proposed ZoningProposed Built
FARLot Area
Industrial/ Manufacturing/
WarehouseWholesale
Commercial (Office)
Commercial
(Retail) (ZSF)2
Public/ Community
Facility
Residential (ZSF) Total DUs 3 Inclusionary DUs 4
Public Parking Spaces
AccessoryParking Spaces
New construction R7A/C2-4 4.6/2.0 18,892 16,058 70,845 71 14 32R6A 3.6 17,068 61,445 61 10 29
35,960 16,058 132,290 132 26 602 New construction R7A/C2-4 4.6/2.0 20,012 17,010 75,045 75 15 34
R7A 4.6 20,002 92,009 92 18 41R6A 3.6 44,270 159,372 159 32 75
84,284 17,010 326,426 326 65 150
3 New construction R7A/C2-4 4.6/2.0 21,129 17,960 79,234 79 16 36
R7A 4.6 25,004 115,018 115 23 52
R6A 3.6 29,138 104,897 105 21 4975,271 17,960 299,149 299 60 137
4 New construction R7A/C2-4 4.6/2.0 3,710 3,154 13,913 14 3 6R6A 3.6 57,006 205,222 205 41 96
60,716 3,154 219,134 219 44 1035 New construction R7A/C2-4 4.6/2.0 9,755
8,292 36,581 37 7 166 New construction R6A/C2-4 3.6/2.0 5,575
4,739 15,331 15 3 77 New construction R6A/C2-4 3.6/2.0 10,600 9,010 29,150 29 6 148 New construction R6A/C2-4 3.6/2.0 6,550 5,568 18,013 18 4 8
0 0 0 81,790 0 1,076,074 1,076 215 4951 Portion of Lot 32 Assuming 1.0 FAR with 15% of floor area designated to residential uses (lobbies, etc.)3 Assuming 1,000 sf/DU4 Assuming 20% of Proposed Max. Floor Area
POTENTIAL SITES
Site Number Development Type Proposed ZoningProposed Built
FARLot Area
Industrial/ Manufacturing/
WarehouseWholesale
Commercial (Office)
Commercial (Retail) (ZSF)
Public/ Community
Facility
Residential (ZSF)
Total DUs Inclusionary DUsPublic
Parking Spaces
AccessoryParking Spaces
9 New construction R7A/C2-4 4.6/2.0 2,500 2,125 9,375 9 2 4
10 New construction R6A 3.6 4,000 0 18,400 18 4 8
11 New construction R6A/C2-4 3.6/2.0 2,880 2,448 10,800 11 2 5
9,380 4,573 38,575 39 8 18
Future With-Action Condition
1
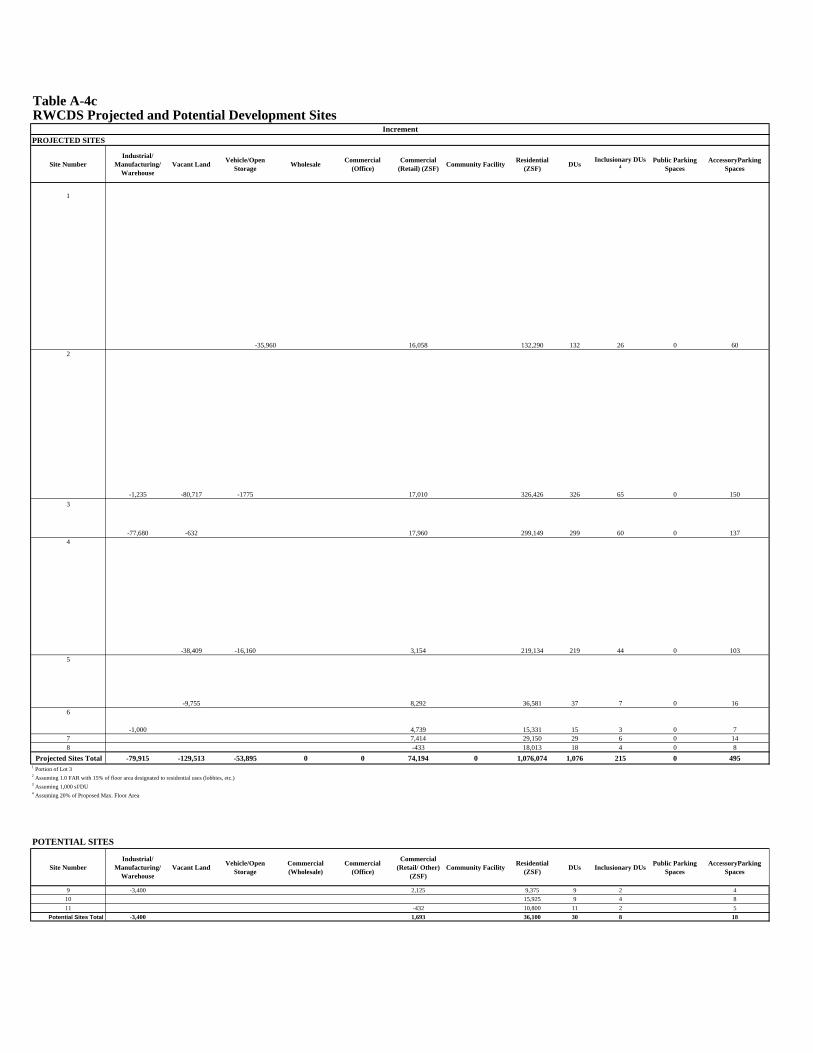
Table A-4cRWCDS Projected and Potential Development Sites
PROJECTED SITES
Site NumberIndustrial/
Manufacturing/ Warehouse
Vacant LandVehicle/Open
StorageWholesale
Commercial (Office)
Commercial (Retail) (ZSF)
Community FacilityResidential
(ZSF) DUs
Inclusionary DUs 4
Public Parking Spaces
AccessoryParking Spaces
-35,960 16,058 132,290 132 26 0 602
-1,235 -80,717 -1775 17,010 326,426 326 65 0 150
3
-77,680 -632 17,960 299,149 299 60 0 1374
-38,409 -16,160 3,154 219,134 219 44 0 1035
-9,755 8,292 36,581 37 7 0 166
-1,000 4,739 15,331 15 3 0 77 7,414 29,150 29 6 0 148 -433 18,013 18 4 0 8
Projected Sites Total -79,915 -129,513 -53,895 0 0 74,194 0 1,076,074 1,076 215 0 4951 Portion of Lot 32 Assuming 1.0 FAR with 15% of floor area designated to residential uses (lobbies, etc.)3 Assuming 1,000 sf/DU4 Assuming 20% of Proposed Max. Floor Area
POTENTIAL SITES
Site NumberIndustrial/
Manufacturing/ Warehouse
Vacant LandVehicle/Open
StorageCommercial (Wholesale)
Commercial (Office)
Commercial (Retail/ Other)
(ZSF)Community Facility
Residential (ZSF)
DUs Inclusionary DUsPublic Parking
SpacesAccessoryParking
Spaces
9 -3,400 2,125 9,375 9 2 4
10 15,925 9 4 8
11 -432 10,800 11 2 5
Potential Sites Total -3,400 1,693 36,100 30 8 18
Increment
1

Additional Technical Information for EAS Part II

EAS Full Form Page 9a
‐9a‐
Additional Technical Information for EAS Part II A. Land Use, Zoning and Public Policy Under New York City Environmental Quality Review (CEQR), a land use analysis characterizes the uses and development trends in the area that may be affected by a proposed action. The analysis also considers the action’s compliance with and effect on the area’s zoning and other applicable public policies. Even when there is little potential for an action to be inconsistent or affect land use, zoning, or public policy, a description of these issues is appropriate to establish conditions and provide information for use in other technical areas. A detailed assessment of land use is appropriate if the action would result in a significant change in land use or would substantially affect regulation or policies governing land use. The Proposed Action includes zoning map and zoning text amendments that would affect five full blocks and a portion of one block in Bushwick, Brooklyn. In addition, a number of public policies are applicable to portions of the rezoning area and the quarter‐mile study area, including urban renewal area, industrial business zones, etc. Therefore, consistent with the guidelines of the 2012 CEQR Technical Manual, an assessment of land use, zoning and public policy is warranted, and will be provided in the EIS, as described in the Draft Scope of Work.
B. Socioeconomic Conditions According to the CEQR Technical Manual, the five principal issues of concern with respect to socioeconomic conditions are whether a proposed action would result in significant adverse impacts due to: (1) direct residential displacement; (2) direct business and institutional displacement; (3) indirect residential displacement; (4) indirect business and institutional displacement; and (5) adverse effects on specific industries. According to the CEQR Technical Manual, a socioeconomic assessment should be conducted if an action may reasonably be expected to create substantial socioeconomic changes in an area. This can occur if an action would directly displace a residential population, substantial numbers of businesses or employees, or eliminate a business or institution that is unusually important to the community. It can also occur if an action would bring substantial new development that is markedly different from existing uses and activities in the neighborhood, and therefore would have the potential to lead to indirect displacement of businesses or residents from the area. As detailed in the Draft Scope of Work, the following describes the level of assessment that is warranted and the scope of analysis for the five principal socioeconomic issues of concern.
Direct Residential Displacement The Proposed Action would not directly displace any residents from any of the projected development sites identified as part of the RWCDS. Therefore, the Proposed Action would not result in significant adverse impacts due to direct residential displacement, and no further analysis of this issue is required.
Direct Business Displacement The Proposed Action would result in the direct business displacement on five of the eight projected development sites. The businesses that would be directly displaced by the Proposed Action conduct a variety of business activities and include auto service and transportation‐related establishments, warehouse uses, and retail. Collectively, the employment displaced from the projected development sites is not expected to exceed the 100‐employee CEQR threshold warranting analysis, however, as detailed in the Draft Scope of Work, a preliminary assessment of direct business displacement will be provided in the EIS. It should be noted that the businesses located on the projected development sites are not unusually unique or important to a specific industry and could be located elsewhere in the City.

EAS Full Form Page 9b
‐9b‐
Indirect Residential Displacement The Project Action would result in a net increment of more than 200 new residential units, which is the CEQR Technical Manual threshold for assessing the potential indirect effects of an action. Therefore, an assessment of indirect residential displacement will be provided in the EIS, as described in the Draft Scope of Work.
Indirect Business Displacement The concern with respect to indirect business and institutional displacement is whether a proposed project could lead to increases in property values, and thus rents, making it difficult for some businesses or institutions to remain in the area. Although the Proposed Action would not introduce over 200,000 square feet of new commercial and community facility uses to the project area, it would introduce 1,076 residential dwelling units that could alter socioeconomic conditions in the study area. Therefore, as described in the Draft Scope of Work an assessment of indirect business and institutional displacement will be provided in the EIS.
Adverse Effects on Specific Industries Based on the guidelines in the CEQR Technical Manual, a preliminary assessment of effects on specific industries will be conducted to determine whether the Proposed Action would significantly affect business conditions in any industry or category of businesses within or outside the study area, or whether the Proposed Action would substantially reduce employment or impair viability in a specific industry or category of businesses.
C. Community Facilities and Services As defined for CEQR analysis, community facilities are public or publicly funded schools, libraries, child care centers, health care facilities and fire and police protection. An action can affect facility services directly, when it physically displaces or alters a community facility; or indirectly, when it causes a change in population that may affect the services delivered by a community facility. The Proposed Action would not result in the direct displacement any existing community facilities or services, nor would it affect the physical operations of or access to and from any police or fire stations. As per the CEQR Technical Manual, depending on the size, income characteristics, and age distribution of the new population, an action may have indirect effects on public schools, libraries, or child care centers. A discussion of the Proposed Action’s potential effects on community facilities is provided below. The RWCDS for the Proposed Action would result in the addition of a maximum of 1,076 residential units (compared to No‐Action) to the area, of which 215 would be considered affordable.
Public Schools If an action introduces less than 50 elementary and middle school age children, or 150 high school students, an assessment of school facilities is not required. According to CEQR Technical Manual guidelines, in Brooklyn the 50‐student threshold for analysis of elementary/middle school capacity is achieved if an action introduces at least 121 residential units; the threshold for analysis of high school capacity is 1,068 residential units. As the proposed 1,076 dwelling units exceeds the CEQR threshold for elementary, intermediate schools, and high schools, therefore, a detailed analysis will be provided in the EIS, as described in the Draft Scope of Work.
Libraries According to the guidelines established in the CEQR Technical Manual, if a proposed action increases the number of residential units served by the local library branch by more than 5 percent, then an analysis of library services is necessary. In Brooklyn, the introduction of 734 residential units would represent a 5 percent increase in dwelling units per branch. As the RWCDS associated with the Proposed Action would result in the addition of up to 1,076 dwelling units to the study area compared to No‐Action, it exceeds the CEQR threshold for a detailed analysis, a detailed analysis of libraries will be provided in the EIS, as described in the Draft Scope of Work.

EAS Full Form Page 9c
‐9c‐
Child Care Centers The CEQR Technical Manual requires a detailed analysis of day care centers when a proposed action would produce substantial numbers of subsidized, low‐to moderate‐income family housing units that may therefore generate a sufficient number of eligible children to affect the availability of slots at public day care centers. Typically, proposed actions that generate 20 or more eligible children under age six require further analysis. According to Table 6‐1b of the 2012 CEQR Technical Manual, the number of dwelling units to yield 20 or more eligible children under age six in Brooklyn would be 110 affordable housing units. The RWCDS associated with the Proposed Action would result in to approximately 215 units would be affordable. As such, the Proposed Action triggers the threshold for an analysis of childcare centers, and a detailed analysis will be provided in the EIS, as described in the Draft of Scope Work.
Police/Fire Services and Health Care Facilities According to the CEQR Technical Manual, a detailed analysis of police and fire services and health care facilities is required if a Proposed Action would (a) introduce a sizeable new neighborhood where one has not previously existed, or (b) would displace or alter a hospital or public health clinic, fire protection services facility, or police station. As the Proposed Action would not result in any of the above, no significant adverse impacts would be expected to occur, and a detailed analysis of police/fire services and health care facilities is not required. According, the EIS will not analyze indirect impacts on Police/Fire services and health care centers.
D. Open Space Based on the CEQR Technical Manual, an open space assessment is typically warranted if an action would directly affect an open space, or if it would increase the population by more than:
350 residents or 750 workers in areas classified as “well‐served areas;”
50 residents or 125 workers in areas classified as “underserved areas;”
200 residents or 500 workers in areas that are not within well‐served or “underserved areas. Maps in the Open Space appendix of the 2012 CEQR Technical Manual identify the rezoning area is located in an underserved area. Thus, the analysis threshold used for the Proposed Action is for an area that is underserved. Based on 2010 Census Data for a half mile radius around the rezoning area, it is projected that the average household size for the projected residential development would be approximately 2.95 persons per dwelling unit. The Proposed Action would result in 3,174 new residents and 177 new workers (net) which would exceed the 2012 CEQR Technical Manual thresholds requiring detailed analysis. Therefore a detailed open space assessment for the residential and worker (day‐time) populations generated by Proposed Action is warranted, and will be provided in the EIS, as described in the Draft Scope of Work.
E. Shadows The CEQR Technical Manual requires a shadow assessment for a proposed action that would result in a new structure(s), or addition(s) to existing structure(s), that are greater than 50 feet in height and/or adjacent to an existing sunlight‐sensitive resource. The Proposed Action would result in new development with buildings ranging in height from 70 to 80 feet, some of which would be located in the vicinity of sunlight sensitive resources. According to the CEQR Technical Manual, the longest shadow a structure will cast in New York City, except for periods close to dawn or dusk, is 4.3 times its height. As such, the Proposed Action would result in a maximum shadow radius of 344 feet. There are several publicly accessible open space resources within this radius and therefore, the Proposed Action would have the potential to cast new shadows on nearby open spaces. As discussed below, there are no historic resources within the 344 foot radius. As such, consistent with the guidelines of the 2012 CEQR Technical Manual, an analysis of the new buildings’ potential to result in shadow impacts on open spaces in the area is warranted, and will be included in the EIS, as described in the Draft Scope of Work.

EAS Full Form Page 9d
‐9d‐
F. Historic and Cultural Resources According to the CEQR Technical Manual, a historic resources assessment is required if there is the potential to affect either archaeological or architectural resources. According to 2012 CEQR Technical Manual guidelines, impacts on historic resources are considered on those sites affected by the Proposed Action and in the area surrounding identified development sites. There is one resource within 400 feet of the proposed rezoning area that is a designated Landmarks Preservation Commission (LPC) landmark; the William Uhlmer Brewery on Beaver and Locust Streets (see Figure 5). The William Uhlmer Brewery, formerly called the Vicelius & Ulmer’s Continental Lagerbier Brewery, consists of three buildings that date from around 1872 and the architect was Theobald Engelhardt. One brewery building is located on the west side of Beaver Street between Beldivere and Locust. Ornamentation is minimal on this L‐shaped 4‐story brick building and includes windows with brick Romanesque compound arches, bays separated by brick pilasters, a Romanesque brick cornice, and star‐shaped metal wall ties (see Figure 6). The second brewery building is located at 28‐32 Locust Street. This 3‐story building’s facade is configured as a temple with the two upper stories divided into three bays separated by paired pilasters. While the base has minimal decoration, with restrained brick work and five large windows, the upper two floors have smaller arched windows with compound brick arches resting on brick bands. The third brewery building, the former Uhlmer Brewery Office, is located at 29 Beldivere Street. It is an eclectic 2‐story brick and terra cotta structure with Romanesque details. The facade consists of three bays with a central 2‐story entrance pavilion capped with a gabled brick cornice with decorative corbeling. There are no other historic resources within 400 feet of the proposed rezoning area. There are three additional historic resources located immediately outside the 400‐foot radius: The St. Mark’s Lutheran Church and School, Arion Hall, and P.S. 52 (see Figure 5). All three resources may be considered eligible for S/NR and LPC listing. St. Mark’s Lutheran Church and School is located at 626 Bushwick Avenue on the southwest corner of the intersection with Jefferson Street. The church is red brick with white terra cotta Victorian Gothic structure and a tall central tower capped with a copper spire that is visible for long distances down Bushwick Avenue. Arion Hall is located at 13 Arion Place and used to be a German social hall that housed a singing society, it is admired for its Romanesque and Italianate decorative elements. P.S. 52, at 330 Ellery Street, dates from around 1880 and was designed by the Superintendent of School Buildings at that time. The building is recognized for its unusual Queen Anne style brick and terra cotta structure and asymmetrical massing.
The Proposed Action and development associated with it are not expected to have any direct physical impacts on the William Uhlmer Brewery or any other historic resource, as it would not result in the physical destruction, demolition, damage, or alteration to any designated historic property. In addition, as discussed above, shadows cast by the Proposed Action would not reach any historic resources. Furthermore, any development resulting from the Proposed Action would not alter the setting or visual context of any historic resources, nor would it eliminate or screen publicly accessible views of any resources. Therefore, the Proposed Action is not expected to result in significant adverse impacts on architectural resources and a detailed analysis of historic resources is not required. In a letter dated June 6, 2012 (attached in Appendix A), LPC concurred that the Proposed Action would not result in significant adverse impacts to the resources discussed above. Accordingly, the EIS will not analyze impacts on architectural resources. LPC determined that none of the projected and potential development sites where new in‐ground disturbance is likely to occur are sensitive for potential archaeological resources (see June 6, 2012 letter in Appendix A). Therefore, there is no potential for significant adverse impacts to archaeological resources, and no further analysis is warranted. Accordingly, the EIS will not analyze impacts on archaeological resources.
G. Urban Design The CEQR Technical Manual outlines an assessment of urban design when a project may have effects on one or more of the elements that contribute to a pedestrian’s experience of public space. These elements include streets, buildings, visual resources, open spaces, natural resources, wind, and sunlight. According to the CEQR
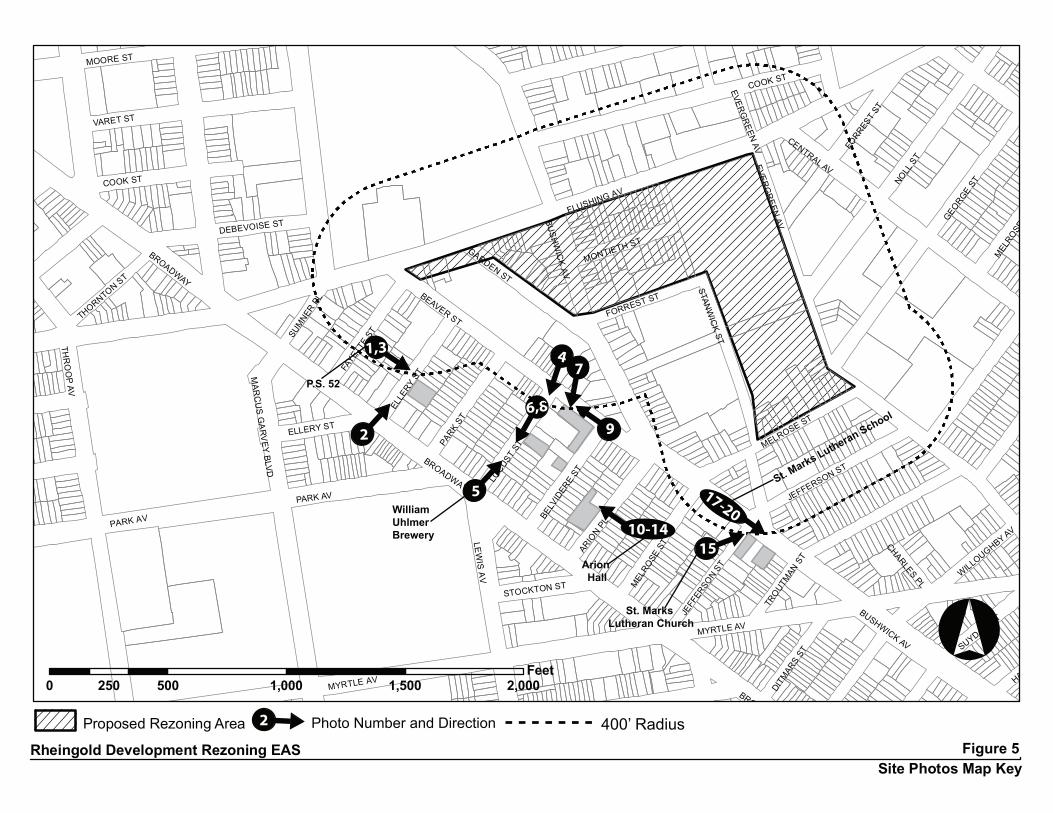
DITM
ARS
ST
HART STSUYDAM
ST
BROADWA
MYRTLE AV
GEORGEST
MEL
ROSEST
NOLLST
CENTRAL AV
FORRES
TST
CHARLESPL
ARIO
NPL
BUSHWICK AV
JEFF
ERSO
NST
JEFFERSON ST
MEL
ROSE
ST
MELROSE ST
TROUTM
ANST
WILLOUGHBY AV
FLUSHING AV
COOK ST
EVERG
REEN
AV
BUS
HW
ICK
AV
EVERG
REEN
AV
STANW
ICK
ST
LOCUST
ST
LEW
ISA
V
STOCKTON ST
BELV
IDER
EST
FORREST ST
GARDEN ST
MONTIETH ST
FAYET
TEST
ELLERY ST
MAR
CU
SG
AR
VEY
BLVD
PARK AV
BEAVER ST
BROADWAY
ELLE
RYST
PARK
ST
SUM
NERPL
MOORE ST
THR
OO
PAV
BROADWAY
COOK ST
DEBEVOISE ST
THORNTON ST
PARK AV
MYRTLE AV
VARET ST
Rheingold Development Rezoning EAS Figure 5Site Photos Map Key
°0 500 1,000 1,500 2,000250
Feet
Proposed Rezoning Area 2 Photo Number and Direction
1,3
2
4
5
6,8
9
7
10-1415
4
17-20
400’ Radius
William Uhlmer Brewery
Arion Hall
P.S. 52
St. Marks Lutheran School
St. Marks Lutheran Church

Rheingold Development Rezoning EAS Figure 6
1) The front of the former P.S. 52 building from Ellery Street 2) Looking from Broadway and Ellery
3) The facade of the current building from Ellery Street
4) Ulmer Brewery from Beaver Street
5) Ulmer Brewery from Locust Street looking towards Beaver St
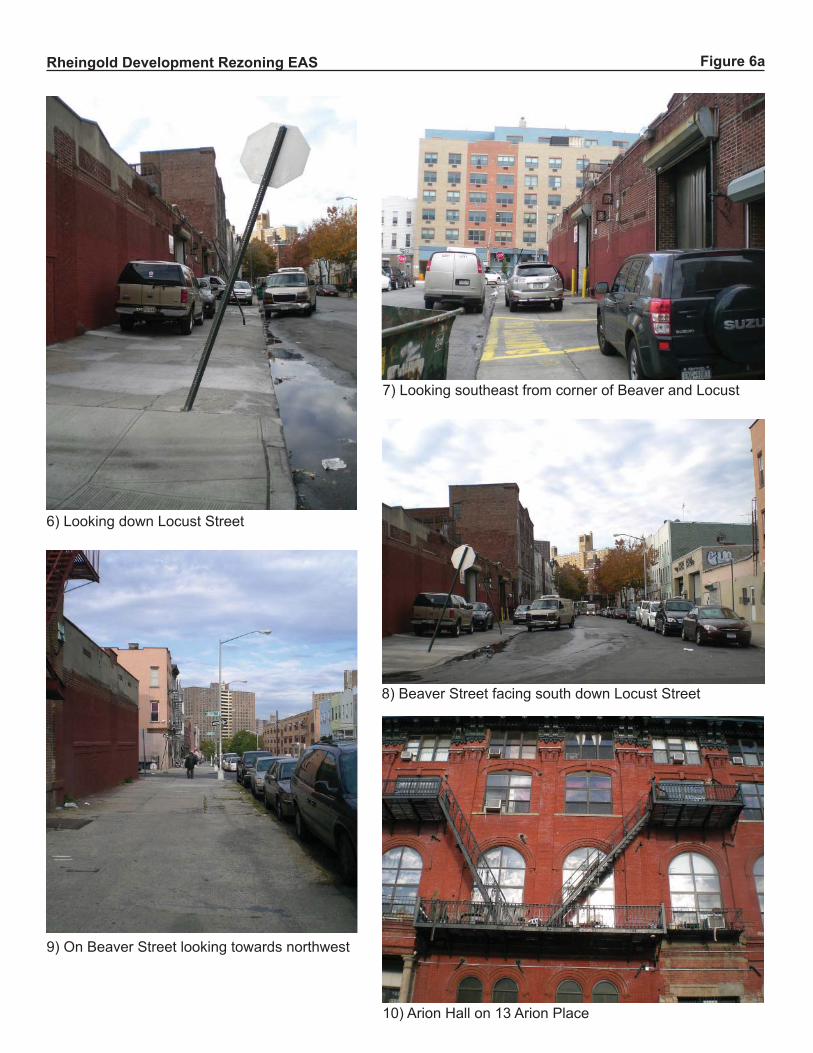
Rheingold Development Rezoning EAS Figure 6a
6) Looking down Locust Street
7) Looking southeast from corner of Beaver and Locust
8) Beaver Street facing south down Locust Street
9) On Beaver Street looking towards northwest
10) Arion Hall on 13 Arion Place

Rheingold Development Rezoning EAS Figure 6b
11) Arion Hall on 13 Arion Place 12) Arion Hall from Beaver and Arion Place
13) Front Entrance to Arion Hall 14) Arion Hall
15) St. Marks Lutheran Church from Jefferson Street 16) St. Marks Lutheran Church from Jefferson Stree

Rheingold Development Rezoning EAS Figure 6c
17) St. Marks Lutheran Church school entrance from Bush-wick Street
18) St. Marks Lutheran Church Spire from cor-ner of Bushwick and Jefferson
19) Scaffolding in front of church entrance
20) Close up of the school entrance

EAS Full Form Page 9e
‐9e‐
Technical Manual, a preliminary analysis of urban design and visual resources is considered appropriate when there is the potential for a pedestrian to observe, from the street level, a physical alteration beyond that allowed by existing zoning, including the following: 1) projects that permit the modification of yard, height, and setback requirements; and 2) projects that result in an increase in built floor area beyond what would be allowed “as‐of‐right” or in the future without the proposed action. CEQR stipulates a detailed analysis for projects that would result in substantial alterations to the streetscape of the neighborhood by noticeably changing the scale of buildings. The Proposed Action and subsequent development within the rezoning area would result in physical changes to the proposed rezoning area beyond the bulk and form currently permitted as‐of‐right. The Proposed Action includes zoning map and zoning text amendments that would affect 5 full blocks and a portion of one block in Bushwick, Brooklyn. These changes could affect a pedestrian’s experience of public space, requiring an urban design assessment, and therefore a preliminary assessment of urban design and visual resources will be provided in the EIS, as described in the Draft Scope of Work.
H. Natural Resources A natural resource is defined for CEQR as plant and animal species, and/or any area capable of providing
habitat for plant and animal species or capable of supporting environmental systems and maintaining the City’s
environmental balance. These resources include surface and groundwater, drainage systems, wetlands, dunes
and beaches, grasslands, woodlands, landscaped areas, gardens and some built structures used by wildlife.
As assessment of natural resources is appropriate if a natural resource exists on or near the project site, or if an
action involves direct or indirect disturbance of that resource. The rezoning area is urbanized and developed.
The eight development sites, which contain buildings, vehicle/open storage areas and vacant areas, do not
contain any of the natural resources cited above. In addition, the sites are not immediately adjacent to any of
these natural resource areas. Therefore, a detailed assessment of natural resources is not warranted.
I. Hazardous Materials According to the CEQR Technical Manual, the potential for significant impacts from hazardous materials can occur when: a) hazardous materials exist on a site and b) an action would increase pathways to their exposure; or c) an action would introduce new activities or processes using hazardous materials, thereby increasing the risk of human or environmental exposure. The following circumstances are examples of projects where a hazardous materials assessment is warranted:
Rezoning (or other discretionary approvals such as variance) allowing commercial or residential uses in an area currently or previously zoned for manufacturing uses.
Construction requiring soil disturbance in a manufacturing zone.
Development within close proximity to a manufacturing zone or existing facilities (including nonconforming uses) listed in the Hazardous Materials Appendix in the CEQR Technical Manual.
Rezoning to a residential or mixed‐use district, if the area may have potentially stored, used, disposed of, or generated hazardous materials, such as an area in a C8 zoning district.
Development on a vacant or underutilized site if there is a reason to suspect contamination, illegal dumping, or historic/urban fill.
Renovation of interior existing space on a site with potential vapor intrusion from on‐site or off‐site sources; compromised air quality; or the presence of asbestos, PCBs, mercury, or lead‐based paint.
Development in an area with fill material of unknown origin. Fill material historically used in New York City includes dredged material that may contain petroleum, heavy metal, or PCB contamination and ash from the historical burning of garbage. In addition, former wetland areas or areas with fill material containing organic wastes may produce methane.
Development on or near a government‐listed or voluntary clean‐up/brownfield site (e.g. solid waste landfill site, inactive hazardous waste site, NYSDEC Brownfield Cleanup Program or Local Brownfield
EAS Full Form Page 9f
‐9f‐
Cleanup Program site), current or former power generating/transmitting facilities, municipal incinerators, coal gasification or gas storage sites, or railroad tracks/rights‐of‐way.
Development where underground and/or aboveground storage tanks (USTs or ASTs) are (or were) locate on or near the site.
An analysis should be conducted for any site with the potential to contain hazardous materials or if any future redevelopment is anticipated. Therefore, the EIS will include an assessment of hazardous materials (refer to Draft Scope of Work).
J. Water and Sewer Infrastructure The CEQR Technical Manual outlines thresholds for analysis of a project’s water demand and its generation of wastewater and stormwater. A preliminary analysis of a project’s effects on the water supply system is warranted if a project would result in an exceptionally large demand for water (e.g., those that would use more than 1 million gallons per day), or would be located in an area that experiences low water pressure (e.g., Rockaway Peninsula or Coney Island). A preliminary analysis of a project’s effects on wastewater or stormwater infrastructure is warranted depending on a project’s proposed density, its location, and its potential to increase impervious surfaces. For the Proposed Action, an analysis of water supply is not warranted because the project would not result in a demand of more than 1 million gallons per day, nor is it located in an area that experiences low water pressure. Based on the average daily water use rates provided in Table 13‐2 of the CEQR Technical Manual, it is estimated that the RWCDS associated with the Proposed Action would use a maximum net total of approximately 343,645 gallons of water per day. For wastewater and stormwater conveyance and treatment, the CEQR Technical Manual indicates that a preliminary assessment would be needed if a project is located in a combined sewer area and would exceed the following incremental development of residential units or commercial space above the predicted No‐Action scenario: (a) 1,000 residential units or 250,000 sf of commercial space or more in Manhattan; or, (b) 400 residential units or 150,000 sf of commercial space or more in the Bronx, Brooklyn, Staten Island or Queens. As the Proposed Action would result in an increase of more than 400 residential units compared to No‐Action conditions, a preliminary assessment of wastewater and stormwater infrastructure is warranted and will be provided in the EIS. In addition, a stormwater best management practices (BMP) is also required and will be provided in the EIS. Further detail is provided in the Draft Scope of Work.
K. Solid Waste and Sanitation Services A solid waste assessment is warranted if a proposed action would cause a substantial increase in solid waste production that would overburden available waste management capacity or otherwise be inconsistent with the City’s Solid Waste Management Plan (SWMP) or with state policy related to the City’s integrated solid waste management system. According to the CEQR Technical Manual, few projects have the potential to generate substantial amounts of solid waste (defined as 50 tons [100,000 pounds] per week or more), thereby resulting in a significant adverse impact. Based on the average daily solid waste generation rates provided in Table 14‐1 of the CEQR Technical Manual and shown in Table 1 below, it is estimated that the RWCDSs associated with the Proposed Action would result in a net increase of 55,089 pounds of solid waste per week (27.9 tons), compared to No‐Action conditions. Therefore, an analysis of solid waste and sanitation services is not warranted in the EIS, as the Proposed Action would not generate 50 tons (100,000 pounds) or more per week, nor would it generate wastes with special characteristics, and would therefore not result in a significant adverse solid waste and sanitation services impact.

EAS Full Form Page 9g
‐9g‐
Table 1: Expected Solid Waste Generated on the Projected Development Sites
Use Size (gsf) Solid Waste
Handled by DSNY (lbs/wk)
Solid Waste Handled by Private Carters (lbs/wk)
Total Solid Waste (lbs/wk)
Existing Condition
Residential 0 DU 0
Commercial – Retail 7,596* 5,507 5,507
Industrial/Warehouse 79,195 2,975 2,975
Total 0 8,382 8,382
Use Size (gsf) Solid Waste
Handled by DSNY (lbs/wk)
Solid Waste Handled by Private Carters (lbs/wk)
Total Solid Waste (lbs/wk)
No‐Action Condition
Residential 0 DU 0
Commercial – Retail 7,596* 5,507 5,507
Industrial/Warehouse 79,195 2,975 2,975
Total 0 8,382 8,382
Use Size (gsf) Solid Waste
Handled by DSNY (lbs/wk)
Solid Waste Handled by Private Carters (lbs/wk)
Total Solid Waste (lbs/wk)
With‐Action Condition
Residential 1,076 DU 44,116 44,116
Commercial – Retail 81,790 19,355 19,355
Industrial/Warehouse 0
Total 44,116 19,355 63,471
Net Difference: No‐Action V. With‐Action Condition
44,116 10,973 55,089
*Retail uses in Existing and No‐Action include a gas station and food store use Notes: Based on citywide average waste generation rates presented in Table 14‐1 of the CEQR Technical Manual. Residential use: 41 lbs/wk per unit. Retail use: 79 lbs/wk per employee; Food store: 284 lbs/wk per employee. Industrial/Warehouse use: 125 lbs/wk per employee
L. Energy According to the CEQR Technical Manual, a detailed assessment of energy impacts would be limited to actions that could significantly affect the transmission or generation of energy or that generate substantial indirect consumption of energy (such as a new roadway). Therefore, in accordance with CEQR guidelines, this environmental assessment will disclose the Proposed Action’s energy consumption. The Proposed Action’s projected energy demand was calculated consistent with the methodologies of the CEQR Technical Manual. Based on the rates provided in the Manual, the Proposed Action and associated RWCDS would be expected to require up to a net increment of approximately 108 billion British Thermal Units (BTUs) of energy annually. According to the guidance of the CEQR Technical Manual, a detailed assessment of energy impacts would only be required for projects that may significantly affect the transmission or generation of energy. The Proposed Action would not be expected to significantly affect the transmission or generation of energy, and therefore an energy assessment is not warranted. In addition, any new developments projected in the RWCDS are expected to compliant with New York City Local Law 86 of 2005 and would be designed to meet provide sustainable elements where possible, including elements intended to reduce storm water runoff for example.
EAS Full Form Page 9h
‐9h‐
Table 2: Expected Energy Consumption on the Projected Development Sites Use Size (gsf) Rate (BTU/sf) Annual Energy Use (BTU)
Existing Condition
Residential 0 sf 126,700 0
Commercial 7,596 216,300 1,643,014,800
Industrial 79,195 554,300 44,296,884,500
Total 45,939,899,300
Use Size (gsf) Rate (BTU/sf) Annual Energy Use (BTU)
No‐Action Condition
R id i l 0 f 126 700 0Commercial 7,596 216,300 1,643,014,800
Industrial 79,195 554,300 44,296,884,500
Total 45,939,899,300
Use Size (gsf) Rate (BTU/sf) Annual Energy Use (BTU)
With‐Action Condition
Residential 1,076,074 126,700 136,338,575,800
Commercial 81,790 216,300 17,691,177,000
Industrial 0 554,300 0
Total 154,029,752,800
Net Difference: No‐Action V. With‐Action Condition 108,089,853,500
Notes: Based on citywide average annual energy use rates presented in Table 15‐1 of the CEQR Technical Manual.
M. Transportation Consistent with the guidelines of the 2012 CEQR Technical Manual, an assessment of transportation will be provided in the EIS. A transportation planning assumptions memo that has been prepared for the Proposed Action is attached as Appendix B. As detailed in Appendix B, based on preliminary estimates for the RWCDS, the Proposed Action is expected to generate 83, 90, 105, and 122 vehicular trips in the weekday AM, midday, PM, and Saturday midday peak hours, respectively. Moreover, trip assignments show that the proposed action is also expected to generate 50 or more vehicles per hour during each of the peak hours through one or more intersections. Therefore, detailed traffic analysis is warranted and will be provided in the EIS, as detailed in the Draft Scope of Work. Furthermore, as described in the Draft Scope of Work, the EIS will document changes in on‐and off‐street parking utilization in the future No‐Action and With‐Action conditions, and will include a parking assessment to determine whether the Proposed Action and associated RWCDS would result in excess parking demand, and whether there is a sufficient number of other parking spaces in the study area to accommodate that excess demand. Based on preliminary estimates, the RWCDS is expected to generate 539 and 633 subway trips in weekday AM and PM peak hours; therefore, a detailed subway analysis is warranted and would be provided in the EIS for the AM and PM peak hours, as detailed in the Draft Scope of Work. The preliminary estimates also indicate that the RWCDS would not generate more than 200 total bus trips in the weekday AM peak hour, however it would generate 312 total bus trips in the PM peak hour. According to the general thresholds used by the Metropolitan Transportation Authority (MTA) and specified in the 2012 CEQR Technical Manual, a detailed analysis of bus conditions is generally not required if a Proposed Action is projected to result in fewer than 200 total bus trips during any peak hour. As these trips would be widely disbursed throughout the study area and distributed among several bus routes, it is highly unlikely that any one route would experience 50 or more trips in one direction in any peak hour. Therefore, the Proposed Action is not expected to result in any significant adverse impacts to bus transit services based on 2012 CEQR Technical Manual criteria, and a detailed bus analysis is not warranted. The EIS will, however, include a qualitative discussion of the bus services operating in proximity to the rezoning area. Based on preliminary estimates shown in the Transportation Planning Factors Memorandum in Appendix B, there are expected to be 353, 1,691, 945, and 1,063 walk‐only trips in the AM, midday, PM and Saturday midday peak hours, respectively. Although these pedestrian trips would also be dispersed throughout the rezoning area, some concentrations of new pedestrian trips exceeding the 200‐trip CEQR Technical Manual threshold may occur during one or more peak hours along corridors with commercial overlays and others

EAS Full Form Page 9i
‐9i‐
connecting projected development sites to area subway stations. Therefore, detailed pedestrian analysis is warranted and will be provided in the EIS, as described in the Draft Scope of Work.
N. Air Quality Under CEQR, an air quality analysis determines whether a proposed project would result in stationary or mobile sources of pollutant emissions that could have a significant adverse impact on ambient air quality, and also considers the potential of existing sources of air pollution to impact the proposed uses. The Proposed Action would not result in the conditions outlined in Section 210 of Chapter 17 of the 2012 CEQR Technical Manual. Specifically, the project‐generated vehicle trips would not exceed the emissions threshold and the peak vehicle traffic threshold for conducting an air quality analysis of mobile sources, which is 170 vehicles at any intersection (see TPF). The RWCDS would include accessory parking facilities on projected development sites that would total 495 accessory parking spaces. In addition, the Proposed Action and associated RWCDS would result in the conditions outlined in Section 220 in Chapter 17. Specifically, the projected and potential developments would use fossil fuels for heat and hot water systems. Therefore, consistent with the guidelines of the 2012 CEQR Technical Manual, an assessment of air quality will be provided in the EIS. As detailed in the Draft Scope of Work, the air quality assessment will consider the potential impacts on air quality from the accessory parking garages, heat and hot water systems, and from existing industrial uses in the surrounding area on the development resulting from the Proposed Action.
O. Greenhouse Gas Emissions The 2012 CEQR Technical Manual notes that while the need for a greenhouse gas (GHG) emissions assessment is highly dependent on the nature of the project and its potential impacts, the GHG consistency assessment currently focuses on city capital projects, projects proposing power generation or a fundamental change to the City’s solid waste management system, and projects being reviewed in an EIS that would result in development of 350,000 square feet or greater (or smaller projects that would result in the construction of a building that is particularly energy‐intense, such as a data processing center or health care facility). The proposed development associated with the RWCDS would exceed 350,000 sf, and therefore a GHG assessment will be provided in the EIS, as discussed in the Draft Scope of Work. As a GHG emissions analysis will be provided in the EIS, pursuant to CEQR Technical Manual guidelines the Proposed Action and associated RWCDS’s energy consumption will be calculated and provided in the EIS, as described in the Draft Scope of Work.
P. Noise According to the CEQR Technical Manual, a noise analysis is appropriate if an action would generate any mobile or stationary sources of noise or would be located in an area with high ambient noise levels. Specifically, an analysis would be required if an action generates or reroutes vehicular traffic, if an action is located near a heavily trafficked thoroughfare, or if an action would be within 1 mile of an existing flight path or within 1,500 feet of existing rail activity (and with a direct line of sight to that rail facility). A noise assessment would also be appropriate if the action would result in a playground or would cause a stationary source to be operating within 1,500 feet of a receptor (with a direct line of sight to that receptor), or if the action would include unenclosed mechanical equipment for manufacturing or building ventilation purposes, or if the action would be located in an area with high ambient noise levels resulting from stationary sources.
A detailed noise analysis will be included in the EIS, because the Proposed Action would meet the following CEQR Technical Manual thresholds: it would result in additional vehicle trips to and from the rezoning area; it would introduce new sensitive receptors in the vicinity of heavily trafficked roadways including Broadway and Flushing Avenue, and it would introduce new sensitive receptors within 1,500 feet of rail activity. Building attenuation required to provide acceptable interior noise levels for the projected and potential development sites will also be examined and discussed in the EIS.

EAS Full Form Page 9j
‐9j‐
Q. Public Health Public health involves the activities that society undertakes to create and maintain conditions in which people can be healthy. Many public health concerns are closely related to air quality, hazardous materials, construction, and natural resources. The CEQR Technical Manual indicates that for most proposed projects, a public health analysis is not necessary. Where no significant unmitigated adverse impact is found in other CEQR analysis areas, such as air quality, water quality, hazardous materials, or noise, no public health analysis is warranted. If, however, an unmitigated significant adverse impact is identified in other CEQR analysis areas, such as air quality, water quality, hazardous materials, or noise, the lead agency may determine that a public health assessment is warranted for that specific technical area. As none of the relevant analyses have yet been completed, the potential for an impact in these analysis areas, and thus potentially to public health, cannot be ruled out at this time. Should the technical analyses conducted for the EIS indicate that significant unmitigated adverse impacts would occur in the areas of air quality, water quality, hazardous materials, or noise, then an assessment of public health will be provided in the EIS following the guidelines presented in the CEQR Technical Manual as part of the mitigation task, as discussed in the Draft Scope of Work.
R. Neighborhood Character As defined in the CEQR Technical Manual, neighborhood character is considered to be an amalgam of the various elements that give a neighborhood its distinct personality. These elements include land use, socioeconomic conditions, open space, urban design and visual resources, historic and cultural resources, transportation, and noise. The Proposed Action is expected to affect one or more of the constituent elements of the rezoning area’s neighborhood character, including land use patterns, socioeconomic conditions, urban design, and levels of traffic and noise. Therefore, as described in the Draft Scope of Work, the EIS will analyze the Proposed Action’s impact on neighborhood character.
S. Construction Impacts Construction impacts, although temporary, can include disruptive and noticeable effects of a project. Determination of their significance and need for mitigation is generally based on the duration and magnitude of the impacts. Construction impacts are usually important when construction activity could affect traffic conditions, archaeological resources, the integrity of historic resources, community noise patterns, and air quality conditions. In addition, because soils are disturbed during construction, any action proposed for a site that has been found to have the potential to contain hazardous materials should also consider the possible construction impacts that could result from contamination. According to the CEQR Technical Manual, multi‐sited projects with overall construction periods lasting longer than two years and which are near to sensitive receptors should undergo a preliminary impact assessment. Therefore, this will be undertaken in the EIS, following the guidelines in the CEQR Technical Manual. The preliminary assessment will evaluate the duration and severity of the disruption or inconvenience to nearby sensitive receptors, specifically regarding traffic conditions, noise, and air quality. If the preliminary assessments indicate the potential for a significant impact during construction, a detailed construction impact analysis will be undertaken and reported in the EIS in accordance with guidelines contained in the CEQR Technical Manual.
APPENDIX A
LPC Environmental Review Letter
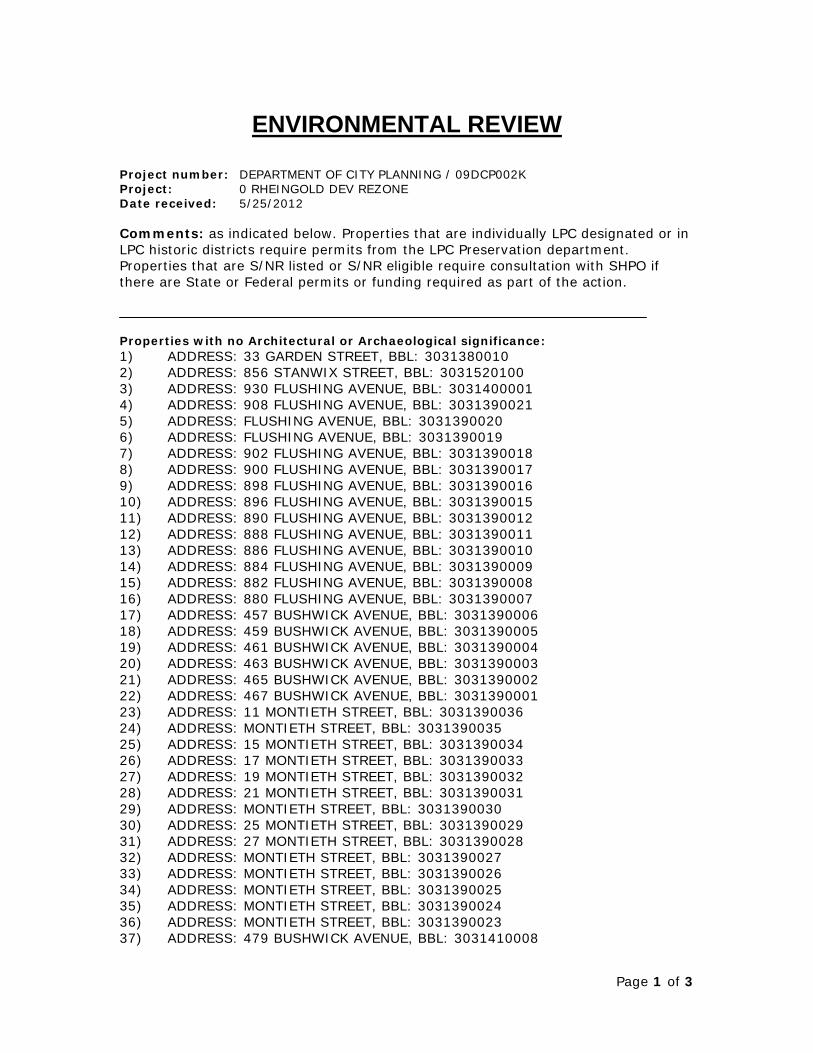
Page 1 of 3
ENVIRONMENTAL REVIEW
Project number: DEPARTMENT OF CITY PLANNING / 09DCP002K Project: 0 RHEINGOLD DEV REZONE Date received: 5/25/2012 Comments: as indicated below. Properties that are individually LPC designated or in LPC historic districts require permits from the LPC Preservation department. Properties that are S/NR listed or S/NR eligible require consultation with SHPO if there are State or Federal permits or funding required as part of the action. Properties with no Architectural or Archaeological significance: 1) ADDRESS: 33 GARDEN STREET, BBL: 3031380010 2) ADDRESS: 856 STANWIX STREET, BBL: 3031520100 3) ADDRESS: 930 FLUSHING AVENUE, BBL: 3031400001 4) ADDRESS: 908 FLUSHING AVENUE, BBL: 3031390021 5) ADDRESS: FLUSHING AVENUE, BBL: 3031390020 6) ADDRESS: FLUSHING AVENUE, BBL: 3031390019 7) ADDRESS: 902 FLUSHING AVENUE, BBL: 3031390018 8) ADDRESS: 900 FLUSHING AVENUE, BBL: 3031390017 9) ADDRESS: 898 FLUSHING AVENUE, BBL: 3031390016 10) ADDRESS: 896 FLUSHING AVENUE, BBL: 3031390015 11) ADDRESS: 890 FLUSHING AVENUE, BBL: 3031390012 12) ADDRESS: 888 FLUSHING AVENUE, BBL: 3031390011 13) ADDRESS: 886 FLUSHING AVENUE, BBL: 3031390010 14) ADDRESS: 884 FLUSHING AVENUE, BBL: 3031390009 15) ADDRESS: 882 FLUSHING AVENUE, BBL: 3031390008 16) ADDRESS: 880 FLUSHING AVENUE, BBL: 3031390007 17) ADDRESS: 457 BUSHWICK AVENUE, BBL: 3031390006 18) ADDRESS: 459 BUSHWICK AVENUE, BBL: 3031390005 19) ADDRESS: 461 BUSHWICK AVENUE, BBL: 3031390004 20) ADDRESS: 463 BUSHWICK AVENUE, BBL: 3031390003 21) ADDRESS: 465 BUSHWICK AVENUE, BBL: 3031390002 22) ADDRESS: 467 BUSHWICK AVENUE, BBL: 3031390001 23) ADDRESS: 11 MONTIETH STREET, BBL: 3031390036 24) ADDRESS: MONTIETH STREET, BBL: 3031390035 25) ADDRESS: 15 MONTIETH STREET, BBL: 3031390034 26) ADDRESS: 17 MONTIETH STREET, BBL: 3031390033 27) ADDRESS: 19 MONTIETH STREET, BBL: 3031390032 28) ADDRESS: 21 MONTIETH STREET, BBL: 3031390031 29) ADDRESS: MONTIETH STREET, BBL: 3031390030 30) ADDRESS: 25 MONTIETH STREET, BBL: 3031390029 31) ADDRESS: 27 MONTIETH STREET, BBL: 3031390028 32) ADDRESS: MONTIETH STREET, BBL: 3031390027 33) ADDRESS: MONTIETH STREET, BBL: 3031390026 34) ADDRESS: MONTIETH STREET, BBL: 3031390025 35) ADDRESS: MONTIETH STREET, BBL: 3031390024 36) ADDRESS: MONTIETH STREET, BBL: 3031390023 37) ADDRESS: 479 BUSHWICK AVENUE, BBL: 3031410008

Page 2 of 3
38) ADDRESS: 481 BUSHWICK AVENUE, BBL: 3031410007 39) ADDRESS: 485 BUSHWICK AVENUE, BBL: 3031410006 40) ADDRESS: 489 BUSHWICK AVENUE, BBL: 3031410005 41) ADDRESS: 501 BUSHWICK AVENUE, BBL: 3031410001 42) ADDRESS: 10 MONTIETH STREET, BBL: 3031410010 43) ADDRESS: MONTIETH STREET, BBL: 3031410011 44) ADDRESS: 14 MONTIETH STREET, BBL: 3031410012 45) ADDRESS: MONTIETH STREET, BBL: 3031410014 46) ADDRESS: MONTIETH STREET, BBL: 3031410015 47) ADDRESS: MONTIETH STREET, BBL: 3031410018 48) ADDRESS: MONTIETH STREET, BBL: 3031410020 49) ADDRESS: 32 MONTIETH STREET, BBL: 3031410021 50) ADDRESS: 34 MONTIETH STREET, BBL: 3031410022 51) ADDRESS: 36 MONTIETH STREET, BBL: 3031410023 52) ADDRESS: STANWIX STREET, BBL: 3031400050 53) ADDRESS: FORREST STREET, BBL: 3031410036 54) ADDRESS: 37 GARDEN STREET, BBL: 3031380007 55) ADDRESS: 35 GARDEN STREET, BBL: 3031380009 56) ADDRESS: 31 GARDEN STREET, BBL: 3031380011 57) ADDRESS: 21 GARDEN STREET, BBL: 3031380013 58) ADDRESS: 19 GARDEN STREET, BBL: 3031380017 59) ADDRESS: 17 GARDEN STREET, BBL: 3031380018 60) ADDRESS: STANWIX STREET, BBL: 3031520001 61) ADDRESS: STANWIX STREET, BBL: 3031520002 62) ADDRESS: 80 EVERGREEN AVENUE, BBL: 3031520003 63) ADDRESS: 94 EVERGREEN AVENUE, BBL: 3031520035 64) ADDRESS: 96 EVERGREEN AVENUE, BBL: 3031520036 65) ADDRESS: EVERGREEN AVENUE, BBL: 3031520037 66) ADDRESS: EVERGREEN AVENUE, BBL: 3031520041 67) ADDRESS: EVERGREEN AVENUE, BBL: 3031520038 68) ADDRESS: MELROSE STREET, BBL: 3031520043 69) ADDRESS: 131 MELROSE STREET, BBL: 3031520044 70) ADDRESS: 127 MELROSE STREET, BBL: 3031520045 71) ADDRESS: 123 MELROSE STREET, BBL: 3031520048 72) ADDRESS: MELROSE STREET, BBL: 3031520056 73) ADDRESS: 107 MELROSE STREET, BBL: 3031520058 74) ADDRESS: MELROSE STREET, BBL: 3031520062 75) ADDRESS: MELROSE STREET, BBL: 3031520063 76) ADDRESS: 95 MELROSE STREET, BBL: 3031520064 77) ADDRESS: MELROSE STREET, BBL: 3031520066 78) ADDRESS: 846 FLUSHING AVENUE, BBL: 3031380020 79) ADDRESS: 848 FLUSHING AVENUE, BBL: 3031380022 80) ADDRESS: 850 FLUSHING AVENUE, BBL: 3031380023 81) ADDRESS: 852 FLUSHING AVENUE, BBL: 3031380024 82) ADDRESS: 854 FLUSHING AVENUE, BBL: 3031380025 83) ADDRESS: 856 FLUSHING AVENUE, BBL: 3031380026 84) ADDRESS: 858 FLUSHING AVENUE, BBL: 3031380027 85) ADDRESS: 860 FLUSHING AVENUE, BBL: 3031380032 86) ADDRESS: 464 BUSHWICK AVENUE, BBL: 3031380036 87) ADDRESS: 468 BUSHWICK AVENUE, BBL: 3031380038 88) ADDRESS: 478 BUSHWICK AVENUE, BBL: 3031380040 89) ADDRESS: 480 BUSHWICK AVENUE, BBL: 3031380041 90) ADDRESS: 40 BEAVER STREET, BBL: 3031370026

Page 3 of 3
91) ADDRESS: 832 FLUSHING AVENUE, BBL: 3031370056 92) ADDRESS: 826 FLUSHING AVENUE, BBL: 3031370049 93) ADDRESS: 828 FLUSHING AVENUE, BBL: 3031370051 Comments: The LPC is in receipt of the revised EAS materials of 5/25/12. LPC concurs with the determination of LPC and S/NR eligibility of the three resources at the edge of the 400’ study area: St. Mark’s Lutheran Church and School; Arion Hall, and P.S. 52. No adverse impacts are anticipated to these properties as a result of this action.
6/6/2012 SIGNATURE DATE Gina Santucci, Environmental Review Coordinator File Name: 7334_FSO_GS_06062012.doc

APPENDIX B
Transportation Planning Factors Memorandum

1
TECHNICAL MEMORANDUM
TO: NYCDCP FROM: Philip Habib & Associates DATE: July 24, 2012 PROJECT: Rheingold Development Rezoning (CEQR# 09DCP002K) RE: Preliminary Transportation Planning Factors (TPF)
This memorandum summarizes the transportation planning factors to be used for the analyses of traffic, parking, transit, and pedestrian conditions for the proposed Rheingold Development Rezoning that would occur in Bushwick, Brooklyn. A preliminary travel demand forecast based on these factors is also presented based on the amount of new travel demand that would be generated. Preliminary traffic and pedestrian assignments for this scenario are provided along with a proposed study area for the transportation analyses. THE PROPOSED ACTION The Proposed Action is for a change to the official City-map to map two new street segments and a zoning map amendment affecting an approximately five block area in Bushwick, Brooklyn, in Community District 4. The proposed rezoning action affects the area bounded by Flushing Avenue on the north and Melrose Street and Forrest Street on the south, between Evergreen Avenue and Garden, Stanwix and Beaver Streets. The applicant is proposing a rezoning of its site within the rezoning area, which consists of all of Blocks 3140, 3141 and Block 3139 lots 18-21 and 23-26 and Block 3152 lots 1-3, 45, 48, 56, 58, 62-64, 66 and 100. In addition to the sites controlled by the applicant, the rezoning would also affect all of Block 3138, the remainder of the lots on Block 3139 and 3152 and lots 26 (portion), 49 (portion), 51 and 56 on Block 3137. The blocks zoned M3-1 would be rezoned M1-2 and the blocks zoned M1-1 would be rezoned R7A and R6A with a C2-4 commercial overlay mapped along portions of the Bushwick, Flushing and Evergreen Avenue frontages to a depth of 100 feet. The proposed action also includes a zoning text amendment, which modifies Section 23-922 of the NYC Zoning Resolution to make the appropriate R6A and R7A districts “Inclusionary Housing designated areas.” This will establish an inclusionary floor area ratio (FAR) bonus, providing opportunity and incentive for the development of affordable housing.
Philip Habib & Associates
Engineers and Planners 102 Madison Avenue New York, NY 10016 212 929 5656 212 929 5605 (fax)

2
The proposed mapping action would map and formally bestow to the City the unbuilt section of Stanwix Street between Montieth Street and Forrest Street and the unbuilt section of Noll Street between Evergreen Avenue and Stanwix Street and open them to public traffic. The proposed project also includes the future installation of a new traffic signal at the intersection of Bushwick Avenue and Noll Street, if warranted, which would be installed by applicant and maintained by New York City Department of Transportation (NYCDOT). PROJECTED DEVELOPMENT Under the reasonable worst-case development scenario (RWCDS), the proposed actions would result in 1,076 dwelling units (DUs) and approximately 81,790 sf of local retail (74,194 sf net) on the projected development sites. Of the 1,076 DUs, 47 units would be set aside for senior housing, however for conservative analysis purposes, all dwelling units would be considered typical. The RWCDS would replace approximately 79,915 sf of warehouse/wholesale, 1,000 sf of auto care, 6,000 sf of local retail (supermarket) and a 1,596 sf gas station, all of which would operate under No Build conditions. PRELIMINARY TRANSPORTATION PLANNING FACTORS Table 1 shows the preliminary transportation planning factors to be used for the travel demand forecast generated by the proposed action in the weekday AM, midday, PM and Saturday midday peak hours. These include trip generation rates, temporal and directional distributions, mode choice factors, vehicle occupancies and truck trip factors for each proposed land use. Table 1 also shows the transportation planning factors for each of the No Build land uses that would be eliminated as part of the proposed action. It should be noted that the vehicular demand for the No Build warehouse/wholesale use is based on vehicle counts conducted at the site in 2006. Although the counts at this site were conducted in 2006, the use has remained the same. However, updated vehicle counts would confirm this vehicular demand. In addition, for conservative analysis purposes, credit for the transit and pedestrian trips generated by the No Build warehouse/wholesale use has not been taken. These transportation planning assumptions were based on standard CEQR criteria, standard professional references, Census data, recent surveys and studies that have been used in previous EASs and EISs for projects with similar uses. TRIP GENERATION Table 2 provides the overall resulting trip generation for the development program for each of the three weekday peak hours for person trips for each mode of transportation and for vehicle trips for autos, taxis and trucks. This table also shows the number of trips generated by the No Build land uses that would be eliminated under Build conditions. Table 2 also shows the net incremental transportation demand when the Build trip generation volumes are combined with the trip generation volumes of the No Build land uses that would be eliminated under Build conditions.

Rheingold Development Rezoning
Existing Uses
Land Use:
Size/Units: 1076 DUs 81,790 gsf 78,915 gsf 1,000 gsf 6,000 gsf 1,596 gsf6 Pump
Trip Generation:WeekdaySaturday
per 1000 gsf
Temporal Distribution:AMMDPMSaturday MD
Modal Splits:AutoTaxiSubwayBusWalkOther
In/Out Splits: In Out In Out In Out In Out In OutAM 15.0% 85.0% 50.0% 50.0% 65.0% 35.0% 61.0% 39.0% 50.0% 50.0%MD 50.0% 50.0% 50.0% 50.0% 50.0% 50.0% 50.0% 50.0% 50.0% 50.0%PM 70.0% 30.0% 50.0% 50.0% 50.0% 50.0% 51.0% 49.0% 50.0% 50.0%Saturday MD 53.0% 47.0% 50.0% 50.0% 50.0% 50.0% 50.0% 50.0% 50.0% 50.0%
Vehicle Occupancy:AutoTaxi
Truck Trip Generation:Weekday Saturday Weekday Saturday Weekday Saturday Weekday Saturday
0.06 0.02 0.35 0.04 0.89 0.01 1.2 0.24
AMMDPMSaturday MD
In Out In Out In Out In Out In OutAM/MD/PM 50.0% 50.0% 50.0% 50.0% 50.0% 50.0% 50.0% 50.0% 50.0% 50.0%
Sources:(1) 2012 CEQR Technical Manual.(2) Retail Industrial Text Amendment FEIS(3) Based on 2005-2009 American Community Survey (ACS) Data for tracts 389, 391, 425 and 487.(4) Greenpoint-Williamsburg Rezoning FEIS, 2004.(5) Based on ITE Trip Generation Manual, 8th Edition, Landuse Code 942 (Automobile Care Center); weekday trip rate data not available,average weekend rate assumed for weekday.(6) Person trip rate = ITE average vehicle trip rate x 1.30/0.95.(7) Admiral Row Plaza EAS, 2011.(8) Based on ITE Trip Generation Manual, 8th Edition, Landuse Code 945 (Gasoline/Service Station with Convenience Market); weekday midday trip rate data not avWeekday PM rate assumed to be the same as weekday midday; Weekend trip rate assumed to be the same as weekday trip rate. (9) Based on Hunts Point Alternative Fueling Facility EAS, August 2011.(10) Vehicular travel demand was based on counts from 2006. Credit for transit and pedestrian trips is not being taken for conservative purposes.Note: Gross floor area numbers are approximate.
(1)
8.0%
(1)
3.0%19.0%10.0%
8.075
per DU
(1)
per DU
(1)
per 1,000 sf
per 1,000 sf
205
(3) (2)
AM/MD/PM
(1)
10.0%5.0%
11.0%
9.6 240
100.0%
1.402.00
(2)
8.0% 10.0%
11.0%2.0%
(1)
12.0%9.0%2.0%
70.0%0.0%
100.0%
14.5%2.1%
(1)
Residential Local Retail AutocareWholesale
(5,6)
19.42
(4)
2.00
(2) (2)
(3)
1.13
12.6% 2.0%AM/MD/PM
1.9%60.3%8.6%
3.0%5.0%
20.0%
(1)
(4)
AM/MD/PM85.0%5.0%1.0%1.0%
2.0%
9.0%1.0%
(4)
(4)
(5)
Supermarket
(1)
175
per 1,000 sf
(1)
8.0%0.0%
19.42 231
(4)
100.0%
1.301.30
per DU
13.2%
14.1%
11.0%14.2%
Build Conditions
Transportation Planning AssumptionsTable 1
per 1,000 sf
(7)
3.0%6.0%7.0%
(7)
(7)
2.002.00
(7)
3.0%5.0%
20.0%70.0%0.0%
100.0%
5.0%6.0%
10.0%
(2)
AM/MD/PM
0.0%2.5%2.5%0.0%0.0%
100.0%
(9)
Gas Station
(8)
194
per pump
(8)
6.2%8.2%8.2%
(9)
194
Warehouse/
(10)
11.0% 9.0% 8.2%
11.0%9.0% 9.0% 5.6% N/AN/A
(3)
1.13N/A
N/Aper 1,000 sf
N/AN/A
AM/MD/PM95.0%

Rheingold Development Rezoning Trip Generation
Land Use:
Size/Units: 1,076 Dus 81,790 gsf -78,915 gsf -1,000 gsf -6,000 gsf -1,596 gsf 1076 Dus 74,194 gsf -78915 gsf -1000 gsf -6000 gsf -1,596 gsf-6 pump -6 pump
Peak Hour Trips:
AMMDPMSMD
Person Trips: Person Trips: TOTALIn Out In Out TOTAL In Out In Out In Out TOTAL In Out
AM Auto 16 93 4 4 117 -1 -1 -1 0 -13 -13 -29 AM Auto 5 83 88Taxi 2 14 6 6 28 0 0 -1 -1 0 0 -2 Taxi 7 19 26Subway 79 445 9 9 543 0 0 -2 -1 0 0 -3 Subway 86 453 539Bus 11 64 38 38 150 0 0 -6 -4 0 0 -11 Bus 42 97 139Walk 19 107 132 132 390 0 0 -22 -14 0 0 -37 Walk 128 225 353Other 3 16 0 0 18 0 0 0 0 0 0 0 Other 3 16 18
Total 130 739 189 189 1246 -2 -1 -32 -20 -13 -13 -80 Total 272 892 1164
MD Auto 27 27 24 24 103 -1 -1 -1 -1 -20 -20 -43 MD Auto 30 30 60Taxi 4 4 36 36 80 0 0 -1 -1 0 0 -2 Taxi 39 39 78Subway 131 131 60 60 381 0 0 -2 -2 -1 -1 -4 Subway 189 189 377Bus 19 19 239 239 515 0 0 -6 -6 -1 -1 -14 Bus 251 251 502Walk 31 31 836 836 1735 0 0 -22 -22 0 0 -44 Walk 846 846 1691Other 5 5 0 0 9 0 0 0 0 0 0 0 Other 5 5 9
Total 217 217 1195 1195 2824 -1 -1 -32 -32 -22 -22 -109 Total 1358 1358 2717
PM Auto 84 36 13 13 146 -1 -1 -1 -1 -20 -20 -44 PM Auto 75 27 101Taxi 13 5 19 19 56 0 0 -2 -2 0 0 -3 Taxi 30 23 53Subway 403 173 31 31 639 0 0 -3 -3 -1 -1 -6 Subway 432 201 633Bus 58 25 126 126 334 0 0 -11 -10 -1 -1 -22 Bus 172 140 312Walk 97 42 440 440 1019 0 0 -37 -36 0 0 -74 Walk 500 446 945Other 14 6 0 0 20 0 0 0 0 0 0 0 Other 14 6 20
Total 669 287 629 629 2213 -1 -1 -54 -51 -22 -22 -152 Total 1222 842 2064
SMD Auto 55 49 15 15 134 -1 -1 -1 -1 -20 -20 -44 SMD Auto 48 42 89Taxi 8 7 22 22 60 0 0 -2 -2 0 0 -4 Taxi 28 28 56Subway 264 234 37 37 572 0 0 -3 -3 -1 -1 -7 Subway 297 267 565Bus 38 33 147 147 366 0 0 -12 -12 -1 -1 -26 Bus 172 168 339Walk 64 56 515 515 1150 0 0 -44 -44 0 0 -87 Walk 535 528 1063Other 9 8 0 0 17 0 0 0 0 0 0 0 Other 9 8 17
Total 438 388 736 736 2299 -1 -1 -62 -62 -22 -22 -171 Total 1090 1040 2130
Vehicle Trips : Vehicle Trips :In Out In Out TOTAL In Out In Out In Out In Out TOTAL
AM Auto (Total) 15 82 2 2 101 -32 -4 -1 -1 0 0 -12 -12 -62 AM Auto (Total) -28 67 39Taxi 2 9 3 3 0 0 0 0 0 0 TaxiTaxi (Bal.) 11 11 6 6 34 0 0 0 0 0 0 0 Taxi (Bal.) 17 17 34Truck 4 4 1 1 10 0 0 0 0 0 0 0 Truck 5 5 10
145 -64 w/Balanced Taxi -6 89 83In Out In Out In Out In Out In Out In Out
MD Auto (Total) 24 24 12 12 72 -18 -18 -1 -1 0 0 -18 -18 -74 MD Auto (Total) -1 -1 -2Taxi 3 3 18 18 0 0 0 0 0 0 TaxiTaxi (Bal.) 6 6 36 36 84 0 0 0 0 0 0 0 Taxi (Bal.) 42 42 84Truck 2 2 2 2 8 0 0 0 0 0 0 0 Truck 4 4 8
165 -75 w/Balanced Taxi 45 45 90In Out In Out In Out In Out In Out In Out
PM Auto (Total) 75 32 6 6 119 -4 -28 -1 -1 -1 -1 -18 -18 -72 PM Auto (Total) 57 -10 47Taxi 9 4 9 9 0 0 -1 -1 0 0 TaxiTaxi (Bal.) 13 13 18 18 62 0 0 -2 -2 0 0 -4 Taxi (Bal.) 29 29 58Truck 0 0 0 0 0 0 0 0 0 0 0 0 Truck 0 0 0
181 -76 w/Balanced Taxi 86 19 105
In Out In Out In Out In Out In Out In Out SMD Auto (Total) 30 26 56SMD Auto (Total) 49 43 7 7 106 -6 -4 -1 -1 -1 -1 -18 -18 -50 Taxi
Taxi 6 5 11 11 0 0 -1 -1 0 0 Taxi (Bal.) 32 32 64Taxi (Bal.) 11 11 23 23 68 0 0 -2 -2 0 0 -4 Truck 1 1 2
Truck 1 1 0 0 2 0 0 0 0 0 0 0 w/Balanced Taxi 63 59 122176 -55
Notes:(1)- 25% linked-trip credit applied to local retail use(2)- Based on ITE Trip Generation Handbook, Second Edition: Landuse Code 945, (Gasoline/Service Station with Convenience Market) AM= 62%, MD=PM=SMD=56pass-by rate credit applied to Gas Station use(3) Vehicular travel demand was based on counts from 2006. Credit for transit and pedestrian trips is not being taken for conservative purpose Saturday numbers were derived from the ratio of weekday and Saturday; based on the ratio from ITE Trip Generation Manua
(3)
(3)
(3)
(3)
Proposed Land Use
869
Residential Local Retail
868
Wholesale Autocare SupermarketResidential Local Retail
(1)
Supermarket
-53
No Build Land Use
-3
Warehouse/Gas Station
-27-42-42
(2)
434956
37723891258 1258
-2-3
-53-63-105
434-3-2-3
Wholesale Autocare
956
3772389 -63
-105
Gas Station
-27-42-42
Table 2
826 1472 -2 -2 -125 -42-125 -42 826 1472
Warehouse/Net Total Increment

3
As shown in Table 2, the proposed action under Build conditions would generate a total net increase of approximately 83, 90, 105, and 122 vehicle trips (in and out combined) in the AM, midday, PM, Saturday midday peak hours, respectively. (Vehicle trips include auto and truck trips, and trips by taxi which have been balanced to reflect that some taxis arrive or depart empty.) Peak hour subway trips would increase by 539, 377, 633, and 565 in the weekday AM, midday, PM, and Saturday midday, respectively. Bus trips would increase by approximately 139, 502, 312, and 339 in the weekday AM, midday, PM, and Saturday midday peak hours, respectively. The proposed action would generate an additional 353, 1,691, 945, and 1,063 pedestrian trips during the weekday AM, midday, PM, and Saturday midday peak hours, respectively. TRAFFIC NETWORK The existing street network in western Bushwick, shown in Figure 1, includes two major two-way arterials – Bushwick Avenue and Flushing Avenue. Bushwick Avenue is a major north-south arterial that carries the heaviest traffic in the study area and the major east-west artery in the study area is Flushing Avenue. The study area has an irregular street pattern which in composed of different grid orientations and discontinuous streets (e.g. Beaver Street in the study area becomes Bushwick Avenue and Stanwix and Noll Streets in the study are both discontinuous). Given this interruption in the center of the street grid, traffic volumes on several local streets are typically lower than on other local streets in the area. In addition to the new housing and retail development, there would be a restructuring of the local street system, including the mapping of new street segments and change in traffic flow direction of selected streets in the study area, which is shown in Figure 2. The proposed action would map and open Stanwix Street from Forrest Street to Montieth Street, making Stanwix Street a north-south street continuous from Bushwick Avenue to Flushing Avenue. Similarly, the mapping and opening of Noll Street from Stanwix Street to Evergreen Avenue would also make that east-west street continuous in the study area. As shown in Table 2, the proposed action under Build conditions would generate a total net increase of approximately 83, 90, 105, and 122 vehicle trips (in and out combined) in the AM, midday, PM, and Saturday midday peak hours, respectively. (Vehicle trips include auto and truck trips, and trips by taxi which have been balanced to reflect that some taxis arrive or depart empty.) Figure 3 shows the primary vehicle assignments to the study network for each of the four peak periods. In addition to the vehicle demand generated by residential and retail, the proposed action’s restructuring of the local street system would result in diversions to existing vehicle trips. Most notably, Stanwix Street would become a one-way southbound, while Noll Street would be one-way westbound. These diversions are shown in Figure 4. The development generated vehicle trips were then combined with the diverted vehicle trips and were assigned to the traffic network to determine what intersections would experience a demand of 50 vehicles or greater during the weekday AM, midday, PM, or Saturday midday peak periods. Figure 5 shows the preliminary assignments of these vehicles for the four peak periods, taking into account the future diversions. As shown in


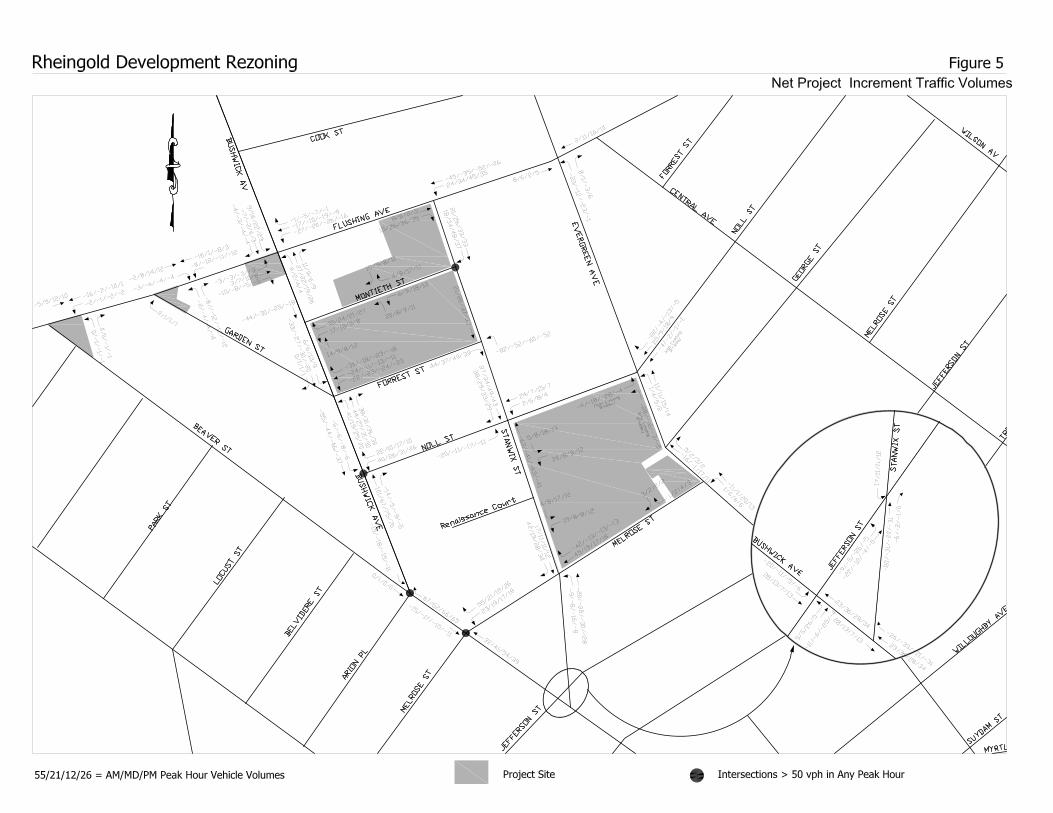

4
the figure, four intersections would have an incremental vehicle assignment of greater than 50 vehicles during one or more of the four peak periods of analysis. Based on this primary assignment, the study area for the proposed rezoning would be comprised of approximately four intersections:
1. Bushwick Avenue & Noll Street 2. Bushwick Avenue & Arion Place\Beaver Street 3. Beaver Street & Melrose Street 4. Stanwix Street & Montieth Street
In addition to manual counts at each of the four intersections that would experience net vehicle increments of 50 vehicles or greater during one or more peak periods, counts would be conducted at the following eleven intersections to confirm/refine the diversions that would occur as a result of the restructuring of the local street system:
1. Bushwick Avenue & Flushing Avenue 2. Bushwick Avenue & Montieth Avenue 3. Bushwick Avenue & Forrest Street 4. Stanwix Street & Melrose Street 5. Flushing Avenue & Evergreen Avenue 6. Flushing Avenue & Stanwix Street 7. Stanwix Street & Noll Street 8. Stanwix Street & Jefferson Street 9. Bushwick Avenue & Jefferson Street 10. Stanwix Street & Bushwick Avenue 11. Evergreen Avenue & Noll Street
The traffic study area was selected to include the intersections most likely to be used by concentrations of project-generated vehicles traveling to and from the proposed rezoning area and is bounded on the north by Flushing Avenue, on the south by Melrose Street, on the east by Evergreen Avenue, and on the west by Bushwick Avenue, and is shown in Figure 6. Figure 6 shows the intersections would be counted and the intersections that would be analyzed. The analysis would include establishing the existing traffic operation characteristics at each analysis intersection including capacities, volume-to-capacity (v/c) ratios, average vehicle delays, and levels of service (LOS) per traffic movement and per intersection approach. The 2000 Highway Capacity Manual procedures will be used. PARKING New development in R6A and R7A zoning districts must provide accessory parking, pursuant to NYC Zoning Resolution requirements. The proposed developments on Sites 1 through 8 would require a minimum of 495 accessory parking spaces. In order to comply with this requirement, 495 accessory parking spaces would be provided across the eight sites: 60 spaces on Site 1, 150 spaces on Site 2, 137 spaces on Site 3, 103 spaces on Site 4, 16 spaces on Site 5, 7 spaces on Site 6, 14 spaces on Site 7, and 8 spaces on Site 8. According to 2000 Census data, the number of vehicles per household in the rezoning area and vicinity is approximately 0.4. This rate is used to forecast peak residential


5
parking demand for the proposed development, as the households on the projected development sites are expected to be generally similar to the existing residential population in terms of vehicle ownership. Using the 0.4 vehicles per DU rate, the proposed development is expected to generate a residential parking demand of approximately 430 spaces. This demand would peak during the overnight period, while parking demand generated by the 81,790 sf of local retail, which is not expected to be substantial, would peak during the day. As the proposed development is expected to provide 495 required accessory parking spaces in eight garage locations on the project site, as required by zoning, all the projected parking demand generated by the proposed project would be accommodated in the proposed garages and there would be an excess of 65 spaces in the overnight. TRANSIT According to the general thresholds used by the Metropolitan Transportation Authority (MTA) and specified in the 2012 CEQR Technical Manual, detailed transit analyses are generally not required if a Proposed Action is projected to result in fewer than 200 peak hour rail or bus transit riders. If a proposed action would result in 50 or more bus passengers being assigned to a single bus line (in one direction), or if it would result in an increase of 200 or more passengers at a single subway station or on a single subway line, a detailed bus or subway analysis would be warranted. Subway There are three subway stations located within a half-mile radius of the proposed rezoning site: Myrtle Avenue Station, which services the J, M and Z lines; Flushing Avenue Station, which provides J and M line service; and Morgan Avenue Station, which provides service for the L line. Figure 7 shows the locations of the three subway stations in relation to the proposed rezoning site. Table 2 shows the preliminary forecast of weekday AM and PM peak hour transit trips for the proposed project. (Transit analyses typically focus on the weekday AM and PM commuter peak hours as it is during these periods that overall demand on the subway and bus systems is usually highest.) As shown in Table 2, it is estimated that the projected development site would generate a total of 539 and 633 new subway trips in the weekday AM and PM peak commuter hours, respectively. A preliminary subway trip assignment was performed to determine which subway stations should be analyzed further. Table 3 shows the assumptions that were made in determining the number of trips each station would generate. As shown in the table, the Myrtle Avenue station and Flushing Avenue station would require further analysis during the AM and PM peak periods because the number of trips this station would generate would exceed the CEQR threshold of 200. As shown in Table 3, 222 and 255 subway trips would be generated at the Myrtle Avenue station and 187 and 230 subway trips would be generated at the Flushing Avenue station in the AM and PM peak hours, respectively.

AM Peak Hour
Percentage Volume Percentage Volume Percentage Volume
1 & 2 231 42.0% 97 58.0% 134 0.0% 0
3, 4 & 5 276 10.0% 28 10.0% 28 80.0% 222
6, 7 & 8 25 0.0% 0 100.0% 25 0.0% 0
Total 532 Total 125 Total 187 Total 222
Midday Peak Hour
Percentage Volume Percentage Volume Percentage Volume
1 & 2 160 42.0% 67 58.0% 93 0.0% 0
3, 4 & 5 178 10.0% 18 10.0% 18 80.0% 142
6, 7 & 8 38 0.0% 0 100.0% 38 0.0% 0
Total 376 Total 85 Total 149 Total 142
PM Peak Hour
Percentage Volume Percentage Volume Percentage Volume
1 & 2 272 42.0% 114 58.0% 158 0.0% 0
3, 4 & 5 319 10.0% 32 10.0% 32 80.0% 255
6, 7 & 8 40 0.0% 0 100.0% 40 0.0% 0
Total 631 Total 146 Total 230 Total 255
SAT MD Peak Hour
Percentage Volume Percentage Volume Percentage Volume
1 & 2 242 42.0% 102 58.0% 140 0.0% 0
3, 4 & 5 285 10.0% 29 10.0% 29 80.0% 228
6, 7 & 8 38 0.0% 0 100.0% 38 0.0% 0
Total 565 Total 131 Total 207 Total 228
Table 3
Sites Subway Trips Generated
Morgan Avenue Station
(L Train)
Flushing Avenue Station
(J & M Trains)
Myrtle Avenue Station
(J, M & Z Trains)
Project Generated Subway Trips (by Station)
Morgan Avenue Station
(L Train)
Flushing Avenue Station
(J & M Trains)
Myrtle Avenue Station
(J, M & Z Trains)Subway Trips GeneratedSites
Sites Subway Trips Generated
Myrtle Avenue Station
Morgan Avenue Station
(L Train)
Sites Subway Trips GeneratedMorgan Avenue Station Flushing Avenue Station
Flushing Avenue Station
(J & M Trains)
Myrtle Avenue Station
(J, M & Z Trains)


6
Bus Within a half-mile radius of the project site, there are eight bus lines; these lines include the B15, B38, B43, B46, B47, B54, B57 and B60. As shown in Table 2, it is estimated that the projected development associated with the proposed rezoning generate a total of 139 and 322 new bus-only trips in the weekday AM and PM peak hours, respectively. Since these trips would be dispersed amongst the eight bus routes within the half-mile radius of the development site, it is not expected that any one route would experience 50 or more trips in one direction in any peak hour; as such, a detailed bus analysis would not be warranted. PEDESTRIANS The Proposed Action would generate a net of approximately 353, 1,691, 945, and 1,063 walk-only trips during the AM, midday, PM, and Saturday midday peak hours, respectively. While it would be expected that walk-only trips generated by the Proposed Action (i.e., walk trips not associated with other modes) would be dispersed among pedestrian facilities throughout the proposed rezoning area, a vast majority of the pedestrian trips would be concentrated on the sidewalks, corners and crosswalks adjacent to the local retail locations on Evergreen, Flushing and Bushwick Avenues. As a result, the pedestrian facilities immediately adjacent to these retail portions of the Proposed Action would experience the highest volumes of pedestrians. Therefore the analyses of pedestrian conditions will focus on the weekday AM, midday, PM, and Saturday midday peak hours. Based on a preliminary pedestrian assignment, 8 corner, 3 crosswalk and 5 sidewalk locations would be analyzed (see Figure 8): Corner Locations
1. Southwest corner of Bushwick Avenue & Flushing Avenue 2. Southeast corner of Bushwick Avenue & Flushing Avenue 3. Northeast corner of Bushwick Avenue & Montieth Street 4. Southeast corner of Bushwick Avenue & Montieth Street 5. Northeast corner of Bushwick Avenue & Forrest Street 6. Southwest corner of Stanwix Street & Flushing Avenue 7. Southwest corner of Evergreen Avenue & Noll Street 8. Northwest corner of Evergreen Avenue & Melrose Street
Crosswalk Locations
1. South crosswalk at Bushwick Avenue & Flushing Avenue 2. South crosswalk at Stanwix Street & Flushing Avenue 3. East crosswalk at Bushwick Avenue & Montieth Street
Sidewalk Locations
1. South sidewalk on Flushing Avenue between Garden Street & Bushwick Avenue 2. South sidewalk on Flushing Avenue between Bushwick Avenue & Stanwix Street 3. East sidewalk on Bushwick Avenue between Flushing Avenue & Montieth Street 4. East sidewalk on Bushwick Avenue between Montieth Street & Forrest Street 5. West sidewalk on Evergreen Avenue between Noll Street & Melrose Street


7
Pedestrian counts will be conducted at the locations listed above, as shown in Figure 8. These corners, crosswalks, and adjoining sidewalks will be evaluated based on the 2012 CEQR Technical Manual criteria.

APPENDIX

SITE 8Residential Local Retail Total Residential Local Retail Residential (Senior) Warehouse total Residential Local Retail Total Residential Local Retail Autocare Total Residential Local Retail Gas Station Total Residential Local Retail Supermarket Total
458 DUs 33068 gsf 518 DUs 21114 gsf DUs -78,915 gsf 37 DUs 8292 gsf 15 DUs 4739 gsf -1000 gsf 29 DUs 9010 gsf -1596 gsf 18 DUs 5568 gsf -6000 gsf-6 pump
Peak Hour Trips:
370 153 522 418 97 0 0 516 30 38 68 12 22 -3 31 23 42 -27 38 15 26 -53 -12 185 966 1151 209 617 0 0 826 15 242 257 6 138 -2 142 12 263 -42 233 7 163 -63 107 407 508 915 460 325 0 0 785 33 127 160 13 73 -3 83 26 139 -42 122 16 86 -105 -3
352 595 947 398 380 0 0 778 28 149 178 12 85 -2 95 22 162 -42 142 14 100 -125 -11
In Out In Out In Out In Out In Out In Out 0 0 In Out In Out In Out In Out In Out In Out In Out In Out In Out In Out In Out In Out In Out In Out In Out In OutAuto 7 40 2 2 9 41 8 45 1 1 0 0 0 0 9 46 1 3 0 0 1 4 0 1 0 0 -1 -1 -1 1 0 3 0 0 -13 -13 -12 -10 0 2 0 0 -1 0 0 1Taxi 1 6 2 2 3 8 1 7 1 1 0 0 0 0 3 8 0 0 1 1 1 1 0 0 0 0 0 0 0 0 0 0 1 1 0 0 1 1 0 0 0 0 -1 -1 -1 0Subway 33 190 4 4 37 193 38 214 2 2 0 0 0 0 40 217 3 15 1 1 4 16 1 6 1 1 0 0 2 7 2 12 1 1 0 0 3 13 1 7 1 1 -2 -1 0 7Bus 5 27 15 15 20 42 5 31 10 10 0 0 0 0 15 40 0 2 4 4 4 6 0 1 2 2 0 0 2 3 0 2 4 4 0 0 4 6 0 1 3 3 -6 -4 -4 0Walk 8 46 53 53 61 99 9 52 34 34 0 0 0 0 43 86 1 4 13 13 14 17 0 1 8 8 0 0 8 9 1 3 15 15 0 0 15 17 0 2 9 9 -22 -14 -13 -4Other 1 7 0 0 1 7 1 7 0 0 0 0 0 0 1 7 0 1 0 0 0 1 0 0 0 0 0 0 0 0 0 0 0 0 0 0 0 0 0 0 0 0 0 0 0 0
Total 55 314 76 76 132 391 63 356 49 49 0 0 0 0 111 404 4 25 19 19 24 45 2 10 11 11 -2 -1 11 20 4 20 21 21 -13 -13 12 28 2 12 13 13 -32 -20 -17 5In Out In Out
Auto 12 12 10 10 21 21 13 13 6 6 0 0 0 0 19 19 1 1 2 2 3 3 0 0 1 1 -1 -1 1 1 1 1 3 3 -20 -20 -17 -17 0 0 2 2 -1 -1 1 1Taxi 2 2 14 14 16 16 2 2 9 9 0 0 0 0 11 11 0 0 4 4 4 4 0 0 2 2 0 0 2 2 0 0 4 4 0 0 4 4 0 0 2 2 -1 -1 2 2Subway 56 56 24 24 80 80 63 63 15 15 0 0 0 0 78 78 5 5 6 6 11 11 2 2 3 3 0 0 5 5 4 4 7 7 -1 -1 10 10 2 2 4 4 -2 -2 5 5Bus 8 8 97 97 105 105 9 9 62 62 0 0 0 0 71 71 1 1 24 24 25 25 0 0 14 14 0 0 14 14 1 1 26 26 -1 -1 26 26 0 0 16 16 -6 -6 10 10Walk 13 13 338 338 352 352 15 15 216 216 0 0 0 0 231 231 1 1 85 85 86 86 0 0 48 48 0 0 49 49 1 1 92 92 0 0 93 93 1 1 57 57 -22 -22 35 35Other 2 2 0 0 2 2 2 2 0 0 0 0 0 0 2 2 0 0 0 0 0 0 0 0 0 0 0 0 0 0 0 0 0 0 0 0 0 0 0 0 0 0 0 0 0 0
Total 92 92 483 483 575 575 105 105 308 308 0 0 0 0 413 413 7 7 121 121 129 129 3 3 69 69 -1 -1 71 71 6 6 132 132 -22 -22 115 115 4 4 81 81 -32 -32 53 53In Out In Out
Auto 36 15 5 5 41 20 41 17 3 3 0 0 0 0 44 21 3 1 1 1 4 3 1 1 1 1 -1 -1 1 0 2 1 1 1 -20 -20 -16 -18 1 1 1 1 -1 -1 1 0Taxi 5 2 8 8 13 10 6 3 5 5 0 0 0 0 11 7 0 0 2 2 2 2 0 0 1 1 0 0 1 1 0 0 2 2 0 0 2 2 0 0 1 1 -2 -2 0 0Subway 172 74 13 13 184 86 194 83 8 8 0 0 0 0 202 91 14 6 3 3 17 9 6 2 2 2 0 0 7 4 11 5 3 3 -1 -1 14 8 7 3 2 2 -3 -3 6 2Bus 24 10 51 51 75 61 28 12 32 32 0 0 0 0 60 44 2 1 13 13 15 14 1 0 7 7 0 0 8 8 2 1 14 14 -1 -1 15 14 1 0 9 9 -11 -10 -1 -1Walk 41 18 178 178 219 196 47 20 114 114 0 0 0 0 160 134 3 1 45 45 48 46 1 1 26 26 0 0 27 26 3 1 48 48 0 0 51 50 2 1 30 30 -37 -36 -6 -5Other 6 3 0 0 6 3 7 3 0 0 0 0 0 0 7 3 0 0 0 0 0 0 0 0 0 0 0 0 0 0 0 0 0 0 0 0 0 0 0 0 0 0 0 0 0 0
Total 285 122 254 254 539 376 322 138 162 162 0 0 0 0 484 300 23 10 64 64 87 74 9 4 36 36 -1 -1 44 39 18 8 69 69 -22 -22 65 55 11 5 43 43 -54 -51 0 -4
Auto 23 21 6 6 29 27 27 24 4 4 0 0 0 0 30 27 2 2 1 1 3 3 1 1 1 1 -1 -1 1 1 1 1 2 2 -20 -20 -17 -17 1 1 1 1 -1 -1 1 1Taxi 4 3 9 9 12 12 4 4 6 6 0 0 0 0 10 9 0 0 2 2 3 2 0 0 1 1 0 0 1 1 0 0 2 2 0 0 3 3 0 0 2 2 -2 -2 0 0Subway 112 100 15 15 127 115 127 113 10 10 0 0 0 0 137 122 9 8 4 4 13 12 4 3 2 2 0 0 6 5 7 6 4 4 -1 -1 11 10 4 4 3 3 -3 -3 4 3Bus 16 14 60 60 76 74 18 16 38 38 0 0 0 0 56 54 1 1 15 15 16 16 1 0 9 9 0 0 9 9 1 1 16 16 -1 -1 17 17 1 1 10 10 -12 -12 -2 -2Walk 27 24 208 208 235 232 31 27 133 133 0 0 0 0 164 160 2 2 52 52 54 54 1 1 30 30 0 0 31 31 2 2 57 57 0 0 58 58 1 1 35 35 -44 -44 -8 -8Other 4 3 0 0 4 3 4 4 0 0 0 0 0 0 4 4 0 0 0 0 0 0 0 0 0 0 0 0 0 0 0 0 0 0 0 0 0 0 0 0 0 0 0 0 0 0
Total 186 165 298 298 484 463 211 187 190 190 0 0 0 0 401 377 15 13 75 75 90 88 6 5 43 43 -1 -1 48 47 12 10 81 81 -22 -22 71 70 7 6 50 50 -62 -62 -5 -6
In Out In Out In Out In Out In Out In Out In Out In Out In Out In Out In Out In Out In Out In Out In Out In Out In Out In Out In Out In Out In Out In Out In Out6 35 1 1 7 36 7 40 0 0 0 0 -32 -4 -25 36 0 3 0 0 1 3 0 1 0 0 -1 -1 -1 1 0 2 0 0 -12 -12 -11 -9 0 1 0 0 0 0 0 11 4 1 1 2 5 1 5 1 1 0 0 0 0 2 6 0 0 0 0 0 0 0 0 0 0 0 0 0 0 0 0 0 0 0 0 0 0 0 0 0 0 0 0 0 05 5 3 3 8 8 6 6 3 3 0 0 0 0 9 9 0 0 0 0 0 0 0 0 0 0 0 0 0 0 0 0 0 0 0 0 0 0 0 0 0 0 0 0 0 02 2 1 1 3 3 2 2 0 0 0 0 0 0 2 2 0 0 0 0 0 0 0 0 0 0 0 0 0 0 0 0 0 0 0 0 0 0 0 0 0 0 0 0 0 0
13 42 6 6 18 47 15 48 4 4 0 0 -32 -4 -13 48 1 3 0 0 1 3 0 1 0 0 -1 -1 -1 1 0 2 0 0 -12 -12 -11 -9 0 1 0 0 0 0 0 1In Out In Out
10 10 5 5 15 15 12 12 3 3 0 0 -18 -18 -3 -3 1 1 1 1 2 2 0 0 1 1 -1 -1 0 0 1 1 1 1 -18 -18 -16 -16 0 0 1 1 0 0 1 11 1 7 7 8 8 1 1 5 5 0 0 0 0 6 6 0 0 2 2 2 2 0 0 1 1 0 0 1 1 0 0 2 2 0 0 2 2 0 0 1 1 0 0 1 13 3 14 14 17 17 3 3 10 10 0 0 0 0 13 13 0 0 4 4 4 4 0 0 2 2 0 0 2 2 0 0 4 4 0 0 4 4 0 0 2 2 0 0 2 21 1 1 1 2 2 1 1 1 1 0 0 0 0 2 2 0 0 0 0 0 0 0 0 0 0 0 0 0 0 0 0 0 0 0 0 0 0 0 0 0 0 0 0 0 0
15 14 20 20 35 35 16 16 14 14 0 0 -18 -18 12 12 1 1 5 5 6 6 0 0 3 3 -1 -1 2 2 1 1 5 5 -18 -18 -12 -12 0 0 3 3 -1 -1 3 3In Out In Out
32 15 3 3 35 17 35 15 2 2 0 0 -4 -28 33 -11 3 1 1 1 4 2 1 1 0 0 -1 -1 0 0 2 1 1 1 -18 -18 -15 -16 1 1 0 0 -1 -1 1 04 2 4 4 8 5 4 2 2 2 0 0 0 0 7 4 0 0 1 1 1 1 0 0 1 1 0 0 1 1 0 0 1 1 0 0 1 1 0 0 1 1 -1 -1 0 07 7 6 6 13 13 6 6 5 5 0 0 0 0 12 12 0 0 2 2 2 2 0 0 2 2 0 0 2 2 0 0 2 2 0 0 2 2 0 0 1 1 -2 -2 0 00 0 0 0 0 0 0 0 0 0 0 0 0 0 0 0 0 0 0 0 0 0 0 0 0 0 0 0 0 0 0 0 0 0 0 0 0 0 0 0 0 0 0 0 0 0
39 21 9 9 47 30 42 22 7 7 0 0 -4 -28 45 1 3 1 2 2 5 3 1 2 2 2 -1 -1 2 3 2 1 3 3 -18 -18 -13 -14 1 1 2 2 -2 -2 0 0
21 18 3 3 24 21 24 21 2 3 0 0 -6 -4 19 21 2 1 1 1 3 2 1 1 0 0 -1 -1 0 0 1 1 1 1 -18 -18 -16 -16 1 1 1 1 -1 -1 1 13 2 4 4 7 7 3 3 3 3 0 0 0 0 6 5 0 0 1 1 1 1 0 0 1 1 0 0 1 1 0 0 1 1 0 0 1 1 0 0 1 1 -1 -1 0 05 5 9 9 14 14 5 5 7 7 0 0 0 0 12 12 0 0 2 2 2 2 0 0 2 2 0 0 2 2 0 0 2 2 0 0 3 3 0 0 2 2 -2 -2 -1 -10 0 0 0 0 0 1 1 0 0 0 0 0 0 1 1 0 0 0 0 0 0 0 0 0 0 0 0 0 0 0 0 0 0 0 0 0 0 0 0 0 0 0 0 0 0
26 24 12 13 38 36 30 28 9 10 0 0 -6 -4 33 34 2 2 3 3 5 5 1 1 2 2 -1 -1 2 2 1 1 3 3 -18 -18 -13 -13 1 1 3 3 -3 -3 0 0
SITE 1 AND 2 SITE 3 AND 4 SITE 5 SITE 6 SITE 7