Embed Size (px)
Citation preview

RHB-GS US Equity Fund
CONTENTS
Page
FUND INFORMATION 1
INVESTMENT OBJECTIVE, STRATEGY AND POLICY 1
MANAGER’S OVERVIEW 1
MANAGER’S REPORT 2 - 5
• Fund Performance Review
• Strategies and Policies
• Asset Allocation
• Market Review
• Market Outlook and Strategy
• Portfolio Structure
• Performance of Fund and Benchmark
• Breakdown of Unitholdings
AUDITED FINANCIAL STATEMENTS AND
NOTES TO THE FINANCIAL STATEMENTS 6 - 29
• Statement of Financial Position
• Statement of Comprehensive Income
• Statement of Changes in Net Asset Value
• Statement of Cash Flows
• Notes to the Financial Statements
REBATES AND SOFT COMMISSION 30
STATEMENT BY MANAGER 30
TRUSTEE’S REPORT 30
INDEPENDENT AUDITORS' REPORT 31 - 32
CORPORATE INFORMATION 33

RHB-GS US Equity Fund
1
FUND INFORMATION
Period of Trust : Subject to occurrence of any events as stated under Clause 11.37 of the Guidelines on
Unit Trust Funds
Fund Category : Feeder Fund
Fund Type : Growth
Relevant Benchmark : S&P 500 Index
Distribution Policy : The Fund is not expected to make any distribution
INVESTMENT OBJECTIVE, STRATEGY
AND POLICY
Investment Objective
• To achieve long term capital appreciation
through investment in a collective investment
scheme, which invests primarily in securities of
United States of America companies.
Investment Strategy and Policy
• As stipulated in the prospectus, RHB-GS US
Equity Fund (“the Fund”) is a feeder fund that
invests in the Goldman Sachs US Equity
Portfolio (“Target Fund”).
• At least 95% of the Fund’s Net Asset Value
(“NAV”) will be invested in the Target Fund,
while up to 5% of the Fund’s NAV will be in
cash and cash equivalents.
• If, in the opinion of the Manager, the Target
Fund no longer meets the investment objective,
and/or in acting in the best interests of
Unitholders, the Manager may replace the
Target Fund with that of another collective
investment scheme that is consistent with the
objective of this Fund, subject always to the
approval of the Unitholders.
MANAGER’S OVERVIEW
We are pleased to present to you the Annual Report
of the RHB-GS US Equity Fund (“the Fund”)
incorporating the Audited Financial Statements for
the financial year ended 30 June 2013.
Based on the audited financial statements, the Net
Asset Value (“NAV”) per unit of the Fund
increased by 19.29% from RM0.5268 as at 30 June
2012 to RM0.6284 on 30 June 2013. The increase
in the NAV per unit mainly resulted from the strong
performance of the United States (“US”) equity
market during the financial year under review. The
number of units in circulation increased from 16.50
million units as at 30 June 2012 to 23.93 million
units as at 30 June 2013.
During the financial year under review, the Fund
registered a gain of 19.31%* compared to 19.99%*
in the S&P 500 Index. The total return since
inception was 25.70%* as compared to the S&P
500 Index return of 30.81%*.
For the financial year under review, the Fund has
met its objective to achieve long term capital
appreciation through investment in a collective
investment scheme, which invests primarily in
securities of the US companies.
* Source: Lipper IM, 18 July 2013

RHB-GS US Equity Fund
2
MANAGER’S REPORT
Fund Performance Review
During the financial year under review, the Fund
returned 19.31%* as compared to the benchmark
return of 19.99%*.
In the financial year under review, the Target Fund
underperformed the S&P 500 (net). Stock selection
within Industrials, Health Care and Materials
holdings contributed to the performance. Stock
selection within the Information Technology,
Energy and Utilities sectors detracted from relative
performance.
* Source: Lipper IM, 18 July 2013
For the financial year under review, the strategy
adopted by the Fund is in line with the disclosure in
the prospectus.
Source: Lipper IM, 18 July 2013
The aforesaid information is for the period from 18 May 2011 (Date of Inception) to 30 June 2013 using
NAV-NAV prices and assuming reinvestment of distributions (if any) for the Fund, gross investment based in
RM.
Past earnings or the Fund’s distribution record is not a guarantee or reflection of the Fund’s future
earnings / future distributions. Investors are advised that unit prices, distributions payable and
investment returns may go down as well as up.

RHB-GS US Equity Fund
3
Strategies and Policies
The Target Fund, Goldman Sachs US Equity Portfolio,
seeks to achieve long-term capital appreciation through
investment in securities of the US companies.
The strategy undertaken by the Manager during the
period under review was of a passive mode, as the Fund
is a feeder fund.
Asset Allocation
Asset Class 30 June 2013 30 June 2012
Collective
investment scheme
- foreign 87.00% 98.67%
Liquid assets and
other net current
assets 13.00% 1.33%
Total 100.00% 100.00%
Holding of liquid assets rose to 13.00% of the NAV as
compared to previous financial period of 1.33%.
Conversely, the level of investment dropped to 87.00%
against 98.67% of the previous financial period. The
higher liquid assets for the financial year under review
is attributable to the creation of units receivable
(amount due from Manager), which has not been
received as at 30 June 2013.
Market Review
In the second quarter of 2013, the US equity market
rose 2.8% as defined by the S&P 500 Index, bringing
year-to-date returns to 13.5%. The S&P 500 Index and
Dow Jones Industrial Averages both reached record
highs driven by the continued rebound in the housing
market and improving consumer confidence. While the
US equity market posted a solid quarter, there was a
pullback in mid-May 2013 when the Federal Reserve
(“Fed”) Chairman Bernanke announced the potential
“tapering” of quantitative easing asset purchases. Equity
markets reacted negatively again in June 2013 on news
that the slowing could begin later this year, with the
programme ending by the middle of 2014 if the
economy grows as expected.
However, markets calmed towards the end of June 2013
as a downward revision of first quarter of 2013 Gross
Domestic Product (“GDP”) from 2.4% to 1.8%,
reassured investors that the Fed would only begin
reducing asset purchases if the economy was clearly on
track.
In China, a sharp spike in interbank lending rates in
June 2013 further pressured global equity markets.
Concerns that the tighter conditions would
exacerbate an already slowing Chinese economy
weakened commodity prices. As a result, the
Materials sector underperformed during the second
quarter of 2013, while Energy stocks were also
weak. The Financials sector significantly
outperformed for the second quarter of 2013.
Market Outlook and Strategy
As we enter the new financial year of the Fund, we
continue to be constructive on the US equity market.
Despite a strong first half of 2013, we believe the
case for investing in US equities remains
compelling. In our view, valuations are reasonable
as the S&P 500 Index is trading below its historical
average price-to-earnings (P/E) multiple and offers
an attractive dividend yield of approximately 2%.
The strength of corporate balance sheets provides
companies with a number of options to enhance
shareholder value going forward.
Signs of improving US economic growth remain
intact, supported by a continued recovery in the US
housing market and consumer confidence.
However, some headwinds do remain given market
concerns about the Fed’s tapering asset purchases
and rising rates, fiscal policy’s drag on growth, and
global weakness. We believe it is important to
recognise that rising rates and advancing equity
markets are not mutually exclusive; equities have the
potential to continue to rise in an increasing rate
environment driven by improving US economic
growth, and given that the absolute level of rates
remains low by historical standards. Additional
catalysts could also improve sentiment and increase
flows into equities.
Our fundamental, bottom-up research process
continues to drive our stock selection, while short-
term “noise” in the market – headlines or sentiment
– enables us to manage position sizes
opportunistically. We have high conviction in the
companies that we own and believe they have the
potential to outperform relative to the broader
market regardless of the growth environment. We
maintain our discipline in identifying what we
believe are well-positioned companies with
defensible franchises, high barriers to entry, and
strong growth prospects, led by quality management
teams.
We believe that these ingredients, combined with
our long-term focus, are the recipe for alpha
generation over time.
RHB-GS US Equity Fund
4
PORTFOLIO STRUCTURE
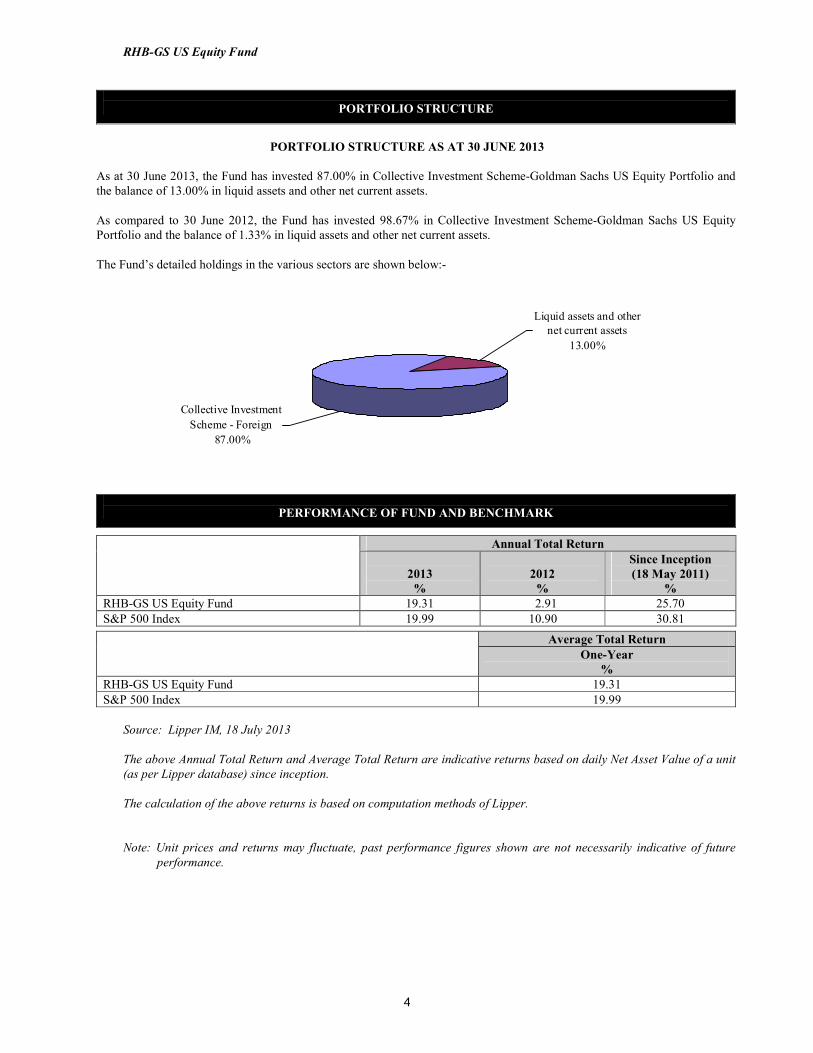
PORTFOLIO STRUCTURE AS AT 30 JUNE 2013
As at 30 June 2013, the Fund has invested 87.00% in Collective Investment Scheme-Goldman Sachs US Equity Portfolio and
the balance of 13.00% in liquid assets and other net current assets.
As compared to 30 June 2012, the Fund has invested 98.67% in Collective Investment Scheme-Goldman Sachs US Equity
Portfolio and the balance of 1.33% in liquid assets and other net current assets.
The Fund’s detailed holdings in the various sectors are shown below:-
PERFORMANCE OF FUND AND BENCHMARK
Annual Total Return
2013
%
2012
%
Since Inception
(18 May 2011)
%
RHB-GS US Equity Fund 19.31 2.91 25.70
S&P 500 Index 19.99 10.90 30.81
Average Total Return
One-Year
%
RHB-GS US Equity Fund 19.31
S&P 500 Index 19.99
Source: Lipper IM, 18 July 2013
The above Annual Total Return and Average Total Return are indicative returns based on daily Net Asset Value of a unit
(as per Lipper database) since inception.
The calculation of the above returns is based on computation methods of Lipper.
Note: Unit prices and returns may fluctuate, past performance figures shown are not necessarily indicative of future
performance.
Collective Investment
Scheme - Foreign
87.00%
Liquid assets and other
net current assets
13.00%

RHB-GS US Equity Fund
5
Other Performance Data
Performance Data 30 June 2012 30 June 2013
Portfolio Composition (%)
Collective Investment Scheme - Foreign 98.67 87.00
Liquid assets and other net current assets 1.33 13.00
Total Portfolio Holdings 100.00 100.00
Net Asset Value (RM) 8,690,682 15,037,375
Units in Circulation 16,497,000 23,929,000
Net Asset Value Per Unit (RM) 0.5268 0.6284
Net Asset Value per unit – Highest (RM) 0.5438 0.6401
Net Asset Value per unit – Lowest (RM) 0.4187 0.5200
Management Expense Ratio (%) 2.26 2.15^
Portfolio Turnover Ratio (Times) 1.03 0.74#
Total Return (%) 5.36* 19.31*
Return on Capital (%) 5.36* 19.31*
Return on Income (%) -* -*
S&P 500 Index (%) 9.02* 19.99*
^ The decrease in the Management Expense Ratio was due to the decrease in total expenses of the Fund for the
financial year ended 30 June 2013.
# The lower Portfolio Turnover Ratio for the financial year ended 30 June 2013 was a reflection of lower trading
activities post restructuring of the portfolio, in which the restructuring is a tactical move to hold more cash.
* Source: Lipper IM, 18 July 2013
BREAKDOWN OF UNITHOLDINGS AS AT 30 JUNE 2013
Size of Holdings
Unitholders Unitholdings
Number % (’000) units %
5,000 and below 5 33.33 12 0.05
5,001 to 10,000 - - 5 0.02
10,001 to 50,000 2 13.34 50 0.21
50,001 to 500,000 3 20.00 613 2.56
500,001 and above 5 33.33 23,249 97.16
Total* 15 100.00 23,929 100.00
*Note: Including Manager's Stock.

RHB-GS US Equity Fund
6
AUDITED FINANCIAL STATEMENTS AND
NOTES TO THE FINANCIAL STATEMENTS
STATEMENT OF FINANCIAL POSITION
AS AT 30 JUNE 2013
Note 30.06.2013 30.06.2012
RM RM
ASSETS
Financial assets at fair value
through profit or loss 5 13,082,105 8,574,848
Deposits with a licensed financial institution 6 868,263 139,023
Bank balance 6 2,522 3,880
Amount due from Manager 1,122,061 - � � � � � � � � � � � � � � � � � �
TOTAL ASSETS 15,074,951 8,717,751 � � � � � � � � � � � � � � � � � �
LIABILITIES
Accrued management fee 20,786 13,353
Amount due to Trustee 4,283 2,716
Other payables and accruals 7 12,507 11,000 � � � � � � � � � � � � � � � � � �
TOTAL LIABILITIES 37,576 27,069 � � � � � � � � � � � � � � � � � �
NET ASSET VALUE 15,037,375 8,690,682 � � � � � � � � � � � � � � � � � �
UNITHOLDERS’ FUNDS
Unitholders’ capital 8 12,357,725 7,488,620
Retained earnings 2,679,650 1,202,062 � � � � � � � � � � � � � � � � � �
15,037,375 8,690,682 � � � � � � � � � � � � � � � � � �
UNITS IN CIRCULATION 8 23,929,000 16,497,000 � � � � � � � � � � � � � � � � � �
NET ASSET VALUE PER UNIT 0.6284 0.5268 � � � � � � � � � � � � � � � � � �
The notes on pages 10 to 29 form an integral part of these financial statements.

RHB-GS US Equity Fund
7
STATEMENT OF COMPREHENSIVE INCOME
FOR THE FINANCIAL YEAR ENDED 30 JUNE 2013
Financial period
from 28.06.2010
(date of
constitution)
Note 2013 to 30.06.2012
RM RM
INVESTMENT INCOME
Interest income from deposits with a licensed
financial institution 12,044 22,796
Net gain on financial assets at fair value
through profit or loss (“FVTPL”) 5 1,678,895 1,487,476
Net foreign currency exchange (loss)/gain (34,967) 16,271
� � � � � � � � � � � � � � � �
1,655,972 1,526,543 � � � � � � � � � � � � � � � �
EXPENSES
Management fee 9 (152,997) (297,427)
Trustee’s fee 10 (10,000) (15,000)
Audit fee (6,000) (6,000)
Tax agent’s fee (7,100) (5,000)
Other expenses (2,287) (1,054) � � � � � � � � � � � � � � � �
(178,384) (324,481) � � � � � � � � � � � � � � � �
Profit before taxation 1,477,588 1,202,062
Taxation 11 - - � � � � � � � � � � � � � � � �
Profit after taxation and total comprehensive
income for the financial year/period 1,477,588 1,202,062 � � � � � � � � � � � � � � � �
Profit after taxation is made up as follows:
Realised amount 443,677 501,042
Unrealised amount 1,033,911 701,020 � � � � � � � � � � � � � � � �
1,477,588 1,202,062 � � � � � � � � � � � � � � � �
The notes on pages 10 to 29 form an integral part of these financial statements.

RHB-GS US Equity Fund
8
STATEMENT OF CHANGES IN NET ASSET VALUE
FOR THE FINANCIAL YEAR ENDED 30 JUNE 2013
Unitholders’ Retained Total net
capital earnings asset value
RM RM RM
Balance as at 28 June 2010
(date of constitution) - - -
Movement in net asset value:
Total comprehensive income
for the financial period - 1,202,062 1,202,062
Creation of units arising
from applications 22,233,302 - 22,233,302
Cancellation of units (14,744,682) - (14,744,682) � � � � � � � � � � � � � � � � � � � � � � � � � � �
Balance as at 30 June 2012 7,488,620 1,202,062 8,690,682 � � � � � � � � � � � � � � � � � � � � � � � � � � �
Balance as at 1 July 2012 7,488,620 1,202,062 8,690,682
Movement in net asset value:
Total comprehensive income
for the financial year - 1,477,588 1,477,588
Creation of units arising
from applications 12,680,082 - 12,680,082
Cancellation of units (7,810,977) - (7,810,977) � � � � � � � � � � � � � � � � � � � � � � � � � � �
Balance as at 30 June 2013 12,357,725 2,679,650 15,037,375 � � � � � � � � � � � � � � � � � � � � � � � � � � �
The notes on pages 10 to 29 form an integral part of these financial statements.

RHB-GS US Equity Fund
9
STATEMENT OF CASH FLOWS
FOR THE FINANCIAL YEAR ENDED 30 JUNE 2013
Financial period
from 28.06.2010
(date of
constitution)
Note 2013 to 30.06.2012
RM RM
CASH FLOWS FROM OPERATING ACTIVITIES
Proceeds from sale of investment 5,003,566 11,566,723
Purchase of investment (7,831,929) (18,654,095)
Interest received from deposits with a licensed
financial institution 12,044 22,796
Management fee paid (145,564) (284,074)
Trustee’s fee paid (8,433) (12,284)
Payment for other fees and expenses (13,879) (1,054)
Net realised foreign exchange (loss)/gain (34,967) 16,271 � � � � � � � � � � � � � � � � � �
Net cash used in operating activities (3,019,162) (7,345,717) � � � � � � � � � � � � � � � � � �
CASH FLOWS FROM FINANCING ACTIVITIES
Cash proceeds from units created 11,558,021 22,233,302
Payment for cancellation of units (7,810,977) (14,744,682) � � � � � � � � � � � � � � � � � �
Net cash generated from financing activities 3,747,044 7,488,620 � � � � � � � � � � � � � � � � � �
Net increase in cash and cash equivalents 727,882 142,903
Cash and cash equivalents at the beginning
of the financial year/date of constitution 142,903 - � � � � � � � � � � � � � � � � � �
Cash and cash equivalents at the end
of the financial year/period 870,785 142,903 � � � � � � � � � � � � � � � � � �
Cash and cash equivalents comprise:
Deposits with a licensed financial institution 6 868,263 139,023
Bank balance 6 2,522 3,880 � � � � � � � � � � � � � � � � � �
870,785 142,903 � � � � � � � � � � � � � � � � � �
The notes on pages 10 to 29 form an integral part of these financial statements.

RHB-GS US Equity Fund
10
NOTES TO THE FINANCIAL STATEMENTS – 30 JUNE 2013
1 THE FUND, THE MANAGER AND THEIR PRINCIPAL ACTIVITIES
The RHB-GS US Equity Fund (hereinafter referred to as “the Fund”) was constituted pursuant to the execution of
a Sixth Supplemental Master Deed dated 28 June 2010 between RHB Investment Management Sdn Bhd (“the
Manager”), TMF Trustees Malaysia Berhad (formerly known as Equity Trust (Malaysia) Berhad) (“the Trustee”)
and the registered Unitholders of the Fund. The Fund is governed by a Master Deed dated 12 June 2008 and
subsequent Supplemental Master Deeds (collectively referred to as “the Deeds”).
The Fund was launched on 18 May 2011 and will continue its operations until terminated as provided under
Clause 4 of the Master Deed.
The principal activity of the Fund is to invest in ‘Permitted Investments’ as defined under Item 15 of Schedule 14
of Annexure 1 of the Sixth Supplemental Master Deed, which comprises one collective investment scheme (local
or foreign) provided it is not a fund-of-funds or a feeder fund or any sub-fund of an umbrella fund which is a
fund-of-funds or a feeder fund, deposits and money market instruments and any other form of investments as may
be approved by the relevant authorities from time to time. The Fund is a feeder fund that invests in the Goldman
Sachs US Equity Portfolio, a “Target Fund” that managed by Goldman Sachs Asset Management International, as
defined under Item 18 of Schedule 14 of Annexure 1 of the Sixth Supplemental Master Deed.
If, in the opinion of the Manager, the Target Fund no longer meets the Fund’s investment objective, and/or in
acting in the best interests of Unitholders, the Manager may replace the Target Fund with that of another
collective investment scheme that is consistent with the objective of this Fund, subject always to the approval of
the Unitholders.
All investments will be subject to the Securities Commission’s (“SC”) Guidelines on Unit Trust Funds, SC
requirements, the Deeds, except where exemptions or variations have been approved by the SC, internal policies
and procedures and objective of the Fund.
The main objective of the Fund is to seek to achieve long-term capital appreciation through investment in a
collective investment scheme, which invests primarily in securities of United States of America companies.
The Manager, a company incorporated in Malaysia, is a wholly-owned subsidiary of RHB Investment Bank
Berhad, effective 6 January 2003. Its principal activities include rendering of investment management services to
institutions, trust funds, pension and retirement funds, insurance funds, private clients, management of unit trust
funds and provision of investment advisory services.
2 SUMMARY OF SIGNIFICANT ACCOUNTING POLICIES
2.1 Basis of preparation of the financial statements
The financial statements have been prepared under the historical cost convention except as disclosed in this
summary of significant accounting policies, and in accordance with Malaysian Financial Reporting Standards
(“MFRS”) and International Financial Reporting Standards (“IFRS”).
The financial statements for the financial year ended 30 June 2013 are prepared in accordance with MFRS,
including MFRS 1 ‘First-time adoption of MFRS’. The Fund has consistently applied the same accounting
policies in its opening MFRS statement of financial position at 28 June 2010 (date of constitution) and
throughout all years presented, as if these policies had always been in effect. Note 17 discloses the impact of the
transition to MFRS on the Fund's reported financial position, financial performance and cash flows.

RHB-GS US Equity Fund
11
2 SUMMARY OF SIGNIFICANT ACCOUNTING POLICIES (CONTINUED)
2.1 Basis of preparation of the financial statements (continued)
The preparation of financial statements in conformity with MFRS requires the use of certain critical accounting
estimates and assumptions that affect the reported amounts of assets and liabilities and disclosure of contingent
assets and liabilities at the date of the financial statements, and the reported amounts of revenues and expenses
during the reported period. It also requires the Manager to exercise their judgment in the process of applying the
Fund’s accounting policies. Although these estimates and judgment are based on the Manager’s best knowledge
of current events and actions, actual results may differ.
(a) The new standards and amendments to published standards which are relevant to the Fund but not yet
effective and have not been early adopted are as follows:
(i) Financial year beginning on 1 July 2013
• Amendment to MFRS 7 “Financial instruments: Disclosures” (effective from 1 January 2013)
requires more extensive disclosures focusing on quantitative information about recognised financial
instruments that are offset in the statement of financial position and those that are subject to master
netting or similar arrangements irrespective of whether they are offset. This amendment does not
have any impact on the Fund’s financial statements.
• MFRS 13 “Fair value measurement” (effective from 1 January 2013) aims to improve consistency
and reduce complexity by providing a precise definition of fair value and a single source of fair
value measurement and disclosure requirements for use across MFRSs. The requirements do not
extend the use of fair value accounting but provide guidance on how it should be applied where its
use is already required or permitted by other standards. The enhanced disclosure requirements are
similar to those in MFRS 7 “Financial instruments: Disclosures”, but apply to all assets and
liabilities measured at fair value, not just financial ones. The Fund will apply this standard when
effective. This standard is not expected to have a significant impact on the Fund’s financial
statements.
(ii) Financial year beginning on 1 July 2014
• Amendment to MFRS 132 “Financial instruments: Presentation” (effective from 1 January 2014)
does not change the current offsetting model in MFRS 132. It clarifies the meaning of ‘currently has
a legally enforceable right of set-off’ that the right of set-off must be available today (not contingent
on a future event) and legally enforceable for all counterparties in the normal course of business. It
clarifies that some gross settlement mechanisms with features that are effectively equivalent to net
settlement will satisfy the MFRS 132 offsetting criteria. This amendment does not have any impact
on the Fund’s financial statements.
(iii) Financial year beginning on 1 July 2015
• MFRS 9 “Financial instruments - classification and measurement of financial assets and financial
liabilities” (effective from 1 January 2015) replaces the multiple classification and measurement
models in MFRS 139 with a single model that has only two classification categories: amortised cost
and fair value. The basis of classification depends on the entity’s business model for managing the
financial assets and the contractual cash flow characteristics of the financial asset.

RHB-GS US Equity Fund
12
2 SUMMARY OF SIGNIFICANT ACCOUNTING POLICIES (CONTINUED)
2.1 Basis of preparation of the financial statements (continued)
(a) The new standards and amendments to published standards which are relevant to the Fund but not yet
effective and have not been early adopted are as follows: (continued)
(iii) Financial year beginning on 1 July 2015 (continued)
• The accounting and presentation for financial liabilities and for de-recognising financial instruments
has been relocated from MFRS 139, without change, except for financial liabilities that are
designated at fair value through profit or loss (“FVTPL”). Entities with financial liabilities
designated at FVTPL recognise changes in the fair value due to changes in the liability’s credit risk
directly in other comprehensive income (“OCI”). There is no subsequent recycling of the amounts
in OCI to profit or loss, but accumulated gains or losses may be transferred within equity.
The guidance in MFRS 139 on impairment of financial assets and hedge accounting continues to
apply. MFRS 7 requires disclosures on transition from MFRS 139 to MFRS 9. The Fund will apply
this standard when effective. This standard is not expected to have a significant impact on the
Fund’s financial statements.
2.2 Financial assets
Classification
Financial assets are designated as fair value through profit or loss when they are managed and their performance
evaluated on a fair value basis.
The Fund designates its investment in collective investment scheme as financial assets at fair value through profit
or loss at inception. Loans and receivables are non-derivative financial assets with fixed or determinable payments that are not quoted
in an active market and have been included in current assets. The Fund’s loans and receivables comprise cash
and cash equivalents and amount due from Manager which are all due within 12 months.
Recognition and measurement
Regular purchases and sales of financial assets are recognised on the trade date, the date on which the Fund
commits to purchase or sell the asset. Investments are initially recognised at fair value. Transaction costs are
expensed in the statement of comprehensive income. Subsequent to initial recognition, financial assets at fair
value through profit or loss are measured at fair value.
Transaction costs are costs incurred to acquire or dispose financial assets or liabilities at fair value through profit
or loss. They include fees and commissions paid to agents, advisors, brokers and dealers. Transaction costs, when
incurred, are immediately recognised in the statement of comprehensive income as expenses.
Financial assets are de-recognised when the rights to receive cash flows from the investments have expired or
have been transferred and the Fund has transferred substantially all risks and rewards of ownership.
Unrealised gains or losses arising from changes in the fair value of the ‘financial assets at fair value through
profit or loss’ category including the effects of currency translation are presented in the statement of
comprehensive income in the financial year/period in which they arise.

RHB-GS US Equity Fund
13
2 SUMMARY OF SIGNIFICANT ACCOUNTING POLICIES (CONTINUED)
2.2 Financial assets (continued)
Recognition and measurement (continued)
Collective investment schemes are valued based on the last published net asset value per unit or share of such
collective investment schemes at each reporting period.
Deposits with licensed financial institutions are stated at cost plus accrued interest calculated on the effective
interest method over the period from the date of placement to the date of maturity of the respective deposits.
Loans and receivables are subsequently carried at amortised cost using the effective interest method.
Impairment of financial assets
For assets carried at amortised cost, the Fund assesses at the end of the reporting period whether there is
objective evidence that a financial asset or group of financial assets is impaired. A financial asset or a group of
financial assets is impaired and impairment losses are incurred only if there is objective evidence of impairment
as a result of one or more events that occurred after the initial recognition of the asset (a ‘loss event’) and that
loss event (or events) has an impact on the estimated future cash flows of the financial asset or group of financial
assets that can be reliably estimated.
The amount of the loss is measured as the difference between the asset’s carrying amount and the present value of
estimated future cash flows (excluding future credit losses that have not been incurred) discounted at the financial
asset’s original effective interest rate. The asset’s carrying amount of the asset is reduced and the amount of the
loss is recognised in statement of comprehensive income. If ‘loans and receivables’ or a ‘held-to-maturity
investment’ has a variable interest rate, the discount rate for measuring any impairment loss is the current
effective interest rate determined under the contract. As a practical expedient, the Fund may measure impairment
on the basis of an instrument’s fair value using an observable market price.
If, in a subsequent period, the amount of the impairment loss decreases and the decrease can be related
objectively to an event occurring after the impairment was recognised (such as an improvement in the debtor’s
credit rating), the reversal of the previously recognised impairment loss is recognised in profit or loss. When an
asset is uncollectible, it is written off against the related allowance account. Such assets are written off after all
the necessary procedures have been completed and the amount of the loss has been determined.
2.3 Financial liabilities
Financial liabilities are classified according to the substance of the contractual arrangements entered into and the
definitions of a financial liability.
Financial liabilities, within the scope of MFRS 139, are recognised in the statement of financial position when,
and only when, the Fund becomes a party to the contractual provisions of the financial instrument.
The Fund’s financial liabilities which include accrued management fee, amount due to Trustee and other payables
and accruals are recognised initially at fair value plus directly attributable transaction costs and subsequently
measured at amortised cost using the effective interest method.
A financial liability is de-recognised when the obligation under the liability is extinguished. Gains and losses are
recognised in the profit or loss when the liabilities are de-recognised, and through the amortisation process.

RHB-GS US Equity Fund
14
2 SUMMARY OF SIGNIFICANT ACCOUNTING POLICIES (CONTINUED)
2.4 Creation and cancellation of units
The Fund issues cancellable units, which are cancelled at the unitholder’s option and are classified as equity.
Cancellable units can be put back to the Fund at any time for cash equal to a proportionate share of the Fund’s
net asset value. The outstanding units are carried at the redemption amount that is payable at each reporting
period if the unitholder exercises the right to put the unit back to the Fund.
Units are created and cancelled at the unitholder’s option at prices based on the Fund’s net asset value per unit at
the time of creation or cancellation. The Fund’s net asset value per unit is calculated by dividing the total net
asset value with the total number of outstanding units.
2.5 Unitholders’ capital
The unitholders’ contributions to the Fund meet the definition of puttable instruments classified as equity
instruments under the revised MFRS 132 “Financial Instruments: Presentation”.
The units in the Fund are puttable instruments which entitle the unitholders to a pro-rata share of the net asset
value of the Fund. The units are subordinated and have identical features. There is no contractual obligation to
deliver cash or another financial asset other than the obligation on the Fund to repurchase the units. The total
expected cash flows from the units in the Fund over the life of the units are based on the change in the net asset
value of the Fund.
2.6 Income recognition
Interest income from deposits with licensed financial institutions is recognised on an accrual basis using the
effective interest method.
Realised gain or loss on sale of the collective investment scheme is arrived at after accounting for cost of
investments, determined on the weighted average cost method.
2.7 Taxation
Current tax expense is determined according to Malaysian tax laws and includes all taxes based upon the taxable
income earned during the financial year/period. Tax on income distribution from foreign collective investment
scheme is based on the tax regime of the respective country that the Fund invests in.
2.8 Cash and cash equivalents
For the purpose of the statement of cash flows, cash and cash equivalents comprise bank balances and deposits
with a licensed financial institution that are readily convertible to known amounts of cash and which are subject
to an insignificant risk of changes in value.
2.9 Presentation and functional currency
Items included in the financial statements of the Fund are measured using the currency of the primary economic
environment in which the Fund operates (the “functional currency”). The financial statements are presented in
Ringgit Malaysia, which is the Fund’s presentation and functional currency.

RHB-GS US Equity Fund
15
2 SUMMARY OF SIGNIFICANT ACCOUNTING POLICIES (CONTINUED)
2.10 Foreign currency translation
Foreign currency transactions in the Fund are accounted for at exchange rates prevailing at the transaction dates.
Foreign currency monetary assets and liabilities are translated at exchange rates prevailing at the reporting date.
Exchange differences arising from the settlement of foreign currency transactions and from the translation of
foreign currency monetary assets and liabilities are recognised in the statement of comprehensive income.
2.11 Segmental information
A business segment is a group of assets and operations engaged in providing products or services that are subject
to risks and returns that are different from those of other business segments. A geographic segment is engaged in
providing products or services within a particular economic environment that are subject to risks and returns that
are different from those of segments operating in other economic environments.
Operating segments are reported in a manner consistent with the internal reporting used by the chief operating
decision-maker. The operating results are regularly reviewed by the Manager and the Investment Committee.
The Investment Committee assumes the role of chief operating decision maker, for performance assessment
purposes and to make decisions about resources allocated to the investment segment based on the
recommendation by the Investment Strategic Sub-Committee.
2.12 Fair value of financial instruments
Financial instruments comprise financial assets and financial liabilities. Fair value is the amount at which a
financial asset could be exchanged or a financial liability settled, between knowledgeable and willing parties in
an arm’s length transaction.
3 FINANCIAL RISK MANAGEMENT OBJECTIVES AND POLICIES
The Fund is exposed to a variety of risks, which include investment manager risk, market risk, price risk,
currency risk, interest rate risk, liquidity risk, credit risk, regulatory risk, risk of substantial redemptions,
suspension of net asset value calculation/limitation of redemption payments, non-compliance risk and capital
risk.
Financial risk management is carried out through internal control processes adopted by the Manager and
adherence to the investment restrictions as stipulated in the SC Guidelines on Unit Trust Funds.
Investment manager risk
As the Fund invests at least 95% of its net asset value in the Target Fund, it is subject to risk associated with the
investment manager of the Target Fund. This is the risk associated with the following:
(i) The risk that the investment manager may underperform the target or the benchmark of the Target Fund due
to the investment manager making poor forecasts of the performances of securities, asset classes or markets;

RHB-GS US Equity Fund
16
3 FINANCIAL RISK MANAGEMENT OBJECTIVES AND POLICIES (CONTINUED)
Investment manager risk (continued)
(ii) The risk of non-adherence to the investment objectives, strategy and policies of the Target Fund, which may
occur due to system failure or the inadvertence of the investment manager; and
(iii) The risk of direct or indirect losses resulting from inadequate or failed operational and administrative
processes, systems and people.
The Manager has no control over the investment manager’s investment strategy, techniques and capabilities,
operational controls and management of the Target Fund. Any mismanagement of the Target Fund may
negatively affect the net asset value of the Fund. In the event of such occurrence, the Manager would seek an
alternative investment manager and/or other target fund that is consistent with the objective of the Fund.
Market risk
The value of the instruments in which the Target Fund invests, may go up or down in response to the prospects of
individual companies and/or prevailing economic conditions. Movement of overseas markets may also have an
impact on the local markets.
Price risk
Price risk is the risk that the fair value of an investment of the Fund will fluctuate because of changes in market
prices (other than those arising from interest rate risk).
The Fund’s overall exposure to price risk was as follows:
30.06.2013 30.06.2012
RM RM
Financial assets at fair value through profit or loss 13,082,105 8,574,848 � � � � � � � � � � � � � � � �
The table below summarises the sensitivity of the Fund’s net asset value and profit after tax to movements in
prices of investments. The analysis is based on the assumption that the price of the investments fluctuates by 5%
with all other variables held constant.
Change in price of
investment
%
Market value
RM
Impact on
profit after tax and
net asset value
RM
30.06.2013
-5 12,428,000 (654,105)
0 13,082,105 -
5 13,736,210 654,105
� � � � � � � � � � � � � � � � � � � � � � � � � � �
30.06.2012
-5 8,146,106 (428,742)
0 8,574,848 -
5 9,003,590 428,742
� � � � � � � � � � � � � � � � � � � � � � � � � � �
RHB-GS US Equity Fund
17
3 FINANCIAL RISK MANAGEMENT OBJECTIVES AND POLICIES (CONTINUED)
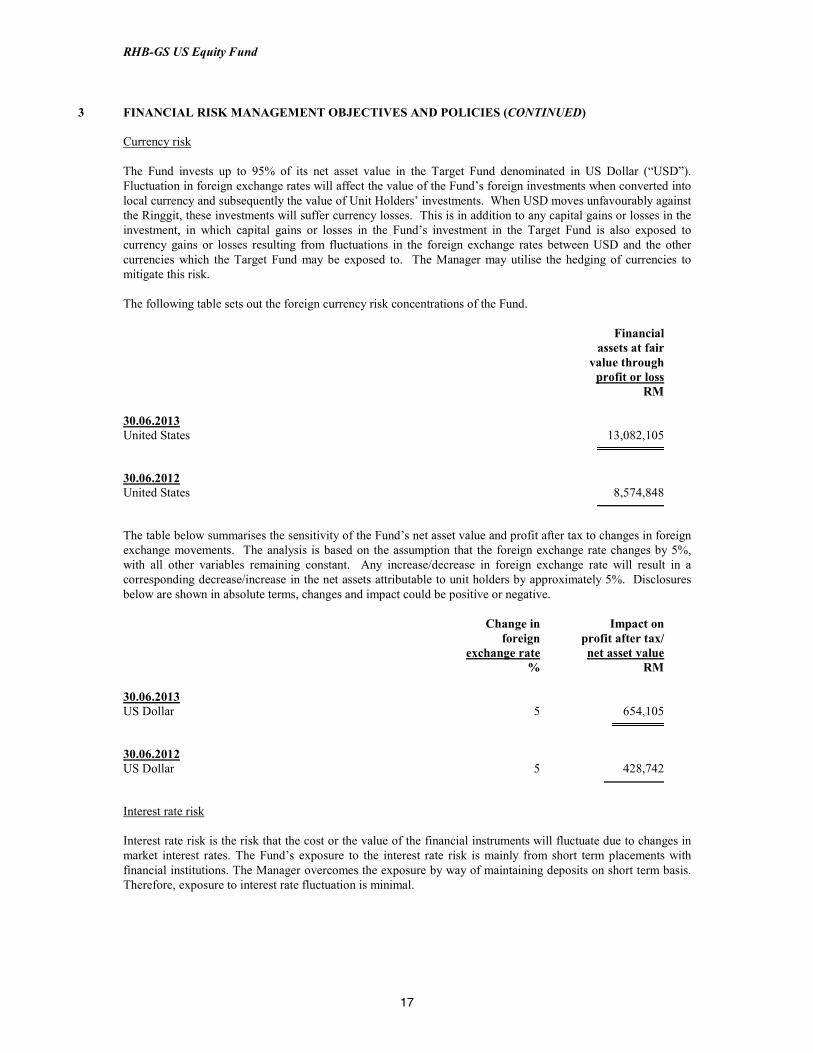
Currency risk
The Fund invests up to 95% of its net asset value in the Target Fund denominated in US Dollar (“USD”).
Fluctuation in foreign exchange rates will affect the value of the Fund’s foreign investments when converted into
local currency and subsequently the value of Unit Holders’ investments. When USD moves unfavourably against
the Ringgit, these investments will suffer currency losses. This is in addition to any capital gains or losses in the
investment, in which capital gains or losses in the Fund’s investment in the Target Fund is also exposed to
currency gains or losses resulting from fluctuations in the foreign exchange rates between USD and the other
currencies which the Target Fund may be exposed to. The Manager may utilise the hedging of currencies to
mitigate this risk.
The following table sets out the foreign currency risk concentrations of the Fund.
Financial
assets at fair
value through
profit or loss
RM
30.06.2013
United States 13,082,105 � � � � � � � � �
30.06.2012
United States 8,574,848 � � � � � � � � �
The table below summarises the sensitivity of the Fund’s net asset value and profit after tax to changes in foreign
exchange movements. The analysis is based on the assumption that the foreign exchange rate changes by 5%,
with all other variables remaining constant. Any increase/decrease in foreign exchange rate will result in a
corresponding decrease/increase in the net assets attributable to unit holders by approximately 5%. Disclosures
below are shown in absolute terms, changes and impact could be positive or negative.
Change in Impact on
foreign profit after tax/
exchange rate net asset value
% RM
30.06.2013
US Dollar 5 654,105 � � � � � � �
30.06.2012
US Dollar 5 428,742 � � � � � � � �
Interest rate risk
Interest rate risk is the risk that the cost or the value of the financial instruments will fluctuate due to changes in
market interest rates. The Fund’s exposure to the interest rate risk is mainly from short term placements with
financial institutions. The Manager overcomes the exposure by way of maintaining deposits on short term basis.
Therefore, exposure to interest rate fluctuation is minimal.

RHB-GS US Equity Fund
18
3 FINANCIAL RISK MANAGEMENT OBJECTIVES AND POLICIES (CONTINUED)
Liquidity risk
The liquidity risk that exists at the Fund level is associated with the inability of the Target Fund to meet large
redemption in a timely manner. In the event of large redemption request that would result in the total redemption
shares in the Target Fund to be more than 10% of the shares in the Target Fund or a particular share class of the
Target Fund, part or all of such requests for redemption may be deferred for a period typically not exceeding ten
Target Fund business days.
The Fund maintains sufficient level of liquid assets, after consultation with the Trustee, to meet anticipated
payments and cancellations of units by unitholders. Liquid assets comprise bank balance, deposits with licensed
financial institutions and other financial assets which are capable of being converted into cash within 7 days.
The table below summarises the Fund’s financial liabilities into relevant maturity groupings based on the
remaining period from the statement of financial position date to the contractual maturity date. The amounts in
the table are the contractual undiscounted cash flows.
Between
Less than 1 month
1 month to 1 year
RM RM
30.06.2013
Accrued management fee 20,786 -
Amount due to Trustee 4,283 -
Other payables and accruals - 12,507 � � � � � � � � � � � � � � � �
25,069 12,507 � � � � � � � � � � � � � � � �
30.06.2012
Accrued management fee 13,353 -
Amount due to Trustee 2,716 -
Other payables and accruals - 11,000 � � � � � � � � � � � � � � � �
16,069 11,000 � � � � � � � � � � � � � � � �
Credit risk
Credit risk refers to the ability of an issuer or a counter party to make timely payments of interest, principals and
proceeds from realisation of investments.
The credit risk arising from placements of deposits in licensed financial institutions is managed by ensuring that
the Fund will only place deposits in reputable licensed financial institutions. The settlement terms of the
proceeds from the creation of units receivable from the Manager are governed by the SC Guidelines on Unit
Trust Funds.

RHB-GS US Equity Fund
19
3 FINANCIAL RISK MANAGEMENT OBJECTIVES AND POLICIES (CONTINUED)
Credit risk (continued)
Analysis of cash and cash equivalents and other financial assets by rating agency designation are as follows:
Cash and
cash
equivalents
RM
Other
financial
assets*
RM
Total
RM
30.06.2013
Financial institutions:
- AAA 2,522 - 2,522
- A1 868,263 - 868,263
Others - 1,122,061 1,122,061
870,785 1,122,061 1,992,846
30.06.2012
Financial institutions:
- AAA 3,880 - 3,880
- A1 139,023 - 139,023
142,903 - 142,903
* Comprise amount due from Manager
The financial assets of the Fund are neither past due nor impaired.
Regulatory risk
Any changes in national policies and regulations may have an effect on the capital markets in which the Target
Fund is investing. If this occurs, there is a possibility that the unit price of the Fund may be adversely affected.
Risk of substantial redemptions
Substantial redemptions of shares within a limited period of time could require the Target Fund to liquidate
positions more rapidly than would otherwise be desirable, which could adversely affect the value of the shares of
the Target Fund. This risk may be exacerbated where an investment with a fixed life or where investments
utilising hedging techniques is made by the Target Fund.
Suspension of net asset value calculation/limitation of redemption payments
The umbrella fund may in certain circumstances temporarily suspend the determination of the net asset value per
share of the Target Fund or a specific share class of the Target Fund and the issue, redemption or exchange of
shares or a particular share class in the Target Fund.
As further described in the Target Fund prospectus, if on any given date requests for redemption of shares relate
to more than 10% of the shares in the Target Fund or a particular share class of the Target Fund, part or all of
such requests for redemption may be deferred for a period typically not exceeding ten Target Fund business days.

RHB-GS US Equity Fund
20
3 FINANCIAL RISK MANAGEMENT OBJECTIVES AND POLICIES (CONTINUED)
Non-compliance risk
This is the risk of the Manager not complying with the internal policies, the Deeds of the Fund, all applicable
laws or guidelines issued by the regulators. Such situation may occur resulting from system failure or the
inadvertence of the Manager. The magnitude of such risk and its impact on the Fund and/or unitholders are
dependent on the nature and severity of the non-compliance. For example, non-compliance may adversely affect
the investment of the Fund especially if the investment of the Fund has to be disposed at a lower price to rectify
the non-compliance.
Capital risk
The capital of the Fund is represented by equity consisting of unitholders’ capital and retained earnings. The
amount of equity can change significantly on a daily basis as the Fund is subject to daily subscriptions and
redemptions at the discretion of shareholders. The Fund’s objective when managing capital is to safeguard the
Fund’s ability to continue as a going concern in order to provide returns for shareholders and benefits for other
stakeholders and to maintain a strong capital base to support the development of the investment activities of the
Fund.
4 FAIR VALUE ESTIMATION
The fair value of financial assets and liabilities traded in active market (such as publicly traded derivatives and
trading securities) are based on quoted market prices at the close of trading on the year end date. The quoted
market price used for financial assets by the Fund is the current bid price; the appropriate quoted market price for
financial liabilities is the current asking price.
A financial instrument is regarded as quoted in an active market if quoted prices are readily and regularly
available from an exchange, dealer, broker, industry group, pricing service, or regulatory agency, and those
prices represent actual and regularly occurring market transactions on an arm’s length basis.
The fair value of financial assets and liabilities that are not traded in an active market is determined by using
valuation techniques. The Fund uses a variety of methods and makes assumptions that are based on market
conditions existing at each year end date. Valuation techniques used for non-standardised financial instruments
such as options, currency swaps and other over-the-counter derivatives, include the use of comparable recent
arm’s length transactions, reference to other instruments that are substantially the same, discounted cash flow
analysis, option pricing models and other valuation techniques commonly used by market participants making the
maximum use of market inputs and relying as little as possible on entity-specific inputs.
For instruments for which there is no active market, the Fund may use internally developed models, which are
usually based on valuation methods and techniques generally recognised as standard within the industry.
Valuation models are used primarily to value unlisted equity, debt securities and other debt instruments for which
market were or have been inactive during the financial period. Some of the inputs to these models may not be
market observable and are therefore estimated based on assumptions.
The output of a model is always an estimate or approximation of a value that cannot be determined with certainty,
and valuation techniques employed may not fully reflect all factors relevant to the positions the Fund holds.
Valuations are therefore adjusted, where appropriate, to allow for additional factors including model risk,
liquidity risk and counterparty risk.

RHB-GS US Equity Fund
21
4 FAIR VALUE ESTIMATION (CONTINUED)
The carrying value less impairment of receivables and payables are assumed to approximate their fair values. The
fair value of financial liabilities for disclosure purposes is estimated by discounting the future contractual cash
flows at the current market interest rate that is available to the Fund for similar financial instruments.
The fair values are based on the following methodologies and assumptions:
(i) Bank balance and deposits and placements with financial institutions with maturities less than 1 year, the
carrying value is a reasonable estimate of fair value.
(ii) The carrying value less impairment of receivables and payables are assumed to approximate their fair
values. The carrying values of financial assets and financial liabilities approximate their fair values due to
their short term nature.
Fair value hierarchy
MFRS 7 “Financial Instruments: Disclosures” requires the Fund to classify fair value measurements using a fair
value hierarchy that reflects the significance of the inputs used in making the measurements. The fair value
hierarchy has the following levels:
• Level 1: Quoted prices (unadjusted) in active market for identical assets or liabilities
• Level 2: Inputs other than quoted prices included within level 1 that are observable for the asset or liability,
either directly (that is, as prices) or indirectly (that is, derived from prices)
• Level 3: Inputs for the asset and liability that are not based on observable market data (that is, unobservable
inputs)
The level in the fair value hierarchy within which the fair value measurement is categorised in its entirety is
determined on the basis of the lowest level input that is significant to the fair value measurement in its entirety.
For this purpose, the significance of an input is assessed against the fair value measurement in its entirety. If a
fair value measurement uses observable inputs that require significant adjustment based on unobservable inputs,
that measurement is a level 3 measurement. Assessing the significance of a particular input to the fair value
measurement in its entirety requires judgment, considering factors specific to the asset or liability.
The determination of what constitutes ‘observable’ requires significant judgment by the Fund. The Fund
considers observable data to be that market data that is readily available, regularly distributed or updated, reliable
and verifiable, not proprietary, and provided by independent sources that are actively involved in the relevant
market.
The following table analyses within the fair value hierarchy the Fund’s financial assets (by class) measured at fair
value:
Level 1 Level 2 Level 3 Total
RM RM RM RM
30.06.2013
Financial assets at fair value
through profit or loss at inception
- Collective investment scheme 13,082,105 - - 13,082,105 � � � � � � � � � � � � � � � � � � � � � � � � � � � � � � � � � �
30.06.2012
Financial assets at fair value
through profit or loss at inception
- Collective investment scheme 8,574,848 - - 8,574,848 � � � � � � � � � � � � � � � � � � � � � � � � � � � � � � � � � �

RHB-GS US Equity Fund
22
4 FAIR VALUE ESTIMATION (CONTINUED)
Fair value hierarchy (continued)
Investment in collective investment scheme, i.e. unit trust fund whose values are based on published prices in
active markets is classified within Level 1. The Fund does not adjust the quoted prices for these instruments.
The Fund’s policies on valuation of these financial assets are stated in Note 2.2.
5 FINANCIAL ASSETS AT FAIR VALUE THROUGH PROFIT OR LOSS
30.06.2013 30.06.2012
RM RM Financial assets designated as FVTPL:
- collective investment scheme - foreign 13,082,105 8,574,848 � � � � � � � � � � � � � � � � � �
Financial period
from 28.06.2010
(date of
constitution)
2013 to 30.06.2012
RM RM
Net gain on financial assets at FVTPL comprised:
- net realised gain on sale of financial assets at FVTPL 602,395 627,473
- net realised foreign currency exchange gain 42,589 158,983
- unrealised gain on change in fair value 931,911 395,789
- unrealised gain on change in foreign currency exchange 102,000 305,231 � � � � � � � � � � � � � � � � � � 1,678,895 1,487,476
� � � � � � � � � � � � � � � � � �
Financial assets designated as FVTPL as at 30 June 2013 are as follows:
Fair value
as at 30.06.2013
Fair value expressed as a
as at percentage of
Quantity Name of Counter Cost 30.06.2013 value of the Fund
RM RM % COLLECTIVE INVESTMENT
SCHEME - FOREIGN 324,601 Goldman Sachs US Equity Portfolio 11,347,174 13,082,105 87.00 � � � � � � � � � � � � � �
EXCESS OF FAIR VALUE
OVER COST:
- UNREALISED FAIR VALUE
GAIN 1,327,700
- UNREALISED FOREIGN
EXCHANGE GAIN 407,231 � � � � � � � � �
TOTAL FINANCIAL ASSETS
AT FVTPL 13,082,105 � � � � � � � � �

RHB-GS US Equity Fund
23
5 FINANCIAL ASSETS AT FAIR VALUE THROUGH PROFIT OR LOSS (CONTINUED)
Financial assets designated as FVTPL as at 30 June 2012 are as follows:
Fair value
as at 30.06.2012
Fair value expressed as a
as at percentage of
Quantity Name of Counter Cost 30.06.2012 value of the Fund
RM RM %
COLLECTIVE INVESTMENT
SCHEME - FOREIGN
263,283 Goldman Sachs US Equity Portfolio 7,873,828 8,574,848 98.67 � � � � � � � � � � � � � �
EXCESS OF FAIR VALUE
OVER COST:
- UNREALISED FAIR VALUE
GAIN 395,789
- UNREALISED FOREIGN
EXCHANGE GAIN 305,231 � � � � � � � � �
TOTAL FINANCIAL ASSETS
AT FVTPL 8,574,848 � � � � � � � � �
6 CASH AND CASH EQUIVALENTS
30.06.2013 30.06.2012
RM RM
Deposits with a licensed financial institution 868,263 139,023
Bank balance 2,522 3,880 � � � � � � � � � � � � � � � �
870,785 142,903 � � � � � � � � � � � � � � � �
Deposits with a licensed financial institution include interest receivable of RM263 (30.06.2012: RM23).
30.06.2013 30.06.2012
Weighted average effective interest rate 2.97% 2.98% � � � � � � � � � � � � � � � �
Average maturity 1 day 4 days � � � � � � � � � � � � � � � �

RHB-GS US Equity Fund
24
7 OTHER PAYABLES AND ACCRUALS
30.06.2013 30.06.2012
RM RM
Audit fee payable 6,000 6,000
Tax agent's fee payable 6,400 5,000
Sundry payables and accruals 107 - � � � � � � � � � � � � � � � �
12,507 11,000 � � � � � � � � � � � � � � � �
8 NUMBER OF UNITS IN CIRCULATION AND UNITHOLDERS’ CAPITAL
Financial period from
28.06.2010
(date of constitution)
2013 to 30.06.2012
Units RM Units RM
At the beginning of the financial
period/date of constitution 16,497,000 7,488,620 - -
Creation of units arising from
applications during the financial
year/period 21,225,000 12,680,082 45,183,000 22,233,302
Cancellation of units during
the financial year/period (13,793,000) (7,810,977) (28,686,000) (14,744,682) � � � � � � � � � � � � � � � � � � � � � � � � � � � � � � � � � � � � � �
At the end of the financial year/period 23,929,000 12,357,725 16,497,000 7,488,620 � � � � � � � � � � � � � � � � � � � � � � � � � � � � � � � � � � � � � �
Approved size of the Fund 200,000,000 200,000,000 � � � � � � � � � � � � � � � � � � � �
The maximum number of units that can be issued out for circulation is 200,000,000 (30.06.2012: 200,000,000).
As at 30 June 2013, the number of units yet to be issued is 176,071,000 (30.06.2012: 183,503,000).
9 MANAGEMENT FEE
Item 10 of Schedule 14 of Annexure 1 of the Sixth Supplemental Master Deed provides that the Manager shall be
entitled to a fee at a rate agreed between the Manager and the Trustee which the rate shall not exceed 3.0% per
annum of the net asset value of the Fund, calculated on a daily basis.
The management fee provided in the financial statements is 1.85% (2012: 1.85%) per annum based on the net
asset value of the Fund, calculated on a daily basis for the financial year/period.
There will be no further liability to the Manager in respect of management fee other than the amount recognised
above.

RHB-GS US Equity Fund
25
10 TRUSTEE’S FEE
Item 11 of Schedule 14 of Annexure 1 of the Sixth Supplemental Master Deed provides that the Trustee shall be
entitled to a fee at a rate agreed between the Manager and the Trustee which the rate shall not exceed 0.20% per
annum of the net asset value of the Fund, calculated on a daily basis; subject to a minimum fee of RM18,000 per
annum.
The Trustee’s fee provided in the financial statements is 0.08% (2012: 0.08%) per annum based on the net asset
value of the Fund, calculated on a daily basis for the financial year/period; subject to a minimum fee of
RM18,000 per annum. However, Trustee has agreed to charge its fee at a minimum of RM10,000 (2012:
RM15,000) for the financial year/period.
There will be no further liability to the Trustee in respect of Trustee’s fee other than the amount recognised
above.
11 TAXATION
(a) Tax charge for the financial year/period
Financial period
from 28.06.2010
(date of
constitution)
2013 to 30.06.2012
RM RM
Current taxation - - � � � � � � � � � � � � � � � �
(b) Numerical reconciliation of income tax expense
The numerical reconciliation between the profit before taxation multiplied by the Malaysian statutory
income tax rate and the tax expense of the Fund is as follows:
Financial period
from 28.06.2010
(date of
constitution)
2013 to 30.06.2012
RM RM
Profit before taxation 1,477,588 1,202,062 � � � � � � � � � � � � � � � �
Tax calculated at a tax rate of 25% 369,397 300,515
Tax effects of:
- Income not subject to tax (413,993) (381,636)
- Expenses not deductible for tax purposes 4,655 5,264
- Restriction on tax deductible expenses
for unit trust funds 39,941 75,857 � � � � � � � � � � � � � � � �
Tax expense - - � � � � � � � � � � � � � � � �

RHB-GS US Equity Fund
26
12 MANAGEMENT EXPENSE RATIO (“MER”)
Financial period
from 28.06.2010
(date of
constitution)
2013 to 30.06.2012
% %
MER 2.15 2.26 � � � � � � � � � � � � � � � �
Management expense ratio includes management fee, Trustee’s fee, audit fee, tax agent's fee and other
administrative expenses which is calculated as follows:
MER = (A + B + C + D + E) x 100
F
A = Management fee
B = Trustee’s fee
C = Audit fee
D = Tax agent's fee
E = Other expenses
F = Average net asset value of the Fund for the financial year/period, calculated on a daily basis
The average net asset value of the Fund for the financial year/period, calculated on a daily basis is RM8,286,770
(2012: RM14,332,568).
13 PORTFOLIO TURNOVER RATIO
Financial period
from 28.06.2010
(date of
constitution)
2013 to 30.06.2012
The portfolio turnover ratio for the financial year/period (times) 0.74 1.03 � � � � � � � � � � � �
The portfolio turnover ratio is derived from the following calculation:
(Total acquisition for the financial year/period + total disposal for the financial year/period) ÷ 2
Average net asset value of the Fund for the financial year/period calculated on a daily basis
where:
total acquisition for the financial year/period = RM7,831,929 (2012: RM18,654,095)
total disposal for the financial year/period = RM4,358,582 (2012: RM10,780,267)
RHB-GS US Equity Fund
27
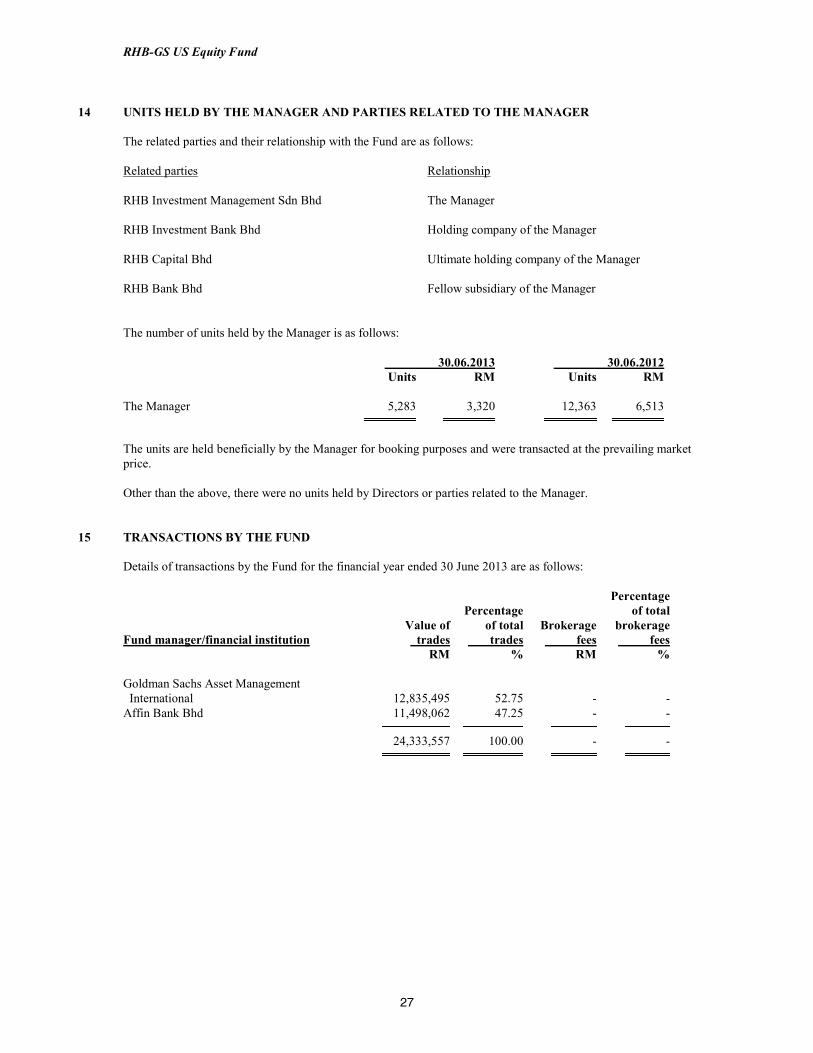
14 UNITS HELD BY THE MANAGER AND PARTIES RELATED TO THE MANAGER
The related parties and their relationship with the Fund are as follows:
Related parties Relationship
RHB Investment Management Sdn Bhd The Manager
RHB Investment Bank Bhd Holding company of the Manager
RHB Capital Bhd Ultimate holding company of the Manager
RHB Bank Bhd Fellow subsidiary of the Manager
The number of units held by the Manager is as follows:
30.06.2013 30.06.2012
Units RM Units RM
The Manager 5,283 3,320 12,363 6,513 � � � � � � � � � � � � � � � � � � � � � � � � � � � �
The units are held beneficially by the Manager for booking purposes and were transacted at the prevailing market
price.
Other than the above, there were no units held by Directors or parties related to the Manager.
15 TRANSACTIONS BY THE FUND
Details of transactions by the Fund for the financial year ended 30 June 2013 are as follows:
Percentage
Percentage of total
Value of of total Brokerage brokerage
Fund manager/financial institution trades trades fees fees
RM % RM %
Goldman Sachs Asset Management
International 12,835,495 52.75 - -
Affin Bank Bhd 11,498,062 47.25 - - � � � � � � � � � � � � � � � � � � � � � � � � � � � � �
24,333,557 100.00 - - � � � � � � � � � � � � � � � � � � � � � � � � � � � � �

RHB-GS US Equity Fund
28
15 TRANSACTIONS BY THE FUND (CONTINUED)
Details of transactions by the Fund for the financial period ended 30 June 2012 are as follows:
Percentage
Percentage of total
Value of of total Brokerage brokerage
Fund manager/financial institution trades trades fees fees
RM % RM %
Goldman Sachs Asset Management
International 30,220,818 50.23 - -
Affin Bank Bhd 22,031,704 36.62 - -
RHB Bank Bhd* 7,915,000 13.15 - - � � � � � � � � � � � � � � � � � � � � � � � � � � � � �
60,167,522 100.00 - - � � � � � � � � � � � � � � � � � � � � � � � � � � � � �
* Included in transactions by the Fund are transactions conducted on normal terms in the finance industry with
RHB Bank Bhd, a fellow subsidiary of the Manager.
16 SEGMENT INFORMATION
The Investment Strategic Sub-Committee of the Manager recommends strategic resource allocations of the Fund
to the Investment Committee of the Manager (collectively referred to as "Committee"). The Investment
Committee of the Manager will then endorse the strategic decision recommended by the Investment Strategic
Sub-Committee for adoption on behalf of the Fund. The operating segments are determined based on the
recommendation by the Investment Strategic Sub-Committee and reviewed by the Investment Committee.
The internal reporting provided to the Committee for the Fund’s assets, liabilities and performance is prepared on
a consistent basis with the measurement and recognition principles of MFRS. The Committee considers the
business from both a geographic and investment perspective. Geographically, the Committee considers the
performance of investment in collective investment scheme in the United States of America.
The Committee is responsible for the Fund's entire portfolio and considers the business to have a single operating
segment. The Committee’s asset allocation decisions are based on a single, integrated investment strategy and
the Fund’s performance is evaluated on an overall basis.
The reportable operating segments derive their income by seeking investments to achieve targeted returns
commensurate with an acceptable level of risk within each portfolio. These returns consist of interest and gains
on the appreciation in the value of investments.
There were no changes in the reportable segments during the financial year.

RHB-GS US Equity Fund
29
17 TRANSITION FROM FRS TO MFRS
Effective 1 July 2012, the Fund adopted MFRS 1 ‘First-time adoption of MFRS’ (effective 1 January 2012) for
the financial year ended 30 June 2013. The financial statements of the Fund for the financial year ended 30 June
2013 are prepared in accordance with MFRS, including MFRS 1 ‘First-time adoption of MFRS’. The Fund has
consistently applied the same accounting policies in its opening MFRS statement of financial position at 28 June
2010 (date of constitution) and throughout all years presented, as if these policies had always been in effect.
(a) MFRS 1 mandatory exceptions
Estimates
MFRS estimates as at transition date is consistent with the estimates as at the same date made in
conformity with FRS.
(b) Explanation of transition from FRS to MFRS
Transition from FRS to MFRS does not have any significant impact on the financial statements of the
Fund.

RHB-GS US Equity Fund
30
REBATES AND SOFT COMMISSION
Dealings on investments of the Fund through brokers or dealers will be on terms which are best available for the
Fund. Any rebates from brokers or dealers will be directed to the account of the Fund.
The Fund Manager may only receive soft commission in the form of research and advisory services that assist in
the decision-making process relating to the Fund’s investments.
During the financial year under review, the Manager did not receive or utilise any soft commission from
brokers/dealers in consideration for directing dealings in the investment of the Fund. However, in the event the
Manager were to receive any soft commission in the future, these will only be retained by the Manager if they are
in the form of goods and services which are of demonstrable benefit to the unitholders as per the requirements of
Clause 11.34 of the Securities Commission’s Guidelines on Unit Trust Funds.
STATEMENT BY MANAGER
We, Patrick Chin Yoke Chung and Dato’ Othman bin Jusoh, two of the Directors of RHB Investment
Management Sdn Bhd, do hereby state that in the opinion of the Directors of the Manager, the accompanying
financial statements set out on pages 6 to 29 are drawn up in accordance with the provisions of the Deeds and
give a true and fair view of the financial position of the Fund as at 30 June 2013 and of its results, changes in net
asset value and cash flows of the Fund for the financial year ended on that date in accordance with Malaysian
Financial Reporting Standards and International Financial Reporting Standards.
On behalf of the Manager
PATRICK CHIN YOKE CHUNG DATO’ OTHMAN BIN JUSOH
DIRECTOR DIRECTOR
Kuala Lumpur Kuala Lumpur
15 August 2013 15 August 2013
TRUSTEE’S REPORT
We have acted as Trustee of RHB-GS US Equity Fund (“the Fund”) for the financial year ended 30 June 2013.
To the best of our knowledge, RHB Investment Management Sdn Bhd (“the Management Company”), has
operated and managed the Fund in accordance with the following:-
(a) limitations imposed on the investment powers of the Management Company and the Trustee under the Deeds,
the Securities Commission’s Guidelines on Unit Trust Funds, the Capital Markets and Services Act 2007 and
other applicable laws;
(b) valuation/pricing is carried out in accordance with the Deeds and any regulatory requirements; and
(c) creation and cancellation of units are carried out in accordance with the Deeds and any regulatory
requirements.
For TMF TRUSTEES MALAYSIA BERHAD
(Company No: 610812-W)
SHU WAI LING
DIRECTOR – FUND SERVICES
Kuala Lumpur
15 August 2013

RHB-GS US Equity Fund
31
INDEPENDENT AUDITORS’ REPORT TO THE UNITHOLDERS OF
RHB-GS US EQUITY FUND
REPORT ON THE FINANCIAL STATEMENTS
We have audited the financial statements of RHB-GS US Equity Fund on pages 6 to 29, which comprise the
statement of financial position as at 30 June 2013 of the Fund, and the statements of comprehensive income,
changes in net asset value and cash flows of the Fund for the year then ended, and a summary of significant
accounting policies and other explanatory notes, as set out on Notes 1 to 17.
Manager’s Responsibility for the Financial Statements
The Manager of the Fund is responsible for the preparation of financial statements so as to give a true and fair
view in accordance with Malaysian Financial Reporting Standards and International Financial Reporting
Standards, and for such internal control as the Manager determines are necessary to enable the preparation of
financial statements that are free from material misstatement, whether due to fraud or error.
Auditors’ Responsibility
Our responsibility is to express an opinion on these financial statements based on our audit. We conducted our
audit in accordance with approved standards on auditing in Malaysia. Those standards require that we comply
with ethical requirements and plan and perform the audit to obtain reasonable assurance whether the financial
statements are free from material misstatement.
An audit involves performing procedures to obtain audit evidence about the amounts and disclosures in the
financial statements. The procedures selected depend on our judgment, including the assessment of risks of
material misstatement of the financial statements, whether due to fraud or error. In making those risk
assessments, we consider internal control relevant to the Fund’s preparation of financial statements that give a
true and fair view in order to design audit procedures that are appropriate in the circumstances, but not for the
purpose of expressing an opinion on the effectiveness of the Manager’s internal control. An audit also includes
evaluating the appropriateness of accounting policies used and the reasonableness of accounting estimates made
by the Manager, as well as evaluating the overall presentation of the financial statements.
We believe that the audit evidence we have obtained is sufficient and appropriate to provide a basis for our audit
opinion.
Opinion
In our opinion, the financial statements have been properly drawn up in accordance with Malaysian Financial
Reporting Standards and International Financial Reporting Standards so as to give a true and fair view of the
financial position of the Fund as of 30 June 2013 and of its financial performance and cash flows for the year
then ended.

RHB-GS US Equity Fund
32
INDEPENDENT AUDITORS’ REPORT TO THE UNITHOLDERS OF
RHB-GS US EQUITY FUND (CONTINUED)
OTHER MATTERS
1. As stated in Note 2.1 to the financial statements, RHB-GS US Equity Fund adopted Malaysian Financial
Reporting Standards on 1 July 2012 with a transition date of 28 June 2010 (date of constitution). These
standards were applied retrospectively by the Manager to the comparative information in these financial
statements, including the statement of financial position as at 30 June 2012, statements of
comprehensive income, changes in net asset value and cash flows for the period ended 30 June 2012 and
related disclosures. We were not engaged to report on the restated comparative information and it is
unaudited. Our responsibilities as part of our audit of the financial statements of the Fund for the year
ended 30 June 2013 have, in these circumstances, included obtaining sufficient appropriate audit
evidence that the opening balances as at 1 July 2012 do not contain misstatements that materially affect
the financial position as of 30 June 2013 and financial performance and cash flows for the year then
ended.
2. This report is made solely to the Unitholders of the Fund and for no other purpose. We do not assume
responsibility to any other person for the content of this report.
PRICEWATERHOUSECOOPERS
(No. AF: 1146)
Chartered Accountants
Kuala Lumpur
15 August 2013

RHB-GS US Equity Fund
33
CORPORATE INFORMATION
(WITH EFFECT FROM 17 MAY 2013)
MANAGER
RHB Investment Management Sdn Bhd
REGISTERED OFFICE
Level 10, Tower One, RHB Centre, Jalan Tun Razak, 50400 Kuala Lumpur
BUSINESS OFFICE AND OFFICE OF THE REGISTRAR
Level 7, Tower One, RHB Centre, Jalan Tun Razak, 50400 Kuala Lumpur
BOARD OF DIRECTORS
Patrick Chin Yoke Chung (Independent Non-Executive Chairman)
Khairuddin bin Ahmad (Senior Independent Non-Executive Director)
Othman bin Jusoh (Independent Non-Executive Director)
Abdul Aziz Peru Mohamed (Independent Non-Executive Director)
INVESTMENT COMMITTEE MEMBERS
Khairuddin bin Ahmad (Independent Chairman)
Othman bin Jusoh (Independent Member)
Lim Chee Sing (Non-Independent Member)
SECRETARY
Azman Shah bin Md Yaman (LS No. 0006901)
BRANCHES
• Northern Regional Office
Level 3A, 44 Lebuh Pantai
Georgetown, 10300 Penang
• Sabah Regional Office
Lot No. C-02-04, 2nd Floor, Block C
Warisan Square, Jalan Tun Fuad Stephens
88000 Kota Kinabalu, Sabah
• Sarawak Regional Office
Lot 7418, 1st Floor, Jalan Simpang Tiga
93300 Kuching, Sarawak
TRUSTEE
TMF Trustees Malaysia Berhad
10th Floor, Menara Hap Seng
1 & 3, Jalan P. Ramlee
50250 Kuala Lumpur
AUDITOR & REPORTING ACCOUNTANT
PricewaterhouseCoopers
10th Floor, 1 Sentral, Jalan Travers, KL Sentral
50706 Kuala Lumpur
TAX ADVISER
PricewaterhouseCoopers
Taxation Services Sdn Bhd
10th Floor, 1 Sentral, Jalan Travers, KL Sentral
50706 Kuala Lumpur
BANKER
RHB Bank Berhad
RHB Centre
Jalan Tun Razak
50400 Kuala Lumpur
SOLICITOR
Soon Gan Dion & Partners
1st Floor, No. 73, Jalan SS21/1A
Damansara Utama
47400 Petaling Jaya
Selangor Darul Ehsan
INSTITUTIONAL UNIT TRUST ADVISERS
RHB Bank Berhad
Citibank Berhad
iFast Capital Sdn Bhd
Phillip Mutual Berhad
CIMB Bank Berhad
United Overseas Bank (Malaysia) Berhad

RHB-GS US Equity Fund