Embed Size (px)
Citation preview

RHB CAPITAL FUND
INTeRIm RePORT 2017
Incorporating The Unaudited Financial Statements
For the six months financial period ended 31 October 2017
RHB Asset management Sdn Bhd (174588-X)
Head OfficeLevel 8, Tower 2 & 3, RHB Centre Jalan Tun Razak50400 Kuala Lumpur, Malaysia
Tel : +603 9205 8000
Fax : +603 9205 8100
www.rhbgroup.com

11
GENERAL INFORMATION ABOUT THE FUND
Commencement Date
RHB Capital Fund (“the Fund”) commenced operations on 12 April 1995.
Fund Category and Type
Fund Category - Equity fund
Fund Type - Growth fund
Investment Objective, Policy and Strategy
Objective of the Fund
To achieve long term growth through capital appreciation with all income including profits on realisation of investments being automatically reinvested for its compounding effect.
Strategy
The Fund seeks long term capital appreciation. To pursue this goal, the Fund invests primarily in Malaysian public listed companies with strong growth potential. The Manager utilises a strategy that seeks attractively priced companies in undervalued sectors, or in sectors that have strong upward stock price momentum which demonstrate strong increases in earnings per share and continue to strengthen their fundamental capabilities and competitive positions, amongst others.
The asset allocation of the Fund will be as follows:-
Minimum of 60% and up to 95% of Net Asset Value
- Investments in equities
Minimum of 5% of Net Asset Value
- Investments in fixed income securities and/or liquid assets

22
Investment Philosophy
Our investment philosophy describes the approach that the investment team will adhere to when constructing an equity or fixed income portfolio. The fund managers invest in well-managed companies with strong balance sheets that possess competitive advantages that should enable them to outperform their peers over economic cycles. The fund managers are active investors that make high conviction security selection decisions, but at the same time do not take unnecessary or excessive risks nor take speculative positions. The fund managers seek to outperform their peers and beat their benchmark by buying mispriced or cheap securities. Following our disciplined sell strategy, they would then exit positions when our target price is reached. Concurrently, the fund managers understand the Fund’s risk profile and act within the Fund’s mandate.

33
Investment Approach
Whenever the Fund invests in equities and fixed income securities, the Manager’s investment approach will evolve around the following principles:-
Equities
Fixed Income Securities

44
Performance Benchmark
FTSE Bursa Malaysia Kuala Lumpur Composite Index (“FBM KLCI”)
Permitted Investments and Restrictions
The Fund may invest in securities of companies listed on Bursa Malaysia; unlisted securities including securities not listed or quoted on a stock exchange but have been approved by the relevant regulatory authority for such listing or quotation and are offered directly to the Fund by the issuer; financial derivatives; collective investment schemes; structured products and warrants that carry the right in respect of a security traded in or under the rules of an eligible market; Malaysian government securities, cagamas bonds, Bank Negara Malaysia certificates, Malaysian treasury bills, bankers’ acceptance and Government Investment Issue (“GII”); Malaysian currency balances in hand, Malaysian currency deposits with commercial banks, finance companies and Bank Islam Malaysia Berhad including negotiable certificates of deposit, banker’s acceptances and placements of money at call with discount houses; foreign investments traded in or under the rules of a foreign market approved by Securities Commission Malaysia; unlisted fixed income or debt securities; liquid assets (including money market instruments and deposits with any financial institution); and any other investments permitted by the Securities Commission Malaysia from time to time.
Fund Distribution Policy
Distribution is incidental, subject to the availability of income at the end of the financial year.

55
MANAGER’S REPORT
FUND PERFORMANCE REVIEW
For the period under review, the RHB Capital Fund registered a positive return of 0.72%* against its benchmark return of negative 1.14%*. The fund outperformed its benchmark by 1.86% during the period under review.
The outperformance of the Fund was due to stock selection. The stocks that contributed to the Fund performance were stocks that received strong contract flows from construction as well as companies with cheap valuation with strong earnings growth stories. The Fund remained invested to take advantage of the gradual recovery in global market and strong Malaysia Gross Domestic Product (“GDP”) numbers.
The investment strategy and policy employed during the period under review were in line with the investment strategy and policy as stated in the prospectus. For the period under review, the Fund has achieved its objective of providing long term growth through capital appreciation.
* Source: Lipper Investment Management (“Lipper IM”), 15 November 2017
EQUITY MARKET REVIEW
At the beginning of May 2017, investors were spooked at news of the collapse of the Bandar Malaysia land deal that led to retracement in the FTSE Bursa Malaysia Kuala Lumpur Composite Index (“FBM KLCI”) by 14 points. Concerns on the broader market were short-lived, however, as the FBM KLCI continued on its upwards momentum shortly after. After concerns over the future of investments from China, on 15 May 2017 the Chinese Government pledged more funds for the One Belt, One Road (“OBOR”) initiative.
In the recent Belt and Road Initiative Summit in May 2017, nine new memorandum of understanding agreements including several new deals totalling more than United States Dollar (“USD”) 7.2 billion were signed between companies from the two countries. These include the setting-up of a Robotic Future City in Johor, a USD2 billion methanol and methanol derivatives project in Sarawak, a deal worth USD1.5 billion to export Cavendish bananas and tropical fruits to China, and an engineering, procurement, construction and commissioning (“EPCC”) contract amounting to USD132.6 million to develop a mixed-use commercial hub in Kota Kinabalu, Sabah, known as The Shore. An aviation joint venture (“JV”) was inked to establish a low-cost carrier terminal in Zhengzhou, capital of Henan province in central China. Bursa Malaysia and Shanghai Stock

66
Exchange also signed a pact to explore potential ways to improve market accessibility and products in both markets.
The closer ties between China and Malaysia have also resulted in increased collaboration in other non-OBOR projects including the acquisition of Edra Energy by China General Nuclear Power Corp (“CGN”), Impressions Malacca and proposed acquisition of a 49.9% stake in Proton by Zhejiang Geely.
On the economic front, headline numbers continue to be strong with first quarter of year 2017 GDP growth reaching 5.6% Year-on-Year (“YoY”), the strongest in over two years. Corporate Malaysia’s earnings for the June quarter were subdued. Sectors that disappointed include auto, plantations, media, healthcare and property.
As the market moved towards the end of financial period under review, the Kuala Lumpur Composite Index (“KLCI”) closed flat Month-on-Month (“MoM”) in October 2017 despite a 7% MoM rise in brent crude oil price and tabling of Budget year 2018. Budget year 2018 was broadly within expectations, with few surprises to excite the market. While the strong focus on fiscal discipline was encouraging, the budget’s populist slant contained measures to address the rising living costs, with special focus on assisting lower income groups and civil servants – in addition to emphasis on investments in infrastructure, education, and skills development. The proposals are clearly positive for the consumer and construction sectors. The proposal to cut income tax rates ought to help to lift consumption, while the continued positive news flow for construction is likely to sustain investor interest in the sector.
EQUITY MARKET OUTLOOK AND STRATEGY
The Malaysian economy grew at a robust pace in first half of year 2017, supported by a continued surge in exports and external demand. As growth in external activities is expected to continue on the back of sustained global growth outlook into next year, we expect GDP growth to be maintained at a strong 5.4% in year 2018, inching up from +5.3% estimated for year 2017.
In our view, domestic demand is likely to take centre stage in fuelling growth, as the spillover effects from strong external demand become more broad-based. Also, an improvement in revenue collection – amid stronger economic growth and potential pre-election spending is likely to lead to a modest increase in public consumption spending and investments. This should contribute to overall economic growth, instead of posing a drag, as in previous years.

77
Domestic demand is expected to pick up in year 2018, as the trickle-down effect from robust external activities becomes more broad-based. Private consumption is expected to be supported by employment gains and income, while public sector spending should be bolstered by higher revenue and expected election spending.
Bank Negara Malaysia (“BNM”), in our view, is likely hike the overnight policy rate (“OPR”) by 25 basis points (“bps”) to 3.25% in year 2018. This is in tandem with major central banks’ moves to tighten their respective monetary policies while the country’s economic growth continues to strengthen.
With global economies riding firmly on a growth wave, we believe the current economic cycle – year 2018 is the ninth year – has a strong chance of being extended. This is despite the political challenges in the United States (“US”) confronting the Trump Administration, stymying its efforts to implement various reflationary policies. Also encouraging is the economic recovery in the Eurozone, while unbridled populism has been constrained, resulting in easing political risks.
While a slowdown in China’s economy could be a threat to global growth, we think this is a longer-term concern. Within our investment horizon, we still expect China’s economy to growth at a robust pace, expanding 6.8% and 6.6% in year 2017 and year 2018. We also see Japan continuing to ride on the gathering pace of global growth, driven by exports and improving consumption spending.
Malaysia’s economic performance is also responding well to the pick-up in global trade and we are forecasting growth to remain robust, going into year 2018 (+5.4% GDP growth). The stronger external demand is expected to spill over to lift domestic demand, which would gradually take centre stage to drive growth going forward.
While the export sector is the immediate beneficiary of the stronger external activities, this has had a disproportionately mild impact on FBM KLCI component stocks, as the sector is not well presented on the benchmark index. Nonetheless, the pick-up in the pace of growth and gradual transmission to other parts of the economy bodes well for corporate earnings, which are on track to rebound in year 2017 and year 2018.
Against this macroeconomic backdrop – amid robust domestic liquidity and impending general elections – we continue to reiterate our positive stance on Malaysian equities. Relative to other regional markets, the country continues to lag behind regional peers in absolute performance year to date, although consensus valuations are not especially demanding.

88
PERFORMANCE DATA
Total Return1-month
30.09.2016-31.10.2017
%
3-month31.07.2017-31.10.2017
%
6-month30.04.2017-31.10.2017
%RHB Capital Fund 1.09 0.77 0.72
FBM KLCI (0.44) (0.69) (1.14)
Average Annual Return1 Year
31.10.2016-31.10.2017
%
3 Years31.10.2014-31.10.2017
%
5 Years31.10.2012-31.10.2017
%
10 Years31.10.2007-31.10.2017
%RHB Capital Fund 8.76 1.15 4.84 5.54
FBM KLCI 4.51 (1.96) 0.88 2.14
Annual Total ReturnFinancial Year Ended
30 April2017
%2016
%2015
%2014
%2013%
RHB Capital Fund- Capital Return 7.55 (14.08) (13.42) 10.66 2.87- Income Return 6.03 9.96 8.26 8.74 6.55- Total Return 14.04 (5.53) (5.16) 19.40 9.42
FBM KLCI 5.70 (8.00) (2.85) 8.96 9.36
99
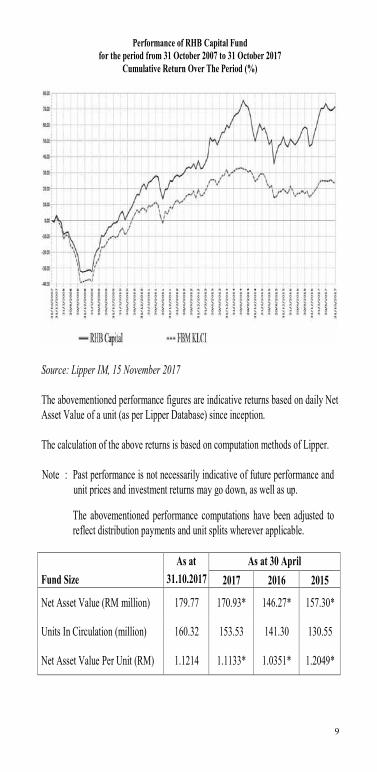
Performance of RHB Capital Fund for the period from 31 October 2007 to 31 October 2017
Cumulative Return Over The Period (%)
Source: Lipper IM, 15 November 2017
The abovementioned performance figures are indicative returns based on daily Net Asset Value of a unit (as per Lipper Database) since inception.
The calculation of the above returns is based on computation methods of Lipper.
Note : Past performance is not necessarily indicative of future performance and unit prices and investment returns may go down, as well as up.
The abovementioned performance computations have been adjusted to reflect distribution payments and unit splits wherever applicable.
As at As at 30 AprilFund Size 31.10.2017 2017 2016 2015
Net Asset Value (RM million) 179.77 170.93* 146.27* 157.30*
Units In Circulation (million) 160.32 153.53 141.30 130.55
Net Asset Value Per Unit (RM) 1.1214 1.1133* 1.0351* 1.2049*

1010
Historical Data01.05.2017- Financial Year Ended 30 April31.10.2017 2017 2016 2015
Unit PricesNAV - Highest (RM) 1.1406 1.1576* 1.2196* 1.4652* - Lowest (RM) 1.0977 1.0156* 0.9972* 1.1684*
Distribution and Unit Split Gross Distribution Per Unit (sen)
- 6.5000 10.3500 11.5000Net Distribution Per Unit (sen)
- 6.5000 10.3500 11.5000Distribution Date - 20.04.2017 28.04.2016 28.04.2015NAV before distribution (cum) - 1.1428 1.1500 1.3365NAV after distribution (ex) - 1.0778 1.0395 1.2060
Unit Split - - - -
OthersManagement Expense Ratio
(MER) #(%) #
0.84 1.67 1.67 1.58Portfolio Turnover Ratio
(PTR) ##(times) ##
0.18 0.39 0.65 0.69
* The figure quoted are ex-distribution
# The MER for the financial period was consistent with previous financial period (refer to Note 13).
## The PTR for the financial period was lower compared with previous financial period due to lesser investment activities for the financial period under review (refer to Note 14).
DISTRIBUTION
For the financial period under review, no distribution has been proposed by the Fund.

1111
PORTFOLIO STRUCTURE AS AT 31 OCTOBER 2017
The asset allocations of the Fund as at reporting date were as follows:
As at As at 30 April31.10.2017 2017 2016 2015
Sectors % % % %EquitiesConstruction 15.67 13.65 12.80 13.04Consumer Products 8.98 11.98 20.61 8.52Finance 14.12 11.24 6.70 8.30Industrial Products 8.62 10.82 21.41 9.13Plantation - 4.78 3.27 -Properties 8.77 6.60 3.44 5.78Technologies - - - 3.80Trading/Services 29.91 37.01 35.59 43.56TSR/Warrants/Call Warrants 0.20 0.39 0.15 0.34
86.27 96.47 103.97 92.47Liquid assets and other net current assets/(liabilities) 13.73 3.53 (3.97)* 7.53
100.00 100.00 100.00 100.00
The asset allocation was reflective of the Manager’s stance to risk manage its portfolio in an environment of volatile markets.
* The excess over 100% of net asset value is mainly attributable to provision made for income distribution, which has not been paid as at the reporting date.

1212
FUND SIZE AND PROFILE OF UNIT HOLDINGS BY SIZE
As at 31 October 2017, the Fund’s units in circulation stood at 160.32 million units with a total of 1,409 accounts.
Account Holders No. Of Units Held*Size of Holdings No. % (‘000) %5,000 and below 150 10.65 272 0.175,001 to 10,000 488 34.63 2,899 1.8110,001 to 50,000 628 44.57 13,973 8.7150,001 to 500,000 141 10.01 12,356 7.71500,001 and above 2 0.14 130,812 81.60Total 1,409 100.00 160,312 100.00
* Excluding Manager’s stock
REBATES AND SOFT COMMISSION
Dealings on investments of the Fund through brokers or dealers will be on terms which are best available for the Fund. Any rebates from brokers or dealers will be directed to the account of the Fund.
The Fund Manager may only receive soft commission in the form of research and advisory services that assist in the decision-making process relating to the Fund’s investments.
During the financial period under review, the soft commission received from the brokers had been retained by the Manager as the goods and services provided are of demonstrable benefit to the unitholders.

1313
RHB CAPITAL FUND UNAUDITED STATEMENT OF FINANCIAL POSITION AS AT 31 OCTOBER 2017
Note 31.10.2017 30.04.2017 RM RM
ASSETS Financial assets at fair value
through profit or loss (“FVTPL”) 5 155,082,851 164,893,080 Deposits with a licensed financial institution 6 26,273,306 14,213,940 Bank balances 6 10,312 33,925 Amount due from stockbrokers 1,480,973 2,088,989 Amount due from Manager - 6,602 Dividends receivable 360,608 30,000 Tax recoverable 742 742
──────────── ────────────
TOTAL ASSETS 183,208,792 181,267,278 ──────────── ────────────
LIABILITIES Income distribution payable - 9,984,585 Amount due to stockbrokers 3,153,652 - Amount due to Manager 2,232 83,342 Accrued management fee 241,046 227,180Amount due to Trustee 9,642 9,087 Other payables and accruals 7 31,095 37,437
──────────── ────────────
TOTAL LIABILITIES 3,437,667 10,341,631 ──────────── ────────────
NET ASSET VALUE 179,771,125 170,925,647════════════ ════════════
UNITHOLDERS’ FUNDSUnitholders’ capital 143,759,358 136,238,811 Retained earnings 36,011,767 34,686,836
──────────── ────────────
179,771,125 170,925,647 ════════════ ════════════
UNITS IN CIRCULATION (UNITS) 8 160,316,455 153,532,000 ════════════ ════════════
NET ASSET VALUE PER UNIT(EX-DISTRIBUTION)* (RM) 1.1214 1.1133*
════════════ ════════════
The accompanying notes are an integral part of the financial statements. 13
RHB CAPITAL FUND UNAUDITED STATEMENT OF FINANCIAL POSITION AS AT 31 OCTOBER 2017
Note 31.10.2017 30.04.2017 RM RM
ASSETS Financial assets at fair value
through profit or loss (“FVTPL”) 5 155,082,851 164,893,080 Deposits with a licensed financial institution 6 26,273,306 14,213,940 Bank balances 6 10,312 33,925 Amount due from stockbrokers 1,480,973 2,088,989 Amount due from Manager - 6,602 Dividends receivable 360,608 30,000 Tax recoverable 742 742
──────────── ────────────
TOTAL ASSETS 183,208,792 181,267,278 ──────────── ────────────
LIABILITIES Income distribution payable - 9,984,585 Amount due to stockbrokers 3,153,652 - Amount due to Manager 2,232 83,342 Accrued management fee 241,046 227,180Amount due to Trustee 9,642 9,087 Other payables and accruals 7 31,095 37,437
──────────── ────────────
TOTAL LIABILITIES 3,437,667 10,341,631 ──────────── ────────────
NET ASSET VALUE 179,771,125 170,925,647════════════ ════════════
UNITHOLDERS’ FUNDSUnitholders’ capital 143,759,358 136,238,811 Retained earnings 36,011,767 34,686,836
──────────── ────────────
179,771,125 170,925,647 ════════════ ════════════
UNITS IN CIRCULATION (UNITS) 8 160,316,455 153,532,000 ════════════ ════════════
NET ASSET VALUE PER UNIT(EX-DISTRIBUTION)* (RM) 1.1214 1.1133*
════════════ ════════════
The accompanying notes are an integral part of the financial statements.

1414
RHB CAPITAL FUND UNAUDITED STATEMENT OF COMPREHENSIVE INCOME FOR THE SIX MONTHS FINANCIAL PERIOD ENDED 31 OCTOBER 2017
01.05.2017 - 01.05.2016 - Note 31.10.2017 31.10.2016
RM RMINVESTMENT INCOME Dividend income 2,284,367 1,794,847 Interest income from deposits with
licensed financial institutions 366,365 197,566 Net gain on financial assets at FVTPL 5 402,403 8,644,315
──────── ──────── 3,053,135 10,636,728 ──────── ────────
EXPENSES Management fee 9 (1,362,525) (1,240,688) Trustee’s fee 10 (54,501) (49,628) Audit fee (4,638) (4,888) Tax agent’s fee (1,900) (1,900) Transaction costs (203,067) (198,678) Other expenses (101,573) (92,877)
──────── ──────── (1,728,204) (1,588,659) ──────── ────────
Profit before taxation 1,324,931 9,048,069 Taxation 11 - -
──────── ────────Profit after taxation and total
comprehensive income for the financial period 1,324,931 9,048,069
════════ ════════
Profit after taxation is made up of the following:
Realised amount 3,652,532 3,632,564 Unrealised amount (2,327,601) 5,415,505
──────── ──────── 1,324,931 9,048,069 ════════ ════════
The accompanying notes are an integral part of the financial statements.
14
RHB CAPITAL FUND UNAUDITED STATEMENT OF COMPREHENSIVE INCOME FOR THE SIX MONTHS FINANCIAL PERIOD ENDED 31 OCTOBER 2017
01.05.2017 - 01.05.2016 - Note 31.10.2017 31.10.2016
RM RMINVESTMENT INCOME Dividend income 2,284,367 1,794,847 Interest income from deposits with
licensed financial institutions 366,365 197,566 Net gain on financial assets at FVTPL 5 402,403 8,644,315
──────── ──────── 3,053,135 10,636,728 ──────── ────────
EXPENSES Management fee 9 (1,362,525) (1,240,688) Trustee’s fee 10 (54,501) (49,628) Audit fee (4,638) (4,888) Tax agent’s fee (1,900) (1,900) Transaction costs (203,067) (198,678) Other expenses (101,573) (92,877)
──────── ──────── (1,728,204) (1,588,659) ──────── ────────
Profit before taxation 1,324,931 9,048,069 Taxation 11 - -
──────── ────────Profit after taxation and total
comprehensive income for the financial period 1,324,931 9,048,069
════════ ════════
Profit after taxation is made up of the following:
Realised amount 3,652,532 3,632,564 Unrealised amount (2,327,601) 5,415,505
──────── ──────── 1,324,931 9,048,069 ════════ ════════
The accompanying notes are an integral part of the financial statements.

1515
RHB CAPITAL FUND UNAUDITED STATEMENT OF CHANGES IN NET ASSET VALUE FOR THE SIX MONTHS FINANCIAL PERIOD ENDED 31 OCTOBER 2017
Unitholders’ Retained Total net capital earnings asset value
RM RM RM
Balance as at 1 May 2016 123,711,065 22,556,406 146,267,471
Movement in net asset value: Total comprehensive income
for the financial period - 9,048,069 9,048,069 Creation of units arising
from distribution 14,565,478 - 14,565,478Creation of units arising
from applications 45,893 - 45,893 Cancellation of units (1,224,442) - (1,224,442)
───────── ───────── ─────────Balance as at 31 October 2016 137,097,994 31,604,475 168,702,469
═════════ ═════════ ═════════
Balance as at 1 May 2017 136,238,811 34,686,836 170,925,647
Movement in net asset value: Total comprehensive income
for the financial period - 1,324,931 1,324,931 Creation of units arising
from distribution 9,945,313 - 9,945,313 Creation of units arising
from applications 23,633 - 23,633 Cancellation of units (2,448,399) - (2,448,399)
───────── ───────── ─────────Balance as at 31 October 2017 143,759,358 36,011,767 179,771,125
═════════ ═════════ ═════════
The accompanying notes are an integral part of the financial statements.
15
RHB CAPITAL FUND UNAUDITED STATEMENT OF CHANGES IN NET ASSET VALUE FOR THE SIX MONTHS FINANCIAL PERIOD ENDED 31 OCTOBER 2017
Unitholders’ Retained Total net capital earnings asset value
RM RM RM
Balance as at 1 May 2016 123,711,065 22,556,406 146,267,471
Movement in net asset value: Total comprehensive income
for the financial period - 9,048,069 9,048,069 Creation of units arising
from distribution 14,565,478 - 14,565,478Creation of units arising
from applications 45,893 - 45,893 Cancellation of units (1,224,442) - (1,224,442)
───────── ───────── ─────────Balance as at 31 October 2016 137,097,994 31,604,475 168,702,469
═════════ ═════════ ═════════
Balance as at 1 May 2017 136,238,811 34,686,836 170,925,647
Movement in net asset value: Total comprehensive income
for the financial period - 1,324,931 1,324,931 Creation of units arising
from distribution 9,945,313 - 9,945,313 Creation of units arising
from applications 23,633 - 23,633 Cancellation of units (2,448,399) - (2,448,399)
───────── ───────── ─────────Balance as at 31 October 2017 143,759,358 36,011,767 179,771,125
═════════ ═════════ ═════════
The accompanying notes are an integral part of the financial statements.

1616
RHB CAPITAL FUNDUNAUDITED STATEMENT OF CASH FLOWSFOR THE SIX MONTHS FINANCIAL PERIOD ENDED 31 OCTOBER 2017
01.05.2017 - 01.05.2016 -31.10.2017 31.10.2016
RM RMCASH FLOWS FROM OPERATING ACTIVITIESProceeds from sale of investments 39,309,375 38,384,111Purchase of investments (25,538,142) (39,367,418)Dividends received 1,953,759 1,746,237Interest received from deposits with licensed financial institutions 366,365 197,566Management fee paid (1,348,659) (1,222,848)Trustee’s fee paid (53,946) (48,914)Payment for other fees and expenses (114,453) (109,059)
─────────── ───────────
Net cash generated from /(used in) operating activities 14,574,299 (420,325)
─────────── ───────────
CASH FLOWS FROM FINANCING ACTIVITIESCash proceeds from units created 30,235 45,893Payment for cancellation of units (2,529,509) (1,214,789)Payment for income distribution (39,272) (59,486)
─────────── ───────────
Net cash used in financing activities (2,538,546) (1,228,382)─────────── ───────────
Net increase /(decrease) in cash and cash equivalents 12,035,753 (1,648,707)
Cash and cash equivalents at the beginning of the financial period 14,247,865 8,895,286
─────────── ───────────
Cash and cash equivalents at the end of the financial period 26,283,618 7,246,579
═══════════ ═══════════
Cash and cash equivalents comprise: Deposits with licensed financial institutions 26,273,306 7,235,569 Bank balance 10,312 11,010
─────────── ───────────
26,283,618 7,246,579═══════════ ═══════════
The accompanying notes are an integral part of the financial statements.
16
RHB CAPITAL FUNDUNAUDITED STATEMENT OF CASH FLOWSFOR THE SIX MONTHS FINANCIAL PERIOD ENDED 31 OCTOBER 2017
01.05.2017 - 01.05.2016 -31.10.2017 31.10.2016
RM RMCASH FLOWS FROM OPERATING ACTIVITIESProceeds from sale of investments 39,309,375 38,384,111Purchase of investments (25,538,142) (39,367,418)Dividends received 1,953,759 1,746,237Interest received from deposits with licensed financial institutions 366,365 197,566Management fee paid (1,348,659) (1,222,848)Trustee’s fee paid (53,946) (48,914)Payment for other fees and expenses (114,453) (109,059)
─────────── ───────────
Net cash generated from /(used in) operating activities 14,574,299 (420,325)
─────────── ───────────
CASH FLOWS FROM FINANCING ACTIVITIESCash proceeds from units created 30,235 45,893Payment for cancellation of units (2,529,509) (1,214,789)Payment for income distribution (39,272) (59,486)
─────────── ───────────
Net cash used in financing activities (2,538,546) (1,228,382)─────────── ───────────
Net increase /(decrease) in cash and cash equivalents 12,035,753 (1,648,707)
Cash and cash equivalents at the beginning of the financial period 14,247,865 8,895,286
─────────── ───────────
Cash and cash equivalents at the end of the financial period 26,283,618 7,246,579
═══════════ ═══════════
Cash and cash equivalents comprise: Deposits with licensed financial institutions 26,273,306 7,235,569 Bank balance 10,312 11,010
─────────── ───────────
26,283,618 7,246,579═══════════ ═══════════
The accompanying notes are an integral part of the financial statements.
1717
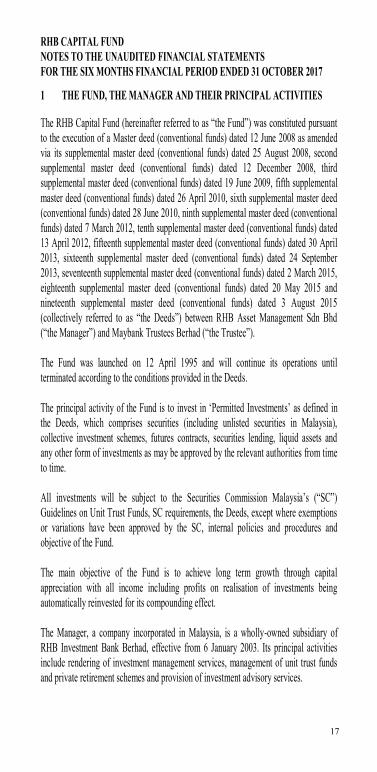
RHB CAPITAL FUND NOTES TO THE UNAUDITED FINANCIAL STATEMENTS FOR THE SIX MONTHS FINANCIAL PERIOD ENDED 31 OCTOBER 2017
1 THE FUND, THE MANAGER AND THEIR PRINCIPAL ACTIVITIES
The RHB Capital Fund (hereinafter referred to as “the Fund”) was constituted pursuant to the execution of a Master deed (conventional funds) dated 12 June 2008 as amended via its supplemental master deed (conventional funds) dated 25 August 2008, second supplemental master deed (conventional funds) dated 12 December 2008, third supplemental master deed (conventional funds) dated 19 June 2009, fifth supplemental master deed (conventional funds) dated 26 April 2010, sixth supplemental master deed (conventional funds) dated 28 June 2010, ninth supplemental master deed (conventional funds) dated 7 March 2012, tenth supplemental master deed (conventional funds) dated 13 April 2012, fifteenth supplemental master deed (conventional funds) dated 30 April 2013, sixteenth supplemental master deed (conventional funds) dated 24 September 2013, seventeenth supplemental master deed (conventional funds) dated 2 March 2015, eighteenth supplemental master deed (conventional funds) dated 20 May 2015 and nineteenth supplemental master deed (conventional funds) dated 3 August 2015 (collectively referred to as “the Deeds”) between RHB Asset Management Sdn Bhd (“the Manager”) and Maybank Trustees Berhad (“the Trustee”).
The Fund was launched on 12 April 1995 and will continue its operations until terminated according to the conditions provided in the Deeds.
The principal activity of the Fund is to invest in ‘Permitted Investments’ as defined inthe Deeds, which comprises securities (including unlisted securities in Malaysia), collective investment schemes, futures contracts, securities lending, liquid assets and any other form of investments as may be approved by the relevant authorities from time to time.
All investments will be subject to the Securities Commission Malaysia’s (“SC”) Guidelines on Unit Trust Funds, SC requirements, the Deeds, except where exemptions or variations have been approved by the SC, internal policies and procedures and objective of the Fund.
The main objective of the Fund is to achieve long term growth through capital appreciation with all income including profits on realisation of investments being automatically reinvested for its compounding effect.
The Manager, a company incorporated in Malaysia, is a wholly-owned subsidiary of RHB Investment Bank Berhad, effective from 6 January 2003. Its principal activities include rendering of investment management services, management of unit trust funds and private retirement schemes and provision of investment advisory services.

1818
1 THE FUND, THE MANAGER AND THEIR PRINCIPAL ACTIVITIES (CONTINUED)
These financial statements were authorised for issue by the Manager on 22December2017.
2 SUMMARY OF SIGNIFICANT ACCOUNTING POLICIES
2.1 Basis of preparation of the financial statements
The financial statements have been prepared under the historical cost convention, as modified by financial assets and financial liabilities (including derivative instruments) at fair value through profit or loss, except as disclosed in this summary of significant accounting policies, and in accordance with Malaysian Financial Reporting Standards (“MFRS”) and International Financial Reporting Standards (“IFRS”).
The preparation of financial statements in conformity with MFRS and IFRS requires the use of certain critical accounting estimates and assumptions that affect the reported amounts of assets and liabilities and disclosure of contingent assets and liabilities at the date of the financial statements, and the reported amounts of revenues and expenses during the financial period. It also requires the Manager to exercise its judgement in the process of applying the Fund’s accounting policies. Although these estimates and judgement are based on the Manager’s best knowledge of current events and actions, actual results may differ.
(a) The Fund has applied the following amendments for the first time for the financial period beginning on 1 May 2017:
Amendments to MFRS 107 “Statement of Cash Flows – Disclosure Initiative” (effective from 1 January 2017) introduce an additional disclosure on changes in liabilities arising from financing activities.
The adoption of these amendments did not have any impact on the current financial period or any prior period and is not likely to affect future periods.

1919
2 SUMMARY OF SIGNIFICANT ACCOUNTING POLICIES (CONTINUED)
2.1 Basis of preparation of the financial statements (continued)
(b) The new standards and amendments to published standards which are relevant to the Fund but not yet effective and have not been early adopted are as follows:
(i) Financial period beginning on/after 1 May 2018
MFRS 9 “Financial Instruments” (effective from 1 January 2018) will replace MFRS 139 “Financial Instruments: Recognition and Measurement”.
MFRS 9 retains but simplifies the mixed measurement model in MFRS 139 and establishes three primary measurement categories for financial assets: amortised cost, fair value through profit or loss and fair value through other comprehensive income (“OCI”). The basis of classification depends on the entity’s business model and the cash flow characteristics of the financial asset. Investments in equity instruments are always measured at fair value through profit or loss with an irrevocable option at inception to present changes in fair value in OCI (provided the instrument is not held for trading). A debt instrument is measured at amortised cost only if the entity is holding it to collect contractual cash flows and the cash flows represent principal and interest.

2020
2 SUMMARY OF SIGNIFICANT ACCOUNTING POLICIES (CONTINUED)
2.1 Basis of preparation of the financial statements (continued)
(b) The new standards and amendments to published standards which are relevant to the Fund but not yet effective and have not been early adopted are as follows: (continued)
(i) Financial period beginning on/after 1 May 2018 (continued)
For liabilities, the standard retains most of the MFRS 139 requirements. These include amortised cost accounting for most financial liabilities, with bifurcation of embedded derivatives. The main change is that, in cases where the fair value option is taken for financial liabilities, the part of a fair value change due to an entity’s own credit risk is recorded in other comprehensive income rather than the profit or loss, unless this creates an accounting mismatch.
MFRS 9 introduces an expected credit loss model on impairment that replaces the incurred loss impairment model used in MFRS 139. The expected credit loss model is forward-looking and eliminates the need for a trigger event to have occurred before credit losses are recognised.
The above standards and amendments to published standards are not expected to have a significant impact on the Fund’s financial statements.
2.2 Financial assets
Classification
Financial assets are designated as fair value through profit or loss when they are managed and their performance are evaluated on a fair value basis.
The Fund designates its investments in quoted investments as financial assets at fair value through profit or loss at inception.
Loans and receivables are non-derivative financial assets with fixed or determinable payments that are not quoted in an active market and have been included in current assets. The Fund’s loans and receivables comprise cash and cash equivalents, amount due from stockbrokers, amount due from Manager anddividends receivable which are all due within 12 months.
2121
2 SUMMARY OF SIGNIFICANT ACCOUNTING POLICIES (CONTINUED)
2.2 Financial assets (continued)
Recognition and measurement
Regular purchases and sales of financial assets are recognised on the trade date, the date on which the Fund commits to purchase or sell the asset. Investments are initially recognised at fair value. Subsequent to initial recognition, financial assets at fair value through profit or loss are measured at fair value.
Transaction costs are costs incurred to acquire or dispose financial assets or liabilities at fair value through profit or loss. They include fees and commissions paid to agents, advisors, brokers and dealers. Transaction costs, when incurred, are immediately recognised in statement of comprehensive income as expenses.
Financial assets are de-recognised when the rights to receive cash flows from the investments have expired or have been transferred and the Fund has transferred substantially all risks and rewards of ownership.
Unrealised gains or losses arising from changes in the fair value of the ‘financial assets at fair value through profit or loss’ category are recognised in statement of comprehensive income in the financial period in which they arise.
Quoted investments are initially recognised at fair value and subsequently remeasured at fair value based on the market price quoted on the relevant stock exchanges at the close of the business on the valuation day, where the close price falls within the bid-ask spread. In circumstances where the close price is not within the bid-ask price, the Manager will determine the point within the bid-ask spread that is most representative of the fair value.
If a valuation based on the market price does not represent the fair value of the securities, for example during abnormal market conditions or when no market price is available, including in the event of a suspension in the quotation of the securities for a period exceeding 14 days, or such shorter period as agreed by the Trustee, then the securities are valued as determined in good faith by the Manager, based on the methods or bases approved by the Trustee after appropriate technical consultation.
Deposits with licensed financial institutions are stated at cost plus accrued interest calculated on the effective interest method over the period from the date of placement to the date of maturity of the respective deposits which is a reasonable estimate of fair value due to the short-term nature of the deposits
Loans and receivables are subsequently carried at amortised cost using the effective interest method.

2222
2 SUMMARY OF SIGNIFICANT ACCOUNTING POLICIES (CONTINUED)
2.2 Financial assets (continued)
Impairment of financial assets
For assets carried at amortised cost, the Fund assesses at the end of the financial period whether there is objective evidence that a financial asset or group of financial assets is impaired. A financial asset or a group of financial assets is impaired and impairment losses are incurred only if there is objective evidence of impairment as a result of one or more events that occurred after the initial recognition of the asset (a ‘loss event’) and that loss event (or events) has an impact on the estimated future cash flows of the financial asset or group of financial assets that can be reliably estimated.
The amount of the loss is measured as the difference between the asset’s carrying amount and the present value of estimated future cash flows (excluding future credit losses that have not been incurred) discounted at the financial asset’s original effective interest rate. The asset’s carrying amount is reduced and the amount of the loss is recognised in statement of comprehensive income. If ‘loans and receivables’ has a variable interest rate, the discount rate for measuring any impairment loss is the current effective interest rate determined under the contract. As a practical expedient, the Fund may measure impairment on the basis of an instrument’s fair value using an observable market price.
If, in a subsequent financial period, the amount of the impairment loss decreases and the decrease can be related objectively to an event occurring after the impairment was recognised (such as an improvement in the debtor’s credit rating), the reversal of the previously recognised impairment loss is recognised in statement of comprehensive income. When an asset is uncollectible, it is written off against the related allowance account. Such assets are written off after all the necessary procedures have been completed and the amount of the loss has been determined.
2.3 Financial liabilities
Financial liabilities are classified according to the substance of the contractual arrangements entered into and the definitions of a financial liability.
Financial liabilities, within the scope of MFRS 139 “Financial Instruments:Recognition and Measurement”, are recognised in the statement of financial position when, and only when, the Fund becomes a party to the contractual provisions of the financial instrument.

2323
2 SUMMARY OF SIGNIFICANT ACCOUNTING POLICIES (CONTINUED)
2.3 Financial liabilities (continued)
The Fund’s financial liabilities which include income distribution payable, amount due to stockbrokers, amount due to Manager, accrued management fee, amount due to Trustee and other payables and accruals are recognised initially at fair value plus directly attributable transaction costs and subsequently measured at amortised cost using the effective interest method.
A financial liability is de-recognised when the obligation under the liability is extinguished. Gains and losses are recognised in statement of comprehensive income when the liabilities are de-recognised, and through the amortisation process.
2.4 Unitholders’ capital
The unitholders’ contributions to the Fund meet the criteria of the definition of puttable instruments under MFRS 132 “Financial Instruments: Presentation”. Those criteria include:
the units entitle the holder to a proportionate share of the Fund’s net assets value;
the units are the most subordinated class and class features are identical; there is no contractual obligations to deliver cash or another financial asset
other than the obligation on the Fund to repurchase; and the total expected cash flows from the units over its life are based
substantially on the profit or loss of the Fund.
The outstanding units are carried at the redemption amount that is payable at each financial period if unitholder exercises the right to put the unit back to the Fund.
Units are created and cancelled at prices based on the Fund’s net asset value per unit at the time of creation or cancellation. The Fund’s net asset value per unit is calculated by dividing the net assets attributable to unitholders with the total number of outstanding units.

2424
2 SUMMARY OF SIGNIFICANT ACCOUNTING POLICIES (CONTINUED)
2.5 Income recognition
Dividend income from quoted investments is recognised when the Fund’s right to receive payment is established.
Interest income from deposits with licensed financial institutions is recognised on an accrual basis using the effective interest method.
Realised gain or loss on sale of quoted investments is arrived at after accounting for cost of investments, determined on the weighted average cost method.
2.6 Taxation
Current tax expense is determined according to Malaysian tax laws and includes all taxes based upon the taxable income earned during the financial period.
2.7 Cash and cash equivalents
For the purpose of the statement of cash flows, cash and cash equivalents comprise bank balance and deposits with a licensed financial institution which are subject to an insignificant risk of changes in value.
2.8 Amount due from/to stockbrokers
Amounts due from and to brokers represent receivables for securities sold and payables for securities purchased that have been contracted for but not yet settled or delivered on the date of the statement of financial position respectively.
These amounts are recognised initially at fair value and subsequently measured at amortised cost using the effective interest method, less impairment for amounts due from stockbrokers. See Note 2.2 on impairment of financial assets.

2525
2 SUMMARY OF SIGNIFICANT ACCOUNTING POLICIES (CONTINUED)
2.9 Presentation and functional currency
Items included in the financial statements of the Fund are measured using the currency of the primary economic environment in which the Fund operates (the “functional currency”). The financial statements are presented in Ringgit Malaysia, which is the Fund’s presentation and functional currency.
2.10 Segmental information
Operating segments are reported in a manner consistent with the internal reporting used by the chief operating decision-maker. The operating results are regularly reviewed by the Manager and the Investment Committee. The Investment Committee assumes the role of chief operating decision maker, for performance assessment purposes and to make decisions about resources allocated to the investment segment based on the recommendation by the Investment & Security Selection Committee.
3 FINANCIAL RISK MANAGEMENT OBJECTIVES AND POLICIES
The Fund is exposed to a variety of risks, which include management risk, stock market risk, price risk, interest rate risk, liquidity risk, individual stock risk, credit risk, non-compliance risk and capital risk.
Financial risk management is carried out through internal control processes adopted by the Manager and adherence to the investment restrictions as stipulated in the Prospectus.
Management risk
Poor management of the Fund may jeopardise the investment of each unitholder. Therefore, it is important for the Manager to set the investment policies and appropriate strategies to be in line with the investment objective before any investment activities can be considered. However, there can be no guarantee that these measures will produce the desired results.
2626
3 FINANCIAL RISK MANAGEMENT OBJECTIVES AND POLICIES (CONTINUED)
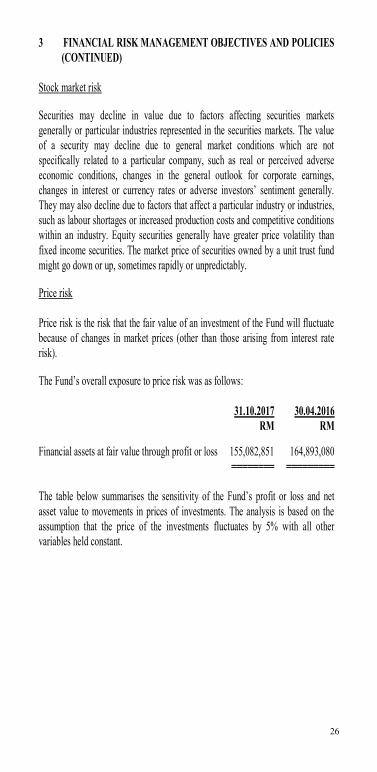
Stock market risk
Securities may decline in value due to factors affecting securities markets generally or particular industries represented in the securities markets. The value of a security may decline due to general market conditions which are not specifically related to a particular company, such as real or perceived adverse economic conditions, changes in the general outlook for corporate earnings, changes in interest or currency rates or adverse investors’ sentiment generally. They may also decline due to factors that affect a particular industry or industries, such as labour shortages or increased production costs and competitive conditions within an industry. Equity securities generally have greater price volatility than fixed income securities. The market price of securities owned by a unit trust fund might go down or up, sometimes rapidly or unpredictably.
Price risk
Price risk is the risk that the fair value of an investment of the Fund will fluctuate because of changes in market prices (other than those arising from interest rate risk).
The Fund’s overall exposure to price risk was as follows:
31.10.2017 30.04.2016 RM RM
Financial assets at fair value through profit or loss 155,082,851 164,893,080 ════════ ═════════
The table below summarises the sensitivity of the Fund’s profit or loss and net asset value to movements in prices of investments. The analysis is based on the assumption that the price of the investments fluctuates by 5% with all other variables held constant.

2727
3 FINANCIAL RISK MANAGEMENT OBJECTIVES AND POLICIES (CONTINUED)
Price risk (continued)
Change in price of
investments%
Marketvalue
RM
Impact onprofit or loss and
net asset valueRM
31.10.2017-5 147,328,708 (7,754,143)0 155,082,851 -
+5 162,836,994 7,754,143═════════ ═════════ ═════════
30.04.2017-5 156,648,426 (8,244,654)0 164,893,080 -
+5 173,137,734 8,244,654═════════ ═════════ ═════════
Interest rate risk
Interest rate risk is the risk that the cost or the value of the financial instruments will fluctuate due to changes in market interest rates. The Fund’s exposure to the interest rate risk is mainly from short term placements with financial institutions. The Manager overcomes the exposure by way of maintaining deposits on short term basis. Therefore, exposure to interest rate fluctuation is minimal.
Liquidity risk
Liquidity risk is the risk that the Fund will encounter difficulty in meeting its financial obligations.
Liquidity risk exists when particular investments are difficult to sell, possibly preventing a unit trust fund from selling such illiquid securities at an advantageous time or price. Unit trust funds with principal investment strategies that involve securities or securities with substantial market and/or credit risk tend to have the greater exposure to liquidity risk. As part of its risk management, the Manager will attempt to manage the liquidity of the Fund through asset allocation and diversification strategies within the portfolio. The Manager will also conduct constant fundamental research and analysis to forecast future liquidity of its investments.

2828
3 FINANCIAL RISK MANAGEMENT OBJECTIVES AND POLICIES (CONTINUED)
Liquidity risk (continued)
The table below summarises the Fund’s financial liabilities into relevant maturity groupings based on the remaining period from the statement of financial position date to the contractual maturity date. The amounts in the table are the contractual undiscounted cash flows. Between Less than 1 month 1 month to 1 year RM RM31.10.2017 Amount due to stockbrokers 3,153,652 - Amount due to Manager 2,232 - Accrued management fee 241,046 - Amount due to Trustee 9,642 - Other payables and accruals - 31,095 ───────── ─────────
3,406,572 31,095 ═════════ ═════════30.04.2017 Income distribution payable 9,984,585 - Amount due to Manager 83,342 - Accrued management fee 227,180 - Amount due to Trustee 9,087 - Other payables and accruals - 37,437 ───────── ─────────
10,304,194 37,437 ═════════ ═════════
Individual stock risk
The performance of each individual stock that a unit trust fund invests is dependent upon the management quality of the particular company and its growth potential. Hence, this would have an impact on the unit trust fund’s prices and its dividend income. The Manager aims to reduce all these risks by using diversification that is expected to reduce the volatility as well as the risk for the Fund’s portfolio. In addition, the Manager will also perform continuous fundamental research and analysis to aid its active asset allocation management especially in its stock selection process.

2929
3 FINANCIAL RISK MANAGEMENT OBJECTIVES AND POLICIES (CONTINUED)
Credit risk
Credit risk refers to the possibility that the issuer of a particular investment will not be able to make timely or full payments of principal or income due on that investment. The credit risk arising from placements of deposits in licensed financial institutions is managed by ensuring that the Fund will only place deposits in reputable licensed financial institutions. For amount due from stockbrokers, the settlement terms are governed by the relevant rules and regulations as prescribed by the Bursa Malaysia Securities Berhad (“Bursa Malaysia”). The settlement terms of the proceeds from the creation of units receivable from the Manager are governed by the SC Guidelines on Unit Trust Funds.
The following table sets out the credit risk concentrations of the Fund.
Cash andcash
equivalentsRM
Otherfinancial
assets*RM
TotalRM
31.10.2017Financial institutions:AAA 10,312 - 10,312AA- 26,273,306 - 26,273,306Others - 1,841,581 1,841,581
26,283,618 1,841,581 28,125,199
30.04.2017Financial institutions:AAA 33,925 - 33,925AA- 14,213,940 - 14,213,940Others - 2,125,591 2,125,591
14,247,865 2,125,591 16,373,456
* Comprise amount due from stockbrokers, amount due from Manager and dividends receivable.
The financial assets of the Fund are neither past due nor impaired.

3030
3 FINANCIAL RISK MANAGEMENT OBJECTIVES AND POLICIES (CONTINUED)
Non-compliance risk
This is the risk of the Manager not complying with the internal policies, the Deeds of the Fund, all applicable laws or guidelines issued by the regulators. This may occur as a result of system failure or the inadvertence of the Manager. The magnitude of such risk and its impact on the Fund and/or unitholders are dependent on the nature and severity of the non-compliance. Non-compliance may adversely affect the Fund especially if the investment of the Fund has to be disposed at a lower price to rectify the non-compliance.
Capital risk
The capital of the Fund is represented by equity consisting of unitholders’ capital of RM143,759,358 (30.04.2017: RM136,238,811) and retained earnings ofRM36,011,767 (30.04.2017: RM34,686,836). The amount of equity can change significantly on a daily basis as the Fund is subject to daily subscriptions and redemptions at the discretion of unitholders. The Fund’s objective when managing capital is to safeguard the Fund’s ability to continue as a going concern in order to provide returns for unitholders and benefits for other stakeholders and to maintain a strong capital base to support the development of the investment activities of the Fund.
4 FAIR VALUE ESTIMATION
Fair value is defined as the price that would be received to sell an asset or paid to transfer a liability in an orderly transaction between market participants at the measurement date (i.e. an exit price).
The fair value of financial assets traded in active market (such as publicly traded derivatives and trading securities) are based on quoted market prices at the close of trading on the financial period end date.
An active market is a market in which transactions for the asset or liability take place with sufficient frequency and volume to provide pricing information on an ongoing basis.

3131
4 FAIR VALUE ESTIMATION (CONTINUED)
The fair value of financial assets that are not traded in an active market is determined by using valuation techniques. The Fund uses a variety of methods and makes assumptions that are based on market conditions existing at each financial period end date. Valuation techniques used for non-standardised financial instruments such as options, currency swaps and other over-the-counter derivatives, include the use of comparable recent transactions, reference to other instruments that are substantially the same, discounted cash flow analysis, option pricing models and other valuation techniques commonly used by market participants making the maximum use of market inputs and relying as little as possible on entity-specific inputs.
For instruments for which there is no active market, the Fund may use internally developed models, which are usually based on valuation methods and techniques generally recognised as standard within the industry. Valuation models are used primarily to value unlisted equity, debt securities and other debt instruments for which market were or have been inactive during the financial period. Some of the inputs to these models may not be market observable and are therefore estimated based on assumptions.
The output of a model is always an estimate or approximation of a value that cannot be determined with certainty, and valuation techniques employed may not fully reflect all factors relevant to the positions the Fund holds.
Valuations are therefore adjusted, where appropriate, to allow for additional factors including model risk, liquidity risk and counterparty risk.
The fair values are based on the following methodologies and assumptions:
(i) For bank balances, deposits and placements with financial institutions with maturities less than 1 year, the carrying value is a reasonable estimate of fair value.
(ii) The carrying value of receivables and payables are assumed to approximate their fair values due to their short term nature.

3232
4 FAIR VALUE ESTIMATION (CONTINUED)
Fair value hierarchy
The Fund adopted MFRS 13 “Fair Value Measurement” in respect of disclosures about the degree of reliability of fair value measurement. This requires the Fund to classify fair value measurements using a fair value hierarchy that reflects the significance of the inputs used in making the measurements. The fair value hierarchy has the following levels:
Level 1: Quoted prices (unadjusted) in active market for identical assets or liabilities
Level 2: Inputs other than quoted prices included within level 1 that are observable for the asset or liability, either directly (that is, as prices) or indirectly (that is, derived from prices)
Level 3: Inputs for the asset and liability that are not based on observable market data (that is, unobservable inputs)
The level in the fair value hierarchy within which the fair value measurement is categorised in its entirety is determined on the basis of the lowest level input that is significant to the fair value measurement in its entirety. For this purpose, the significance of an input is assessed against the fair value measurement in its entirety. If a fair value measurement uses observable inputs that require significant adjustment based on unobservable inputs, that measurement is a level 3 measurement. Assessing the significance of a particular input to the fair value measurement in its entirety requires judgement, considering factors specific to the asset or liability.
The determination of what constitutes ‘observable’ requires significant judgement by the Fund. The Fund considers observable data to be that market data that is readily available, regularly distributed or updated, reliable and verifiable, not proprietary, and provided by independent sources that are actively involved in the relevant market.

3333
4 FAIR VALUE ESTIMATION (CONTINUED)
Fair value hierarchy (continued)
The following table analyses within the fair value hierarchy the Fund’s financial assets (by class) measured at fair value:
Level 1 Level 2 Level 3 Total RM RM RM RM31.10.2017 Financial assets at fair value through profit or loss: - Quoted investments 155,082,851 - - 155,082,851 ════════ ══════ ══════ ════════
30.04.2017 Financial assets at fair value through profit or loss: - Quoted investments 164,893,080 - - 164,893,080 ════════ ══════ ══════ ════════
Investments in active listed equities, i.e. quoted investments whose values are based on quoted market prices in active markets are classified within Level 1. The Fund does not adjust the quoted prices for these instruments. The Fund’s policies on valuation of these financial assets are stated in Note 2.2.
5 FINANCIAL ASSETS AT FAIR VALUE THROUGH PROFIT OR LOSS
31.10.2017 30.04.2017 RM RM Financial assets designated as FVTPL: - Quoted investments 155,082,851 164,893,080 ════════ ════════
01.05.2017 01.05.2016 to 31.10.2017 to 31.10.2016 RM RM Net gain on financial assets at FVTPL comprised: - Net realised gain on sale of financial assets at FVTPL 2,730,004 3,288,810 - Net unrealised (loss)/gain on changes in fair values (2,327,601) 5,415,505 ──────── ──────── 402,403 8,644,315 ════════ ════════

3434
5 FINANCIAL ASSETS AT FAIR VALUE THROUGH PROFIT OR LOSS (CONTINUED)
Financial assets designated as FVTPL as at 31 October 2017 are as follows:
Fair value as at 31.10.2017 expressed as Fair value a percentage as at of value of Name of Counter Quantity Cost 31.10.2017 the Fund RM RM %
QUOTED INVESTMENTS
MAIN MARKET CONSTRUCTION Econpile Holdings Bhd 4,967,900 3,365,764 15,450,169 8.59 Gamuda Bhd 700,000 3,355,244 3,675,000 2.05IJM Corporation Bhd 300,000 866,321 957,000 0.53Ikhmas Jaya Group Bhd 2,400,000 1,654,848 1440,000 0.80 Muhibbah Engineering
(M) Bhd 1,493,500 3,345,088 4,256,475 2.37Pintaras Jaya Bhd 600,000 2,291,290 2,388,000 1.33
─────── ─────── ───── 14,878,555 28,166,644 15.67 ─────── ─────── ─────CONSUMER PRODUCTS Bioalpha Holdings Bhd 7,059,999 1,609,930 1,800,300 1.00 Kawan Food Bhd 2,163,200 4,508,814 9,056,598 5.04 Power Root Bhd 1,169,500 2,558,047 2,455,950 1.36Prolexus Bhd 2,304,900 3,594,428 2,835,027 1.58
─────── ─────── ───── 12,271,219 16,147,875 8.98 ─────── ─────── ─────FINANCE AMMB Holdings Bhd 800,000 3,448,480 3,424,000 1.90 CIMB Group Holdings
Bhd 1,754,563 9,133,391 10,773,017 5.99 Malayan Banking Bhd 601,683 4,628,138 5,565,568 3.10 Public Bank Bhd 275,000 4,295,820 5,626,500 3.13 ─────── ─────── ───── 21,505,829 25,389,085 14.12 ─────── ─────── ─────

3535
5 FINANCIAL ASSETS AT FAIR VALUE THROUGH PROFIT OR LOSS (CONTINUED)
Financial assets designated as FVTPL as at 31 October 2017 are as follows: (continued)
Fair value as at 31.10.2017 expressed as Fair value a percentage as at of value of
Name of Counter Quantity Cost 31.10.2017 the Fund RM RM %
QUOTED INVESTMENTS (CONTINUED)
MAIN MARKET (CONTINUED) INDUSTRIAL
PRODUCTS Cahya Mata Sarawak Bhd 400,000 1,557,610 1,480,000 0.82 Comfort Gloves Berhad 5,390,000 4,952,064 5,551,700 3.09 DRB-Hicom Bhd 2,300,000 2,285,399 3,910,000 2.18 Favelle Favco Bhd 500,000 1,822,600 1,405,000 0.78 HSS Engineers Berhad 1,000,000 1,167,050 1,180,000 0.66 Pecca Group Berhad 1,392,900 2,054,415 1,963,989 1.09
─────── ─────── ───── 13,839,138 15,490,689 8.62
─────── ─────── ─────
PROPERTIES Eastern & Oriental Bhd 2,490,400 5,881,031 3,835,216 2.13
Titijaya Land Berhad 4,515,700 7,293,889 6,909,021 3.84 Titijaya Land Berhad -
Preference shares 26/09/2022 5,948,550 981,511 1,576,366 0.88
UEM Sunrise Berhad 3,100,000 3,746,250 3,441,000 1.92 ─────── ─────── ───── 17,902,681 15,761,603 8.77
─────── ─────── ─────

3636
5 FINANCIAL ASSETS AT FAIR VALUE THROUGH PROFIT OR LOSS (CONTINUED)
Financial assets designated as FVTPL as at 31 October 2017 are as follows: (continued)
Fair value as at 31.10.2017 expressed as Fair value a percentage as at of value of
Name of Counter Quantity Cost 31.10.2017 the Fund RM RM %
QUOTED INVESTMENTS (CONTINUED)
MAIN MARKET (CONTINUED)
TRADING/SERVICES AirAsia Bhd 2,400,000 3,600,282 8,016,000 4.46
Axiata Group Bhd 202,553 931,389 1,091,761 0.61 Bumi Armada Bhd 2,200,000 1,601,341 1,606,000 0.89 Dayang Enterprise
Holdings Bhd 2,870,000 3,022,300 2,482,550 1.38 Dialog Group Bhd 2,124,000 2,590,029 4,800,240 2.67 Genting Bhd 123,000 983,545 1,113,150 0.62 MBM Resources Bhd 1,000,000 2,349,580 2,060,000 1.14 Petronas Dagangan Bhd 150,000 2,661,323 3,594,000 2.00 Rhone Ma Holdings
Berhad 1,291,700 1,191,070 1,291,700 0.72 Sapura Energy Berhad 3,350,000 5,076,390 5,360,000 2.98 Sentoria Group Berhad 2,098,600 2,963,421 1,542,471 0.86 Sime Darby Bhd 500,000 4,348,100 4,600,000 2.56 Tenaga Nasional Bhd 448,000 3,808,931 6,720,000 3.74 UZMA BERHAD 2,603,800 5,852,396 3,775,510 2.10 Yinson Holdings Bhd 1,444,000 4,178,955 5,718,240 3.18
──────── ──────── ───── 45,159,052 53,771,622 29.91
──────── ──────── ─────

3737
5 FINANCIAL ASSETS AT FAIR VALUE THROUGH PROFIT OR LOSS (CONTINUED)
Financial assets designated as FVTPL as at 31 October 2017 are as follows: (continued)
Fair value as at 31.10.2017 expressed as Fair value a percentage as at of value of
Name of Counter Quantity Cost 31.10.2017 the Fund RM RM %
QUOTED INVESTMENTS (CONTINUED)
MAIN MARKET (CONTINUED)
TSR/WARRANTS/CALL WARRANTS Bioalpha Holdings Bhd-
Warrant 05/01/2020 1,933,333 - 280,333 0.16 Eastern & Oriental Bhd-
Warrant 21/07/2019 500,000 - 75,000 0.04 ──────── ──────── ───── - 355,333 0.20 ──────── ──────── ─────
TOTAL INVESTMENTS 125,556,474 155,082,851 86.27 ════════ ═════
ACCUMULATED UNREALISED GAIN 29,526,377
────────
TOTAL FINANCIAL ASSETS AT FVTPL 155,082,851
════════

3838
5 FINANCIAL ASSETS AT FAIR VALUE THROUGH PROFIT OR LOSS (CONTINUED)
Financial assets designated as FVTPL as at 30 April 2017 are as follows:
Fair value as at 30.04.2017 expressed as Fair value a percentage as at of value of Name of Counter Quantity Cost 30.04.2017 the Fund RM RM %
QUOTED INVESTMENTS
MAIN MARKET
CONSTRUCTION Econpile Holdings Bhd 4,967,900 3,365,764 11,624,886 6.80 Gamuda Bhd 700,000 3,355,244 3,689,000 2.16IJM Corporation Bhd 600,000 1,732,642 2,100,000 1.23Ikhmas Jaya Group Bhd 2,400,000 1,654,848 1,608,000 0.94 Muhibbah Engineering
(M) Bhd 1,493,500 3,345,088 4,316,215 2.52─────── ─────── ─────
13,453,586 23,338,101 13.65 ─────── ─────── ─────CONSUMER PRODUCTS Bioalpha Holdings Bhd 9,059,999 2,066,001 2,400,900 1.40 Kawan Food Bhd 2,163,200 4,508,814 9,604,608 5.62 NTPM Holding Bhd 489,000 371,536 415,650 0.24 Power Root Bhd 1,169,500 2,558,047 2,853,580 1.67 Prolexus Bhd 3,004,900 4,686,059 4,477,301 2.62 Yong Tai Bhd 454,500 488,892 727,200 0.43
─────── ─────── ───── 14,679,349 20,479,239 11.98 ─────── ─────── ─────FINANCE CIMB Group Holdings
Bhd 1,454,563 6,958,817 8,349,192 4.88 Hong Leong Bank Bhd 200,000 2,749,260 2,760,000 1.62
Malayan Banking Bhd 586,055 4,499,207 5,614,407 3.28 Public Bank Bhd 125,000 1,298,170 2,495,000 1.46 ─────── ─────── ───── 15,505,454 19,218,599 11.24 ─────── ─────── ─────

3939
5 FINANCIAL ASSETS AT FAIR VALUE THROUGH PROFIT OR LOSS (CONTINUED)
Financial assets designated as FVTPL as at 30 April 2017 are as follows: (continued)
Fair value as at 30.04.2017 expressed as Fair value a percentage as at of value of
Name of Counter Quantity Cost 30.04.2017 the Fund RM RM %
QUOTED INVESTMENTS (CONTINUED)
MAIN MARKET (CONTINUED)
INDUSTRIAL PRODUCTS
Comfort Gloves Bhd 6,890,000 6,330,189 4,685,200 2.74 DRB-Hicom Bhd 5,600,000 5,564,450 8,064,000 4.72 Favelle Favco Bhd 500,000 1,822,600 1,345,000 0.79 KNM Group Bhd 6,900,000 5,650,834 2,001,000 1.17 Pecca Group Berhad 1,573,900 2,321,376 2,392,328 1.40
─────── ─────── ───── 21,689,449 18,487,528 10.82
─────── ─────── ───── PLANTATIONS Felda Global Ventures
Holding Bhd 3,150,000 4,442,730 6,709,500 3.93 Sarawak Oil Palms Bhd 424,142 1,709,576 1,454,807 0.85
─────── ─────── ───── 6,152,306 8,164,307 4.78
─────── ─────── ─────PROPERTIES
Eastern & Oriental Bhd 2,490,400 5,881,031 4,731,760 2.77 Titijaya Land Bhd 1,565,700 2,605,089 2,708,661 1.58 UEM Sunrise Bhd 3,100,000 3,746,250 3,844,000 2.25 ─────── ─────── ─────
12,232,370 11,284,421 6.60─────── ─────── ─────

4040
5 FINANCIAL ASSETS AT FAIR VALUE THROUGH PROFIT OR LOSS (CONTINUED)
Financial assets designated as FVTPL as at 30 April 2017 are as follows: (continued)
Fair value as at 30.04.2017 expressed as Fair value a percentage as at of value of
Name of Counter Quantity Cost 30.04.2017 the Fund RM RM %
QUOTED INVESTMENTS (CONTINUED)
MAIN MARKET (CONTINUED)
TRADING/SERVICES Airasia Bhd 3,400,000 5,100,400 11,390,000 6.66 Axiata Group Bhd 400,000 1,839,040 2,060,000 1.21 Bumi Armada Bhd 2,200,000 1,601,341 1,738,000 1.02 Dayang Enterprise
Holdings Bhd 1,270,000 1,290,320 1,562,100 0.91 Dialog Group Bhd 2,124,000 2,590,029 4,141,800 2.42 Genting Bhd 200,000 1,599,260 1,968,000 1.15 Malaysia Airport
Holding Bhd 200,000 1,328,720 1,520,000 0.89 MBM Resources Bhd 1,000,000 2,349,580 2,560,000 1.50 Petronas Dagangan Bhd 150,000 2,661,323 3,609,000 2.11 Sapura Energy Berhad 2,850,000 4,334,890 5,700,000 3.33 Sentoria Group Bhd 2,098,600 2,963,421 1,657,894 0.97Sime Darby Bhd 500,000 4,348,100 4,665,000 2.73Tenaga Nasional Bhd 648,000 5,509,347 9,033,120 5.29 Uzma Bhd 2,603,800 5,852,396 4,790,992 2.80 Yinson Holdings Bhd 2,048,800 5,929,254 6,863,480 4.02
──────── ──────── ───── 49,297,421 63,259,386 37.01 ──────── ──────── ─────

4141
5 FINANCIAL ASSETS AT FAIR VALUE THROUGH PROFIT OR LOSS (CONTINUED)
Financial assets designated as FVTPL as at 30 April 2017 are as follows: (continued)
Fair value as at 30.04.2017 expressed as Fair value a percentage as at of value of
Name of Counter Quantity Cost 30.04.2017 the Fund RM RM %
QUOTED INVESTMENTS (CONTINUED)
MAIN MARKET (CONTINUED)
TSR/WARRANTS/CALL WARRANTS Bioalpha Holdings Bhd-
Warrant 05/01/2020 1,933,333 - 386,667 0.23 Eastern & Oriental Bhd-
Warrant 21/07/2019 500,000 - 115,000 0.07Gamuda Bhd-
Warrant 06/03/2021 116,666 29,167 159,832 0.09 ──────── ──────── ───── 29,167 661,499 0.39 ──────── ──────── ─────
TOTAL INVESTMENTS 133,039,102 164,893,080 96.47 ════════ ═════
ACCUMULATED UNREALISED GAIN 31,853,978
────────
TOTAL FINANCIAL ASSETS AT FVTPL 164,893,080
════════

4242
6 CASH AND CASH EQUIVALENTS
31.10.2017 30.04.2017 RM RM
Deposits with a licensed financial institution 26,273,306 14,213,940 Bank balances 10,312 33,925 ──────── ──────── 26,283,618 14,247,865 ════════ ════════
Deposits with a licensed financial institution include interest receivable of RM2,195 (30.04.2017: RM3,562).
31.10.2017 30.04.2017
Weighted average effective interest rate 3.05% 3.05% ════════ ════════ Average maturity 1 day 2 days ════════ ════════
7 OTHER PAYABLES AND ACCRUALS
31.10.2017 30.04.2017 RM RM
Audit fee payable 4,638 9,275 Tax agent’s fee payable 12,400 10,500
Sundry payables and accruals 14,057 17,662 ──────── ──────── 31,095 37,437 ════════ ════════
4343
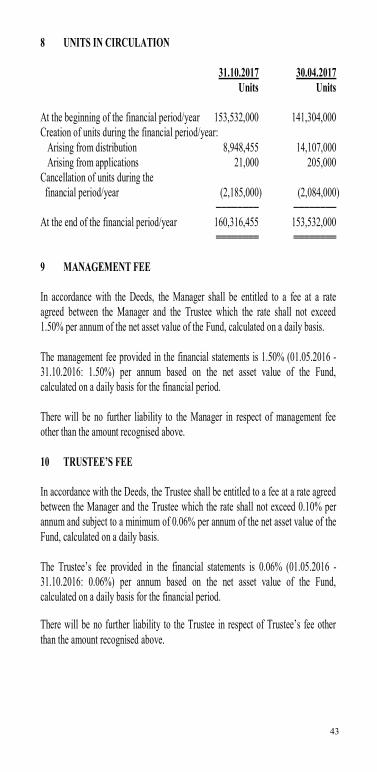
8 UNITS IN CIRCULATION
31.10.2017 30.04.2017 Units Units
At the beginning of the financial period/year 153,532,000 141,304,000 Creation of units during the financial period/year:
Arising from distribution 8,948,455 14,107,000 Arising from applications 21,000 205,000
Cancellation of units during the financial period/year (2,185,000) (2,084,000)
──────── ────────At the end of the financial period/year 160,316,455 153,532,000
════════ ════════
9 MANAGEMENT FEE
In accordance with the Deeds, the Manager shall be entitled to a fee at a rate agreed between the Manager and the Trustee which the rate shall not exceed 1.50% per annum of the net asset value of the Fund, calculated on a daily basis.
The management fee provided in the financial statements is 1.50% (01.05.2016 -31.10.2016: 1.50%) per annum based on the net asset value of the Fund, calculated on a daily basis for the financial period.
There will be no further liability to the Manager in respect of management fee other than the amount recognised above.
10 TRUSTEE’S FEE
In accordance with the Deeds, the Trustee shall be entitled to a fee at a rate agreed between the Manager and the Trustee which the rate shall not exceed 0.10% per annum and subject to a minimum of 0.06% per annum of the net asset value of the Fund, calculated on a daily basis.
The Trustee’s fee provided in the financial statements is 0.06% (01.05.2016 -31.10.2016: 0.06%) per annum based on the net asset value of the Fund, calculated on a daily basis for the financial period.
There will be no further liability to the Trustee in respect of Trustee’s fee other than the amount recognised above.

4444
11 TAXATION
(a) Tax charge for the financial period
01.05.2017 - 01.05.2016 - 31.10.2017 31.10.2016
RM RM
Current taxation - - ════════ ═══════
(b) Numerical reconciliation of income tax expense
The numerical reconciliation between the profit before taxation multiplied by the Malaysian statutory income tax rate and the tax expense of the Fund is as follows:
01.05.2017 - 01.05.2016 - 31.10.2017 31.10.2016
RM RM
Profit before taxation 1,324,931 9,048,069 ════════ ════════
Tax calculated at a tax rate of 24% 317,983 2,171,537 Tax effects of: - Investment income not subject to tax (732,752) (2,552,815) - Expenses not deductible for tax purposes 66,428 82,020 - Restriction on tax deductible expenses for unit trust funds 348,341 299,258
──────── ────────Tax expense - -
════════ ════════

4545
12 MANAGEMENT EXPENSE RATIO (“MER”)
01.05.2017 - 01.05.2016 - 31.10.2017 31.10.2016
% %
MER 0.84 0.84 ════════ ════════
Management expense ratio includes management fee, Trustee’s fee, audit fee, tax agent’s fee and other administrative expenses which is calculated as follows:
MER = (A + B + C + D + E) x 100 F
A = Management fee B = Trustee’s fee C = Audit fee D = Tax agent’s fee
E = Other expenses excluding Goods and Services Tax on transaction costs F = Average net asset value of the Fund for the financial period, calculated on
a daily basis
The average net asset value of the Fund for the financial period, calculated on a daily basis is RM180,214,138 (01.05.2016 - 31.10.2016: RM164,137,804).
4646
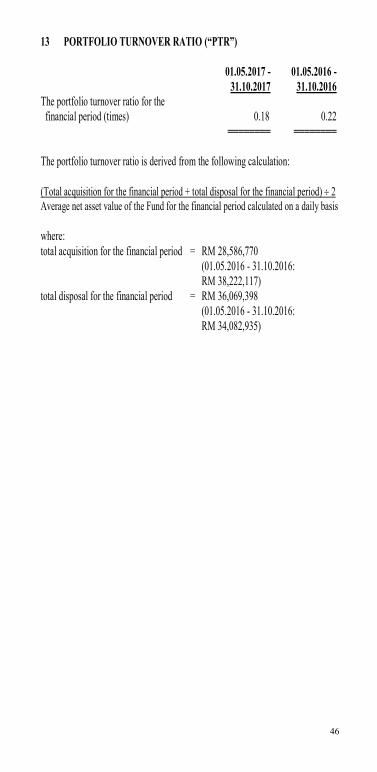
13 PORTFOLIO TURNOVER RATIO (“PTR”)
01.05.2017 - 01.05.2016 - 31.10.2017 31.10.2016The portfolio turnover ratio for the financial period (times) 0.18 0.22
════════ ════════
The portfolio turnover ratio is derived from the following calculation:
(Total acquisition for the financial period + total disposal for the financial period) 2 Average net asset value of the Fund for the financial period calculated on a daily basis
where: total acquisition for the financial period = RM 28,586,770
(01.05.2016 - 31.10.2016: RM 38,222,117)
total disposal for the financial period = RM 36,069,398 (01.05.2016 - 31.10.2016:
RM 34,082,935)
4747
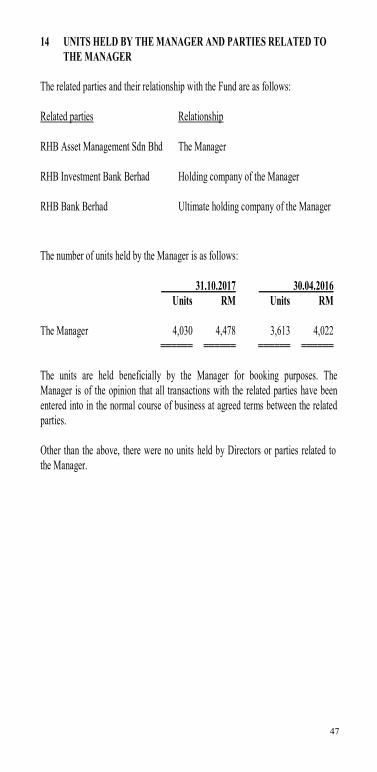
14 UNITS HELD BY THE MANAGER AND PARTIES RELATED TO THE MANAGER
The related parties and their relationship with the Fund are as follows:
Related parties Relationship
RHB Asset Management Sdn Bhd The Manager
RHB Investment Bank Berhad Holding company of the Manager
RHB Bank Berhad Ultimate holding company of the Manager
The number of units held by the Manager is as follows:
31.10.2017 30.04.2016 Units RM Units RM
The Manager 4,030 4,478 3,613 4,022══════ ══════ ══════ ══════
The units are held beneficially by the Manager for booking purposes. The Manager is of the opinion that all transactions with the related parties have been entered into in the normal course of business at agreed terms between the related parties.
Other than the above, there were no units held by Directors or parties related to the Manager.

4848
15 TRANSACTIONS BY THE FUND
Details of transactions by the Fund for the financial period ended 31 October 2017 are as follows:
Percentage Percentage of total Value of of total Brokerage brokerage Brokers/financial institutions trades trades fees fees RM % RM %
Kenanga Investment Bank Berhad 19,601,544 29.58 39,203 22.68
RHB Investment Bank Bhd* 11,812,792 17.83 23,626 13.67
CIMB Bank Bhd 5,190,115 7.83 10,380 6.01 JPMorgan Securities
(Malaysia) Sdn Bhd 4,794,500 7.24 45,729 26.46 AmInvestment Bank Bhd 4,152,340 6.27 12,457 7.21 Nomura Securities Malaysia
Sdn Bhd 3,287,760 4.96 6,576 3.81 Affin Hwang Investment
Bank Berhad 3,014,002 4.55 6,028 3.49 Alliance Investment Bank
Bhd 2,532,660 3.82 5,065 2.93 Hong Leong Investment
Bank Bhd 2,438,970 3.68 4,878 2.82 MIDF Amanah Investment
Bank Berhad 2,328,164 3.51 4,656 2.69 Others 7,110,885 10.73 14,222 8.23 ───────── ───── ────── ───── 66,263,732 100.00 172,820 100.00 ═════════ ═════ ══════ ═════

4949
15 TRANSACTIONS BY THE FUND (CONTINUED)
Details of transactions (including money market placements) by the Fund for the financial year ended 30 April 2017 are as follows:
Percentage Percentage of total Value of of total Brokerage brokerage Brokers/financial institutions trades trades fees fees RM % RM %
Hong Leong Investment Bank Bhd 55,419,511 29.37 6,227 2.31
RHB Investment Bank Bhd* 30,111,526 15.96 64,094 23.79 Kenanga Investment
Bank Bhd 28,311,160 15.00 56,622 21.02 CIMB Investment Bank Bhd 16,986,640 9.00 49,750 18.47 Maybank Investment Bank Bhd 11,513,240 6.10 23,026 8.55 UOB Kay Hian Securities
(M) Sdn Bhd 8,890,330 4.71 17,781 6.60 CIMB Bank Bhd 6,028,000 3.20 - - Macquarie (Malaysia)
Sdn Bhd 5,799,840 3.07 11,600 4.30 Affin Bank Bhd 5,540,749 2.94 - - Alliance Investment Bank Bhd 5,279,588 2.80 10,559 3.92 Others 14,813,238 7.85 29,759 11.04 ───────── ───── ────── ───── 188,693,822 100.00 269,418 100.00 ═════════ ═════ ══════ ═════
* Included in transactions by the Fund are trades with the holding company of the Manager, RHB Investment Bank Bhd. The Manager is of the opinion that all transactions with the related company have been entered into in the normal course of business at agreed terms between the related parties.

5050
16 SEGMENT INFORMATION
The Investment & Security Selection Committee of the Manager recommends strategic resource allocations of the Fund to the Investment Committee of the Manager (collectively referred to as “Committee”). The Investment Committee of the Manager will then endorse the strategic decision recommended by the Investment & Security Selection Committee for adoption on behalf of the Fund. The operating segments are determined based on the recommendation by the Investment & Security Selection Committee and reviewed by the Investment Committee.
The internal reporting provided to the Committee for the Fund’s assets, liabilities and performance is prepared on a consistent basis with the measurement and recognition principles of MFRS. The Committee is responsible for the Fund’s entire portfolio and considers the business to have a single operating segment located in Malaysia. The Committee’s asset allocation decisions are based on a single, integrated investment strategy and the Fund’s performance is evaluated on an overall basis.
The reportable operating segments derive their income by seeking investments to achieve targeted returns commensurate with an acceptable level of risk within each portfolio. These returns consist of dividend income, interest and gains on the appreciation in the value of investments, which are derived from quoted investments in Malaysia.
There were no changes in the reportable segments during the financial period.

5151
STATEMENT BY MANAGER
We, Patrick Chin Yoke Chung and Abdul Aziz Peru Mohamed, two of the Directors of RHB Asset Management Sdn Bhd, do hereby state that in the opinion of the Directors of the Manager, the accompanying unaudited financial statements set out on pages 13 to 50 are drawn up in accordance with the provisions of the Deeds and give a true and fair view of the financial position of the Fund as of 31 October 2017 and of its financial performance and cash flows for the financial period then ended in accordance with Malaysian Financial Reporting Standards and International Financial Reporting Standards
On behalf of the Manager
PATRICK CHIN YOKE CHUNG ABDUL AZIZ PERU MOHAMED DIRECTOR DIRECTOR
Kuala Lumpur 22 December 2017

5252
TRUSTEE’S REPORT
We have acted as Trustee for RHB Capital Fund (“the Fund”) for the financial period ended 31 October 2017. To the best of our knowledge, RHB Asset Management Sdn Bhd (“the Manager”) has managed the Fund in the financial period under review in accordance with the following:
1. Limitations imposed on the investment powers of the Manager under the deeds, securities laws and these Guidelines;
2. Valuation and pricing of the Fund are carried out in accordance with the deeds and any regulatory requirement; and
3. Creation and cancellation of units are carried out in accordance with the deeds and any regulatory requirement.
For Maybank Trustees Berhad (Company No: 5004-P)
Bernice K M Lau Head, Operations
Kuala Lumpur 22 December 2017

5353
CORPORATE INFORMATION
MANAGERRHB Asset Management Sdn Bhd
PRINCIPAL AND REGISTERED OFFICELevel 8, Tower 2 & 3, RHB Centre, Jalan Tun Razak, 50400 Kuala Lumpur
BUSINESS OFFICELevel 8, Tower 2 & 3, RHB Centre, Jalan Tun Razak, 50400 Kuala Lumpur
Email address: [email protected]: 03-9205 8000Fax: 03-9205 8100Website: http://www.rhbgroup.com
BOARD OF DIRECTORSMr Patrick Chin Yoke Chung (Non-Independent Non-Executive Chairman)Encik Abdul Aziz Peru Mohamed (Senior Independent Non-Executive Director)Mr Chin Yoong Kheong (Independent Non-Executive Director)Ms Ong Yin Suen (Managing Director)Dr. Ngo Get Ping (Independent Non-Executive Director)Ms Choo Shan (Independent Non-Executive Director) (Appointed on 3 July 2017)
INVESTMENT COMMITTEE MEMBERSMr Patrick Chin Yoke Chung (Chairman) (Re-designated on 1 November 2017)Encik Abdul Aziz Peru Mohamed (Appointed on 1 November 2017)Ms Choo Shan (Appointed on 1 November 2017)YBhg Dato’ Darawati Hussain (Appointed on 1 December 2017)YBhg Dato’ Khairussaleh Ramli (Chairman) (Resigned on 1 November 2017)Mr Ong Seng Pheow (Resigned on 1 November 2017)YBhg Datuk Haji Faisal Siraj (Resigned on 1 December 2017)
CHIEF EXECUTIVE OFFICERMr Ho Seng Yee
SECRETARYEncik Azman Shah Md Yaman (LS No. 0006901)

5454
BRANCH OFFICE
Kuala Lumpur Office B-9-6, Megan Avenue 1No. 189, Jalan Tun Razak50400 Kuala LumpurTel: 03-2171 2755 Fax: 03-2770 0022
Sri Petaling Office No. 53-1 & 53-2 Jalan Radin TengahBandar Baru Sri Petaling57000 Kuala LumpurTel: 03-9054 2470 Fax: 03-9054 0934
Penang Office 64-D, Level 5, Lebuh Bishop10200 PenangTel: 04-264 5639 / 04-263 4848Fax: 04-264 5640 / 04-262 8844
Butterworth Office 2677, Jalan Chain FerryTaman Inderawasih13600 Prai, PenangTel: 04-390 0022 Fax: 04-390 0023
Ipoh Office 4th Floor, 21-25Jalan Seenivasagam, Greentown30450 Ipoh, PerakTel: 05-242 4311 Fax: 05-242 4312
Johor Bahru Office 2nd Floor, 21 & 23Jalan Molek 1/30, Taman Molek81100 Johor Bahru, JohorTel: 07-358 3587 Fax: 07-358 3581
Kuantan Office B 32-34, 2nd Floor, Lorong Tun Ismail 8Sri Dagangan II25000 Kuantan, PahangTel: 09-517 3611 Fax: 09-517 3612
Kota Bharu Office No 3953-H, 1st FloorJalan Kebun Sultan15350 Kota Bharu, KelantanTel: 09-741 8539 Fax: 09-741 8540
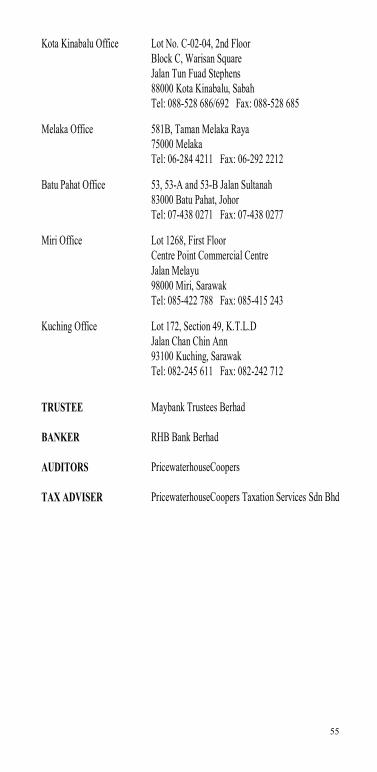
5555
Kota Kinabalu Office Lot No. C-02-04, 2nd FloorBlock C, Warisan SquareJalan Tun Fuad Stephens88000 Kota Kinabalu, SabahTel: 088-528 686/692 Fax: 088-528 685
Melaka Office 581B, Taman Melaka Raya75000 MelakaTel: 06-284 4211 Fax: 06-292 2212
Batu Pahat Office 53, 53-A and 53-B Jalan Sultanah83000 Batu Pahat, JohorTel: 07-438 0271 Fax: 07-438 0277
Miri Office Lot 1268, First FloorCentre Point Commercial CentreJalan Melayu98000 Miri, SarawakTel: 085-422 788 Fax: 085-415 243
Kuching Office Lot 172, Section 49, K.T.L.DJalan Chan Chin Ann93100 Kuching, SarawakTel: 082-245 611 Fax: 082-242 712
TRUSTEE Maybank Trustees Berhad
BANKER RHB Bank Berhad
AUDITORS PricewaterhouseCoopers
TAX ADVISER PricewaterhouseCoopers Taxation Services Sdn Bhd

5656
DISTRIBUTORS Areca Capital Sdn BhdCIMB Bank BerhadCIMB Investment Bank BerhadiFast Capital Sdn BhdOCBC Bank (Malaysia) BerhadPhillip Mutual BerhadRHB Bank BerhadRHB Investment Bank BerhadStandard Chartered Bank Malaysia BerhadStandard Financial Adviser Sdn BhdUnited Overseas Bank (Malaysia) BerhadRHB Asset Management Unit Trust Consultants