Embed Size (px)
Citation preview

i
RFID Wind Turbine Test
Crosby Lab University of Maine, Orono, ME
Adam Freund, Amanda Mayette, and Matthew Sevey4/13/2012

ii
Table of ContentsIntroduction...................................................................................................................................1
Objectives......................................................................................................................................1
Apparatus, Equipment and Instruments........................................................................................1
Theory............................................................................................................................................3
Procedure...................................................................................................................................... 4
Results........................................................................................................................................... 8
Conclusions..................................................................................................................................11
Appendices.................................................................................................................................. 12
Appendix 1 – Summary of Wind Turbine Test Data.................................................................12

1
IntroductionThe purpose of the experimental work is to determine the power output of a wind turbine of unknown origin. The turbine for the experiment was provided to the group by Dr. Joe Zydlewski, who is the Assistant Unit Leader-Fisheries at the Maine Cooperative Fish and Wildlife Research Unit and Assistant Professor of Wildlife Ecology at the University of Maine. It appears to be in good condition and would be expected to still reach its full output potential, however paperwork was lost in the transition and there is no record of performance specifications.
The experiment consists of mounting the wind turbine in the wind tunnel located in Crosby Hall Room 201. The turbine is tested at a variety of wind speeds and the power output (determined from the voltage and current) is measured using LabVIEW. For each wind speed, the turbine will be aligned such that the highest output possible is achieved. Using this data, a power curve for the turbine will be produced and analyzed. The minimum power output that the turbine must produce in order to be useable by Dr. Zydlewski is 24 W at a minimum of 24 VDC.
Objectives
1) Use LabVIEW to measure the voltage and current produced by the wind turbine at various wind speeds. The current and voltage will be measured in DC amps and volts respectively.
2) Determine the power output from the information gathered. Power is voltage times current or resistance times current squared and will be given in watts.
3) Plot the power curve from the calculated information to be used as a tool for predicting output at untested wind speeds.
4) Determine if the turbine will be a sufficient source to charge a 24 V battery bank that needs to provide 24 W of constant power.
Apparatus, Equipment and InstrumentsTable 1 - Apparatus, Equipment and Instruments
Name Model # Serial # Info(range, dimensions,etc)
Mastech Multimeter MAS830L
Elenco Precision Power Supply XP580 2N3055M0315

2
Dataq Instruments Isolated Volt Input Module
DI-5831-09 58010-27 Input: -40V to 40VOutput: -5V to 5V
DataForth Analog I/O Backpanel SCMPB05 57074-11 Input: 5V DC, max
2800mANational Instruments 8-Input Multifunction I/O USB-6009 14B003C 200mA Max
Low Current Sensor Board ACS712
Input: 5VMax Current: 5 Amps DC/ACGain: 4.27-47
Adjustable Resistor Range: 0-500
3 Phase Ac to DC converterAntec Computer with LabVIEW
Alnor CompuFlow CF8585 55060180
Wind Turbine Blade Diameter: 48in
Wind Tunnel 8ftx8ftx20ft
Joy Manufacturing Axivane Fan 38-26-1770AP SF-53921 2300 cfm, Rated for
40hp, Max 50hp
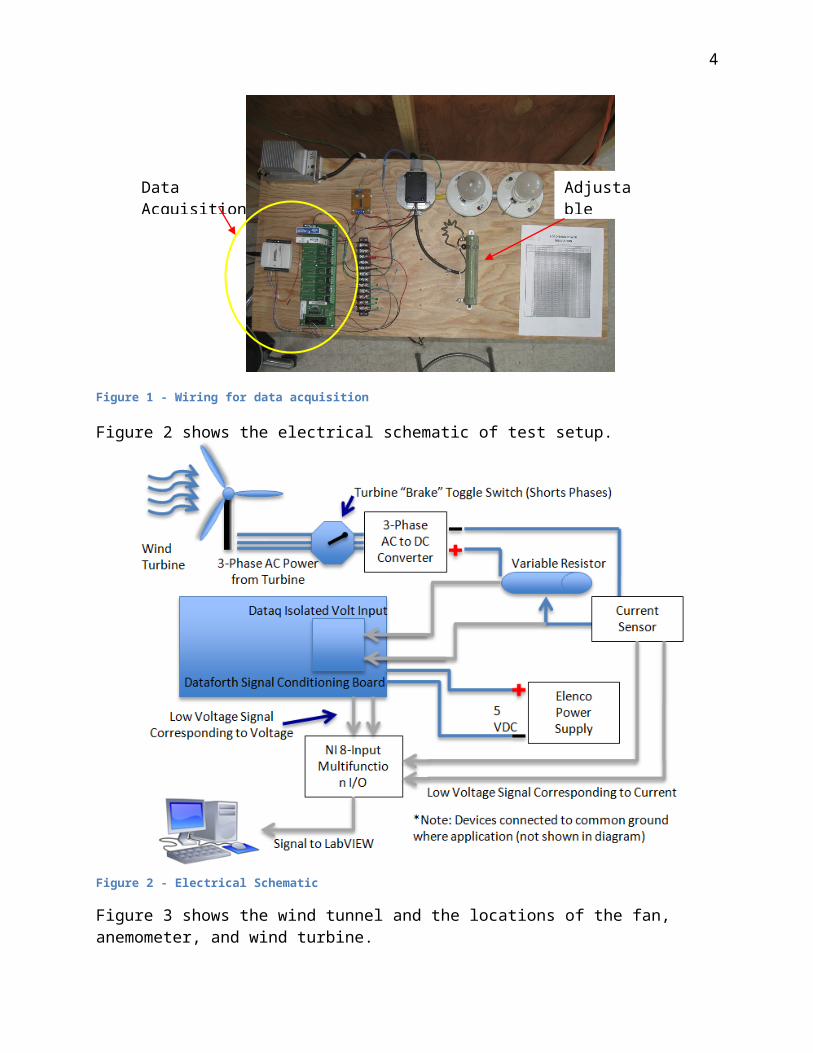
Figure 1 shows the wiring set up for the experiment.
Figure 1 - Wiring for data acquisition
Figure 2 shows the electrical schematic of test setup.
Data Acquisition Modules
Adjustable Resistor

3
Figure 2 - Electrical Schematic
Figure 3 shows the wind tunnel and the locations of the fan, anemometer, and wind turbine.
Figure 3 - Wind Tunnel Set Up
TheoryEquation 1 shows how the power is determined from the measured voltage and current.
Anemometer
4
P= V*I=I2R (1)
The voltage and current are measured, and recorded, using LabVIEW. The total resistance applied to the turbine is measured using a hand held multimeter. A multimeter is also used to measure the voltage and current to verify the LabVIEW data. The power is determined using Equation 1.
ProcedureThe first step is to adjust the fan speed by setting the fan blade angles to the desired setting. Proper lockout procedure is required on the power box in the room, to prevent possible injuries. The fan has seven blade positions, zero through six, but warning labels instruct users to only use settings four through six. Setting six produces the lowest wind speed, with the wind speed increasing as the setting number decreases. Figure 4 shows the fan blade settings.
Figure 4 - Fan Blade Settings
In order to adjust the blades, the protective grating on the back of the fan first must be removed. To remove the grating, an 11mm wrench can be used to remove the bolts that hold it on. After the grating is removed, the center cover can be removed using a 13mm wrench to remove the six bolts holding the cover on. Figures 5 through 7 show the protective grating, center cover, and the exposed blade bolts.
30 6

5
Figure 5, 6, 7 - Protective Grating, Center Cover, Blade Bolts
To adjust the blades, a 1 ¼ inch socket is needed along with a torque wrench capable of 220 ft-lbs. Each blade must be loosened, moved to the position required, and then tightened to 220 ft-lbs. Once the blades have all been adjusted, the center cover and the protective grating can be reattached and the fan can be unlocked. Figure 8 shows the power box and lockout location.
Figure 8 - Power box and lockout location
Before starting testing, it is necessary to ensure that all doors to the room are locked and that the main door is bolted so that entry is impossible. Ear protection is required due to the excessive noise made by the fan. Safety glasses should be worn because of possible flying debris. Figure 9 shows the door securely latched.
Protective Grating Center Cover
Lockout

6
Figure 9 - Door securely latched
Inside the tunnel is an anemometer for measuring the wind speed. It is extended towards to center of the tunnel as far as possible and the cap on the end is removed. There is a safety brake switch, which is switched to the brake position and then released after the LabVIEW system is up and running. The brake switch works by shorts the three-phase voltage from the turbine. This prevents the turbine from spinning when switched to the brake position. The wiring for testing and data acquisition was primarily made by reassembling the setup created by a previous group that designed and built the wind tunnel. The DataForth board is connected to the computer by via the National Instruments USB Module so that LabVIEW can be opened on the desktop to record the voltage and current. RPM can also be measured if desired, provided the proper equipment is available. Figures 10 through 13 show the anemometer, brake switch, wiring board, and computer stand.
Figure 10 and 11 - Anemometer and brake switch
Figure 12 and 13 - Wiring Board and Computer Stand

7
The fan is turned on by holding the lever in the “start” position until the fan has reached its maximum speed (after approximately 45 seconds), and then quickly pushing the lever into the “run” position. Once the fan is running, switch the safety switch off its brake setting. Wait for the wind turbine blades to reach a steady state speed and for the LabVIEW data to level off (approximately 30 seconds). Choose a file name and directory to save the data and then click the RUN button on the screen. Each test will run for 60 seconds and will stop when the test is complete. Switch the safety brake back on. During the minute run, hand voltage and current measurements are taken to verify the LabVIEW data. The voltage reading is taken across the resistor and the current reading is taken from the current sensor (in the form of a voltage signal that must be converted) placed in series with the resistor. Alternatively, if two multimeters are available, one multimeter can be left in series with the resistor to measure current. Figures 14 and 15 show the voltage and current hand measurement procedures, respectively.
Figure 14 and 15 - Voltage and Current Hand Measurements
This is repeated for 10 different settings of resistance, starting with the highest at 500 and going down to 50 by 50 increments. It is important not to drop below 50 so that the resistor does not burn out. This process will be repeated for each setting of blade position. Figures 16 and 17 show how the resistance is adjusted.

8
Figure 16 and 17 – Adjustable Resistance
ResultsThe output of the testing, as collected in LabVIEW, is displayed below in Figures 18 and 19. These two figures show the voltage output vs. wind speed and power output vs. wind speed for the turbine respectively.
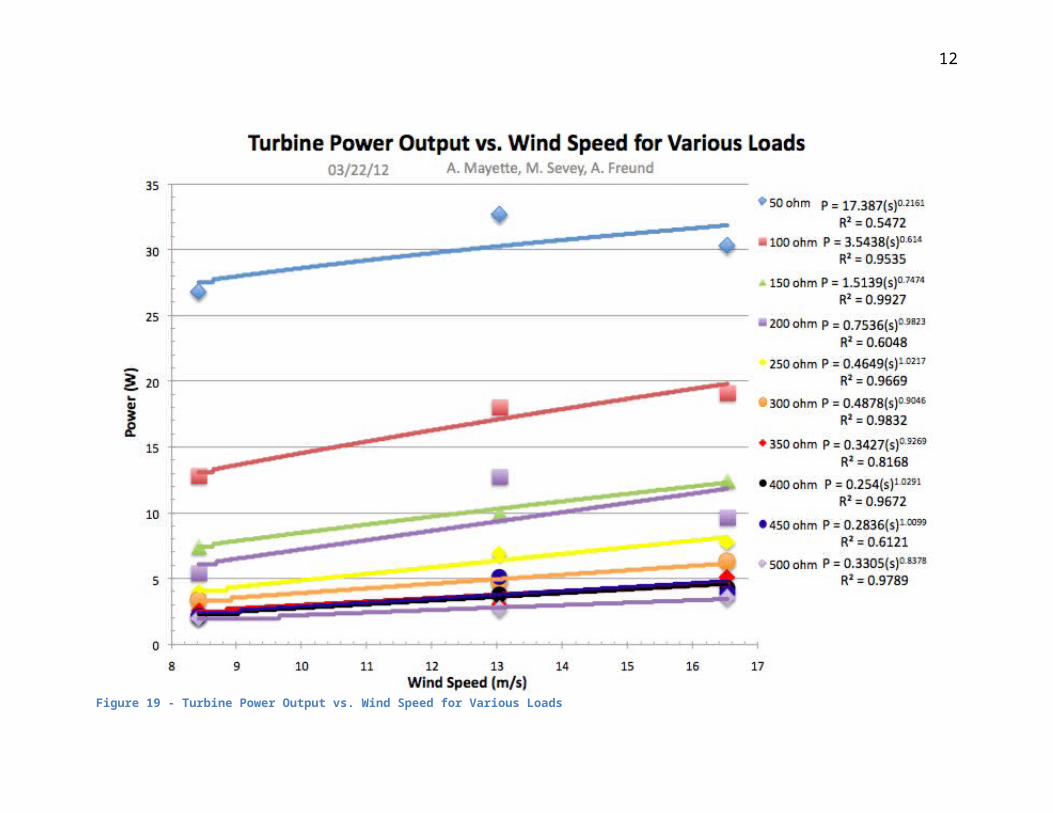
From Figure 18, a clear correlation between the wind speed and the voltage exists. As the wind increases in speed, the voltage increases as well. Since the voltage is directly proportional to the power, it also suggests that the greater the wind speed, the higher the power output will be. This is demonstrated in Figure 19 below. It is noted that the lower the resistive load applied to the turbine, the higher the power output. This is due to the current increasing proportionally as resistance decreases (Ohm’s Law). Since current has more effect on power than resistance (P = I2R), lowering the resistance increased the power dissipated by the resistor. Appendix 1 is the summarized table of data recorded while testing the wind turbine.
50 increments 500
50

9
Figure 18 - Turbine Output Voltage vs. Wind Speed for Various Loads

10
Figure 19 - Turbine Power Output vs. Wind Speed for Various Loads

11
ConclusionsAfter completing the testing of the wind turbine, it was determined that the wind turbine is not a suitable power source to charge the battery bank. While it was found to be functional and capable of generating the voltage needed to charge the 24 V battery bank, the power output is not great enough to keep up with the required power once real world conditions are considered. While the maximum power generated by the turbine slightly exceeds the required power, this is for wind speeds much higher than are anticipated to be continuously blowing. It is important to note that these results were achieved under a constant wind speed that is much higher than the average wind speed of the potential installation area.
For a resistive load of 50, which is very similar to that of the system to be powered, the maximum power obtained was 32.7 W. Since the maximum power output is close to the required power output (24 W), wind that is slower or intermittent will result in a power output significantly lower than required. For example, if the potential installation site has an average wind speed of about 2 m/s, using the best fit power equation for a 50 load found in Figure 19 (P = 17.387(s)^0.2161) to provide a very rough estimate of the expected average power gives an output of about 20 W. However, based on very similar wind turbines that were found online, the expected startup wind speed, that is, the minimum wind speed required for the turbine to generate any power, is about 3.2 m/s. Factoring in the inconsistency of wind, regardless of the wind turbine’s capability, it will be unable to generate the power that the battery bank requires.
12
Appendices
Appendix 1 – Summary of Wind Turbine Test Data
Summary of Wind Turbine Test DataTest #
Resistance (Ω)
Avg Calibrated
Voltage (V)
Avg Calibrated
Current (A)
Power = VI (watts)
P = I^2*R (watts)
P = V^2/R (watts)
Average Wind Speed (m/s)
1 506 37.422452 0.062901 2.353895 2.001983 2.767668 8.413752 454 37.297245 0.069328 2.585754 2.182111 3.064063 8.413753 402 36.919976 0.074234 2.740724 2.215306 3.390758 8.413754 347 37.019175 0.086908 3.217260 2.620886 3.949335 8.413755 299 36.691334 0.106697 3.914861 3.403901 4.502522 8.413756 250 36.123319 0.126361 4.564571 3.991763 5.219577 8.413757 203 37.304813 0.164223 6.126299 5.474730 6.855414 8.413758 155 37.046642 0.220025 8.151191 7.503711 8.854540 8.413759 102 38.453654 0.355096 13.654752 12.861528 14.496897 8.41375
10 54.1 40.483224 0.704027 28.501290 26.814895 30.293742 8.4137511 50.5 43.387111 0.804633 34.910709 32.695445 37.276067 13.036612 97.9 43.892088 0.429686 18.859823 18.075297 19.678400 13.036613 155.2 41.670792 0.254637 10.610918 10.063155 11.188498 13.036614 199.3 41.103691 0.253365 10.414219 12.793785 8.477237 13.036615 252 45.548027 0.165456 7.536205 6.898693 8.232630 13.036616 301 42.218755 0.125656 5.305048 4.752632 5.921672 13.036617 347 42.766534 0.094827 4.055422 3.120280 5.270825 13.036618 399 44.583106 0.098129 4.374877 3.842059 4.981587 13.036619 451 47.909994 0.107260 5.138819 5.188609 5.089507 13.036620 505 44.660656 0.073226 3.270328 2.707845 3.949652 13.036621 55.4 46.183210 0.739952 34.173379 30.333141 38.499800 16.535422 97.8 46.622960 0.442743 20.642006 19.170921 22.225976 16.535423 155 47.279020 0.284272 13.440122 12.525677 14.421327 16.535424 198.9 47.852656 0.220826 10.567104 9.699171 11.512703 16.535425 250 48.506536 0.176510 8.561893 7.788953 9.411536 16.535426 301 49.359507 0.145338 7.173830 6.358095 8.094222 16.535427 355 50.553823 0.120534 6.093451 5.157592 7.199124 16.535428 398 51.015885 0.104471 5.329702 4.343882 6.539248 16.535429 454 52.420880 0.093089 4.879823 3.934190 6.052750 16.535430 498 52.482170 0.084746 4.447656 3.576582 5.530880 16.535431 550 53.803418 0.075505 4.062425 3.135549 5.263287 16.535432 597 54.176289 0.071413 3.868883 3.044578 4.916366 16.535433 646 54.437251 0.063043 3.431880 2.567465 4.587329 16.535434 702 54.853771 0.055809 3.061323 2.186465 4.286234 16.535435 751 55.130655 0.050920 2.807264 1.947242 4.047123 16.535436 797 55.475797 0.048036 2.664808 1.839005 3.861435 16.535437 27.7 50.759996 1.002939 50.909156 27.863034 93.017227 16.5354

13
Notes:~For each test, the wind turbine was given time to reach steady-state conditions.~After steady state was achieved, current voltage data was recorded for one minute using LabVIEW.~A sampling rate of _ Hz was used, giving _ data points per test.~These values were average and are displayed in the table above.~Tests were performed with various resistive loads on the wind turbine.~The fan blades were configured in three orientations to produce the wind speeds seen above.~Due to the considerable fluctuations of wind speed produced by the wind tunnel, the high, low, and median range of values were collected and averaged to produce the values in the table above.