Embed Size (px)
Citation preview

Place your chosen
image here. The four
corners must just
cover the arrow tips.
For covers, the three
pictures should be the
same size and in a
straight line.
RfG Banding Thresholds – FES Scenario Data

Agenda
Intro + Key Points
Data Profiles:
Transmission System Demand
Distributed Generation
Sub 1MW Generation
Merit Orders for Response
Next steps
Back up data:
Transmission Generation
2
FES - Future Energy Scenarios
Distributed Generation – generation
directly-connected to the Distribution network
(also known as ‘embedded generation’)
Merit Order – the commercial viability of
response providers

Intro: RfG Banding
GC0048 discussions on RfG banding have focused on
reasonable expectations of Network Operators and
Generators co-ordinating to manage the GB energy network
The following data presents viable scenarios for system
demand, generation, and response levels in the coming two
decades, to illustrate how system management may change
The data is not a forecast, but is a reasonable expectation
based on inputs provided to NGET from external parties. It
has also been consulted on with Transmission and
Distribution System Owners
It is hoped this data will provide a context for this workgroup
agreeing where the GB banding thresholds should be set
http://fes.nationalgrid.com/ 3
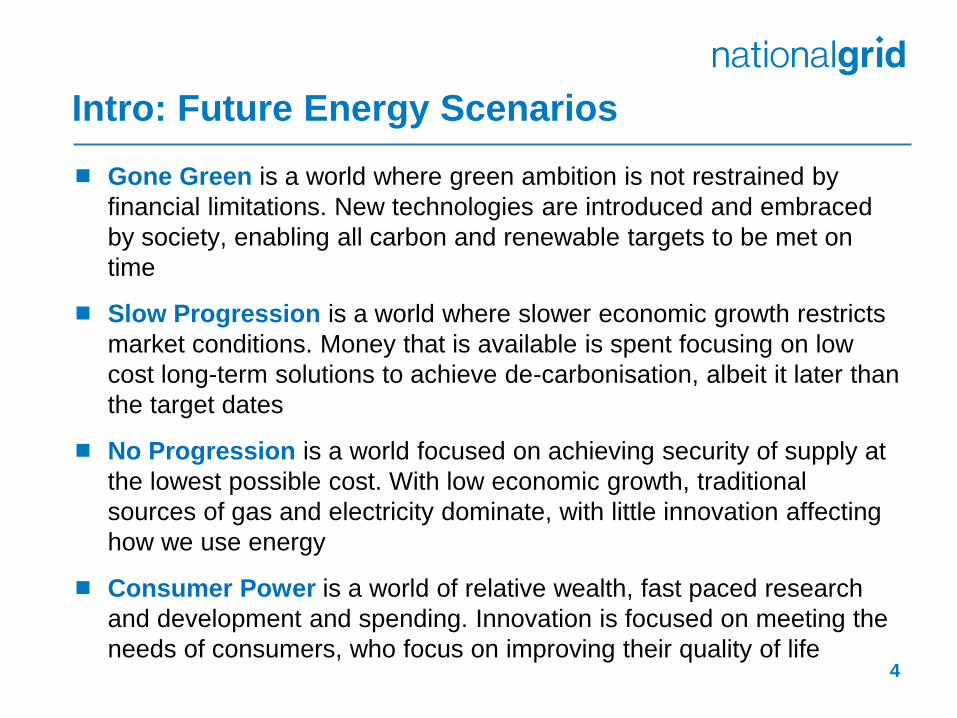
Intro: Future Energy Scenarios
Gone Green is a world where green ambition is not restrained by
financial limitations. New technologies are introduced and embraced
by society, enabling all carbon and renewable targets to be met on
time
Slow Progression is a world where slower economic growth restricts
market conditions. Money that is available is spent focusing on low
cost long-term solutions to achieve de-carbonisation, albeit it later than
the target dates
No Progression is a world focused on achieving security of supply at
the lowest possible cost. With low economic growth, traditional
sources of gas and electricity dominate, with little innovation affecting
how we use energy
Consumer Power is a world of relative wealth, fast paced research
and development and spending. Innovation is focused on meeting the
needs of consumers, who focus on improving their quality of life 4
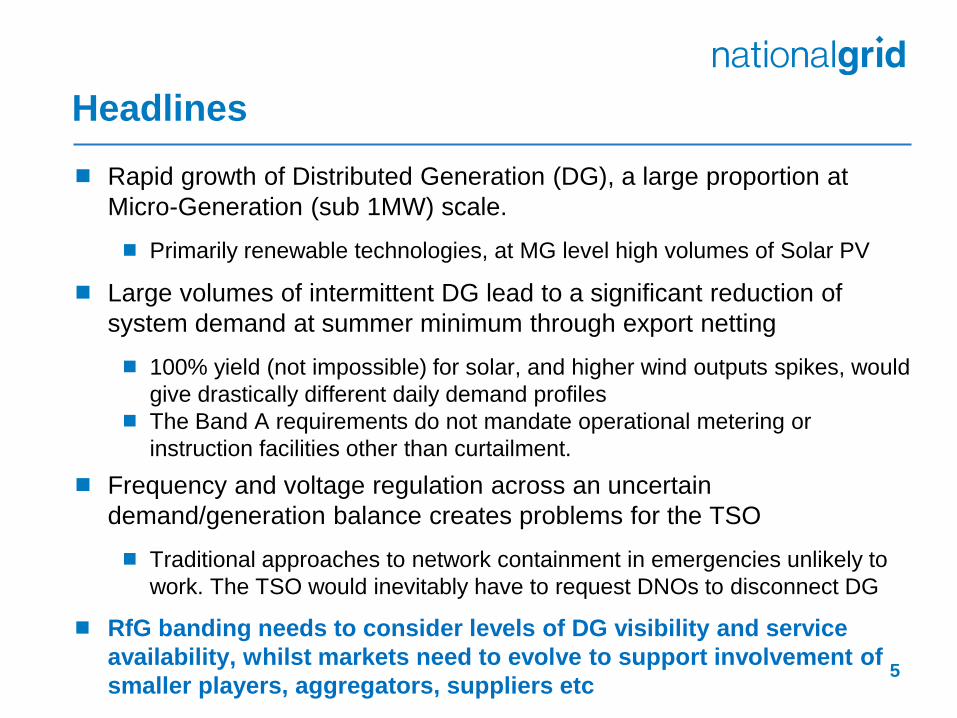
Headlines
Rapid growth of Distributed Generation (DG), a large proportion at
Micro-Generation (sub 1MW) scale.
Primarily renewable technologies, at MG level high volumes of Solar PV
Large volumes of intermittent DG lead to a significant reduction of
system demand at summer minimum through export netting
100% yield (not impossible) for solar, and higher wind outputs spikes, would
give drastically different daily demand profiles
The Band A requirements do not mandate operational metering or
instruction facilities other than curtailment.
Frequency and voltage regulation across an uncertain
demand/generation balance creates problems for the TSO
Traditional approaches to network containment in emergencies unlikely to
work. The TSO would inevitably have to request DNOs to disconnect DG
RfG banding needs to consider levels of DG visibility and service
availability, whilst markets need to evolve to support involvement of
smaller players, aggregators, suppliers etc 5

Demand
6
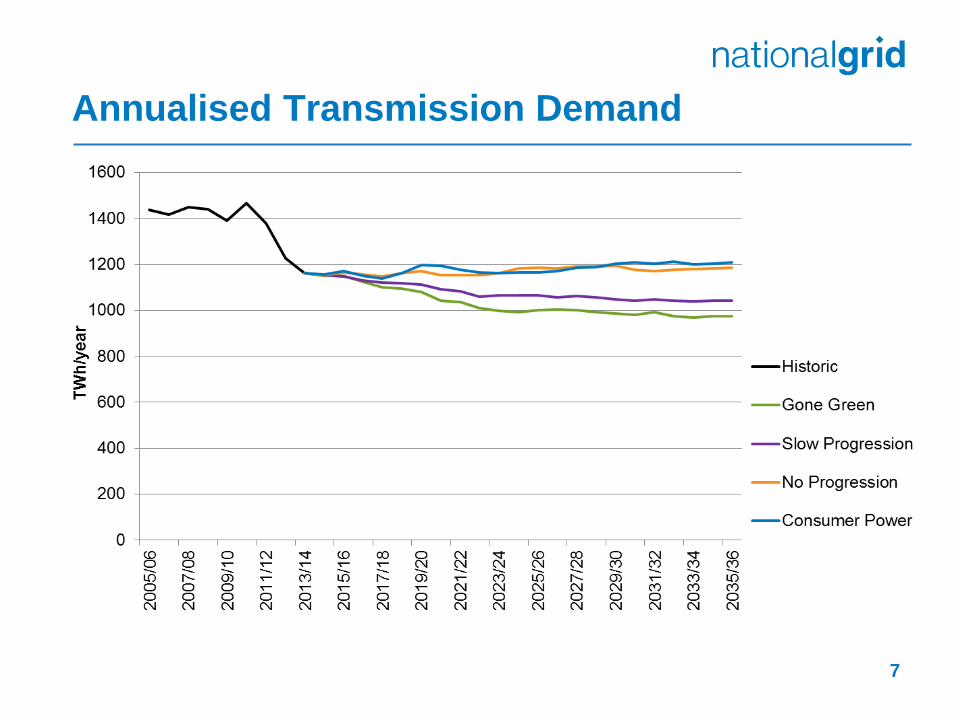
Annualised Transmission Demand
7
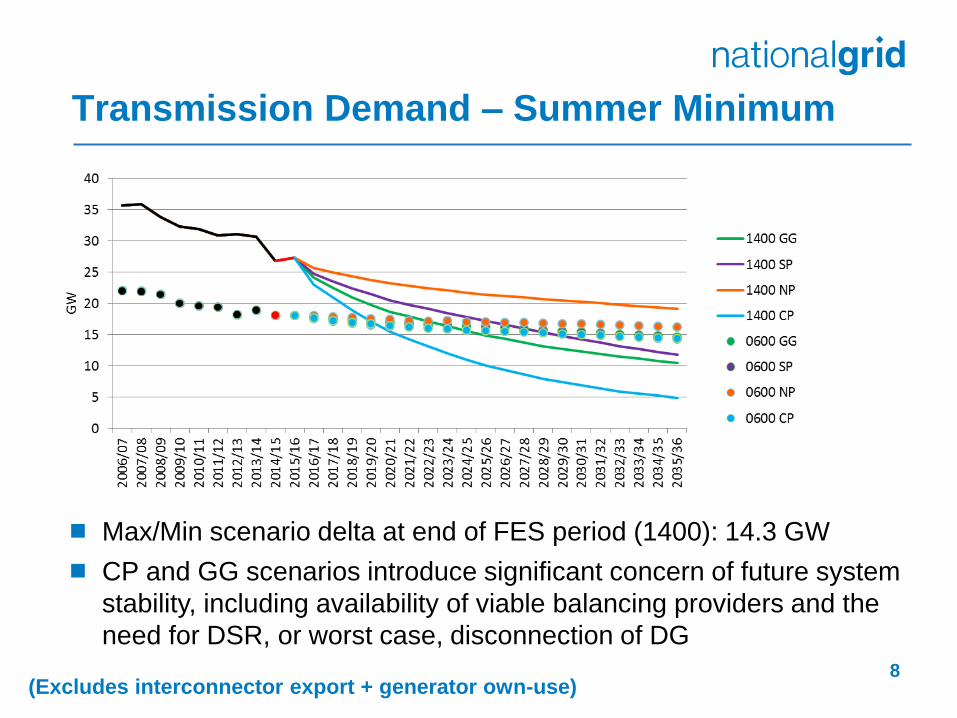
Transmission Demand – Summer Minimum
8
Max/Min scenario delta at end of FES period (1400): 14.3 GW
CP and GG scenarios introduce significant concern of future system
stability, including availability of viable balancing providers and the
need for DSR, or worst case, disconnection of DG
(Excludes interconnector export + generator own-use)

Distributed Generation
9
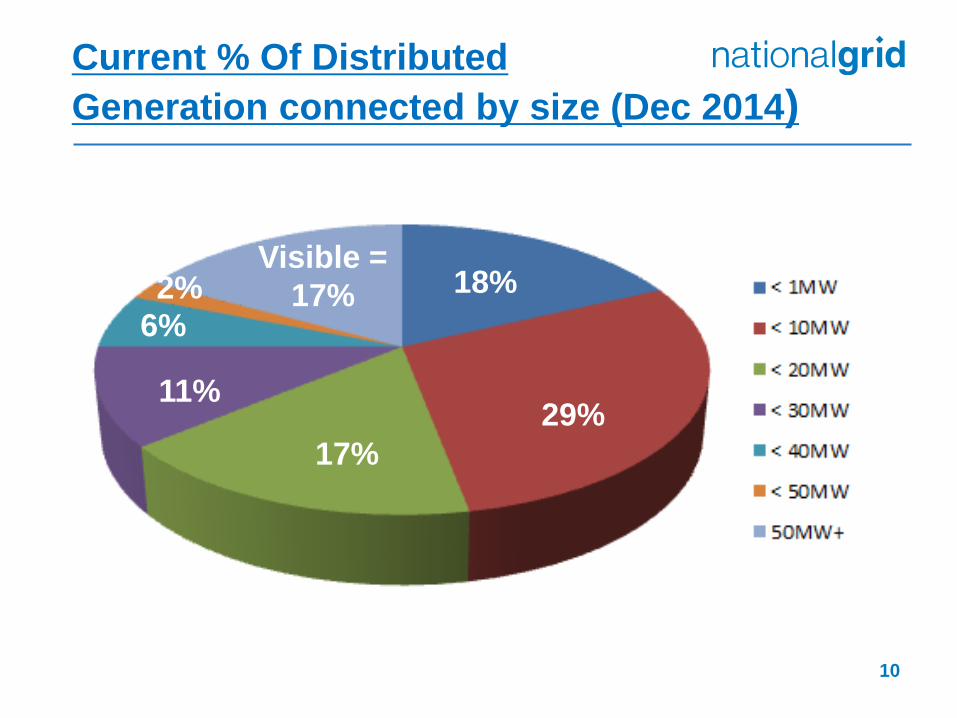
Current % Of Distributed
Generation connected by size (Dec 2014)
10
18%
29%
17%
11%
6%
2% Visible =
17%
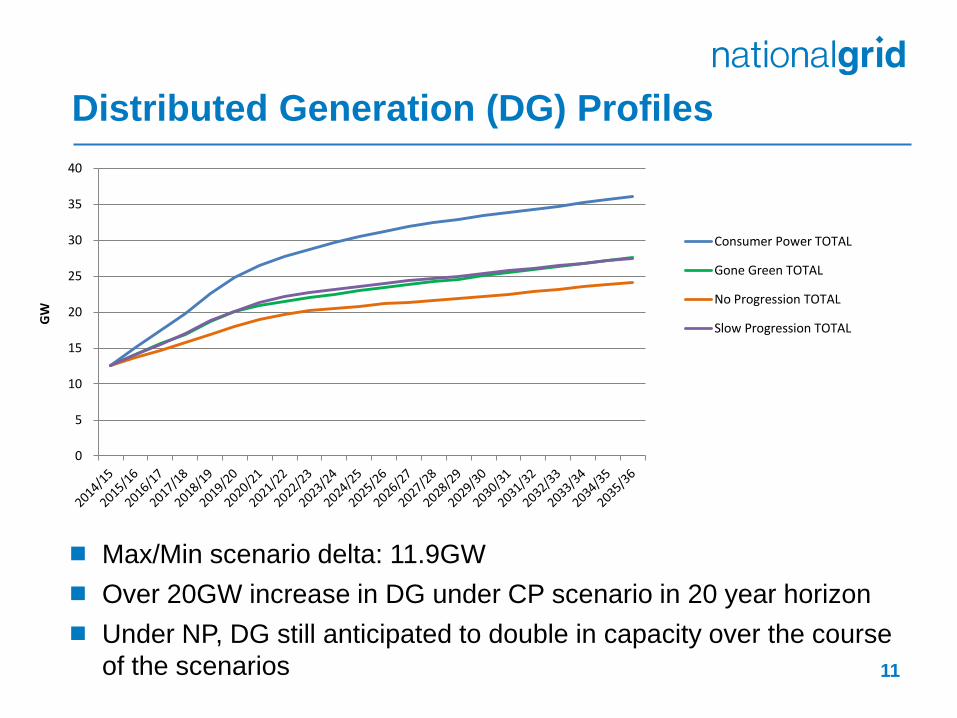
Distributed Generation (DG) Profiles
11
0
5
10
15
20
25
30
35
40
GW
Consumer Power TOTAL
Gone Green TOTAL
No Progression TOTAL
Slow Progression TOTAL
Max/Min scenario delta: 11.9GW
Over 20GW increase in DG under CP scenario in 20 year horizon
Under NP, DG still anticipated to double in capacity over the course
of the scenarios
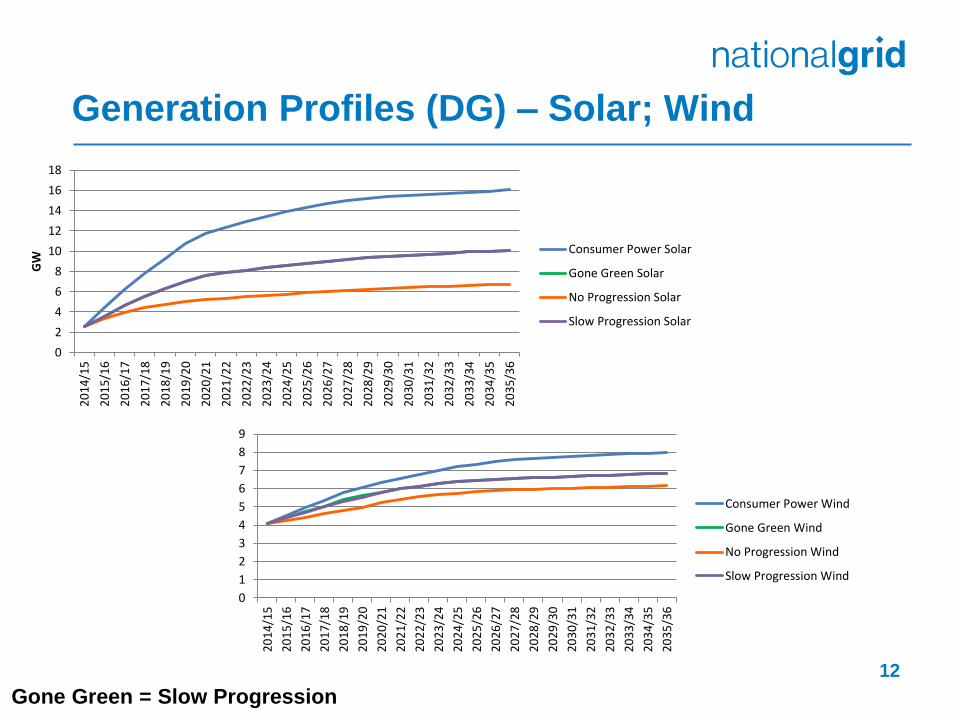
Generation Profiles (DG) – Solar; Wind
12
Gone Green = Slow Progression
0
2
4
6
8
10
12
14
16
18
20
14
/15
20
15
/16
20
16
/17
20
17
/18
20
18
/19
20
19
/20
20
20
/21
20
21
/22
20
22
/23
20
23
/24
20
24
/25
20
25
/26
20
26
/27
20
27
/28
20
28
/29
20
29
/30
20
30
/31
20
31
/32
20
32
/33
20
33
/34
20
34
/35
20
35
/36
GW
Consumer Power Solar
Gone Green Solar
No Progression Solar
Slow Progression Solar
0
1
2
3
4
5
6
7
8
9
20
14
/15
20
15
/16
20
16
/17
20
17
/18
20
18
/19
20
19
/20
20
20
/21
20
21
/22
20
22
/23
20
23
/24
20
24
/25
20
25
/26
20
26
/27
20
27
/28
20
28
/29
20
29
/30
20
30
/31
20
31
/32
20
32
/33
20
33
/34
20
34
/35
20
35
/36
Consumer Power Wind
Gone Green Wind
No Progression Wind
Slow Progression Wind
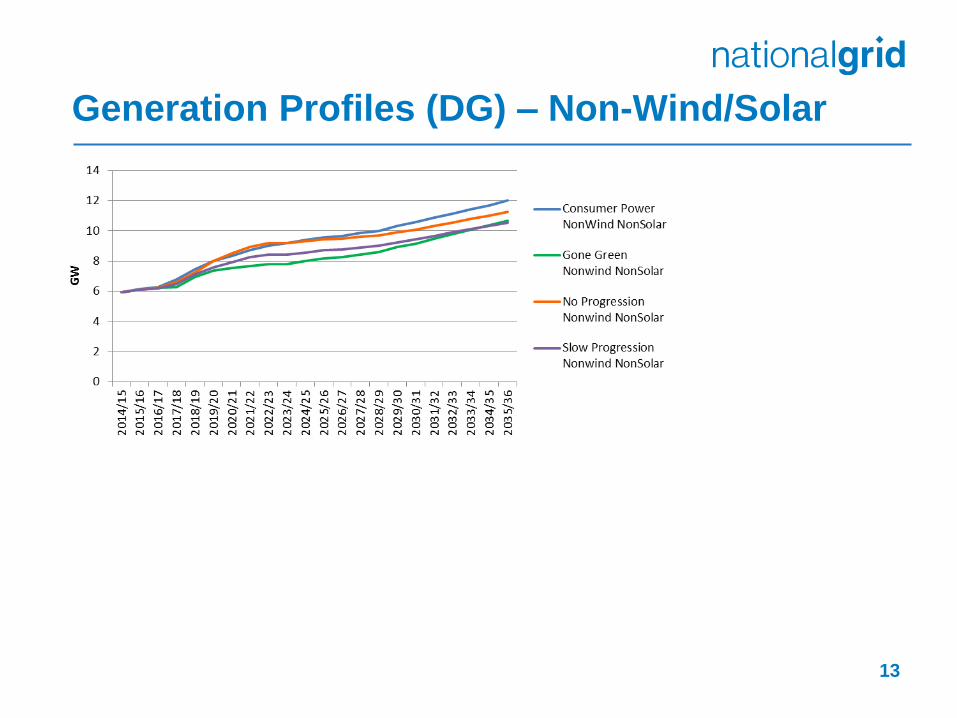
Generation Profiles (DG) – Non-Wind/Solar
13
Sub 1MW Generation
14
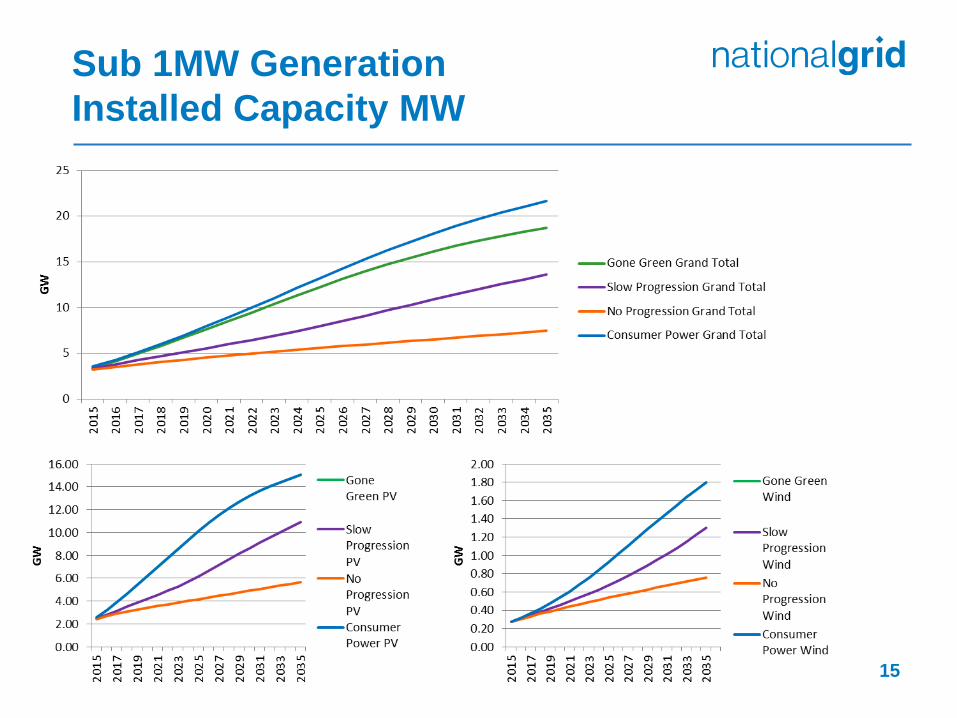
Sub 1MW Generation
Installed Capacity MW
15

Sub 1MW Generation (Installed Capacity MW)
Technology
16
-
2,000.00
4,000.00
6,000.00
8,000.00
10,000.00
12,000.00
14,000.00
16,000.00
18,000.00
20,000.00
20
14
20
15
20
16
20
17
20
18
20
19
20
20
20
21
20
22
20
23
20
24
20
25
20
26
20
27
20
28
20
29
20
30
20
31
20
32
20
33
20
34
20
35
Gone Green Fuel Cell
Gone Green mCHP
Gone Green Biomass CHP
Gone Green Bio-gas CHP
Gone Green Gas CHP
Gone Green Hydro
Gone Green Wind
Gone Green PV
-
2,000.00
4,000.00
6,000.00
8,000.00
10,000.00
12,000.00
14,000.00
16,000.00
20
14
20
15
20
16
20
17
20
18
20
19
20
20
20
21
20
22
20
23
20
24
20
25
20
26
20
27
20
28
20
29
20
30
20
31
20
32
20
33
20
34
20
35
Slow Progression Fuel Cell
Slow Progression mCHP
Slow Progression Biomass CHP
Slow Progression Bio-gas CHP
Slow Progression Gas CHP
Slow Progression Hydro
Slow Progression Wind
Slow Progression PV

Sub 1MW Generation (Installed Capacity MW)
Technology
17
-
1,000.00
2,000.00
3,000.00
4,000.00
5,000.00
6,000.00
7,000.00
8,000.00
1 2 3 4 5 6 7 8 9 10 11 12 13 14 15 16 17 18 19 20 21 22
No Progression Fuel Cell
No Progression mCHP
No Progression Biomass CHP
No Progression Bio-gas CHP
No Progression Gas CHP
No Progression Hydro
No Progression Wind
No Progression PV
-
5,000.00
10,000.00
15,000.00
20,000.00
25,000.00
1 2 3 4 5 6 7 8 9 10 11 12 13 14 15 16 17 18 19 20 21 22
Consumer Power Fuel Cell
Consumer Power mCHP
Consumer Power Biomass CHP
Consumer Power Bio-gas CHP
Consumer Power Gas CHP
Consumer Power Hydro
Consumer Power Wind
Consumer Power PV
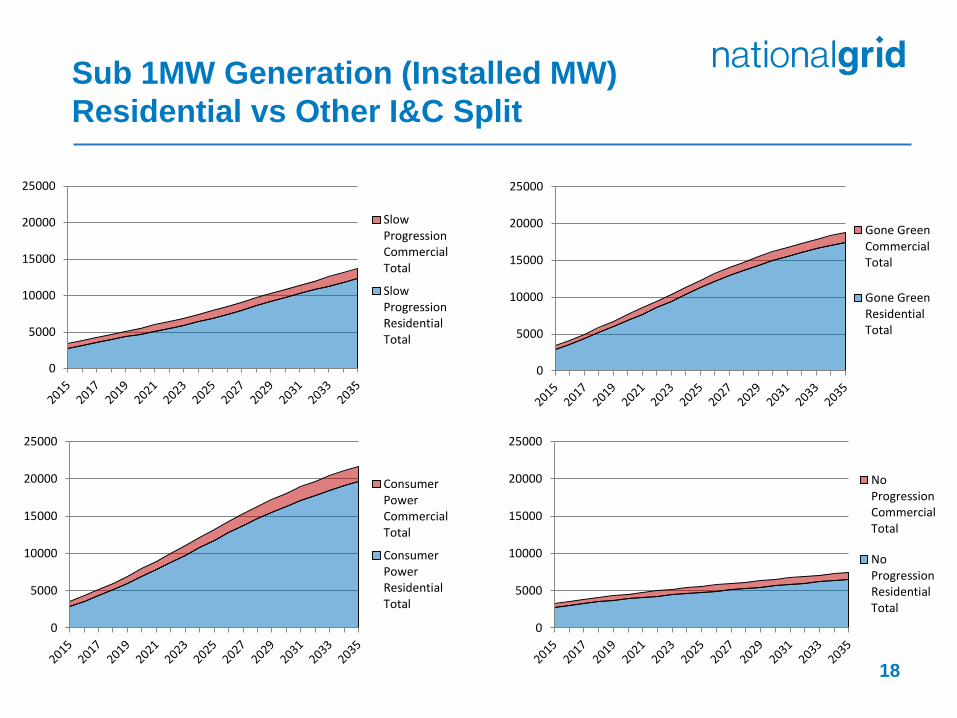
Sub 1MW Generation (Installed MW)
Residential vs Other I&C Split
18
0
5000
10000
15000
20000
25000
Gone GreenCommercialTotal
Gone GreenResidentialTotal
0
5000
10000
15000
20000
25000
SlowProgressionCommercialTotal
SlowProgressionResidentialTotal
0
5000
10000
15000
20000
25000
NoProgressionCommercialTotal
NoProgressionResidentialTotal
0
5000
10000
15000
20000
25000
ConsumerPowerCommercialTotal
ConsumerPowerResidentialTotal

Frequency Response
19
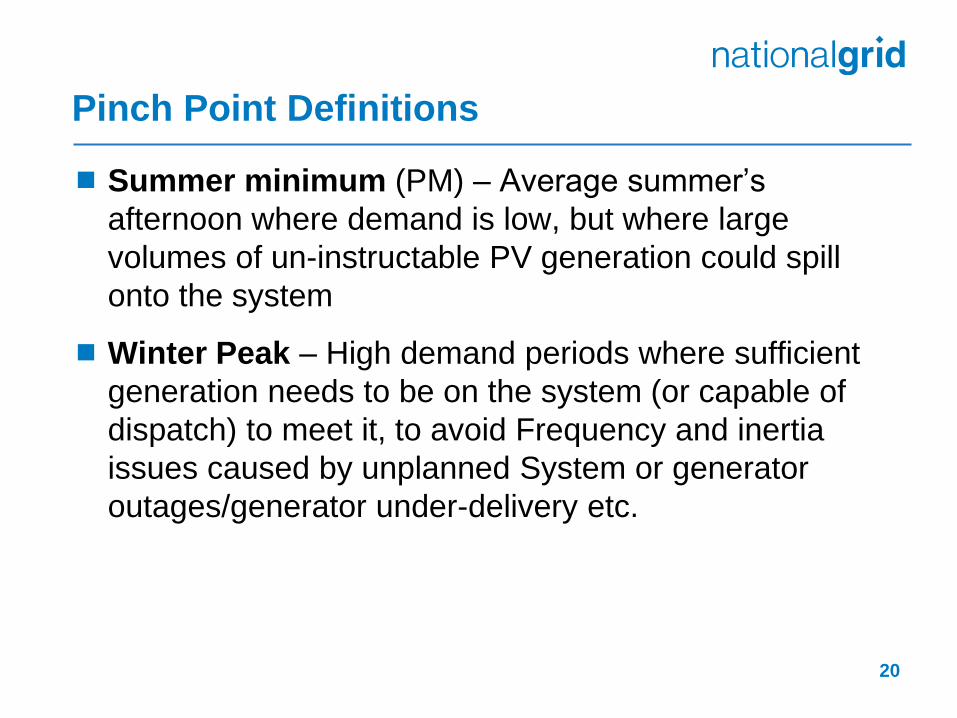
Pinch Point Definitions
Summer minimum (PM) – Average summer’s
afternoon where demand is low, but where large
volumes of un-instructable PV generation could spill
onto the system
Winter Peak – High demand periods where sufficient
generation needs to be on the system (or capable of
dispatch) to meet it, to avoid Frequency and inertia
issues caused by unplanned System or generator
outages/generator under-delivery etc.
20
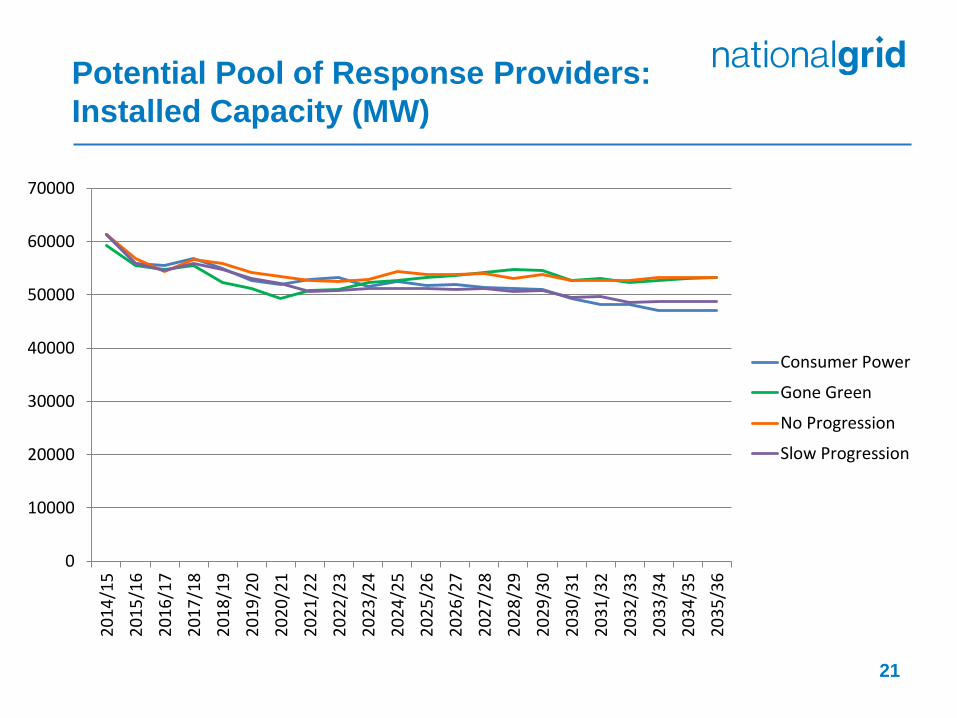
Potential Pool of Response Providers:
Installed Capacity (MW)
21
0
10000
20000
30000
40000
50000
60000
70000
20
14
/15
20
15
/16
20
16
/17
20
17
/18
20
18
/19
20
19
/20
20
20
/21
20
21
/22
20
22
/23
20
23
/24
20
24
/25
20
25
/26
20
26
/27
20
27
/28
20
28
/29
20
29
/30
20
30
/31
20
31
/32
20
32
/33
20
33
/34
20
34
/35
20
35
/36
Consumer Power
Gone Green
No Progression
Slow Progression
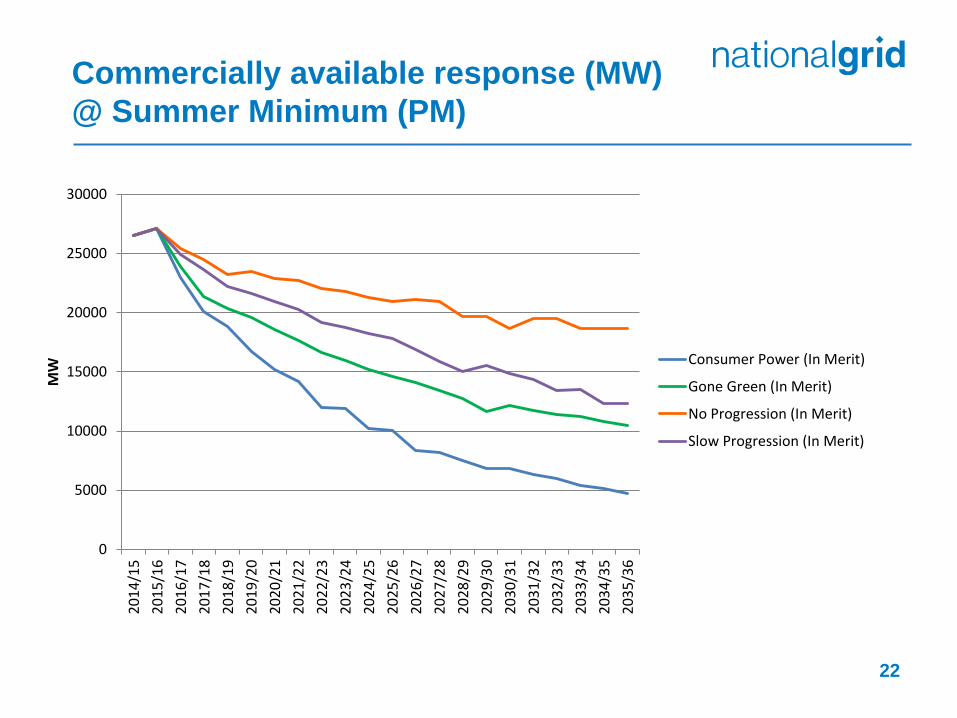
Commercially available response (MW)
@ Summer Minimum (PM)
22
0
5000
10000
15000
20000
25000
30000
20
14
/15
20
15
/16
20
16
/17
20
17
/18
20
18
/19
20
19
/20
20
20
/21
20
21
/22
20
22
/23
20
23
/24
20
24
/25
20
25
/26
20
26
/27
20
27
/28
20
28
/29
20
29
/30
20
30
/31
20
31
/32
20
32
/33
20
33
/34
20
34
/35
20
35
/36
MW
Consumer Power (In Merit)
Gone Green (In Merit)
No Progression (In Merit)
Slow Progression (In Merit)

Commercially available response (MW)
@ Winter Peak
23
40000
42000
44000
46000
48000
50000
52000
54000
56000
58000
60000
201
4/1
5
201
5/1
6
201
6/1
7
201
7/1
8
201
8/1
9
201
9/2
0
202
0/2
1
202
1/2
2
202
2/2
3
202
3/2
4
202
4/2
5
202
5/2
6
202
6/2
7
202
7/2
8
202
8/2
9
202
9/3
0
203
0/3
1
203
1/3
2
203
2/3
3
203
3/3
4
203
4/3
5
203
5/3
6
Consumer Power (in merit)
Slow Progression (in merit)
No Progression (in merit)
Gone Green (in merit)

Conclusions
24
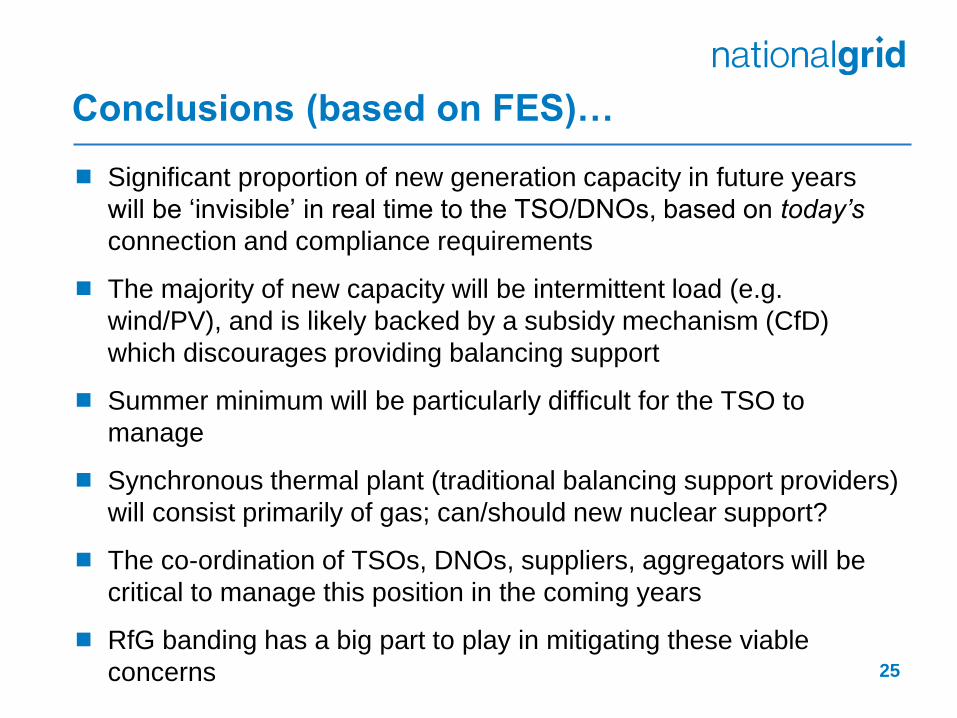
Conclusions (based on FES)…
Significant proportion of new generation capacity in future years
will be ‘invisible’ in real time to the TSO/DNOs, based on today’s
connection and compliance requirements
The majority of new capacity will be intermittent load (e.g.
wind/PV), and is likely backed by a subsidy mechanism (CfD)
which discourages providing balancing support
Summer minimum will be particularly difficult for the TSO to
manage
Synchronous thermal plant (traditional balancing support providers)
will consist primarily of gas; can/should new nuclear support?
The co-ordination of TSOs, DNOs, suppliers, aggregators will be
critical to manage this position in the coming years
RfG banding has a big part to play in mitigating these viable
concerns 25
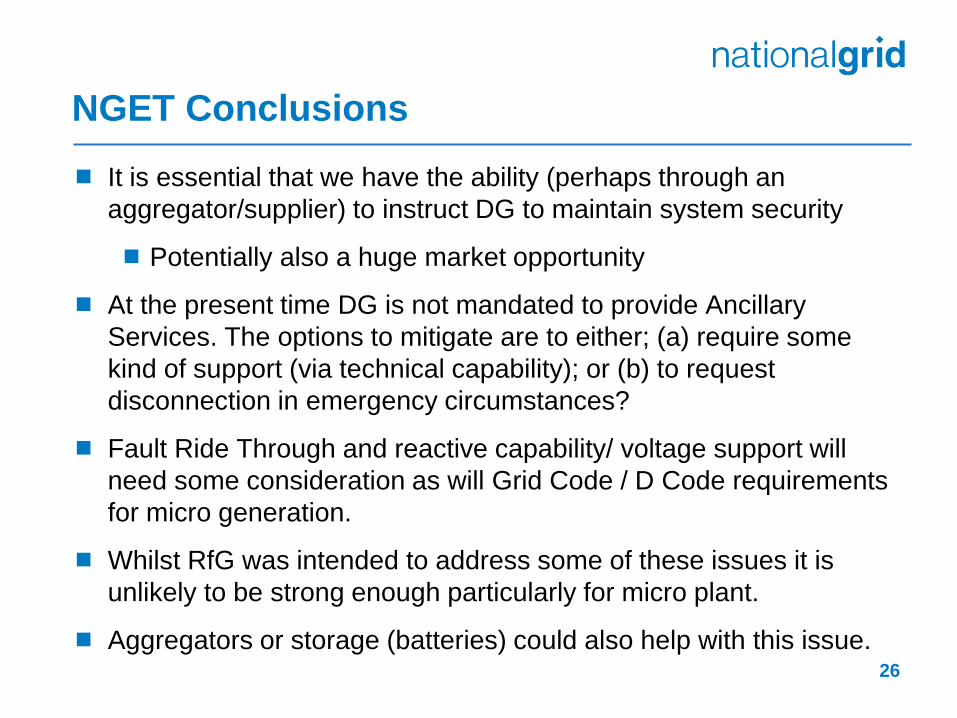
NGET Conclusions
It is essential that we have the ability (perhaps through an
aggregator/supplier) to instruct DG to maintain system security
Potentially also a huge market opportunity
At the present time DG is not mandated to provide Ancillary
Services. The options to mitigate are to either; (a) require some
kind of support (via technical capability); or (b) to request
disconnection in emergency circumstances?
Fault Ride Through and reactive capability/ voltage support will
need some consideration as will Grid Code / D Code requirements
for micro generation.
Whilst RfG was intended to address some of these issues it is
unlikely to be strong enough particularly for micro plant.
Aggregators or storage (batteries) could also help with this issue. 26
Next Steps
[To be agreed]
27

SUPPORTING INFORMATION
28

More info on four scenarios
29
Transmission Generation
30
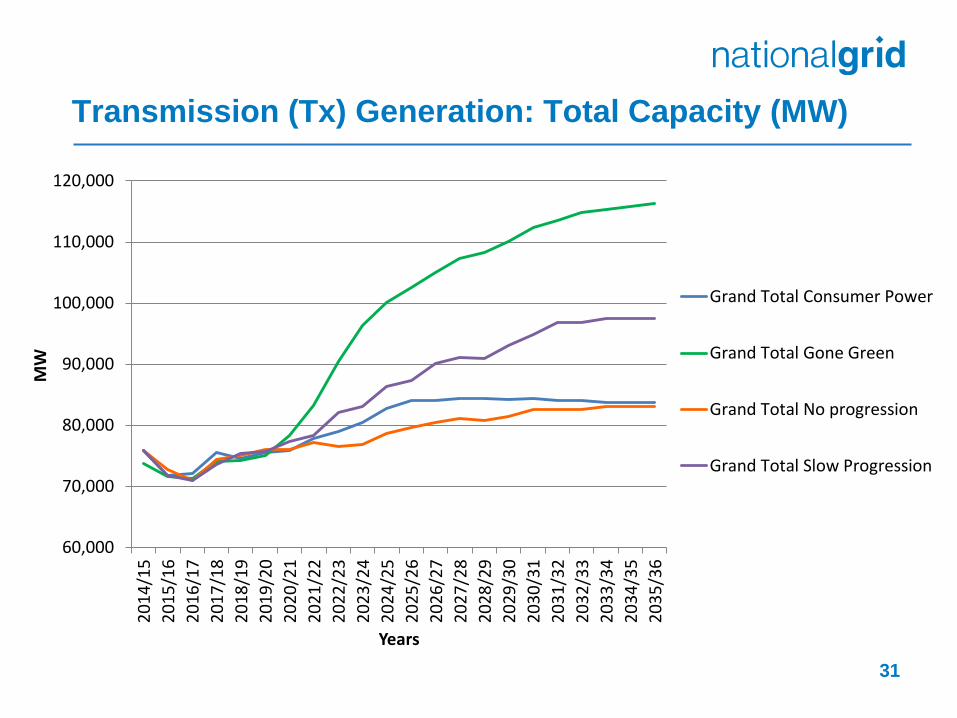
Transmission (Tx) Generation: Total Capacity (MW)
31
60,000
70,000
80,000
90,000
100,000
110,000
120,000
20
14
/15
20
15
/16
20
16
/17
20
17
/18
20
18
/19
20
19
/20
20
20
/21
20
21
/22
20
22
/23
20
23
/24
20
24
/25
20
25
/26
20
26
/27
20
27
/28
20
28
/29
20
29
/30
20
30
/31
20
31
/32
20
32
/33
20
33
/34
20
34
/35
20
35
/36
MW
Years
Grand Total Consumer Power
Grand Total Gone Green
Grand Total No progression
Grand Total Slow Progression
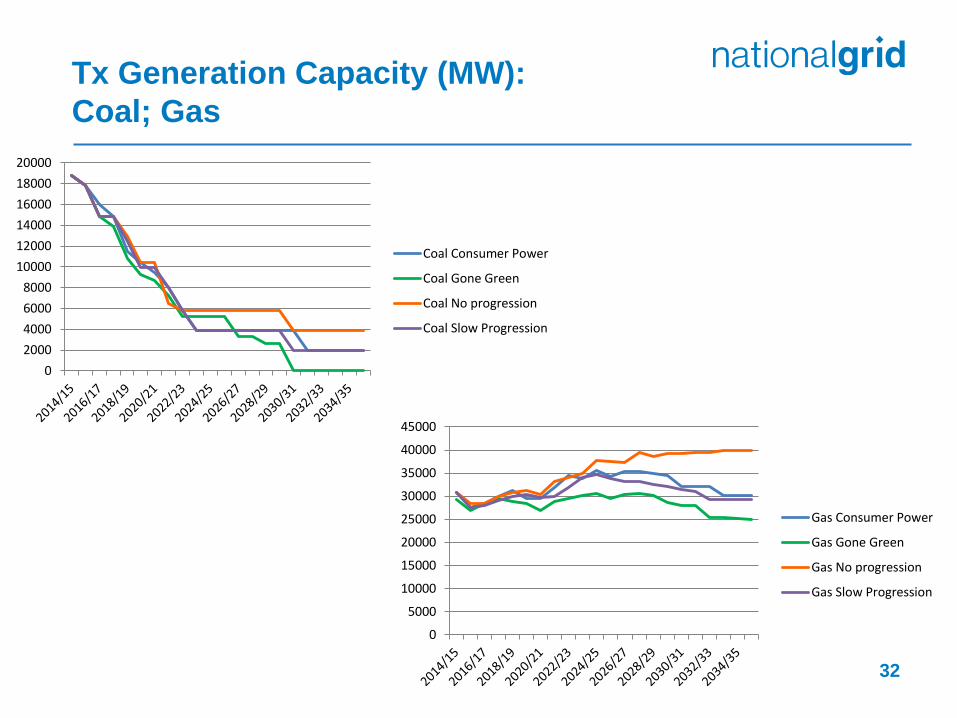
Tx Generation Capacity (MW):
Coal; Gas
32
0
5000
10000
15000
20000
25000
30000
35000
40000
45000
Gas Consumer Power
Gas Gone Green
Gas No progression
Gas Slow Progression
0
2000
4000
6000
8000
10000
12000
14000
16000
18000
20000
Coal Consumer Power
Coal Gone Green
Coal No progression
Coal Slow Progression

Tx Generation Capacity (MW):
Nuclear; Wind
33
0
2000
4000
6000
8000
10000
12000
14000
16000
Nuclear Consumer Power
Nuclear Gone Green
Nuclear No progression
Nuclear Slow Progression
0
5000
10000
15000
20000
25000
30000
35000
40000
45000
Wind Consumer Power
Wind Gone Green
Wind No progression
Wind Slow Progression

Tx Generation Capacity (MW):
Solar; Interconnector
34 0
2000
4000
6000
8000
10000
12000
14000
16000
18000
20000
Interconnector ConsumerPower
Interconnector GoneGreen
Interconnector Noprogression
Interconnector SlowProgression
0
100
200
300
400
500
600
Solar Consumer Power
Solar Gone Green
Solar No progression
Solar Slow Progression
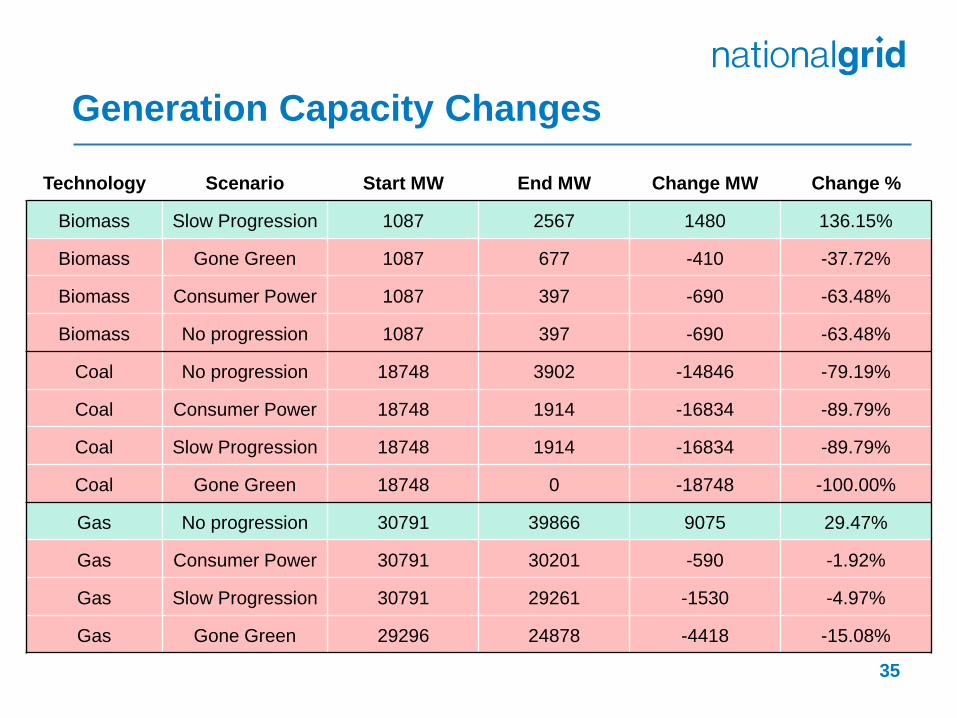
Generation Capacity Changes
35
Technology Scenario Start MW End MW Change MW Change %
Biomass Slow Progression 1087 2567 1480 136.15%
Biomass Gone Green 1087 677 -410 -37.72%
Biomass Consumer Power 1087 397 -690 -63.48%
Biomass No progression 1087 397 -690 -63.48%
Coal No progression 18748 3902 -14846 -79.19%
Coal Consumer Power 18748 1914 -16834 -89.79%
Coal Slow Progression 18748 1914 -16834 -89.79%
Coal Gone Green 18748 0 -18748 -100.00%
Gas No progression 30791 39866 9075 29.47%
Gas Consumer Power 30791 30201 -590 -1.92%
Gas Slow Progression 30791 29261 -1530 -4.97%
Gas Gone Green 29296 24878 -4418 -15.08%
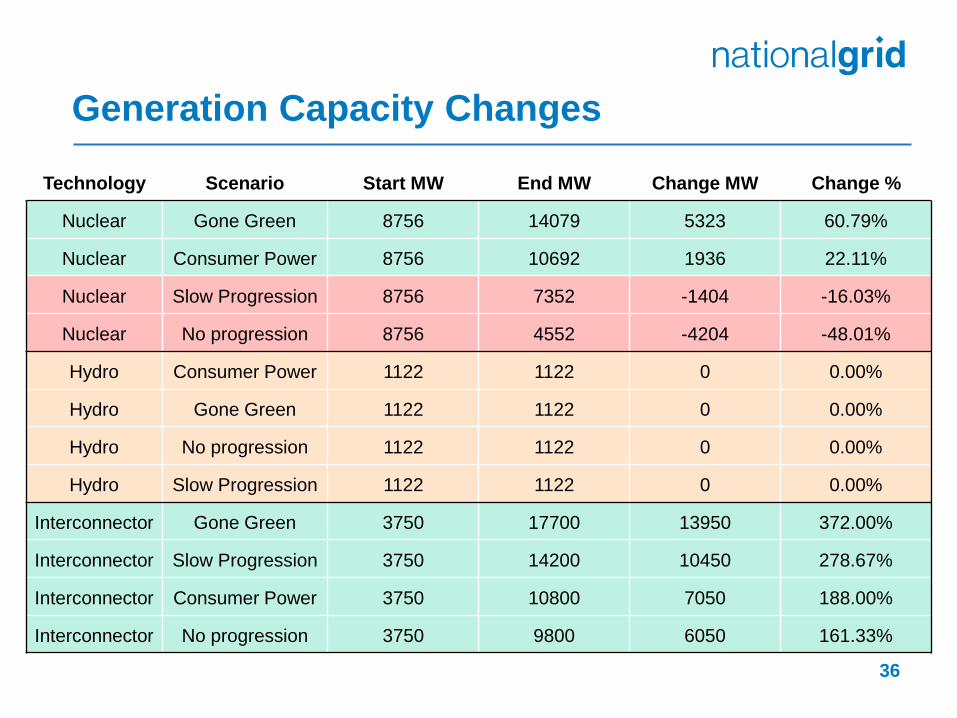
Generation Capacity Changes
36
Technology Scenario Start MW End MW Change MW Change %
Nuclear Gone Green 8756 14079 5323 60.79%
Nuclear Consumer Power 8756 10692 1936 22.11%
Nuclear Slow Progression 8756 7352 -1404 -16.03%
Nuclear No progression 8756 4552 -4204 -48.01%
Hydro Consumer Power 1122 1122 0 0.00%
Hydro Gone Green 1122 1122 0 0.00%
Hydro No progression 1122 1122 0 0.00%
Hydro Slow Progression 1122 1122 0 0.00%
Interconnector Gone Green 3750 17700 13950 372.00%
Interconnector Slow Progression 3750 14200 10450 278.67%
Interconnector Consumer Power 3750 10800 7050 188.00%
Interconnector No progression 3750 9800 6050 161.33%
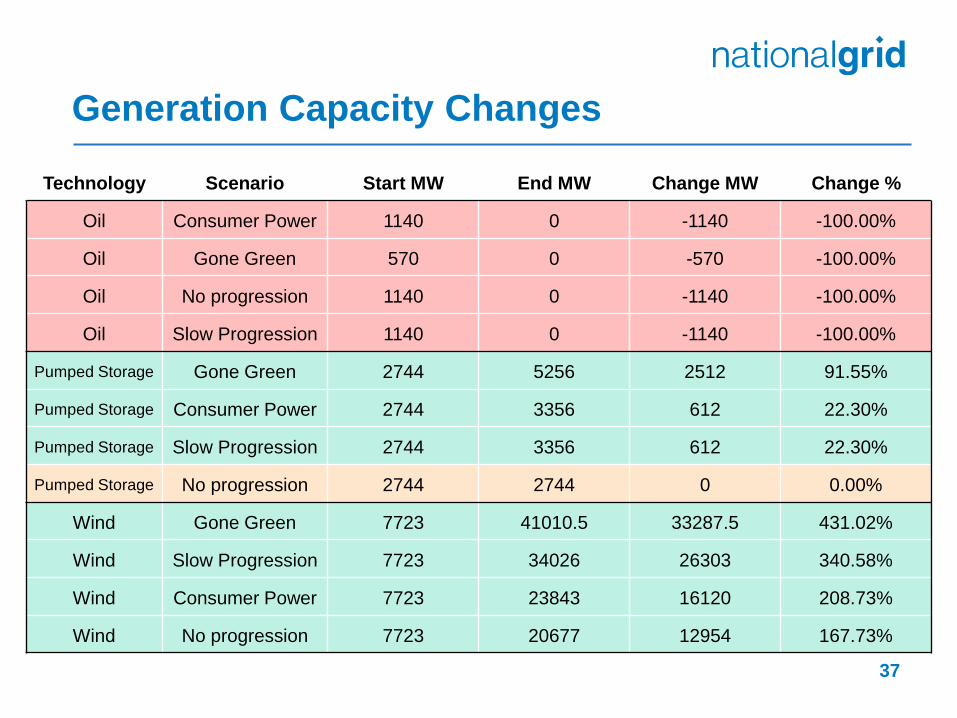
Generation Capacity Changes
37
Technology Scenario Start MW End MW Change MW Change %
Oil Consumer Power 1140 0 -1140 -100.00%
Oil Gone Green 570 0 -570 -100.00%
Oil No progression 1140 0 -1140 -100.00%
Oil Slow Progression 1140 0 -1140 -100.00%
Pumped Storage Gone Green 2744 5256 2512 91.55%
Pumped Storage Consumer Power 2744 3356 612 22.30%
Pumped Storage Slow Progression 2744 3356 612 22.30%
Pumped Storage No progression 2744 2744 0 0.00%
Wind Gone Green 7723 41010.5 33287.5 431.02%
Wind Slow Progression 7723 34026 26303 340.58%
Wind Consumer Power 7723 23843 16120 208.73%
Wind No progression 7723 20677 12954 167.73%

Generation Mix
38
Consumer Power: 2014-15
Gas
Coal
Nuclear
Wind
Interconnector
Pumped_Storage
Oil
Hydro
Biomass
CCS
Marine
Solar
Consumer Power: 2035-36
Gas
Coal
Nuclear
Wind
Interconnector
Pumped_Storage
Oil
Hydro
Biomass
CCS
Marine
Solar

Generation Mix
39
Gone Green: 2014-15
Gas
Coal
Nuclear
Wind
Interconnector
Pumped_Storage
Hydro
Biomass
Oil
CCS
Marine
Solar
Gone Green: 2035-36
Gas
Coal
Nuclear
Wind
Interconnector
Pumped_Storage
Hydro
Biomass
Oil
CCS
Marine
Solar
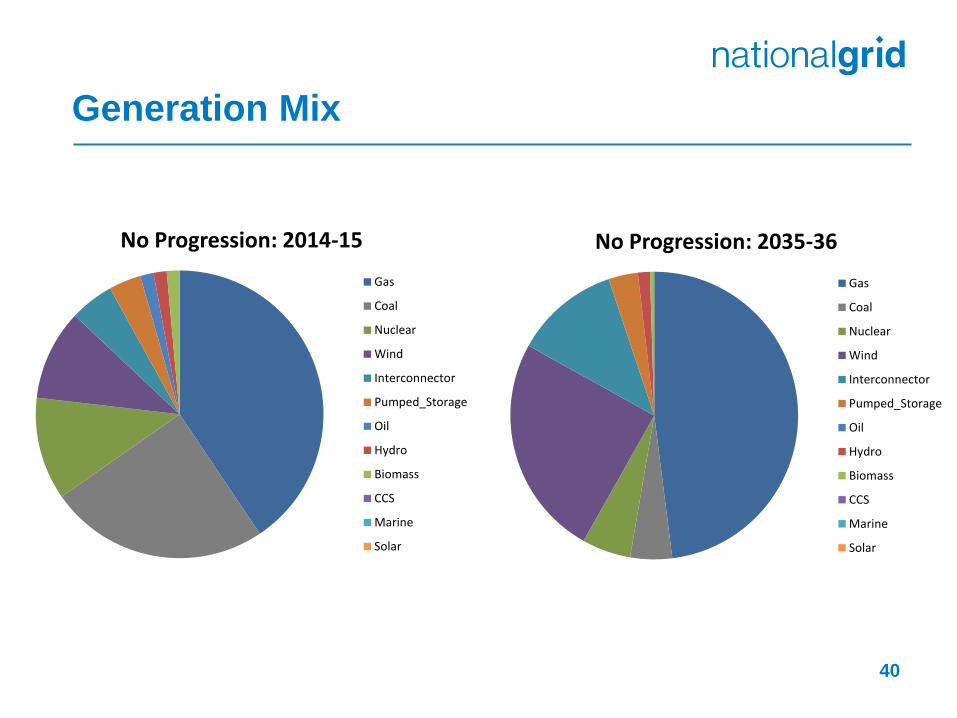
Generation Mix
40
No Progression: 2014-15
Gas
Coal
Nuclear
Wind
Interconnector
Pumped_Storage
Oil
Hydro
Biomass
CCS
Marine
Solar
No Progression: 2035-36
Gas
Coal
Nuclear
Wind
Interconnector
Pumped_Storage
Oil
Hydro
Biomass
CCS
Marine
Solar
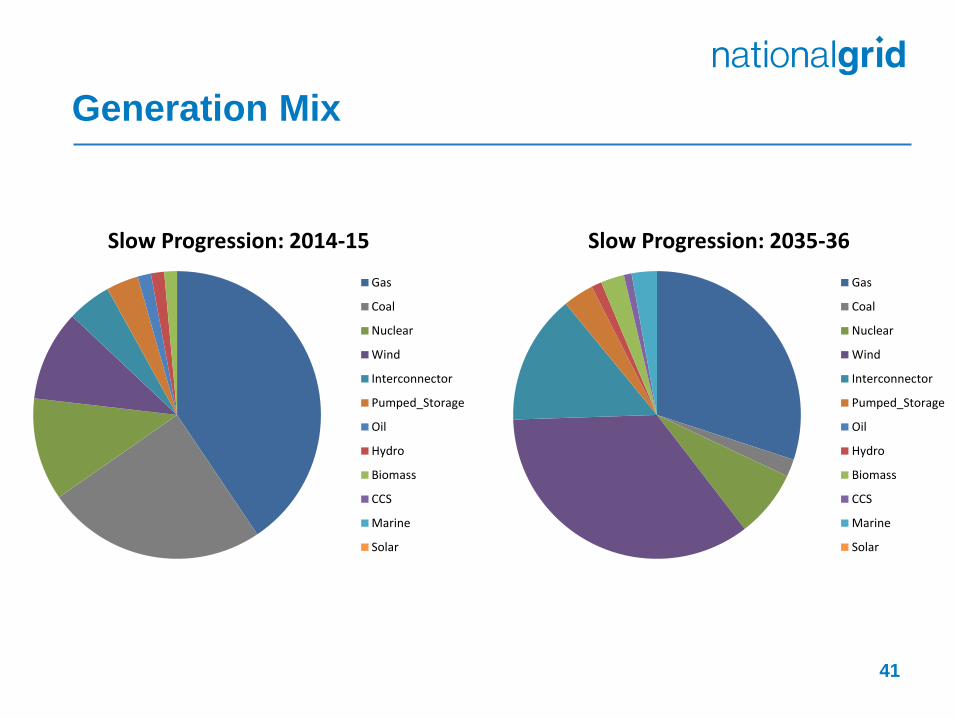
Generation Mix
41
Slow Progression: 2014-15
Gas
Coal
Nuclear
Wind
Interconnector
Pumped_Storage
Oil
Hydro
Biomass
CCS
Marine
Solar
Slow Progression: 2035-36
Gas
Coal
Nuclear
Wind
Interconnector
Pumped_Storage
Oil
Hydro
Biomass
CCS
Marine
Solar


![[RFG]] Österreichischer Gemeindebund...Schriftenreihe Rechts- und Finanzierungspraxis der Gemeinden 4 4b / 2006 [RFG]] P.b.b.Verlagspostamt 1010 Wien Erscheinungsort Wien 03Z035091M](https://img.dokumen.tips/doc/110x75/5f377efeb6d95c51ee5560ee/rfg-sterreichischer-gemeindebund-schriftenreihe-rechts-und-finanzierungspraxis.jpg)