Embed Size (px)
Citation preview

Reynolds number effect on the wake of two staggered cylindersY. Zhou,1,a� S. X. Feng,2 Md. Mahbub Alam,1 and H. L. Bai11Department of Mechanical Engineering, The Hong Kong Polytechnic University, Kowloon, Hong Kong2Department of Water Environment, Institute of Water Resources and Hydropower Research,Beijing, People’s Republic of China
�Received 20 August 2009; accepted 23 October 2009; published online 29 December 2009�
This work aims to investigate, based on the measured/reported Strouhal number �St� and the flowstructure, the Reynolds number �Re� effect on the wake of two identical cylinders with a diameterof d over P�= P /d=1.2–4.0 and �=0° –90°, where P is the center-to-center spacing between thetwo cylinders and � is the angle of incident flow with respect to the line through the two cylindercenters. The Re range examined is from 1.5�103 to 2.0�104. Two hotwires were used to measureSt simultaneously behind each of the two cylinders. The St-Re relationship is classified into fourdistinct types, i.e., types 1–4. Each is linked to distinct initial conditions, viz., interactions betweenthe four shear layers around the cylinders. Type 1 occurs at small P�, not exceeding 1.25. The twocylinders act like a single body, producing a single St across the wake throughout the range of Reexamined. On the other hand, type 2 occurs at small � ��10°�. Although single valued, the St intype 2 displays a sudden jump with increasing Re due to a switch in the shear layer, separated fromthe upstream cylinder, from overshooting to reattachment on the downstream cylinder �type 2A� orfrom reattachment to coshedding vortices �type 2B�, depending on P�. Type 3 is in the region ofintermediate P� ��1.2–1.5�–2.2� and � �10°–75°�. Two distinct St occur at low Re. The lower and thehigher ranges of St are associated with the downstream and upstream cylinders, respectively. Withincreasing Re, the higher St collapses to the lower, which is attributed to a change in the inner shearlayer, separated from the upstream cylinder, from squeezing through the gap between cylinders toreattachment on the downstream cylinder. Type 4 occurs at large P� ��1.2–2.2� and again exhibitsat low Re two St, above and below the Strouhal number St0 in the wake of an isolated cylinder, bothchanging suddenly or progressively to St0 with increasing Re, which results from a change in theinner shear layer, separated from the upstream cylinder, from reattachment on the downstreamcylinder to forming vortices between the cylinders. These types of Re-St relationships are alsoconnected to the flow structure modes reported in literature. The dependence of the St and St-Rerelationships on P� and � is provided, which may be used for the prediction of St in relatedproblems. © 2009 American Institute of Physics. �doi:10.1063/1.3275846�
I. INTRODUCTION
Multiple slender structures are widely seen in engineer-ing, e.g., chimney stacks, tube bundles in heat exchangers,chemical reaction towers, offshore structures, and skyscrap-ers in modern cities. Two fluid-dynamically interfering cyl-inders may be considered as the basic element of multiplestructures and the knowledge of this flow is insightful forunderstanding that around more structures. As such, the flowaround two cylinders has received a great deal of attention inliterature.
The flow behind two cylinders has been previously clas-sified based on P� and �, where P is the center-to-centercylinder spacing, � is the angle between the free-stream flowand the line connecting the cylinder centers, and the asteriskstands for normalization by the cylinder diameter d and/orfree-stream velocity U�. Zdravkovich1 examined the data re-ported in literature and divided the possible arrangements oftwo cylinders into four regions: �i� the proximity interferenceregion, where two cylinders are close to each other and nei-ther is submerged in the wake of the other; �ii� the wake
interference region, where the near wake of the upstreamcylinder is unaffected by the downstream one but the latter isgreatly influenced by the former; �iii� the proximity andwake interference region, where both proximity and wakeinterference are significant; �iv� no interference region,where the wake of one cylinder does not affect the other.Sumner et al.2 conducted flow visualization and particle im-age velocimetry �PIV� measurements for P�=1.0–5.0, �=0° –90°, and Re=850–1900 �Re=U�d /�, where � is thekinematic viscosity�, and divided the P�-� plane into three:�1� the single-body flow regime, P�=1.0–1.125 and �=0° –90°, where two cylinders act like an isolated body witha single vortex-shedding frequency; �2� the small incidenceangle regime, P��1.125 and �=0° –20°, where shear layerreattachment or the impingement of vortices onto the down-stream cylinder takes place; �3� the large incidence angleregime, P��1.125, �=20° –90°, where vortex pairing, split-ting, enveloping, and synchronizing occur. Gu and Sun3 mea-sured the time-averaged pressure on two cylinders �P�
=1.1–3.5 and �=0° –90°� at Re= �2.2–3.3��105, and ob-served three distinct pressure distributions: patterns IB, IIB,and IIIB on the downstream cylinder, which occurred over�=0° –9.65°, 9.7°–15°, and 16°–90°, respectively, at P�
a�Author to whom correspondence should be addressed. Electronic mail:[email protected].
PHYSICS OF FLUIDS 21, 125105 �2009�
1070-6631/2009/21�12�/125105/14/$25.00 © 2009 American Institute of Physics21, 125105-1
Downloaded 17 Mar 2011 to 158.132.161.180. Redistribution subject to AIP license or copyright; see http://pof.aip.org/about/rights_and_permissions

=0.7. The downstream cylinder was completely and partiallysubmerged in the wake of the other, respectively, in patternsIB and IIB but not in pattern IIIB.
Kiya et al.4 measured St behind two cylinders over P�
=1.0–5.5 and �=0° –180° with an increment of ��=15°�Re=1.58�104�. The isocontours of St were given and fiveregions were identified based on the measured St with refer-ence to that, St0, in an isolated cylinder wake. Their ��seems too large since the flow is highly sensitive to � and P�
for ��20° and P��2,2,3,5,6 which implies the possible lossof important details on St. In their investigation of two stag-gered cylinders at Re= �3.2–7.4��104, Sumner andRichards7 observed two distinct St values in both upstream-and downstream-cylinder-generated wakes for some P� and� ranges �e.g., P�=1, �=16° –75°�, although the flow phys-ics behind was not discussed. Alam and Sakamoto8 ascribedthis observation to the occurrence of a tristable flow state,i.e., the flow with higher and lower St in the upstream- anddownstream-cylinder-generated wakes, respectively, the flowwith the higher St in both wakes, and the flow with the lowerSt in both wakes. The two inner shear layers between thecylinders interact and lead to an intermittent lock-in of thetwo wakes, thus generating the second and the third flowstates. At x��2.5 �where x is the downstream distance fromthe mid point between the cylinders�, Hu and Zhou6,9 studiedexperimentally the flow structure and St and their down-stream evolution for P�=1.2–4.0 and �=0° –90° �Re=7.0�103�. Their increments �P� and �� were 0.5 and 10°,respectively. They observed two single-street modes, i.e., S-Iand S-II. The two rows of vortices had almost the samestrength for S-I but not for S-II. Two twin-street modes, i.e.,T-I and T-II, were also observed. The T-I mode was charac-terized by two streets of different vortex strengths and theT-II mode by two streets of almost the same vortex strength.
The above investigations have been performed at a givenRe or a very limited range of Re. On the other hand, a num-ber of previous studies, although done mostly for either thein-tandem ��=0°� or side-by-side ��=90°� arrangement, didunveil that the Re effect could not be overlooked.Igarashi10,11 examined the Re effects in the wake of two tan-dem cylinders on St and pressure fluctuations for Re= �8.7�103�– �5.2�104�, and noted that with increasing Re, thepressure fluctuation on the cylinder surfaces increased and Stdecreased greatly from Re=1�104 to 4�104. Ljungkronaand Sundén’s12 flow visualization and pressure distributionmeasurements in the wake of two tandem cylinders �P�
=1.25–4.0 and Re= �3.0�103�– �4.0�104�� indicated a de-pendence on Re of the critical P�, at which a bistable flowoccurred and the shear layers separating from the upstreamcylinder changed from reattachment upon the downstreamcylinder to the rollup, forming vortices, in the gap of thecylinders. Xu and Zhou13 studied systematically the depen-dence of St on Re as well as on P� in the wake of twotandem cylinders �P�=1–15 and Re= �8.0�102�– �4.2�104�� and found a new bistable phenomenon, at which theshear layer separated from the upstream cylinder switchedfrom rollup behind to the reattachment onto the downstreamcylinder. The occurrence of both bistable phenomena variedappreciably with Re. Kim and Durbin14 studied the wake of
two side-by-side cylinders in the so-called flopping regime�P�=1.75� and observed a variation in the base pressure andSt as Re varied from 2.0�103 to 7.0�103. They furtherfound that the nondimensional mean interval between flipsdecreased nearly exponentially with increasing Re. Xuet al.15 examined the Re effect, over Re= �1.5�102�– �1.43�104�, on the wake of two side-by-side cylinders with P�
=1.2–1.6. It was found that an increase in Re could result ina qualitative change in the flow structure; for instance, thewake might alter from a single vortex street behind the cyl-inders to two streets, one narrow and one wide.
The information available on the Re effect in the wakeof two staggered cylinders is very limited. This work aims tofill, at least partially, this gap in literature and to investigatethe effect of Re on the flow structure of two staggered cyl-inders over Re= �1.5�103�– �2.0�104� based on St, as mea-sured using two hotwires. The configurations of the cylinderscovered P�=1.2–4.0 and �=0° –90°. Experimental detailsare given in Sec. II. A validation of the present measurementis provided in Sec. III based on the data of the inline andside-by-side arrangements in literature. The dependence ofSt, flow structure, and the St-Re relationship, along with itsclassification, on P� and � is presented and discussed inSecs. IV and V. This work is concluded in Sec. VI.
II. EXPERIMENTAL DETAILS
Measurements were conducted in a low-speed, closed-circuit wind tunnel with a 2.4-m-long square test section of0.6�0.6 m2. The nonuniformity of the flow in the test sec-tion was 0.5% and the turbulent intensity was less than 0.4%for the present U� examined. U� was measured using a Pitot-static tube connected to a Furness micromanometer, with anuncertainty of less than 2.0%. More details of the tunnelwere given by Huang et al.16
Two brass cylinders of the same diameter, d=12.5 mm,were used as the test models, spanned the full width of theworking section, and mounted symmetrically with respect tothe middle plane, 0.2 m downstream of the exit plane of thecontraction section of the wind tunnel. The total geometricblockage of the two cylinders was 4.2%, less than the level�6%� that may affect the flow appreciably.17 The length-to-diameter ratio of the cylinder was 48. Figure 1�a� shows thearrangement of the cylinders and the definitions of P and �.The Cartesian coordinate system was defined such that theorigin was at the midpoint between the two cylinders, withthe x- and y-axes along the flow and the transverse direc-tions, respectively.
Two single hotwires �Pt-10% Rh� of 5 m in diameterand about 1 mm in length were placed symmetrically withrespect to the x-axis at x /d=5.0 and y /d= �0.5P� sin �+1� to measure simultaneously the streamwise velocity fluc-tuation u behind each of the two cylinders. The choice of y /densured that one hotwire was located 1.0d below the centerof the lower cylinder and the other 1.0d above that of theupper cylinder, that is, both wires were placed on the free-stream side of the cylinders. The power spectral densityfunction of the u signal measured at x /d=2.5–10.0 andy /d=−3–3 by Hu and Zhou9 could display multiple pro-
125105-2 Zhou et al. Phys. Fluids 21, 125105 �2009�
Downloaded 17 Mar 2011 to 158.132.161.180. Redistribution subject to AIP license or copyright; see http://pof.aip.org/about/rights_and_permissions

nounced peaks at x /d=2.5 because of vigorous interactionbetween the upstream- and downstream-cylinder-generatedvortices, which can be confusing in determining St. Thisconfusion is alleviated with the wires placed at x /d=5.0.Similar consideration was given in determining the trans-verse location of the wires. The hotwires were operated at anoverheating ratio of 1.8 on a constant temperature circuit.The hotwire signals were low-pass filtered �with a cutofffrequency of 1.0 kHz�, offset, amplified, and then digitizedusing a 16 channel �12 bits� A/D board at a sampling fre-quency of 2.5 kHz. The duration of each signal was 20 s. Nocalibration was performed. The power spectral density func-tion Eu of u was calculated using a fast Fourier transform,with a frequency resolution of about 0.854 Hz. The corre-sponding maximum error in the estimated St was about1.0%. The Re range investigated is �1.5�103�– �2.0�104�. The configuration of the cylinders covers �=0° –90° and P�=1.2, 1.5, 2.0, 2.5, 3.0, and 4.0 for theentire Re range. The increment �� was 10° but was reducedto 5° for Re=1.5�103, 7.0�103, and 2.0�104.
III. CONFIGURATIONS OF �=0° AND 90°: VALIDATIONOF MEASUREMENTS
The St data in the wake of two tandem cylinders havebeen well documented in literature. Similarly, there havebeen a number of previous reports on the St data for theside-by-side-arranged cylinders. Therefore, the data from the
two special configurations are used as a reference for thevalidation of the present measurement. Figure 2�a� showsreasonable agreement between the presently measured St de-pendence on P� at �=0° and that of the same Re �Re=7.0�103�, as reported by Xu and Zhou.13 The two rapid rises inSt, one from P��1.3 to 2 and the other from P��4 to 5,correspond to the occurrence of two bistable phenomena.The latter results from a transition of the shear layer, sepa-rating from the upstream cylinder, from the reattachment tothe coshedding regime.5,10,12,18 The present critical P�, be-tween 4.0 and 4.5, is slightly smaller than the measurementsof Xu and Zhou.13 The deviation is not unexpected. The oc-currence of the critical P�, usually between 3.0 and 5.0, ishighly dependent on Re, turbulence intensity, cylinder aspectratio, blockage ratio, cylinder-surface roughness, etc.13,18 Theblockage and aspect ratios are presently 2.1% and 48, respec-tively, and 2.5% and 40, respectively, in the measurements ofXu and Zhou. Furthermore, the relatively large increment,�P�=0.5, and uncertainties in determining P� and � alsocontribute to the deviation. The rapid rise in St between P�
=1.3 and 2 is ascribed to a transition from shear layer rollupbehind the downstream cylinder to reattachment on thedownstream side of the cylinder.13 The monotonic decreasein St from P�=2 to 4 results from a shift in the reattachmentposition toward the forward stagnation point.
Figure 2�b� compares the presently measured depen-dence of St on Re at P�=2.0, which is in the reattachmentregime, with the data of Xu and Zhou.13 The agreement be-tween the two measurements is, in general, quite good. Bothmeasurements display a sudden jump in St, which is againascribed to a transition from shear layer rollup behind toreattachment on the downstream side of the downstream cyl-
Hotwire probe 1
Hotwire probe 2
(b)
(a)
FIG. 1. �a� Experimental arrangement; �b� hotwire measurement grid in theP�-� plane.
0 1 2 3 4 5 6 70.00
0.05
0.10
0.15
0.20
0.25
St
P*
1000 100000.00
0.05
0.10
0.15
0.20
0.25
Re
St
(b)
(a)
FIG. 2. Comparison between the measured St and that of Xu and Zhou �Ref.13� at �=0°: �a� the dependence of St on P� �Re=7000�; �b� the dependenceof St on Re at P�=2.0. ��� Present; ��� Xu and Zhou �Ref. 13�.
125105-3 Reynolds number effect on the wake Phys. Fluids 21, 125105 �2009�
Downloaded 17 Mar 2011 to 158.132.161.180. Redistribution subject to AIP license or copyright; see http://pof.aip.org/about/rights_and_permissions

inder. The same explanation for the discrepancy in Fig. 2�a�may apply for the small departure of the present data fromthe measurements of Xu and Zhou,13 in particular, at the Rerange beyond the sudden jump.
The presently obtained St-Re relationship for the side-by-side-arranged cylinders is compared to previous measure-ments at P�=1.5, 2.0, and 3.0, which are available only for alimited number of Re. The case of P�=1.5 corresponds to theasymmetric flow regime throughout the Re range presentlyexamined. In this regime, the flow is characterized by onenarrow and one wide wake associated with a high and a lowSt �Fig. 3�a��, respectively.5,15,19,23 Two distinct values of Stare observed �Fig. 3�a��. The lower St is close to 0.1, dis-playing little variation with Re. However, the dependence ofthe higher St on Re is rather appreciable; St is close to 0.4between 1.5�103 and 5.0�103 but decreases gradually to0.33 at Re=1.2�104. With Re increasing further, St remainsalmost constant up to Re=7.4�104. At P�=2.0, two distinctSt values occur for Re�1.0�104 �Fig. 3�b�� but merge intoone, about 0.2, for higher Re, the same as St0. The followingobservations can be made. �i� As Re increases, the asymmet-
ric �flip-flopping� flow occurs at Re�1.0�104 and changesto two symmetrically or antisymmetrically arranged vortexstreets at Re=1.0�104. �ii� At Re=1.0�104, with increas-ing P�, the asymmetric flow will be altered to a symmetric orantisymmetric flow at a critical P���2.0�. �iii� This criticalP� is smaller at higher Re. At P�=3.0, a single St is detectedthroughout the ranges of Re examined �Fig. 3�c��. As Reincreases, St drops slowly up to Re=1.0�104 and remainsalmost constant for Re�1.0�104. The observation is rathersimilar to an isolated cylinder wake, where St0 decreaseswith increasing Re in the lower subcritical range �Re= �2.0�103�– �1.0�104�� and remains almost unchanged inthe higher subcritical range, i.e., Re= �1.0�104�– �2.0�105�.24,25 The agreement between present and previousdata provides a validation for the present measurement.
IV. CLASSIFICATION OF THE St-ReRELATIONSHIPS
For each measurement point in the P�-� plane �Fig.1�b��, St at each Re is determined from Eu and a St-Re cor-relation is obtained from Re=1.5�103 to 2.0�104. Aftercareful examination, these plots, altogether 70, are classifiedinto four types, i.e., types 1–4. Each type is discussed below.
A. Type 1
This type of the St-Re relationship is a near constantsingle St over the Re range examined �Fig. 4�. The corre-sponding P� is small, not exceeding 1.1–1.25, the exact valuedepending on �. As such, the two cylinders behave as asingle body, producing a single street and corresponding tothe flow structure of S-I.6 The typical Eu �Fig. 5� displaysone pronounced peak at St=0.09. If normalized on the actualor effective bluff width ��2.2d�, St would be 0.198, essen-tially the same as St0. A minor peak is discernible at St=0.19 in both spectra, probably arising from the second har-monic of 0.09.
Type 1 may have four distinct interactions of shear lay-ers around the cylinders, as schematically shown in Figs.6�a�–6�d�, based on the data in literature and our presentmeasurements. At P�=1.0, there is no flow through the gap�Fig. 6�a��, and the flow structure results essentially from therollup of the two outer shear layers, as behind an isolatedcylinder. At P��1.1–1.2 and ��20°, the gap flow pen-
0.0
0.1
0.2
0.3
0.4
St
0.0
0.1
0.2
0.3
0.4
St
1000 100000.0
0.1
0.2
0.3
0.4
St
Re
(b)
(a)
(c)
FIG. 3. Comparison between the measured St and the data available inliterature at �=90°. �a� P�=1.5; �b� 2.0; �c� 3.0. ��� Present; ��� Ref. 4;��� Ref. 14; ��� Ref. 19; ��� Ref. 20; ��� Ref. 21; �+� Ref. 22.
0.00
0.04
0.08
0.12
0.16
St
(a)
1000 10000Re
FIG. 4. The St-Re relationship of type 1, characterized by a single St. P�
=1.2 and �=90°.
125105-4 Zhou et al. Phys. Fluids 21, 125105 �2009�
Downloaded 17 Mar 2011 to 158.132.161.180. Redistribution subject to AIP license or copyright; see http://pof.aip.org/about/rights_and_permissions

etrates into the base region of the upstream cylinder �Fig.6�b�� although slowed because of the near-wall friction force,producing very small-scaled or no vortices and adding extraturbulence in the wake. This bleeding acts to prolong thevortex formation region.19,23 Nevertheless, its influence isweak and the outer shear layers largely dictate the formationof the flow structure. St changes little with increasing Re�Fig. 4� because the gap-flow-added turbulence in the wakeoverwhelms the turbulence added in the shear layers or wakedue to an increase in Re. The two flow structures in Figs.6�a� and 6�b� were reported by Sumner et al.2 At 0° ���20°, the downstream cylinder cuts in the upstream cylinderwake, and flow through the gap may be substantially weak-
ened �Fig. 6�c��. The inner shear layer separating from theupstream cylinder reattaches on the downstream cylinder andbifurcates �Fig. 6�c��. Due to a small P�, part of the bifur-cated flow may bounce back to the upstream cylinder, form-ing a separation bubble on the upstream cylinder.26 Thebubble has a great impact on the upstream cylinder lift butnot on St �Refs. 8 and 26� as the outer shear layers of the twocylinders alternately form vortices. At ��0°, the two shearlayers separating from the upstream cylinder overshoot thedownstream cylinder, generating a staggered vortex street�Fig. 6�d��.
B. Type 2
Type 2 occurs at small �, not exceeding 10°, and P�
=1.2–4.0, which corresponds approximately to the flow re-gime of S-Ib.6 Although again single valued, St displays asudden jump at Re= �6.5�103�– �1.0�104� �Fig. 7�, de-pending on P�. Based on mechanisms responsible for thejump, type 2 is further divided into subtypes 2A and 2B.Figure 8 illustrates typical Eu at Re before and after thejump. For type 2A �Fig. 8�a��, St is 0.17 at Re=4.0�103 but0.24 at Re=1.0�104, below and beyond St0, respectively.The presence of other small peaks at Re=1.0�104 may be asignature of unstable shear-layer reattachment on the down-stream side of the cylinder. For type 2B, St is 0.15 at Re=4.0�103 �Fig. 8�b�� and rises to 0.18, close to St0, at Re=1.2�104. Alam and Zhou27 observed at Re=2.72�104 twoSt behind the downstream cylinder at P�=6 and �=0° �thecoshedding flow regime�. One was identical to the frequencyof vortex shedding from the upstream cylinder, and the other,corresponding to a rather minor peak in Eu, was ascribed tovortex shedding from the downstream cylinder. They failedto detect the latter when placing the hotwire probe apprecia-bly away from the centerline, which probably explains whyone St only is observed presently �the hotwire was placed aty�=1.0�.
Type 2A occurs at 1.1� P��2.5 �Fig. 7�a��. The criticalReynolds number �Rec�, at which the jump in St occurs,decreases with increasing P�; for example, Rec is 9.5�103,8.5�103, and 6.5�103 at P�=1.2, 1.5, and 2.0, respectively.At Re�Rec, the shear layers separating from the upstreamcylinder shoot over the downstream one �Fig. 9�a�� and thetwo cylinders act like a single body, with stagnant fluid intheir gap.5,10 This explains why St is close to St0. For Re�Rec, St at a given P� drops slowly and monotonically with
0.01 0.1 110-5
10-4
10-3
10-2
10-1
100
DownstreamUpstream
Eu
St=0.09
St=0.19
f*
FIG. 5. Typical power spectral density functions for the St-Re relationshipof type 1. P�=1.2, �=90°, and Re=7.0�103. �Solid line� Downstream cyl-inder �probe 1�; �dashed line� upstream cylinder �probe 2�.
(a)
(c)
(b)
(d)
FIG. 6. Schematic of typical flow structures associated with type 1. The Reeffect on the flow structure is insignificant. Flow is left to right.
1000 100000.00
0.05
0.10
0.15
0.20
0.25
0.30
Re
St
P* = 1.2, α = 0°
P* = 1.5, α = 0°
P* = 2.0, α = 0°
1000 100000.00
0.05
0.10
0.15
0.20
0.25
0.30
St
Re
P* = 4.0, α = 0°
(b)(a)
FIG. 7. The St-Re relationship of type 2, characterized by a sudden jump inSt: �a� type 2A, where the jump is attributed to a change from the single-body-like to the reattachment regime; �b� type 2B, where the jump resultsfrom a change from the reattachment to the coshedding regime.
125105-5 Reynolds number effect on the wake Phys. Fluids 21, 125105 �2009�
Downloaded 17 Mar 2011 to 158.132.161.180. Redistribution subject to AIP license or copyright; see http://pof.aip.org/about/rights_and_permissions

increasing Re, which is attributed to a decrease in the vortexformation length. In a single cylinder wake, the formationlength reduces rapidly from 2.7d at Re=103 to 1.5d at Re=104 and remains unchanged up to 2.0�105.18 A shorterlength corresponds to a lower St and vice versa.25,28,29 Since
the formation length of type 2A retreats with increasing Re,the rollup of the overshooting shear layers �Fig. 9�a�� occursnear and eventually reattaches on the downstream cylinder�Fig. 9�b��,30 producing a jump in St at Re=Rec. Given Re�Re�Rec�, an increased P� results in a slight decrease in St.Since the downstream cylinder is completely submerged inthe recirculation region of the upstream cylinder wake, alarger P� implies a longer after-body length of the combinedbody and hence a reduced St. The St dependence on P� re-sembles that on the width-to-height ratio �an indication ofafter-body length� in a rectangular cylinder wake, where Stdiminishes gradually as the width-to-height ratio increasesup to 2.8.31–33
For Re�Rec, the shear layer reattachment results in anarrowed wake behind the downstream cylinder and hence ahigher St, which is highly dependent on the reattachmentlocation on the downstream cylinder.34 A shear layer reat-taching on the downstream side of the cylinder is led towardthe centerline �Fig. 9�b��, producing a narrowed wake andhence an increased St. Expectedly, at P�=1.2 and 1.5, reat-tachment occurs on the downstream side for Re�Rec. Onthe other hand, a shear layer reattaching on the upstream sideis diverted away from the centerline, resulting in a widerwake and a lower St. At P�=2.0, St is smaller than at P�
=1.2 and 1.5 �Fig. 7�a��, and reattachment occurs probably at��90° for Re= �6.5–8.5��103, over which St is almostconstant, and on the upstream side for Re�8.5�103 �Fig.9�c��, where St drops with increasing Re due to a shift ofreattachment further upstream.
Note that a smaller P� implies that the downstream cyl-inder, submerged in the recirculation region of the upstream-cylinder wake, may be further separated from the rollup ofthe shear layers, that is, a greater increase in Re is required toachieve adequate reduction in the formation length andhence to cause the occurrence of reattachment. This explainsthe observation that a smaller P� corresponds to a higher Rec.
Type 2B occurs at larger P�, in the range of 2.5–4 �Fig.7�b��; the values of St are between 0.14 and 0.16 for Re�Rec �=7.5�103� and 0.185 for Re�Rec. In the reattach-ment regime �Re�Rec�, the shear layers reattach on the up-stream side of the downstream cylinder, resulting in St val-ues considerably smaller than St0. It is noteworthy that St atRe�Rec �Fig. 7�b�� is almost the same as at P�=2.0 andRe=2�104 �Fig. 7�a�� perhaps because reattachment occurson the upstream side of the cylinder for both cases �Figs. 9�c�and 9�d��. The shrinking St values, although slowly, fromRe=1.5�103 to Rec, are attributed to an upstream shift ofthe reattachment position on the downstream cylinder. Themovement of the reattachment position is linked to a reduc-tion in the vortex formation length of the upstream cylinderwake in the absence of the downstream cylinder. Beyond Rec
both cylinders generate vortices. Vortex shedding from thedownstream cylinder is triggered by that from the upstreamcylinder,12,13,27,34 thus resulting in the same St behind eachcylinder, which is close to St0.
Four distinct interactions between the shear layersaround the two cylinders are possible in type 2 and maychange from one to another with increasing Re: �1� bothshear layers, separating from the upstream cylinder, over-
10-5
10-4
10-3
10-2
10-1
100
Re=4000Re=10000
Eu
St=0.17St=0.24
4.0×10³
1.0×10⁴Re
______ 4.0×10³
- - - - 1.0×10⁴
0.01 0.1 110-5
10-4
10-3
10-2
10-1
100
Eu
f *
Re=4000Re=12000
St=0.15
St=0.18
4.0×10³
1.2×10⁴
Re______ 4.0×10³
- - - - 1.2×10⁴
(b)
(a)
FIG. 8. Typical power spectral density functions, Eu, for the Re-St relation-ship of type 2. �a� Type 2A: P�=1.5 and �=0°. �b� Type 2B: P�=4.0 and�=0°. Being essentially the same from both probes, Eu, from probe 1 onlyis presented.
(a) (b)
(c)
(d) (e)
(f)
Re Low High
(h)
(g)
Type
2BTy
pe2A
FIG. 9. Schematic of typical flow structures associated with type 2. Withincreasing Re, flows in the left column change to those in the right. �a�Overshooting flow, ��b�–�d�, �f�, and �g�� shear-layer-reattachment flow, and��e� and �h�� coshedding flow. Flow is left to right.
125105-6 Zhou et al. Phys. Fluids 21, 125105 �2009�
Downloaded 17 Mar 2011 to 158.132.161.180. Redistribution subject to AIP license or copyright; see http://pof.aip.org/about/rights_and_permissions

shooting the downstream cylinder �Fig. 9�a��; �2� both reat-taching �Figs. 9�b�–9�d��; �3� one overshooting and the otherreattaching �Figs. 9�f� and 9�g��; �4� both rolling up to formstaggered vortices before reaching the downstream cylinder�Figs. 9�e� and 9�h��. Scenario �1� occurs in type 2A andsmall Re, and changes to �2� with increasing Re. Scenarios�2� and �3� occur in type 2B. At ��0°, both shear layersreattach symmetrically on the upstream side of the down-stream cylinder �scenario �2�, Fig. 9�d��. At 0° ���5°,since the downstream cylinder is placed away from the wakecenterline, only the inner shear layer reattaches on the outerside of the downstream cylinder �scenario �3�, Fig. 9�f��. At5° ���10°, reattachment occurs near or below the nominalstagnation point, with the reattached shear layer divertedalong the lower side of the downstream cylinder �Fig. 9�g��.They all change to scenario �4� with increasing Re.
C. Type 3
In the intermediate range of P� and �, i.e., P�
= �1.1–1.2�– �1.5–2.2� and �=10° –75°, the St-Re relation-ship, referred to as type 3, is characterized by two distinctvalues of St at low Re, but the higher St will suddenly col-lapse to the lower St with increasing Re �Figs. 10�a� and10�b��. The value of Rec, at which the sudden collapse oc-curs, varies from 3.5�103 to 2.0�104; a smaller � and/orsmaller P� corresponds to a smaller Rec. The lower value ofSt is insensitive to Re and occurs, depending on �, between0.1 and 0.15, considerably smaller than St0. The higher Stgrows with Re at P��1.4 �Fig. 10�a�� but remains more orless constant at P��1.4 �Fig. 10�b��. Its value exceeds 0.42,reaching 0.88 at �=30° and Re=4.0�103 �P�=1.2�, slightlymore than that �0.84� observed by Ishigai et al.35 at �=25°and P�=1.12 �Re�5.0�103�. One may suspect whethersuch a high St originates from the shear layer instability,instead of Karman vortices. The peak, corresponding to theshear layer instability, is usually broadbanded in the powerspectral density function of fluctuating velocities.13,36 How-ever, a sharp peak occurs presently at the high St �Fig. 11�a�,P�=1.2�. The typical Eu, measured in either wakes, displaystwo pronounced peaks at St=0.11 and 0.69 at Re=2.5�103 �Fig. 11�a�� and a single peak at St=0.11 at Re=1.0�104 �Fig. 11�b��, where the higher St vanishes. Two minor
peaks occur at f�=0.58 and 0.80 in Eu �Fig. 11�a�� measuredin the downstream cylinder wake, which result from the ad-dition and subtraction of St=0.11 and 0.69, respectively.Based on flow visualization at low Re �820–1900�, Sumneret al.2 observed at P�=1.5 two St, 0.52 and 0.12 for �=25° –35° and 0.48 and 0.11 for �=55° –65°, which wereconnected to a vortex-pairing-enveloping flow and a vortex-pairing-splitting-enveloping flow, respectively. The presenthigher value of St at Re=1500 is about 0.52–0.62 ��=30° –70°� and grows with increasing Re �Fig. 10�a��. It istherefore speculated that the higher value of St in Figs. 10�a�and 10�b� may be connected to the vortex-pairing-envelopingor vortex-pairing-splitting-enveloping flow.
At low Re, the shear layers on either side of the gapform two synchronized opposite-signed vortices �Figs. 12�a�and 12�c��. The two may pair during their downstream evo-lution. The upstream and downstream cylinders produce anarrow and a wide wake, respectively. The outer shear layerof the upstream cylinder forms the vortices of the same fre-quency as those in the gap.2,8 This frequency is much higherthan that of vortices shed from the outer side of the down-stream cylinder. Thus, two distinct values of St occur. Thegap vortices have a higher streamwise velocity because ofthe jet-like flow through the gap and the pairing of two op-positely signed vortices, which enhances the streamwise ve-locity significantly.37 The increased velocity may enable thepaired vortex to approach the vortex produced from the outershear layer of the upstream cylinder, producing a favorablecondition for the paired vortex to be enveloped. At small P�
1000 100000.0
0.2
0.4
0.6
0.8
1.0
Re
StP*=1.2
1000 100000.0
0.2
0.4
0.6
0.8
1.0
Re
St
P* = 1.5
P*=2.0,α =10°
(b)(a)
FIG. 10. The St-Re relationship of type 3, characterized by the occurrenceof two distinct St. �a� P�=1.2; �b� 1.5, 2.0. Present data: ��� �=30°; ���50°; ��� 70°.
10-5
10-4
10-3
10-2
10-1
100
Eu
DownstreamUpstream
St=0.11St=0.69
St=0.58
St=0.80
0.1f*
0.01 110-5
10-4
10-3
10-2
10-1
100
Eu
DownstreamUpstream
St=0.11
St=0.22
0.1f*10.01
(b)(a)
FIG. 11. Typical power spectral density functions for the St-Re relationshipof type 3. P�=1.2 and �=50°: �a� Re=2.5�103 and �b� 1.0�104.�Solid line� Downstream cylinder �probe 1�; �dashed line� upstream cylinder�probe 2�.
Low High
(a) (b)
(c) (d)
Re
FIG. 12. Schematic of typical flow structures associated with type 3. Withincreasing Re, flows in the left column changes to those in the right. �a�Vortex-pairing-enveloping flow, ��b� and �d�� shear-layer-reattachment flow,and �c� vortex-pairing-splitting-enveloping flow. Flow is left to right.
125105-7 Reynolds number effect on the wake Phys. Fluids 21, 125105 �2009�
Downloaded 17 Mar 2011 to 158.132.161.180. Redistribution subject to AIP license or copyright; see http://pof.aip.org/about/rights_and_permissions

��1.4�, the gap flow is very narrow, and the pairing vorticesare close to each other, thus completely enveloped by therelatively large vortex originating from the outer shear layerof the upstream cylinder �Fig. 12�a��. At relatively large P�,flow through the gap is enlarged laterally and the pairingvortices are increased in size, not so close to each other. As aresult, the vortex from the outer shear layer could not en-velop both but only a fraction of the pair �Fig. 12�c��. SeeRef. 2 at P�=1.5 and �=60° for examples. The flow is char-acterized by the gap vortex pairing enveloping. The flows inFigs. 12�a� and 12�c� are characterized by a narrow and awide jet-like gap flow, respectively. Accordingly, the formerhas a very high value of St �0.55–0.88� and the latter a mod-erately high value of St �0.4–0.55� �Figs. 10�a� and 10�b��.
One may wonder what happens with the flow so that thehigher value of St that occurred at low Re ��Rec� suddenlycollapses to the lower. It is well known that at a moderate P�,the downstream cylinder acts to divert the gap flow towardthe wake centerline of the upstream cylinder, resulting in thewide wake of lower St behind the downstream cylinder and anarrow wake of higher St behind the upstreamcylinder.2,4,5,20,26 For the present Re range, the boundary
layer over the upstream cylinder becomes thinner with in-creasing Re and the separation point shifts upstream towardthe forward stagnation point,25 implying an increasedseparation angle. With an adequate upstream shift at Re�Rec, the inner shear layer, separated from the upstreamcylinder, reattaches on the downstream cylinder; part of itseparates from the gap side, generating a shear-layer-reattachment flow that forms a small gap flow �Fig. 12�b��.As a result, the higher St disappears; the two outer shearlayers, separated from the two cylinders, form vortices alter-nately at the lower St.
D. Type 4
Type 4 corresponds in general to a larger value of P�
than type 3. Two distinct St values occur at low Re butchange into or approach a single and intermediate value withincreasing Re. Based on flow physics behind the change,type 4 was further divided into type 4A �Fig. 13�a��, type 4B�Figs. 13�b�–13�e��, type 4C �Fig. 13�f��, and type 4D �Fig.13�g��.
Type 4A occurs at a relatively small � ��
0.10
0.15
0.20
0.25
0.30
0.35
0.40
0.45
St
P* = 2.0(d)
1000 100000.10
0.15
0.20
0.25
0.30
0.35
0.40
0.45
Re
St
P* = 2.5(e)
1000 100000.10
0.15
0.20
0.25
0.30
0.35
0.40
0.45
Re
StP* = 4.0(g)
0.10
0.15
0.20
0.25
0.30
0.35
0.40
0.45
St
P* = 3.0(f)(b)
(c)
(d)
(e) 0.00
0.05
0.10
0.15
0.20
0.25
0.30
0.35
0.40
0.45
(f)
P* = 2.0
P* = 2.5
(g)
0.00
0.05
0.10
0.15
0.20
0.25
0.30
100001000 Re
St
St
1000 100000.10
0.15
0.20
0.25
0.30
0.35
0.40
0.45
St
Re
P*=4.0,α = 10°
P*=3.0,α = 20°
(c)(a)
FIG. 13. The St-Re relationship of type 4. �a� Type 4A: P�=3.0 ��=20°� and 4.0 ��=10°�. ��b�–�e�� Type 4B: present data: ��� �=30°; ��� 50°; ��� 70°.By Sumner et al. �2005� ��� 30°; ��� 50°; ��� 70°; �� 90°. �f� Type 4C: P�=2.0 and 2.5 ��=90°�. �g� Type 4D: P�=4.0 ��=90°�.
125105-8 Zhou et al. Phys. Fluids 21, 125105 �2009�
Downloaded 17 Mar 2011 to 158.132.161.180. Redistribution subject to AIP license or copyright; see http://pof.aip.org/about/rights_and_permissions

=10° –20° , P�=2.2–4�. At low Re, both Eu in Fig. 14�a�display two peaks, resembling qualitatively that of type 3�Fig. 11�a�� although the higher St value in type 4A is con-siderably smaller than that in type 3. When the downstreamcylinder is displaced from the centerline of the upstream cyl-inder wake, the shear layer separating from the inner side ofthe upstream cylinder runs toward and dives beneath thedownstream cylinder without reattachment �Fig. 15�a��. Theouter shear layer separated from the upstream cylinder formsvortices at the higher St, while the shear layers over thedownstream cylinder form vortices at the lower St.2,8,26 Asadvected downstream, the vortices of the higher value of Stinteract with those of the lower St, producing a single com-bined street of the lower St. Since the vortex formationlength reduces from Re=3.0�103 to 2�104, the shear layerseparated from the inner side of the upstream cylinder mayroll up to form vortices before reaching the downstream cyl-inder, producing a coshedding flow �Fig. 15�b��. As such, theupstream cylinder wake displays similarity to that behind anisolated cylinder. Meanwhile, vortex shedding from thedownstream cylinder is triggered by the vortices separatedfrom the inner side of the upstream cylinder. The changefrom the flow shown in Fig. 15�a� to the other �Fig. 15�b�� isdiscontinuous,13,26 resulting in the rather abrupt collapse ofthe two St values into about 0.19 �Fig. 14�b��.
Type 4B occurs at a larger value of � �20° ���88° , P��1.2–2.2� than type 4A. Unlike type 4A, thereis no sudden change in St with increasing Re for type 4B. AtP��2.5, the downstream cylinder pushes the gap flow to-ward the centerline of the upstream cylinder wake �Figs.15�c� and 15�e��, generating a narrow wake of higher St be-hind the upstream cylinder and a wide wake of lower Stbehind the downstream cylinder. The higher St varies littlefor Re= �1.5–3��103 but declines rather rapidly from Re=3�103 to 2�104 �Figs. 13�b�–13�e��. Meanwhile, thelower St rises, although slowly. The upstream cylinder issubjected to a uniform incident flow, but the downstreamcylinder is not. Naturally, the Re effect on the narrow wakeis significant and may behave similarly to an isolated cylin-der wake, where St is almost constant for Re= �6�102�– �3�103� but reduces considerably from Re=3�103 to 2�104.25,38–40 The St behavior is linked to the vortex forma-tion length, which is insensitive for Re= �6�102�– �3�103� but shrinks exponentially from Re=3�103 to 2�104.28,41,42 Given an exponentially reducing vortex forma-tion length associated with the upstream cylinder for Re
10-5
10-4
10-3
10-2
10-1
100E
u
DownstreamUpstream
St=0.14
St=0.25
(c)
10-5
10-4
10-3
10-2
10-1
100
Eu
DownstreamUpstream
St=0.19
(d)
0 0
(a) (b)
10-5
10-4
10-3
10-2
10-1
100
Eu
DownstreamUpstream
(e)St=0.16St=0.33
10-5
10-4
10-3
10-2
10-1
100
Eu
DownstreamUpstream
(f)
St=0.16St=0.30
(c) (d)
0.01 0.1 110-5
10-4
10-3
10-2
10-1
100
f *
Eu
DownstreamUpstream
St=0.15St=0.30
(g)
0.01 0.1 110-5
10-4
10-3
10-2
10-1
100
Eu
f *
DownstreamUpstream
(h)
St=0.20
(e) (f)
0.01 0.1 110-5
10-4
10-3
10-2
10-1
100
Eu
f *
DownstreamUpstream
(b)St=0.20
St=0.40
(g)
FIG. 14. Typical power spectral density functions for the St-Re relationshipof type 4. Type 4A �P�=3.0, �=20°�: �a� Re=7.0�103 and �b� 2.0�104.Type 4B �2.5, 50°�: �c� 4.0�103 and �d� 1.2�104. Type 4C �2.0, 90°�: �e�2.0�103 and �f� 2.0�104. Type 4D �4.0, 90°�: �g� 1.2�104�. �Solid line�Downstream cylinder �probe 1�; �dashed line� upstream cylinder �probe 2�.
(j)
(k)
Type
4D
(a) (b)
Type
4A
(g) (h)
Type
4C
(i)
Low HighRe
(d)(c)
Type
4B
(f)(e)
FIG. 15. Schematic of typical flow structures associated with type 4. Withincreasing Re, flows in the left column changes to those in the right. Type4D is insensitive of Re. �a� Induced separation flow, �b� coshedding flow, �c�vortex-pairing-splitting-enveloping flow, ��d�–�g�� no-enveloping flow, ��h�–�k�� coupled vortex-shedding flow in ��h� and �j�� antiphased and ��j� and�k�� in-phased arrangements. Flow is left to right.
125105-9 Reynolds number effect on the wake Phys. Fluids 21, 125105 �2009�
Downloaded 17 Mar 2011 to 158.132.161.180. Redistribution subject to AIP license or copyright; see http://pof.aip.org/about/rights_and_permissions

= �3.0�103�– �2�104�, the flow around the downstream cyl-inder should be less affected by the upstream cylinder andbehave more like an isolated cylinder wake. Therefore, the Stvalues associated with the downstream and upstream cylin-ders grow and decline, respectively, both approaching St0;their difference is larger at smaller P� and/or �, where theinteractions between the two wakes is more intensified. AsP� increases ��2.5�, the flow structure at low Re �Fig. 15�e��is similar to that of P��2.5 at higher Re �Fig. 15�d��, i.e.,no-enveloping flow, as corroborated by the St value, which isalmost the same at Re�2�104 �Figs. 13�b� and 13�c��, andat Re�2�103 �Figs. 13�d� and 13�e��. With increasing Re,the two streets tend to interact less intensively �Fig. 15�f��,their St values approaching St0 �Figs. 13�d� and 13�e��.
As shown in Eu �Fig. 14�, the St value measured behindthe downstream cylinder is 0.16 and that behind the up-stream cylinder is 0.33 at Re=4.0�103 �Fig. 14�c��. Due torelatively large P� and �, the downstream-cylinder-generatedwake is wide enough so that the hotwire placed in it failed tocapture the higher value of St �Fig. 14�c��. As Re increases toRe=1.2�104, the hotwire placed behind the upstream cylin-der failed to capture the lower St and the peak correspondingto the higher St in Eu is less pronounced �Fig. 14�d��, con-sistent with the occurrence of the no-enveloping flow �Figs.15�d� and 15�f��.
The data of Sumner et al.20 is inserted in Figs.13�b�–13�e� to extend the Re range examined beyond Re=2�104. The value of St at Re=2�104 is, in general, veryclose to that at Re=2.0�104 of the same P� and �, suggest-ing that the Re effect on St, although significant for Re�2.0�104, is small for Re�2.0�104. The insignificant Reeffect is connected to the fact that the vortex formationlength in an isolated cylinder wake is insensitive to Re forRe= �2.0�104�– �2.0�105�.12,28,43
Type 4C corresponds to the regions of �=88° –90° andP�=1.7–2.7, where the gap flow is biased at low Re, pro-ducing a narrow street of higher St and a wide street of lowerSt. With increasing Re, the two distinct St values approacheach other and eventually meet at St�0.2 �Fig. 13�f��, whichimplies that the gap flow is not biased any more and twoantiphased streets of the same St occur, each similar to thatbehind an isolated cylinder. It is well known that in the wakeof two side-by-side cylinders, an increase in P� at a given Remay result in such a flow structure change �e.g., Refs. 22 and44�. An increased P� means an enlarged gap and hence a gapflow of increased streamwise momentum, which is difficultto become biased. On the other hand, at a given P�, theboundary layer on the gap side of each cylinder becomesthinner considerably with increasing Re,25 again leading toan effectively enlarged gap and a gap flow of increasedstreamwise momentum. This explains why a smaller P�
needs a higher Re �e.g., 9�103 at P�=2.0 and 2.5�103 atP�=2.5, Fig. 13�f�� to change the biased flow or two distinctSt to the nonbiased flow or single St. Note that both St differlittle in their variation rate with respect to Re, owing to thefact that both cylinders are immersed in a uniform and un-disturbed approaching flow. On the other hand, for type 3,the downstream cylinder is subjected to a nonuniform and
disturbed approaching flow; therefore, the St value associ-ated with the upstream cylinder is more sensitive to Re thanthat with the downstream cylinder.
At low Re, the Eu value of type 4C �Fig. 14�e�� appearsquite similar to that of type 4B �Fig. 14�d��, exhibiting apronounced peak at St=0.15 in the narrow street but at St=0.30 in the wide street, in conformity to the qualitativelysame flow structures shown in Figs. 15�f� and 15�g�. At ahigher Re the pronounced peak in both Eu occurs at St=0.20 �Fig. 14�f��, corresponding to two coupled streets ei-ther antiphased or in-phased �Figs. 15�h� and 15�i��.
As P� increases beyond 2.7, type 4C reaches the ex-treme, that is, the two distinct St at low Re collapse to St0, atleast for the Re range presently examined. Eu displays onedominant peak �Fig. 14�g�� at St=0.20. The variation in Stexhibits the same trend as in an isolated cylinder wake,whose St reduces from Re=3�103 to 2�104.25,38–40 Theflow of type 4D consists of two coupled vortex streets, eitherin antiphase or in phase �Figs. 15�j� and 15�k��.
V. DEPENDENCE OF St, THE St-Re RELATIONSHIP,AND FLOW STRUCTURE ON P� AND �
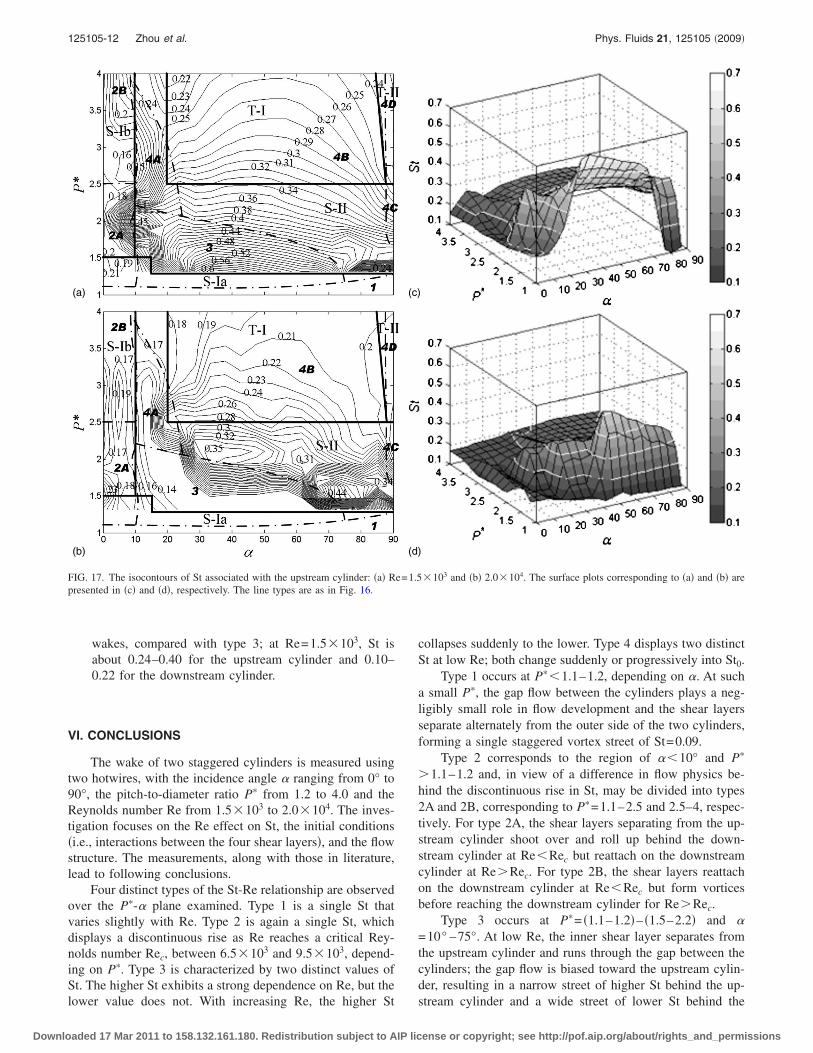
Kiya et al.4 and Hu and Zhou6 showed the isocontours ofSt in the P�-� plane at a fixed Re, which provided informa-tion on the dependence of St and the flow structure on P� and� but not on the Re effect on this dependence. Figures 16and 17 present the isocontours of St at two different Re, i.e.,1.5�103 and 2.0�104. Various types of the St-Re relation-ships are divided by dashed lines in the figures, and indi-vidual flow regimes, as classified by Hu and Zhou,6 are sepa-rated by solid lines. The surface plots corresponding to theisocontours are also presented. It should be highlighted thatthe resolution of these contours is limited by the grid size ofmeasurement points �Fig. 1�b��. A number of observationscan be made.
�1� It is evident that the two surface plots �Figs. 16�c� and16�d�� of St associated with the downstream cylinderappear quite similar; in contrast, the two �Figs. 17�c� and17�d�� associated with the upstream cylinder display aremarkable qualitative change, in particular, for the re-gions of types 3 and 4B or flow regimes S-II and T-I.6
The observation suggests that the Reynolds number hasa much more pronounced effect on the upstream-cylinder-generated wake than on the downstream-cylinder-generated wake, as noted in Sec. IV.
�2� In the P�-� plane, type 1 occurs at small P�, not exceed-ing 1.1–1.25, the exact value depending on �. On theother hand, type 2 corresponds to small �, not exceeding10°. While the former corresponds well to the single-body flow mode, i.e., S-Ia as classified by Hu andZhou,6 the latter largely exhibits characteristics similarto the wake of two tandem cylinders13 and occurs in theflow regime of S-Ib. Type 3 is located at intermediate P�
�=�1.1–1.2�– �1.5–2.2�� and � �=10° –75°� and occursmostly in the flow regime of S-II. The P� value of itsupper border with type 4 decreases from 2.2 to 1.2 as �increases from 10° to 75° because a larger � corre-sponds to a smaller P� for a given transverse width
125105-10 Zhou et al. Phys. Fluids 21, 125105 �2009�
Downloaded 17 Mar 2011 to 158.132.161.180. Redistribution subject to AIP license or copyright; see http://pof.aip.org/about/rights_and_permissions

�which is linked to the gap flow strength or interactionsbetween the shear layers� between the cylinders. Type 4occupies the region of large P� ��1.2–2.2� and corre-sponds to the flow modes of T-I, T-II, and the part of S-IIof larger P�. Type 4A takes the region of small �, i.e.,10°–20°; type 4B is in the region of larger �, i.e., 20°–88°; types 4C and 4D correspond to largest � �88°–90°�,where the former occurs at intermediate P� �1.7–2.7�and the latter at large P� ��2.7�.
�3� The highest St occurs for type 3 at Re=1.5�103 and isassociated with the upstream-cylinder-generated wake,when the downstream cylinder pushes the gap flow to-ward the upstream cylinder, generating a very narrowwake behind the upstream cylinder, with highly intensi-fied interactions among the four shear layers �Fig.12�a��. On the other hand, the smallest St falls in theregion of type 1 when the two cylinders are so close thatthey behave like a single body �Fig. 6�.
�4� The isocontours in Fig. 16 are considerably more sparelyseparated than in Fig. 17, that is, the St associated withthe upstream cylinder exhibits a stronger dependence onP� and � than that with the downstream cylinder. Fur-thermore, the contours in Fig. 17 are densely distributed
at � 20° or P� 2.0, in particular, at the higher Re,indicating the regions where St is sensitive to P� or �.On the other hand, the contours in Fig. 16 are sparselydistributed, except the region of � 12° at the higherRe, suggesting a relatively weak dependence of St, as-sociated with the downstream cylinder, on P� and �.
�5� The St range may vary rather wildly from one type ofthe St-Re relationship to another. Type 1 has a St ofabout 0.09 or 0.5 St0, which is almost independent ofRe �Fig. 4�. The St ranges of types 2A and 2B are 0.17–0.24 and 0.14–0.23, respectively; the St associated withone cylinder is virtually the same as with the other. Thedifference in St between the upstream- and downstream-cylinder-generated wakes is maximum in type 3; at Re=1.5�103, St is 0.36–0.68 for the upstream cylinderand 0.10–0.19 for the downstream cylinder. The largedifference lies in the highly intensified interactionsamong the four shear layers at relatively smaller P� andintermediate � �Figs. 12�a� and 12�c��. With a relativelylarge P�, type 4 occupies the region above type 3. Assuch, the interaction among the four shear layers is lessintensified, resulting in a reduced difference in St be-tween the downstream- and upstream-cylinder-generated
(b)
(a) (c)
(d)
FIG. 16. The isocontours of St �thin solid lines� associated with the downstream cylinder: �a� Re=1.5�103 and �b� 2.0�104. Dashed lines divide differenttypes of the St-Re relationship and thick solid lines separate flow regimes classified by Hu and Zhou �Ref. 6� at Re=7.0�103. The surface plots correspondingto �a� and �b� are presented in �c� and �d�, respectively.
125105-11 Reynolds number effect on the wake Phys. Fluids 21, 125105 �2009�
Downloaded 17 Mar 2011 to 158.132.161.180. Redistribution subject to AIP license or copyright; see http://pof.aip.org/about/rights_and_permissions
wakes, compared with type 3; at Re=1.5�103, St isabout 0.24–0.40 for the upstream cylinder and 0.10–0.22 for the downstream cylinder.
VI. CONCLUSIONS
The wake of two staggered cylinders is measured usingtwo hotwires, with the incidence angle � ranging from 0° to90°, the pitch-to-diameter ratio P� from 1.2 to 4.0 and theReynolds number Re from 1.5�103 to 2.0�104. The inves-tigation focuses on the Re effect on St, the initial conditions�i.e., interactions between the four shear layers�, and the flowstructure. The measurements, along with those in literature,lead to following conclusions.
Four distinct types of the St-Re relationship are observedover the P�-� plane examined. Type 1 is a single St thatvaries slightly with Re. Type 2 is again a single St, whichdisplays a discontinuous rise as Re reaches a critical Rey-nolds number Rec, between 6.5�103 and 9.5�103, depend-ing on P�. Type 3 is characterized by two distinct values ofSt. The higher St exhibits a strong dependence on Re, but thelower value does not. With increasing Re, the higher St
collapses suddenly to the lower. Type 4 displays two distinctSt at low Re; both change suddenly or progressively into St0.
Type 1 occurs at P��1.1–1.2, depending on �. At sucha small P�, the gap flow between the cylinders plays a neg-ligibly small role in flow development and the shear layersseparate alternately from the outer side of the two cylinders,forming a single staggered vortex street of St=0.09.
Type 2 corresponds to the region of ��10° and P�
�1.1–1.2 and, in view of a difference in flow physics be-hind the discontinuous rise in St, may be divided into types2A and 2B, corresponding to P�=1.1–2.5 and 2.5–4, respec-tively. For type 2A, the shear layers separating from the up-stream cylinder shoot over and roll up behind the down-stream cylinder at Re�Rec but reattach on the downstreamcylinder at Re�Rec. For type 2B, the shear layers reattachon the downstream cylinder at Re�Rec but form vorticesbefore reaching the downstream cylinder for Re�Rec.
Type 3 occurs at P�= �1.1–1.2�– �1.5–2.2� and �=10° –75°. At low Re, the inner shear layer separates fromthe upstream cylinder and runs through the gap between thecylinders; the gap flow is biased toward the upstream cylin-der, resulting in a narrow street of higher St behind the up-stream cylinder and a wide street of lower St behind the
(b)
(a) (c)
(d)
FIG. 17. The isocontours of St associated with the upstream cylinder: �a� Re=1.5�103 and �b� 2.0�104. The surface plots corresponding to �a� and �b� arepresented in �c� and �d�, respectively. The line types are as in Fig. 16.
125105-12 Zhou et al. Phys. Fluids 21, 125105 �2009�
Downloaded 17 Mar 2011 to 158.132.161.180. Redistribution subject to AIP license or copyright; see http://pof.aip.org/about/rights_and_permissions

downstream cylinder. As Re exceeds Rec, with increasedstreamwise momentum, the inner shear layer reattaches onthe downstream cylinder, resulting in the sudden disappear-ance of the narrow street and hence the higher St.
Type 4 occurs at larger P� than type 3 and is divided intofour subtypes. Type 4A corresponds to small � �P�
=2.2–4.0, �=10° –20°�. At low Re, the flow separatingfrom the inner side of the upstream cylinder approaches anddives beneath the downstream cylinder. While the flowthrough the gap and the outer shear layer of the downstreamcylinder form vortices at a lower St, the outer shear layerover the upstream cylinder forms vortices at a higher St. AtRe�Rec, the inner shear layer around the upstream cylinderrolls up, forming vortices between the cylinders. As such, thetwo wakes display similarity to that behind an isolated cyl-inder, with the two St collapsing rather suddenly into anintermediate value, close to St0. Type 4B corresponds to alarger � �20° ���88°�. Thus, the shear layer separatedfrom the inner side of the upstream cylinder fails to reattachon the downstream cylinder. Naturally, the lower St risesslowly; meanwhile, the higher drops progressively, both ap-proaching St0. Type 4C falls in the regions of P�=1.7–2.5and �=88° –90°. The gap flow is biased toward one cylin-der. At adequately high Re, the gap flow is less biased, gen-erating two antiphase or in-phase vortex streets. Type 4Doccurs at larger P� ��2.5� than type 4C, where the interfer-ence between the cylinders is small and the flow is charac-terized by two in-phase or antiphase vortex streets of thesame St ��St0�.
Finally, the dependence of the Re-St relationship on P�
and � is provided, as compared to the classification of theflow structure.6,9 This dependence, along with the isocon-tours and their characteristics of St in the P�-� plane given attwo representative Re, 1.5�103 and 2.0�104, may be usedfor the prediction of St in various engineering situations.
ACKNOWLEDGMENTS
Y.Z. wishes to acknowledge support given to him fromthe Research Grant Council of HKSAR through Grant No.PolyU 5334/06E and from The Hong Kong Polytechnic Uni-versity through Grant No. G-YF30.
1M. M. Zdravkovich, “The effects of interference between circular cylin-ders in cross flow,” J. Fluids Struct. 1, 239 �1987�.
2D. Sumner, S. J. Price, and M. P. Païdoussis, “Flow-pattern identificationfor two staggered circular cylinders in cross-flow,” J. Fluid Mech. 411,263 �2000�.
3Z. F. Gu and T. F. Sun, “On interference between two circular cylinders instaggered arrangement at high subcritical Reynolds numbers,” J. WindEng. Ind. Aerodyn. 80, 287 �1999�.
4M. Kiya, M. Arie, H. Tamura, and H. Mori, “Vortex shedding from twocircular cylinders in staggered arrangement,” ASME J. Fluids Eng. 102,166 �1980�.
5M. M. Zdravkovich, “Review of flow interference between two circularcylinders in various arrangements,” ASME J. Fluids Eng. 99, 618 �1977�.
6J. C. Hu and Y. Zhou, “Flow structure behind two staggered circularcylinders. Part I: downstream evolution and classification,” J. Fluid Mech.607, 51 �2008�.
7D. Sumner and M. D. Richards, “Some vortex-shedding characteristics ofthe staggered configuration of circular cylinders,” J. Fluids Struct. 17, 345�2003�.
8M. M. Alam and H. Sakamoto, “Investigation of Strouhal frequencies oftwo staggered bluff bodies and detection of multistable flow by wavelets,”J. Fluids Struct. 20, 425 �2005�.
9J. C. Hu and Y. Zhou, “Flow structure behind two staggered circularcylinders. Part II: Heat and momentum transport,” J. Fluid Mech. 607, 81�2008�.
10T. Igarashi, “Characteristics of the flow around two circular cylinders ar-ranged in tandem �1st report�,” Bull. JSME 24, 323 �1981�.
11T. Igarashi, “Characteristics of the flow around two circular cylinders ar-ranged in tandem �2nd report�,” Bull. JSME 27, 2380 �1984�.
12L. Ljungkrona and B. Sundén, “Flow visualization and surface pressuremeasurement on two tubes in an inline arrangement,” Exp. Therm. FluidSci. 6, 15 �1993�.
13G. Xu and Y. Zhou, “Strouhal numbers in the wake of two inline cylin-ders,” Exp. Fluids 37, 248 �2004�.
14H. J. Kim and P. A. Durbin, “Investigation of the flow between a pair ofcircular cylinders in the flopping regime,” J. Fluid Mech. 196, 431 �1988�.
15S. J. Xu, Y. Zhou, and R. M. C. So, “Reynolds number effects on the flowstructures behind two side-by-side cylinders,” Phys. Fluids 15, 1214�2003�.
16J. F. Huang, Y. Zhou, and T. M. Zhou, “Three-dimensional wake structuremeasurement using a modified PIV technique,” Exp. Fluids 40, 884�2006�.
17G. S. West and C. J. Apelt, “The effect of tunnel blockage and aspect ratioon mean flow past a circular cylinder with Reynolds number between 104
and 105,” J. Fluid Mech. 114, 361 �1982�.18L. Ljungkrona, C. H. Norberg, and B. Sundén, “Free-stream turbulence
and tube spacing effects on surface pressure fluctuations for two tubes inan in-line arrangement,” J. Fluids Struct. 5, 701 �1991�.
19D. Sumner, S. S. Wong, S. J. Price, and M. P. Païdoussis, “Fluid behaviorof side-by-side circular cylinders in steady cross-flow,” J. Fluids Struct.13, 309 �1999�.
20D. Sumner, M. D. Richards, and O. O. Akosile, “Two staggered circularcylinders of equal diameter in cross-flow,” J. Fluids Struct. 20, 255�2005�.
21K. Kamemoto, “Formation and interaction of two parallel vortex streets,”Bull. JSME 19, 283 �1976�.
22P. Bearman and A. J. Wadcock, “The interaction between a pair of circularcylinders normal to stream,” J. Fluid Mech. 61, 499 �1973�.
23Z. J. Wang and Y. Zhou, “Vortex interactions in a two side-by-side cylin-der near-wake,” Int. J. Heat Fluid Flow 26, 362 �2005�.
24A. Roshko, “Experiments on the flow past a circular cylinder at very highReynolds numbers,” J. Fluid Mech. 10, 345 �1961�.
25M. M. Zdravkovich, Flow Around Circular Cylinders: Fundamentals �Ox-ford Science, New York, 1997�, Vol. 1.
26M. M. Alam, H. Sakamoto, and Y. Zhou, “Determination of flow configu-rations and fluid forces acting on two staggered circular cylinders of equaldiameter in cross-flow,” J. Fluids Struct. 21, 363 �2005�.
27M. M. Alam and Y. Zhou, “Strouhal numbers, forces and flow structuresaround two tandem cylinders of different diameters,” J. Fluids Struct. 24,505 �2008�.
28S. M. Bloor, “The transition to turbulence in the wake of a circular cylin-der,” J. Fluid Mech. 19, 290 �1964�.
29O. M. Griffin, “The unsteady wake of an oscillating cylinder at low Rey-nolds number,” ASME J. Appl. Mech. 38, 523 �1971�.
30Y. Zhou and M. W. Yiu, “Flow structure, momentum and heat transport ina two-tandem-cylinder wake,” J. Fluid Mech. 548, 17 �2006�.
31A. Okajima, “Strouhal number of rectangular cylinders,” J. Fluid Mech.123, 379 �1982�.
32H. Nakaguchi, K. Hasimoto, and S. Muto, “An experimental study ofaerodynamic drag on rectangular cylinders,” J. Jpn. Soc. Aeronaut. SpaceSci. 16, 1 �1968�.
33Y. Otsuki, K. Washizu, H. Tomizawa, and A. Ohya, “A note on theaeroelastic instability of a prismatic bar with square section,” J. SoundVib. 34, 233 �1974�.
34M. M. Alam, M. Moriya, K. Takai, and H. Sakamoto, “Fluctuating fluidforces acting on two circular cylinders in a tandem arrangement at a sub-critical Reynolds number,” J. Wind Eng. Ind. Aerodyn. 91, 139 �2003�.
35S. Ishigai, E. Nishikawa, E. Nishimura, and K. Cho, “Experimental studyof structure of gas flow in tube banks axes normal to flow,” Bull. Jpn. Soc.Mech. Eng. 15, 949 �1972�.
36A. Prasad and C. H. K. Williamson, “The instability of the shear layerseparating from a bluff body,” J. Fluid Mech. 333, 375 �1997�.
125105-13 Reynolds number effect on the wake Phys. Fluids 21, 125105 �2009�
Downloaded 17 Mar 2011 to 158.132.161.180. Redistribution subject to AIP license or copyright; see http://pof.aip.org/about/rights_and_permissions

37Y. Couder and C. B. Basdevant, “Experimental and numerical study ofvortex couples in two-dimensional flows,” J. Fluid Mech. 173, 225�1986�.
38A. Roshko, “On the development of turbulent wakes from vortex streets,”NACA Report No. TN 2913, 1953 �downloaded from http://authors.library.caltech.edu/428/�.
39C. Norberg, “Flow around a circular cylinder: Aspect of fluctuating lift,” J.Fluids Struct. 15, 459 �2001�.
40C. H. K. Williamson, “Vortex dynamics in the cylinder wake,” Annu. Rev.Fluid Mech. 28, 477 �1996�.
41S. M. Bloor and J. H. Gerrard, “Measurements on turbulent vortices in acylinder wake,” Proc. R. Soc. London, Ser. A 299, 319 �1966�.
42J. H. Gerrard, “Experimental investigation of separated boundary layerundergoing transition to turbulence,” Phys. Fluids 10, S98 �1967�.
43M. F. Unal and D. R. Rockwell, “On vortex formation from a cylinder.Part 1. The initial instability,” J. Fluid Mech. 190, 491 �1988�.
44M. M. Alam, M. Moriya, and H. Sakamoto, “Aerodynamic characteristicsof two side-by-side circular cylinders and application of wavelet analysison the switching phenomenon,” J. Fluids Struct. 18, 325 �2003�.
125105-14 Zhou et al. Phys. Fluids 21, 125105 �2009�
Downloaded 17 Mar 2011 to 158.132.161.180. Redistribution subject to AIP license or copyright; see http://pof.aip.org/about/rights_and_permissions