Embed Size (px)
Citation preview

Revitalization and the Rent Gap: The Role of Tax Increment Financing
May 15, 2017
Kevin Thomson, Gail Werner-Robertson Fellow
Faculty Mentors: Dr. Michael Thomas
Whitepaper No. 17001

2
Executive Summary When a city thrives, one of the first things we look at the policy decisions made at the federal, state, and local levels. These changes do not happen in isolation. Sets of policies are necessary in describing why a city grows. In 1968, President Nixon defined his governing approach as “New Federalism,” which included reducing and reshaping federal assistance to cities by decentralizing urban policy. Cities enjoyed greater policy autonomy but became more dependent on local economic development to sustain the city’s health.
This change, along with other changes, begins the era that scholars mark as the point in time where cities shifted from “managerial” governance to “entrepreneurial” governance. An entrepreneurial city is defined broadly as a city that uses a combination of competitive growth-oriented local economic development strategies, such as, public-private partnerships, promotion of the city space, and risk sharing in development projects. Yet, to be truly entrepreneurial, local economic development policy should create value and not just redistribute wealth within the municipality.
For Omaha to be an entrepreneurial city, it needs to adopt policies that grow the local economy. One crucial factor for doing so is increasing the millennial population. The millennial generation prefers dense urban neighborhoods. Omaha uses tax increment financing or TIF to spur local economic development. TIF faces many tradeoffs in its use and is likely to be used in instances where the development would have occurred regardless of the use of TIF. TIF can potentially be an entrepreneurial policy tool in accelerating development that would not have occurred. That said, it needs stronger oversight and a tightening of standards to ensure that the revenue being diverted from city funds is not being lost needlessly.

3
Introduction
Entrepreneurial cities grow, increase their tax base, and attract young professionals. The era of the entrepreneurial city began in the 1970s when shifts in federal policy and consumer preferences, specifically a preference for the suburbs over the city, led many municipalities to become more reliant on their own economic growth. The increased emphasis on local growth in the 1970s and onward marks a change scholars identify as a shift from “managerial” governance to “entrepreneurial” governance (Harvey 1989). Now cities are active in the development of their local economies, hoping to accelerate growth rather than just to manage it.
What makes a city entrepreneurial? In today’s economy, accelerating growth requires attracting millennials. The age cohort born during the 1980s and 1990s is a key driver of growth. As of 2010, millennials were the country’s largest generation, the generation most likely to move, and primed to make major investments in local economies.
The on-the-move millennial prefers dense urban neighborhoods to other areas in a city at a rate greater than two to one (Cortright 2014). This means local politicians and urban planners seeking to attract millennials are looking to revitalize their denser, central-city neighborhoods. To do this, city leaders must enact entrepreneurial policies that accelerate local economic growth by closing rent gaps within the city. The rent gap is the difference between the current collected rent on a parcel of land and the potential rent if that land was put to a “higher and better” use (Smith 1978). However, the reduction of a rent gap is not deterministic. Urban development faces a collective action problem.
When development takes place in a city, it creates a wave of benefits for its neighbors—a positive externality. This public benefit from private action creates a collective action problem in which the private action might be too costly for a person to undertake given the limited private benefit, even if there is an
enormous public benefit. To solve the problem, multiple actors must coordinate to share costs and profit to realize the public benefit. Multiple actors, including private developers, city officials, and local stakeholders, must work together to close a rent gap.
Because of this collective action problem, city officials enact a wide range of policies to incentivize cooperation, growth, and development. In Omaha, NE, one of the most widely used tools is tax increment financing (TIF). A TIF is a city-issued loan to a developer. When the loan is issued, property taxes in the designated TIF district are frozen. The difference or increment between the frozen value and the higher appraised value is used to pay back the original loan.
Omaha is one city that has the potential for being entrepreneurial by encouraging dense, consumer-friendly urban neighborhoods in order to become congenial to growth and attractive to millennials. Downtown Omaha is experiencing a renaissance as new investment and development pours in to the area. Like many of its peer cities in the Midwest, Omaha is looking for an identity that will take it into the next generation. As Omaha continues to grow, an innovative and entrepreneurial city policy can play a large role in either accelerating this success or detracting from it.
The first section of this paper will examine the importance of millennials as drivers of local economic growth in Omaha. The next section will discuss a theoretical model of development called the rent gap. This model says that cities experience low property values even when potential rents are much higher. One of the major obstacles to reaching these higher potential rents is a collective action problem that occurs because of high coordination costs among different private owners and because of the regulations governing a city. The third section explores one of the policies thought to help solve this problem, tax increment financing (TIF). The

4
fourth section evaluates the role of TIF based on evidence.
Background: Millennials
Despite Omaha’s recent success, the City of Omaha is struggling to be entrepreneurial. According to Richard Florida, this means the ability of a city to attract the “creative class,” twenty- to thirty-year-old “creatives” that innovate and spur economic growth (Florida 1992). For a city to grow, it must induce young people, namely millennials, to put down their roots and become long-term residents. In 2010, millennials became the nation’s largest
generation and the generation most likely to be on the move.
For Omaha to be successful it must appear to be a more attractive option than similar municipalities. When compared to other cities in the Midwest—such as Des Moines, IA; Kansas City, MO; Minneapolis, MN; and Denver, CO—Omaha has key strengths. Low unemployment, affordable standards of living, and high rates of educational attainment have made Omaha very livable. Education attainment by municipality is shown in figures 1 and 2. Among the cities mentioned, Omaha ranks third, behind Minneapolis and Denver and ahead of Kansas City and Des Moines.
Figure 1: Bachelor’s degree or higher (25yo or higher)
10.00%
15.00%
20.00%
25.00%
30.00%
35.00%
40.00%
45.00%
50.00%
55.00%
20052006200720082009201020112012201320142015
Denver
Des Moines
Minneapolis
KCMO
Omaha
Figure 2: Bachelor’s degree or higher (18-25yo)
5.00%
7.00%
9.00%
11.00%
13.00%
15.00%
17.00%
19.00%
21.00%
23.00%
25.00%
Denver
Des Moines
Minneapolis
KCMO
Omaha

5
Planning in Omaha
Omaha fits this narrative. In Omaha, between 1985 and 1990, 72 percent of homes were constructed west of the highway I-680. During that same period, only 3.3 percent of new homes were built east of Forty-Second Street. As the city built westward, it also began to deconstruct the urban core. Two hundred units per year were demolished in the city’s most eastern areas, amounting to 95 percent of all housing demolition (Fahey 2008).1
After growing outward on empty land for decades, Omaha and cities across the United States must turn inward and determine how to revitalize dense urban neighborhoods and business districts with current occupiers. Cities have great potential in making dense urban areas attractive to millennials. So, they are tasked with closing the growing rent gaps in their central-city neighborhoods.
The rent gap is the difference between the current collected rent on a parcel of land and its potential rent under a “higher and better” use (Smith 1979). After initial construction, current rent usually falls following a period of disinvestment. Renewed demand by shifting demographics or revitalization of adjacent neighborhoods raises the potential rent, creating a widening rent gap. Once the gap becomes large enough, it becomes attractive for developers to invest.
Once they identify a rent gap, why don’t developers move in and close it automatically? What keeps rent gaps from being closed is a problem of incentives known as the tragedy of the commons or, in some cases, the anticommons.
Whenever someone improves their space in a city, whether it be by mowing their lawn or picking up a piece of litter, their neighbors benefit. In economics, this private action that
1 Originally compiled by Drs. Michael Thomas and
Stephen Tomoser.
benefits others indirectly is known as a positive externality.
Development in a city creates a lot of positive externalities. Transforming a vacant building into a new coffee shop or a set of apartments benefits everyone with property in the area. A tragedy of the commons occurs when the developer cannot capture, or “internalize,” a sufficient level of benefit and so the area is not redeveloped to the optimal amount. In a situation where all parties present in an area would benefit from a certain action taking place, if the private cost of undertaking that action alone is larger than the private benefit of taking that action, then those that would benefit must work together collectively to achieve the optimal outcome.
The tragedy of the anticommons occurs when there are too many actors with “veto” power to stop development. Private landowners, historical societies, city officials, and a variety Figure 4: TIF requirements of interest groups can stop redevelopment. This makes closing rent gaps difficult because redevelopment must be approved of by every party with veto power.
Closing the Rent Gap
An entrepreneurial city would find ways to contain the problems of the commons and the anticommons by shifting toward policies that incentivize business and restrict certain veto powers over development. For example, understanding that a large company moving to a city would produce lots of positive externalities, city officials often offer property-tax abatements so the business can internalize those benefits in the form of reduced costs. Figure 3 displays a sample of policies cities use to solve these collective action problems, close rent gaps, and accelerate development.

6
One policy used widely in cities in the United States and particularly in Omaha is tax increment financing (TIF). TIF is a public subsidy where the city issues a loan to a developer in a designated TIF district. Once the loan has been issued, property taxes in the designated area are frozen at their current “base” rate. The development in turn
increases the appraised value, and the difference, or “increment,” between the base value and the appraised value goes to pay back the loan. Figure 4 lists the TIF requirements described in the 2016 annual report to the legislature by the Nebraska Department of Revenue. Figure 5 lays out the TIF process described in the same report.
Figure 6 displays how TIF works by holding the base value constant while allowing the appraised value to rise. This works in harmony with the rent-gap theory. TIF allows developers to hold the current rent constant while repurposing land to a “higher and better”
Figure 4: TIF requirements • The project is not to exceed a 15-year
period.
• The project must be within the boundaries of the city.
• The taxes attributable to the excess value can only be used for the repayment of the debt related to the project.
• The city must provide written notice to both the county assessor and county treasurer to cease the division of tax when the debt on the project is paid in full.
• The project must be on real property.
Figure 5: The TIF process Phase 1—Before the Issuance of the TIF Bond
1. The city declares an area substandard, blighted, and in need of redevelopment. 2. The city holds public hearings for all registered neighborhood associations within a 1-mile radius of the area.
3. A redevelopment plan is prepared that must show, for example, the boundaries of the redevelopment project area, proposed land uses, population, land and building intensities, changes in zoning, and traffic flow.
Phase 2—The TIF Bond Is Issued, and the Tax Is Divided
4. The city files a “Notice to Divide Tax for Community Redevelopment Project” separating the base and the excess tax value.
5. A base evaluation is determined using the last certified value prior to the division-of-tax effective date.
6. While TIF is in use, the base property valuation remains assessable to all taxing entities.
7. The excess, or “incremental,” tax value, the difference between the base and the appraised tax value, is taxed at the same property tax rate as the base.
8. The excess tax collected is accounted for separately and used to pay off the debt incurred for the redevelopment project.
Phase 3—After the TIF Bond
9. After the original TIF bond is paid off or a 15-year period passes from the original TIF designation, the property’s TIF status ends.
10. The taxes are no longer divided, and the property’s fully appraised value is taxed and diverted back to the city.
Figure 6: TIF value capture illustration
Figure 3: Urban policies to close rent gaps Up-Zoning Allowing for more density in
an area
Tax Abatements Eliminating or lowering property tax
Community Development Block Grants
Federal funds given to cities for urban development
Land Bank City-owned bank that acquires and repurposes properties
Tax Increment Financing
City issued loan to a developer to offset costs

7
use to realize the potential rent. The potential rent or the fully appraised value is only taxed once the original TIF loan has been paid off or a fifteen-year period passes.
TIF in Omaha
TIF is a popular tool among developers and city officials because it allows developers to internalize some of the positive effects their development has on their neighbors. The loan issued at the start of development is in a sense the sum of positive spillovers, as measured by increased property taxes in the district, produced by the development. Figure 7 displays the rise in the use of TIF since 1999. In 1999 there were ninety-one active TIF projects. By 2015 there were 245.
One of the chief complaints against TIF is that it siphons tax money away from city funds to subsidize developers. By holding the value at which a property is taxed constant and not
taxing the higher appraised value, cities and other taxing bodies such as school districts receive a much lower amount of tax revenue. Figure 8 displays the percentage of property value that was classified as “TIF excess” in Omaha from 2010 to 2016. The percentage is calculated by taking the TIF excess property values divided by property values in the city.
Figure 9 displays the total amount, in 2016 dollars, of TIF excess property taxes collected and then given back to developers to pay off TIF loans. For example, in 2015, $36,462,384.06 of taxes collected was given back to developers to pay off TIF loans.
Types of TIF Projects
In Nebraska, TIF projects are classified as industrial, residential, or commercial. Excess taxed value—that is, the money given back to developers to pay off a loan—has been increasing for residential as a percentage while decreasing for industrial. Omaha is likely increasing its use of TIF on residential properties to create an environment preferable to millennials. Figure 10 displays this relationship.
In 2016, 67 percent of all TIF projects in Omaha were classified as commercial, 19 percent residential, and 13.5 percent industrial. Figure 11 displays this distribution.
Another way to classify TIF projects is by their value. A disproportionate amount of TIF excess value was accounted for in only a few projects. In Omaha, among all projects that issued a “notice to divide” in 2016, meaning
Figure 7: Number of TIF projects in Douglas County
0
50
100
150
200
250
300
Figure 8: Percentage TIF of total city property value
4.00%
4.20%
4.40%
4.60%
4.80%
5.00%
2010201120122013201420152016
Figure 9: Excess tax collected (2016 dollars)
$0
$10
$20
$30
$40
$50
2016
2014
2012
2010
2008
2006
2004
2002
2000
Mill
ion
s

8
they split their taxed value into base and excess, ten projects accounted for 40 percent of all TIF excess value.
Under TIF status, the higher the appraisal value, the more the project receives in TIF funding. Two projects were highlighted to answer questions pertaining to TIF and appraisal value. I hypothesize two possibilities. TIF projects may be over appraised during their TIF status and then snap back to market prices once it is lifted. It is also possible that TIF projects are correctly appraised during their TIF status and then drop below market prices once TIF expires. Both situations allow for the owner of the property to receive maximum TIF funding and then pay less than that amount once TIF is lifted.
Omaha TIF Case Studies
The two projects highlighted, Big Jim’s convenience store and the First National Tower, provide insight into how market, TIF, and county-appraised values interact.
The First National Tower received a TIF grant in 2001 with the expected payoff being in 2016. From 2001 to 2016 First National received a total of $40,221,583.47 in TIF money to pay off debt incurred through development. First National’s TIF designation ended in 2016. See appendix 1 for the TIF form showing First National’s “notice to divide,” which separated its base value from its excess value.
Appendix 2 shows the First National Tower’s appraised value as computed by the Douglas County Assessor’s office. Curiously, the appraised value for First National matches its excess TIF value. This conflicts with the TIF process laid out in the annual report to the legislature, which says the excess value is determined by subtracting the base value from the appraised value. Despite this discrepancy, First National’s 2017 value is in line with its previously appraised value.
One of the smaller TIF projects was Big Jim’s Plus gas station and convenience store located at 3024 Ames Avenue.
Big Jim’s received a TIF grant in 2001 and divided its tax until 2016. By the end of the 2016 fiscal year, Big Jim’s received $134,037.20 toward paying off debt incurred through improvements made. Big Jim’s reportedly opened around 2002. Its excess value jumped from 2001 to 2002, likely by completing its development. Appendix 3 and Appendix 4 show the divided tax value and Douglas County Assessor’s appraisal of Big Jim’s.
Big Jim’s has the same discrepancy as First National—namely, its excess value is also its assessed value, which conflicts with the guidelines described in the TIF annual report to the legislature.
Figure 10: Percentage of excess taxes collected by use
0102030405060708090
2016
2014
2012
2010
2008
2006
2004
2002
2000
% Excess Tax Industrial
% Excess Tax Commercial
% Excess Tax Residential
Figure 11: Percentage of TIFs by use in 2016
0.00%
20.00%
40.00%
60.00%
80.00%
Commerical Residential Industrial
9
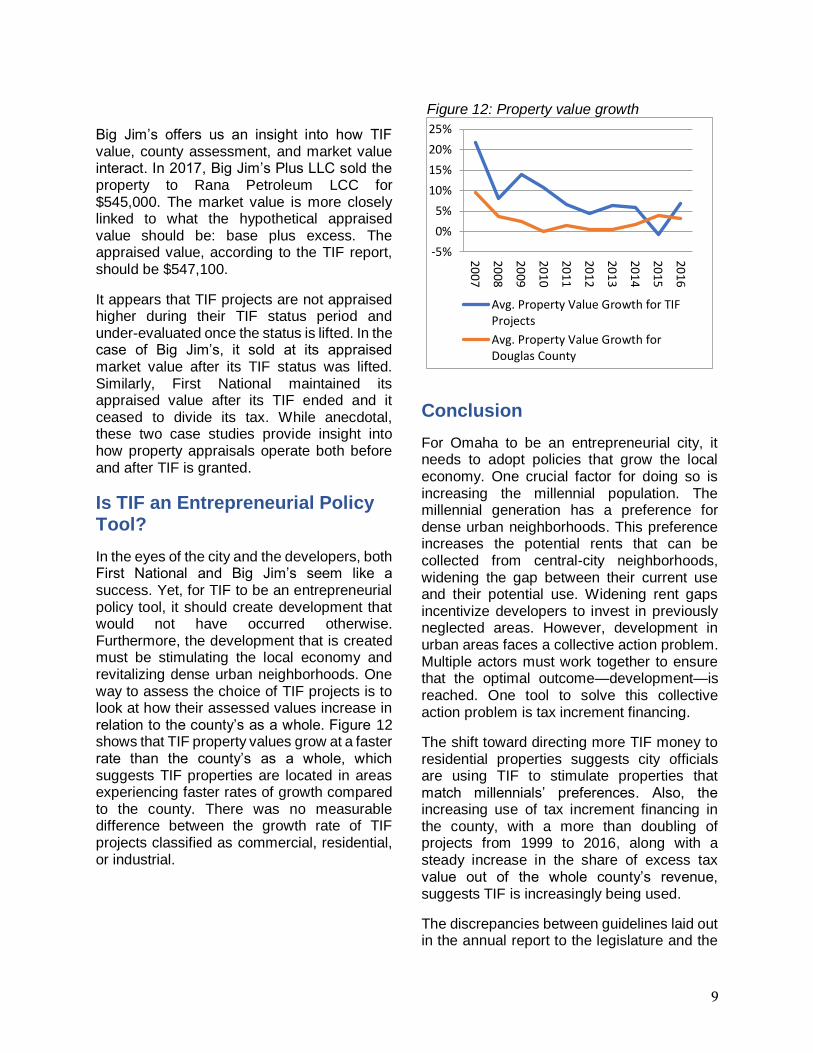
Big Jim’s offers us an insight into how TIF value, county assessment, and market value interact. In 2017, Big Jim’s Plus LLC sold the property to Rana Petroleum LCC for $545,000. The market value is more closely linked to what the hypothetical appraised value should be: base plus excess. The appraised value, according to the TIF report, should be $547,100.
It appears that TIF projects are not appraised higher during their TIF status period and under-evaluated once the status is lifted. In the case of Big Jim’s, it sold at its appraised market value after its TIF status was lifted. Similarly, First National maintained its appraised value after its TIF ended and it ceased to divide its tax. While anecdotal, these two case studies provide insight into how property appraisals operate both before and after TIF is granted.
Is TIF an Entrepreneurial Policy Tool?
In the eyes of the city and the developers, both First National and Big Jim’s seem like a success. Yet, for TIF to be an entrepreneurial policy tool, it should create development that would not have occurred otherwise. Furthermore, the development that is created must be stimulating the local economy and revitalizing dense urban neighborhoods. One way to assess the choice of TIF projects is to look at how their assessed values increase in relation to the county’s as a whole. Figure 12 shows that TIF property values grow at a faster rate than the county’s as a whole, which suggests TIF properties are located in areas experiencing faster rates of growth compared to the county. There was no measurable difference between the growth rate of TIF projects classified as commercial, residential, or industrial.
Conclusion
For Omaha to be an entrepreneurial city, it needs to adopt policies that grow the local economy. One crucial factor for doing so is increasing the millennial population. The millennial generation has a preference for dense urban neighborhoods. This preference increases the potential rents that can be collected from central-city neighborhoods, widening the gap between their current use and their potential use. Widening rent gaps incentivize developers to invest in previously neglected areas. However, development in urban areas faces a collective action problem. Multiple actors must work together to ensure that the optimal outcome—development—is reached. One tool to solve this collective action problem is tax increment financing.
The shift toward directing more TIF money to residential properties suggests city officials are using TIF to stimulate properties that match millennials’ preferences. Also, the increasing use of tax increment financing in the county, with a more than doubling of projects from 1999 to 2016, along with a steady increase in the share of excess tax value out of the whole county’s revenue, suggests TIF is increasingly being used.
The discrepancies between guidelines laid out in the annual report to the legislature and the
Figure 12: Property value growth
-5%
0%
5%
10%
15%
20%
25%
2007
2008
2009
2010
2011
2012
2013
2014
2015
2016
Avg. Property Value Growth for TIFProjects
Avg. Property Value Growth forDouglas County

10
appraised value by the county, as described in the two case studies, suggests that more oversight and attention to detail is needed for cities using tax increment financing. In the future, policy makers should ensure that TIF projects would truly not occur but for TIF’s use. The increasing amount of excess taxes going back to developers, around $38 million in 2016, is too much potential revenue to be carelessly diverted to projects that would have occurred regardless. While the projects in the two case studies in this report repaid, and
maintained their appraised value, it is important to assess whether this growth could have occurred without the use of TIF. All in all, TIF can potentially be an entrepreneurial policy tool in accelerating development that would not have occurred. That said, it needs stronger oversight and a tightening of standards to ensure that the revenue being diverted from city funds is not being lost needlessly.

11
Appendix 1: First National Tower Divided Tax Value

12
Appendix 2: First National Tower Douglas County Assessor Appraisal

13
Appendix 3: Big Jim’s Divided Tax Value

14
Appendix 4: Big Jim’s Douglas County Assessor Appraisal

15
References Beldon Russonello Strategists. 2011. “The 2011 Community Preference Survey: What Americans Are Looking for When Deciding Where to Live.” Washington, DC: National Association of Realtors. Cortright, Joe. 2014. “Young and Restless.” CityObservatory.com. October 19. Accessed March 20, 2017. http://cityobservatory.org/ynr. Florida, Richard L. 2002. The Rise of the Creative Class: And How It’s Transforming Work, Leisure, Community and Everyday Life. New York: Basic Books. Gonzalez , Cindy. 2015. “5 Years Later, What Midtown Crossing Has Meant for Area Development.” Omaha.com. June 22. Accessed March 12, 2017. http://www.omaha.com/money/years-later-what-midtown-crossing-has-meant-for-area-development/article_1853ef88-616e-5610-90c6-93863f1c73a0.html. Jessop, Bob, and Ngai-Ling Sum. 2000. “An Entrepreneurial City in Action: Hong Kong’s Emerging Strategies in and for (Inter)Urban Competition.” Urban Studies 37(12): 2287–313. Accessed October 30, 2016. http://usj.sagepub.com/content/37/12/2287.abstract. Kloke, Aaron. 2014. “Exploring the Neighborhood Preferences of a Segment of Millennials in Omaha, Nebraska.” Professional Projects, Community and Regional Planning Program, University of Nebraska–Lincoln. http://digitalcommons.unl.edu. Smith, Neil. 1979. “Toward a Theory of Gentrification a Back to the City Movement by Capital, not People.” Journal of the American Planning Association 45(4): 538–48. US Census Bureau. American FactFinder. FactFinder.census.gov. Accessed March 13, 2017.