Embed Size (px)
Citation preview
Revision of EU European Ecolabel and Development of EU Green Public Procurement Criteria for Indoor and Outdoor Paints and Varnishes
Green Public Procurement Background Report
June 2012
Jiannis S. Kougoulis, Renata Kaps, Oliver Wolf
Ben Walsh, Katherine Bojczuk, Philip Derbyshire, Trevor Crichton

Revision of EU European Ecolabel and Development of EU Green Public Procurement Criteria for Indoor and Outdoor Paints and Varnishes
Green Public Procurement Background Report
June 2012
Jiannis S. Kougoulis, Renata Kaps, Oliver Wolf
Ben Walsh, Katherine Bojczuk, Philip Derbyshire, Trevor Crichton
Contents
Contents 3
1 Introduction 1 1.1 Background 1 1.2 Purpose of this document 1 1.3 Legislative context 2 1.4 Investigation overview 4
2 Scope 5 2.1 Paint: definition 5 2.2 Classification of road markings 5 2.3 Classification of painting services 6
3 Economic and market analysis 7 3.1 Market overview 7 3.2 Market structure 9 3.3 Production 11 3.4 Public procurement 13
4 Technical analysis 16 4.1 Review of life cycle assessments 16 4.2 Major life cycle consideration of paint 20 4.3 Life cycle assessment of paint 21 4.4 Assessment of the impact of paint in use 27 4.5 Assessment of the impact of paint at end of life 32 4.6 Nanomaterials 34 4.7 Greenhouse gas emissions and water use 37 4.8 Indoor air quality 38 4.9 Specific topics for road markings 40 4.10 Summary of the key environmental considerations of paint 42
5 Life cycle costs 43 5.1 Introduction to life cycle costs 43 5.2 Functional unit 43 5.3 Reference flow of a baseline scenario 44 5.4 Life cycle costs of a baseline scenario 45 5.5 Sensitivity analysis of life cycle cost to performance and cost criteria 46 5.6 Conclusion 49
6 Appendix 1: Additional production and trade data 50
7 Appendix 2: Unit flow processes for LCA 54 Alkyd emulsion paint 54 Vinyl emulsion wall paint (TiO2 as filler and talc) (5% cut‐off) 59

8 Appendix 3: A comparison of Ecolabels 64

Glossary
ADEME Agence de l'Environnement et de la Maîtrise de l'Energie (French Environment and Energy Management Agency)
AHWG Ad Hoc Working Group APEO alkylphenolethoxylates BRIC Brazil, Russia,India and China CAGR compound annual growth rate CE labelling system of the CEN CEN European Committee for Standardisation CLP Classification, Labelling and Packaging of Substances and Mixtures CN Combined Nomenclature (code)
COMEXT Eurostat reference database for external trade CPD European Construction Products Directive DIY do it yourself ECHA European Chemicals Agency GDP gross domestic product GHG greenhouse gas GHS UN Globally Harmonised System GPP Green Public Procurement IAQ indoor air quality JRC:IHCP Joint Research Centre: Institute for Health and Consumer Protection LCA life cycle assessment LCC life cycle cost LCI lowest concentration of interest PFAS perfluorinated alkyl sulfonates PFOS perfluorooctane sulfonate PRODCOM PRODuction COMmunautaire (statistics on the production of manufactured goods) PVC polyvinyl chloride REACH Registration, Evaluation, Authorisation and restriction of CHemicals SVHC substances of very high concern SVOC semi‐volatile organic chemicals (compounds) UV ultra‐violet VHA volatile aromatic hydrocarbons VOC volatile organic chemicals (compounds) Units Conventional SI units and prefixes used throughout: {k, kilo, 1000} {M, mega, 1,000,000} {G, giga, 109} {kg, kilogramme, unit mass} {t, metric tonne, 1,000 kg}
Acknowledgements
The authors would like to thank all the stakeholders who contributed to drafting this document.

‐ 1 ‐
1 Introduction
1.1 Background
The EU Ecolabel and Green Public Procurement (GPP) initiatives are policy instruments designed to encourage the production and use of more environmentally friendly products and services through the certification and specification of products or services which have a reduced environmental footprint. They form part of the European Commission’s action plan on Sustainable Consumption and Production and Sustainable Industrial Policy adopted on 16th July 2008. The EU Ecolabel is a voluntary scheme regulated by the European Commission1 which is used to distinguish environmentally beneficial products and services. The EU Ecolabel is awarded through an application process which demonstrates that the specified Ecolabel criteria for a particular product group are met. Successful applicants are then allowed to use the EU Ecolabel logo and advertise their product as having been awarded the EU Ecolabel. GPP is a voluntary instrument which European public authorities can utilise in the procurement of goods, services and works: "…a process whereby public authorities seek to procure goods, services and works with a reduced environmental impact throughout their life cycle when compared to goods, services and works with the same primary function that would otherwise be procured”.2 By using the extensive purchasing power of public authorities, GPP can make important contributions to sustainable consumption and production by motivating manufacturers to adopt more sustainable environmentally friendly practices. The approach under GPP is to propose three types of criteria for each sector covered:
The core criteria, which are those suitable for use by any contracting authority across the Member States and which address the key environmental impacts. They are designed to be used with minimum additional verification effort or cost increases.
The comprehensive criteria, which are for those who wish to purchase the best environmental products available on the market. These may require additional verification effort or a slight increase in cost compared to other products with the same functionality.
The award criteria, based on which procurers can award additional points to products of high environmental performance.
1.2 Purpose of this document
The development of the GPP criteria parallels that of the development of the EU Ecolabel. Moreover, the evidence base and rationale of development of the EU Ecolabel criteria and the criteria themselves are used as the starting point for the development of the GPP criteria. This document sets out the relevant evidence from the development of the EU Ecolabel along with additional data specific for GPP. The aim of this document is to provide an overview of the most significant environmental impacts of paints and varnishes over their life cycle and to discuss and propose appropriate criteria as the basis for the award of the EU Ecolabel or a GPP public specification in line with Ecolabel Regulation 66/2010 and Communication COM (2008) 400 “Public Procurement for a Better Environment” respectively.
1 Regulation (EC) No 66/2010 2 COM (2008) 400

‐ 2 ‐
The communication “Public procurement for a better environment”, sets out the development of GPP criteria: 1. GPP criteria shall use a life‐cycle approach and other Europe‐wide schemes where possible (Energy
Star, Ecodesign implementing measures, Ecolabel etc), and national schemes where these are not possible.
2. The distinction between GPP "core" and "comprehensive" criteria will reflect differences in terms of ambition and availability of green products whilst at the same time pushing markets to evolve in the same direction.
3. GPP criteria shall be formulated in a way so as to facilitate their understanding by (public) purchasers and bidders and to ease their inclusion in public tender documents.
The product group of paints and varnishes is a new product group for the GPP scheme.
1.3 Legislative context
1.3.1 EU Ecolabel Regulation 66/2010
The Regulation EC 1980/2000 concerning the Community Ecolabel award scheme was replaced by the Regulation EC 66/2010 to increase its effectiveness and streamline its operation. This revised EU “Ecolabel Regulation” was adopted on 25th November2009 and entered into force on 19th February 2010.
1.3.2 Paints Directive 2004/42/EC
Directive 2004/42/EC3,4 (known as the "Paints Directive") describes the limitation of emissions of volatile organic compounds due to the use of organic solvents in decorative paints and varnishes and vehicle refinishing products and amends Directive 1999/13/EC. The Paints Directive aims to prevent the negative environmental effects of emissions of volatile organic compounds (VOCs) from decorative paints and vehicle refinishing products and has amended the VOC Solvent Emissions Directive through its Article 13. The product scope covered by the Paints Directive is broader than the scope of the current EU Ecolabel, as it includes paints for use on buildings, their trims and fittings and structures associated to buildings and products for vehicle refinishing. The specific sub‐categories of products covered are listed in Annex I of the Paints Directive.3 For the decorative paints and varnishes, Annex II A to the Directive sets out two sets of limit values for the maximum contents of VOCs (in grams per litre of the product ready for use). The first set of limit values applied from 1st January 2007 onwards. The second, and stricter, set of limit values apply since 1st January 2010. According to Article 4 of the Directive, the products shall carry a special label when placed on the market. The label shall indicate (a) the subcategory of the product, as defined in Annex I, and the legal limit value for VOC contents as indicated in Annex II, and (b) the maximum content of VOC of the product in its ready to use condition. Further, Member States shall set up a monitoring programme for the purpose of verifying compliance with the Directive, Article 6. A review of the Directive has been undertaken in the course of 2008/09. Conclusions of this review highlighted that, on the basis of the preliminary information from Member States on the implementation of the Directive in the first years following its transposition, it can be seen that monitoring systems to ensure compliance were established. However, several Member States have had difficulties setting up their systems in time and therefore improvements to the current monitoring programmes and practices are required before firm conclusions on detailed impacts on VOC emissions can be drawn. Therefore, amending the scope or limit values of the Paints Directive has not been undertaken in the review process.
3 http://eur‐lex.europa.eu/LexUriServ/LexUriServ.do?uri=OJ:L:2004:143:0087:0096:EN:PDF 4 http://ec.europa.eu/environment/air/pollutants/stationary/paints/paints_legis.htm

‐ 3 ‐
1.3.3 Biocides
The Biocidal Products Directive (98/8/EC) regulates the placing of biocidal products on the market. The Directive applies only to products which have active agents that impart biocidal properties to the product into which they are incorporated. According to the Directive, active substances have to be assessed at the Community level. Once an active substance has been assessed, it can be included in Annex I. Each Member State must then authorise products containing the biocide before they can be placed on the market in that individual Member State. Once authorised by a Member State, the product can be placed on the market in any other Member State. The Commission is proposing some modifications to this Directive so that, although most biocidal products will continue to be authorised by Member States, the rules on the mutual recognition of existing authorisations will be simplified to speed up decision‐making, to facilitate access to the market of other Member States, and to avoid duplicating work. The proposal will be the basis for the upcoming for 2013 Biocides Regulation. The new Regulation will repeal and replace the current Directive on biocides. From 2013, the mandate for the regulation of biocidal products will be transferred to the European Chemicals Agency (ECHA), which should result in convergence with the requirements for the Registration, Evaluation, Authorisation & restriction of CHemicals (REACH) and removal of the distinctions. A standardised text is now included in all proposed EU Ecolabel criteria to ensure that only authorised and assessed biocidal substances are used.
1.3.4 Classification, Labelling and Packaging of Chemical Substances and Mixtures
The use of many (often incompatible) national systems for providing information on hazardous properties and control measures of chemicals requires multiple labels and Safety Data Sheets for the same product. This causes confusion for consumers of these chemicals and increases the burden on companies complying with many different regulations. To address this, the EU Regulation on the Classification, Labelling and Packaging of Substances and Mixtures (CLP) was developed to harmonise the process, requiring only one set of labels for all products sold throughout the EU. The Regulation entered into force on 20th January 2009 and implemented the UN Globally Harmonised System (GHS) at EU level. The new system of classification, labelling and packaging had to be implemented by 1st December 2010 for substances, and by 1st January 2015 for mixtures. However, substances and mixtures will still have to be classified and labelled according to the predecessor Dangerous Substances Directive (Directive 67/548/EEC), and Directive 1999/45/EC for preparations, until 1st June 2015.
1.3.5 Indoor air quality
Studies in the 1980s in the USA5 showed that the contamination of indoor air by 12 of the most commonly encountered organic pollutants (VOCs) was between two and five times that found in outside air, irrespective of whether it was in a rural or industrial environment. New legislation, in particular regulations in France and Germany and the soon to be introduced regulations for CE labelling based on the Construction Product (Regulation (EU) No 305/2011), is pushing paint companies to provide indoor air quality (IAQ) testing.
5 EPA's Office of Research and Development's "Total Exposure Assessment Methodology (TEAM) Study" (Volumes I through IV, completed in 1985

‐ 4 ‐
The French regulations require mandatory testing and labelling of paints for IAQ.6 The scheme, called Anses7, requires testing to measure the emissions of paint in a sealed room 28 days after application. The resultant classification system is similar to that implemented for energy efficiency of white goods (C to A+). The German AgBB8 system, Health‐related Evaluation of Emissions of Volatile Organic Compounds (VOC and SVOC) from Building Products, sets out restrictions on the level of emissions allowed for construction products (in particular flooring but can be applied to paints). An extensive list of chemicals are regulated, with limits described as “Lowest Concentrations of Interest” (LCI). Development and implementation of a similar criterion within the EU Ecolabel would probably replace the current criteria 3 (VOC content), 4 (VHA content), 6g (Formaldehyde) and 6h (halogenated organic solvents).
1.3.6 End of life of paint
Within the EU, solvent‐containing wastes associated with the manufacture, formulation, supply and use of coatings (paints, varnishes and vitreous enamels), adhesives, sealants and printing inks are considered hazardous wastes and have associated hazardous waste classifications. These wastes must be appropriately disposed of under hazardous waste regulations.9 The French industry label “RETOUR” is run by the French Environment Agency, ADÈME, to fulfil the requirements of their environmental code L541‐10‐4 which states that dangerous waste must be safely disposed of. The label is awarded to any suppliers of hazardous/industrial waste (including paint suppliers) who operate well‐operated and environmentally acceptable take‐back schemes for clients. The label guarantees a quality take‐back service, and obliges the supplier to offer to take back any unused product when the client purchases new items. The unused paint is then safely disposed of within the existing EU Regulations.
1.4 Investigation overview
In order to develop GPP criteria, the following aspects have been investigated: 1. Scope. 2. Economic and market analysis. 3. Technical analysis including environmental performance investigation of this product group. 4. The life cycle costings of paints and varnishes.
6 http://www.eco‐institut.de/fileadmin/contents/International_Labelling/VOC/Arrete_etiquetage_2011.pdf 7 Agence nationale de sécurité sanitaire de l'alimentation, de l'environnement et du travail 8 Committee for Health‐related Evaluation of Building Products (Ausschuss zur gesundheitlichen Bewertung von Bauprodukten
9 Commission decision 2000/532/EC

‐ 5 ‐
2 Scope
2.1 Paint: definition
Before discussing in detail the classification of paints and varnishes, it is important that certain key concepts are described on the composition of paint. Within the context of this report, the definition used is taken from Directive 2004/42/CE (limiting VOC in paint):
[a paint] provide[s] a film with decorative, protective or other functional effect on a surface; ... ‘Film' means a continuous layer resulting from the application of one or more coats to a substrate;
The current EU Ecolabel encompasses a range of paints that are based on both oil and water‐based systems which both have a wide variety of end uses. As a result the overall composition of the paints will vary significantly and will affect the impact of the paint on the environment and human health. It is proposed to use the scope defined within the EU Ecolabel as a basis for GPP and add or remove additional areas as mandated by the need of GPP. The criteria will focus on paints for buildings including floor, wall, ceiling, trim, wood and metal paints for both indoor and outdoor use. Specialist paints, for example furniture‐, UV curable‐ and powder‐paints are excluded from scope. The EU Ecolabel focuses on the amateur (DIY) and trade sectors. With GPP’s focus on public sector, the criteria must include criteria to address the additional areas of:
roadside markings
painting services.
2.2 Classification of road markings
Road markings are any kind of device or material that is used on a road surface in order to convey official information. They can also be applied in other facilities used by vehicles to mark parking spaces or designate areas for other uses. Within this study, road markings will not include mechanical markings such as “cats‐eyes”. There are four systems used for permanent road markings:
solvent‐based paints
water‐based paints
thermoplastics
cold plastics. Solvent‐based paints and thermoplastics are the most commonly used road marking systems. Thermoplastics are favoured by Northern European countries, while the use of solvent‐based systems predominates in Southern Europe (Table 1).
‐ 6 ‐
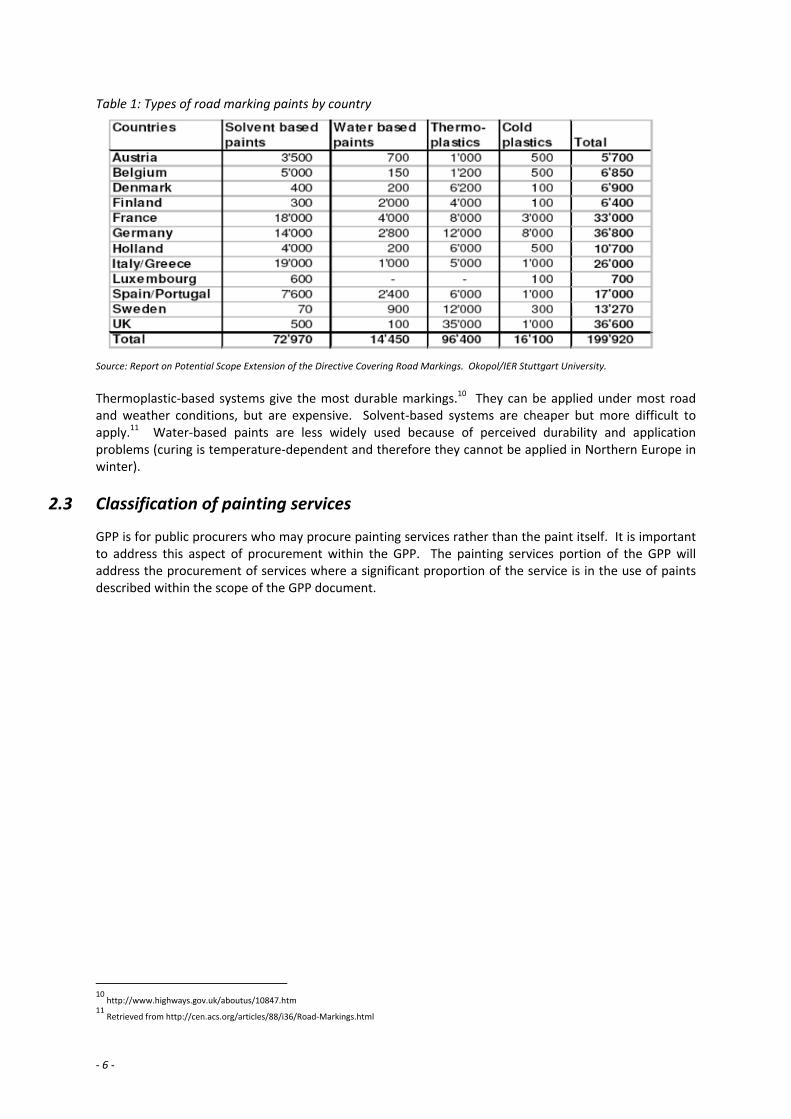
Table 1: Types of road marking paints by country
Source: Report on Potential Scope Extension of the Directive Covering Road Markings. Okopol/IER Stuttgart University.
Thermoplastic‐based systems give the most durable markings.10 They can be applied under most road and weather conditions, but are expensive. Solvent‐based systems are cheaper but more difficult to apply.11 Water‐based paints are less widely used because of perceived durability and application problems (curing is temperature‐dependent and therefore they cannot be applied in Northern Europe in winter).
2.3 Classification of painting services
GPP is for public procurers who may procure painting services rather than the paint itself. It is important to address this aspect of procurement within the GPP. The painting services portion of the GPP will address the procurement of services where a significant proportion of the service is in the use of paints described within the scope of the GPP document.
10 http://www.highways.gov.uk/aboutus/10847.htm
11 Retrieved from http://cen.acs.org/articles/88/i36/Road‐Markings.html

‐ 7 ‐
3 Economic and market analysis
3.1 Market overview
For this market analysis seven separate PRODCOM data categories are available for paints and varnishes and included within the scope of this study. Table 2 Table 2lists these relevant data categories and provides a summary description for each. Each of the PRODCOM categories corresponds to one Combined Nomenclature (CN) code, which allows for further analysis of trade data within these paint and varnish categories. However it should be realised that the PRODCOM and corresponding COMEXT categorisations of paints and varnishes are based on paint composition, whereas the EU Ecolabel criteria define products based on their application. Table 3 highlights the differences between the PRODCOM data and that presented within the Ecolabel paints and varnishes. Table 2: PRODCOM paints and varnishes categories, code and description Database Code(s) Description
PRODCOM 20301150 Paints and varnishes, based on acrylic or vinyl polymers dispersed or dissolved in an aqueous medium (including enamels and lacquers)
CN 32091000 Paints and varnishes, incl. enamels and lacquers, based on acrylic or vinyl polymers, dispersed or dissolved in an aqueous medium
PRODCOM 20301170 Other paints, varnishes dispersed or dissolved in an aqueous medium
CN 32099000 Paints and varnishes, incl. enamels and lacquers, based on synthetic or chemically modified natural polymers, dispersed or dissolved in an aqueous medium (excl. those based on acrylic or vinyl polymers)
PRODCOM 20301225/ 20301229
Paints and varnishes, based on polyesters dispersed/dissolved in a non‐aqueous medium, weight of the solvent >50% of the weight of the solution including enamels and lacquers/ Paints and varnishes, based on polyesters dispersed/dissolved in a non‐aqueous medium including enamels and lacquers excluding weight of the solvent >50% of the weight of the solution
CN 32081090 Paints and varnishes, incl. enamels and lacquers, based on polyesters, dispersed or dissolved in a non‐aqueous medium
PRODCOM 20301230 Paints and varnishes, based on acrylic or vinyl polymers dispersed/dissolved in non‐aqueous medium, weight of the solvent >50% of the solution weight including enamels and lacquers
CN 32082090 Paints and varnishes, incl. enamels and lacquers, based on acrylic or vinyl polymers, dispersed or dissolved in a non‐aqueous medium
PRODCOM 20301250 Other paints and varnishes based on acrylic or vinyl polymers
CN 32100010 Oil paints and varnishes, incl. enamels and lacquers
PRODCOM 20301270 Paints and varnishes: solutions n.e.c.
CN 32089099 Paints and varnishes, incl. enamels and lacquers, based on chemically modified natural polymers, dispersed or dissolved in a non‐aqueous medium
PRODCOM 20301290 Other paints and varnishes based on synthetic polymers n.e.c.
CN 32089091 Paints and varnishes, incl. enamels and lacquers, based on synthetic polymers, dispersed or dissolved in a non‐aqueous medium (excl. those based on polyesters and acrylic or vinyl polymers)
Source: Eurostat, PRODCOM/COMEXT
‐ 8 ‐
Table 3: A comparison of the categorisation criteria for PRODCOM and Ecolabel paints and varnishes PRODCOM categories (paint type) Ecolabel product classification (application)
Emulsion paints
Other paints and varnishes (synthetic polymers)
Gloss paints and high performance paints
Non‐vinyl emulsion paints
Other paints and varnishes (acrylic / vinyl polymers)
Paints and varnishes: solutions n.e.c.
Gloss wood paints
Coatings for exterior walls of mineral substance
Exterior trim and cladding paints for wood and metal including undercoats
Exterior trim varnishes and wood‐stains, including opaque woodstains
Exterior minimum build woodstains
Primers
Binding primers
One‐pack performance coatings
Two‐pack reactive performance coatings for specific end use such as floors
Decorative effect coatings
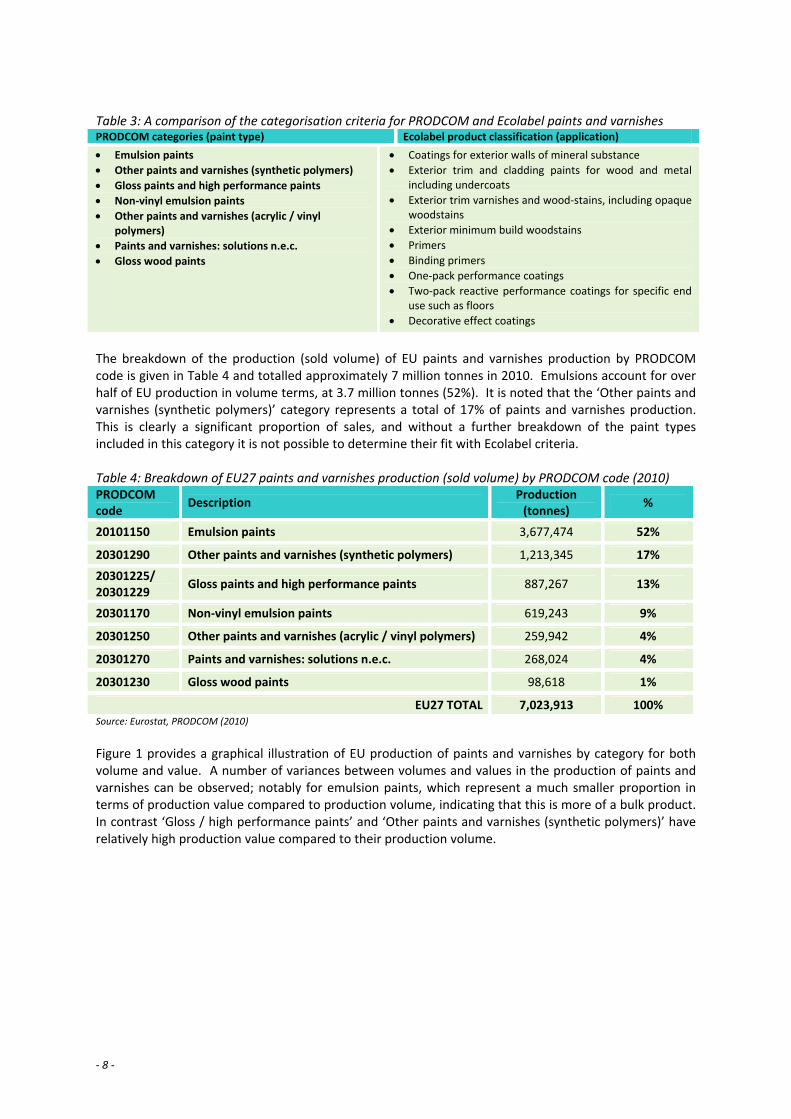
The breakdown of the production (sold volume) of EU paints and varnishes production by PRODCOM code is given in Table 4 and totalled approximately 7 million tonnes in 2010. Emulsions account for over half of EU production in volume terms, at 3.7 million tonnes (52%). It is noted that the ‘Other paints and varnishes (synthetic polymers)’ category represents a total of 17% of paints and varnishes production. This is clearly a significant proportion of sales, and without a further breakdown of the paint types included in this category it is not possible to determine their fit with Ecolabel criteria. Table 4: Breakdown of EU27 paints and varnishes production (sold volume) by PRODCOM code (2010) PRODCOM code
Description Production (tonnes)
%
20101150 Emulsion paints 3,677,474 52%
20301290 Other paints and varnishes (synthetic polymers) 1,213,345 17%
20301225/ 20301229
Gloss paints and high performance paints 887,267 13%
20301170 Non‐vinyl emulsion paints 619,243 9%
20301250 Other paints and varnishes (acrylic / vinyl polymers) 259,942 4%
20301270 Paints and varnishes: solutions n.e.c. 268,024 4%
20301230 Gloss wood paints 98,618 1%
EU27 TOTAL 7,023,913 100% Source: Eurostat, PRODCOM (2010)
Figure 1 provides a graphical illustration of EU production of paints and varnishes by category for both volume and value. A number of variances between volumes and values in the production of paints and varnishes can be observed; notably for emulsion paints, which represent a much smaller proportion in terms of production value compared to production volume, indicating that this is more of a bulk product. In contrast ‘Gloss / high performance paints’ and ‘Other paints and varnishes (synthetic polymers)’ have relatively high production value compared to their production volume.

‐ 9 ‐
Figure 1: EU27 paints and varnishes production by type, value and volume (2010)
Source: Eurostat, PRODCOM (2010)
3.2 Market structure
3.2.1 Global market trends
Although the European paints market has seen a fall between 2005 and 2009, the global paints market has seen an increase in terms of volume of nearly 14%. This is explained by a large increase in the Asia‐Pacific area, predominantly led by China. High growth markets, mainly China and Russia, are seeing higher investments from paint manufacturers. The construction industries in Brazil, Russia, India and China (BRIC countries) are expected to register robust growth and projected to register an overall growth rate (CAGR) of 10.7% to 2015.12 However, it is in mature markets that medium and high quality paint is in demand. Paint consumption in these countries is linked to standard of living and lower quality paints see higher demand in areas with lower quality of life. The paint and coatings industries in the United States, Western Europe and Japan, however, are considered mature. The paints market in these areas generally correlates with the health of the economy, in particular the housing, construction and transportation sectors. It is estimated that new construction represents approximately 20‐25% of the overall demand in decorative paints.13 Currently, however, the construction and manufacturing sectors within the EU that provide the drivers for the paints market are not growing.14 Drivers within the paints and coatings industry consist of a broad range of factors: both economic drivers such as GDP and a change in DIY and decorating trends.
3.2.2 Major players
The paints market is dominated by several large companies. It was estimated in 2008 that the top ten coating producers accounted for one third of total global output15, demonstrating their dominance over the markets.
12 World construction network, BRIC construction industry expected to register robust growth, 2011. Available at: http://blog.worldconstructionnetwork.com/wcn_blog/2011/11/bric‐constructi.html 13 Tikkurila, Annual Report, 2010 14 CEPE, Annual Report, 2010 15 Coatings World, 2008. Available at: http://www.coatingsworld.com/contents/view_breaking‐news/2008‐04‐03/china‐s‐paint‐industry‐becomes‐world‐s‐second‐larg/

‐ 10 ‐
These ten coatings producers are16: 1. AkzoNobel (The Netherlands) 2. Henkel (Germany) 3. PPG (USA) 4. Sherwin‐Williams (USA) 5. DuPont (USA) 6. BASF (Germany) 7. RPM (USA) 8. Valspar (USA) 9. 3M (USA) 10. Kansai Paint (Japan). AkzoNobel, based in the Netherlands, is a major supplier in the paint market, with total revenue of €14.6 billion in 2010, up from €13 billion in 2009. Of this, the mature European market represented 39% and emerging Europe only 6%.17 An increasing proportion of revenue is, however, driven by emerging markets; mainly China. AkzoNobel produces a variety of paint types. Performance coatings (including marine, car refinishes, industrial coatings, powder coating and wood finishes and adhesives) represent 45% of total revenue and decorative paint represents 35%. Of this decorative paint revenue, 52% is accrued within Europe, equating to €2.5 billion. It is also noticeable that each of these global companies shows a degree of vertical integration within the structure of the organisation. Many of the chemicals produced within the organisations are used to produce a wide variety of paints. The European coatings market shows a similar structure to the global market; a few large companies dominate production. These are outlined in Table 5. The European paints market is well established and, even though there is a shift towards acquisitions and subsequent developments of large global companies, there are still an estimated 3,000 coatings manufacturers in the EU.18 Table 5: Top 5 largest companies in the European coatings market (2011) Company name Country Sales (2011) Global ranking
AkzoNobel The Netherlands $13 billion 1
Henkel Germany $9.7 billion 3
BASF Germany $3.42 billion 6
Sika Switzerland $2.3 billion 11
DAW Germany $1.4 billion 16 Source: Coatings World, 2011. Available at: http://www.coatingsworld.com/issues/2011‐07/view_features/2011‐top‐companies‐report/
3.2.3 Small and medium sized enterprises
While the larger paint and varnish suppliers have a comprehensive product list, including decorative and speciality paints, small and medium‐sized enterprises (SMEs) in the paints industry tend to focus on niche products and national consumer demands in the European market. In 2009, there were an estimated 1,000 SMEs in the coatings business in Europe.19 There is a strong market for premium paint products often produced by small companies. Many of the SMEs represent the ecopaint market, specialising in products such as organic paints, wholly VOC free paints and paints from natural ingredients such as linseed oils.
16 Coatings World, Top Companies Report, 2008. Available at: http://coatingsworld.com/contents/view_features/2008‐07‐14/2008‐top‐companies‐report/ 17 AkzoNobel Report,2010. Available at: http://report.akzonobel.com/2010/ar/servicepages/downloads/files/akzonobel_report10_entire.pdf 18 CEPE, 2007. Cited in CBI, The paints and other coatings market in the EU, 2007 19 Coatings World, SME’s are fighting to hold on, 2009. Available at: http://www.coatingsworld.com/contents/view_europe‐reports/2009‐02‐02/smes‐are‐fighting‐to‐hold‐on/
‐ 11 ‐
The supply chain for paint materials is similarly composed of both large enterprises and SMEs. The solvents industry, for example, employs more than 10,000 people in Europe and more than 80% of companies are SMEs.20 SMEs report that they are particularly suffering from the rising cost of raw materials, as well as the lack of access to credit due to the recession across Europe. Within Southern Europe, particularly in Italy and Spain where there are many SMEs who produce their own waterborne paints for decorative purposes, this threat is particularly severe.21 The poorly performing construction market in these countries directly affects these micro‐coatings businesses. In 2009, a number of acquisitions of paint producing SMEs took place across Europe, mainly in Germany, Europe’s largest market.22 The larger, global coatings companies are currently seeing slower sales growth in Europe than in other parts of the world, most noticeably in Asia and Latin America. AkzoNobel, for example, now sees approximately 40% of its sales coming from these high growth markets. As such many European companies, including SMEs, have been extending their activities outside of Europe. For SMEs this means mainly extending business into Eastern Europe.
3.3 Production
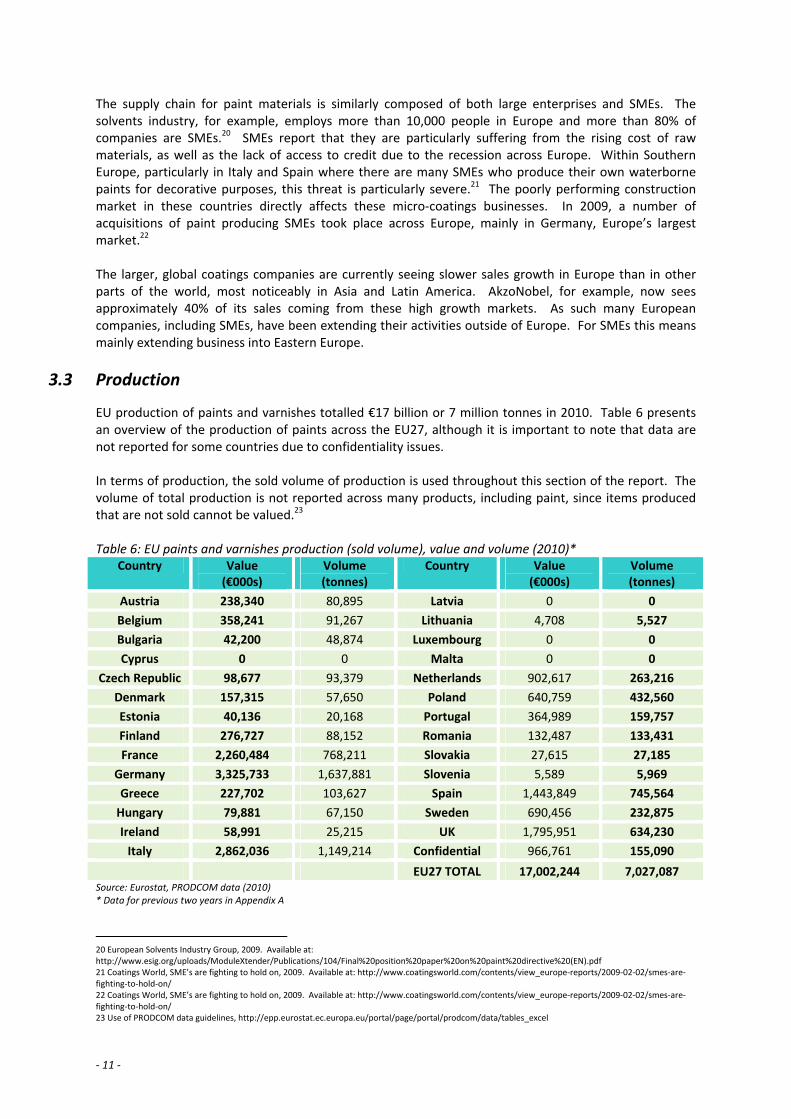
EU production of paints and varnishes totalled €17 billion or 7 million tonnes in 2010. Table 6 presents an overview of the production of paints across the EU27, although it is important to note that data are not reported for some countries due to confidentiality issues. In terms of production, the sold volume of production is used throughout this section of the report. The volume of total production is not reported across many products, including paint, since items produced that are not sold cannot be valued.23 Table 6: EU paints and varnishes production (sold volume), value and volume (2010)*
Country Value (€000s)
Volume (tonnes)
Country Value (€000s)
Volume (tonnes)
Austria 238,340 80,895 Latvia 0 0
Belgium 358,241 91,267 Lithuania 4,708 5,527
Bulgaria 42,200 48,874 Luxembourg 0 0
Cyprus 0 0 Malta 0 0
Czech Republic 98,677 93,379 Netherlands 902,617 263,216
Denmark 157,315 57,650 Poland 640,759 432,560
Estonia 40,136 20,168 Portugal 364,989 159,757
Finland 276,727 88,152 Romania 132,487 133,431
France 2,260,484 768,211 Slovakia 27,615 27,185
Germany 3,325,733 1,637,881 Slovenia 5,589 5,969
Greece 227,702 103,627 Spain 1,443,849 745,564
Hungary 79,881 67,150 Sweden 690,456 232,875
Ireland 58,991 25,215 UK 1,795,951 634,230
Italy 2,862,036 1,149,214 Confidential 966,761 155,090
EU27 TOTAL 17,002,244 7,027,087 Source: Eurostat, PRODCOM data (2010) * Data for previous two years in Appendix A
20 European Solvents Industry Group, 2009. Available at: http://www.esig.org/uploads/ModuleXtender/Publications/104/Final%20position%20paper%20on%20paint%20directive%20(EN).pdf 21 Coatings World, SME’s are fighting to hold on, 2009. Available at: http://www.coatingsworld.com/contents/view_europe‐reports/2009‐02‐02/smes‐are‐fighting‐to‐hold‐on/ 22 Coatings World, SME’s are fighting to hold on, 2009. Available at: http://www.coatingsworld.com/contents/view_europe‐reports/2009‐02‐02/smes‐are‐fighting‐to‐hold‐on/ 23 Use of PRODCOM data guidelines, http://epp.eurostat.ec.europa.eu/portal/page/portal/prodcom/data/tables_excel

‐ 12 ‐
3.3.1 Paint production by country
Table 7 breaks this down further by visually analysing the production share of each of the EU27 countries, in terms of both volume and value of produced goods:
Germany is shown to be the largest producer of paints and varnishes in the EU, in terms of both volume and value; with total production of 1.6 million tonnes or €3.3 billion. This gives Germany a production share of over 20%.
Italy is the second largest producer with 18% of the EU production volume and 17% of EU production value.
France is the third largest producer with a production share at 14% EU production volume and 11% of EU production value.
Table 7: EU paints and varnishes production share by country, excluding confidential data (2010)
Country % of Volume % of Value
Austria 1.5% 1.2%
Belgium 2.2% 1.3%
Bulgaria 0.3% 0.7%
Cyprus 0.0% 0.0%
Czech Republic 0.6% 1.4%
Denmark 1.0% 0.8%
Estonia 0.3% 0.3%
Finland 1.7% 1.3%
France 14.1% 11.2%
Germany 20.7% 23.8%
Greece 1.4% 1.5%
Hungary 0.5% 1.0%
Ireland 0.4% 0.4%
Italy 17.8% 16.7%
Latvia 0.0% 0.0%
Lithuania 0.0% 0.1%
Luxembourg 0.0% 0.0%
Malta 0.0% 0.0%
Netherlands 5.6% 3.8%
Poland 4.0% 6.3%
Portugal 2.3% 2.3%
Romania 0.8% 1.9%
Slovakia 0.2% 0.4%
Slovenia 0.0% 0.1%
Spain 9.0% 10.8%
Sweden 4.3% 3.4%
United Kingdom 11.2% 9.2% Source: Eurostat, PRODCOM data (2010)
Legend: 0% 2% 5% 10% 20%
Figure 2 graphically presents the value of EU paints and varnishes production by country for 2010. This illustrates that the top five producing countries account for 69% of the total value of production of manufactured goods. These five countries are:
Germany (20%)
Italy (17%)

‐ 13 ‐
France, (13%)
United Kingdom (11%)
Spain (8%). Figure 2: EU paints and varnishes production value by country (2010)
Source: Eurostat, PRODCOM data (2010)
3.4 Public procurement
The trade paints market for 2006 is analysed by sector in Figure 3. In terms of public procurement, 16% of the total is used for social housing and 11% for public non‐housing.24 In the UK, trade paint represents an estimated 43% share of the overall decorative paints market.25 Figure 3: Trade paints market by sector 2006 (% share in sector)
Source: Palmer market research (2007), Trade paints market report (GB)
Within the trade paints market outlined in Figure 3 above, 86% of the volume of paint is for existing buildings (mainly redecoration) rather than on new buildings. This high figure is true across all sectors: for example, for social housing, 92% of paint used is for redecoration rather than on new buildings.
24 Palmer market research (2007), Trade paints market Report (GB) 25 AMA Research (2009), Paint, wall coverings and woodcare market, UK 2009‐2013
‐ 14 ‐
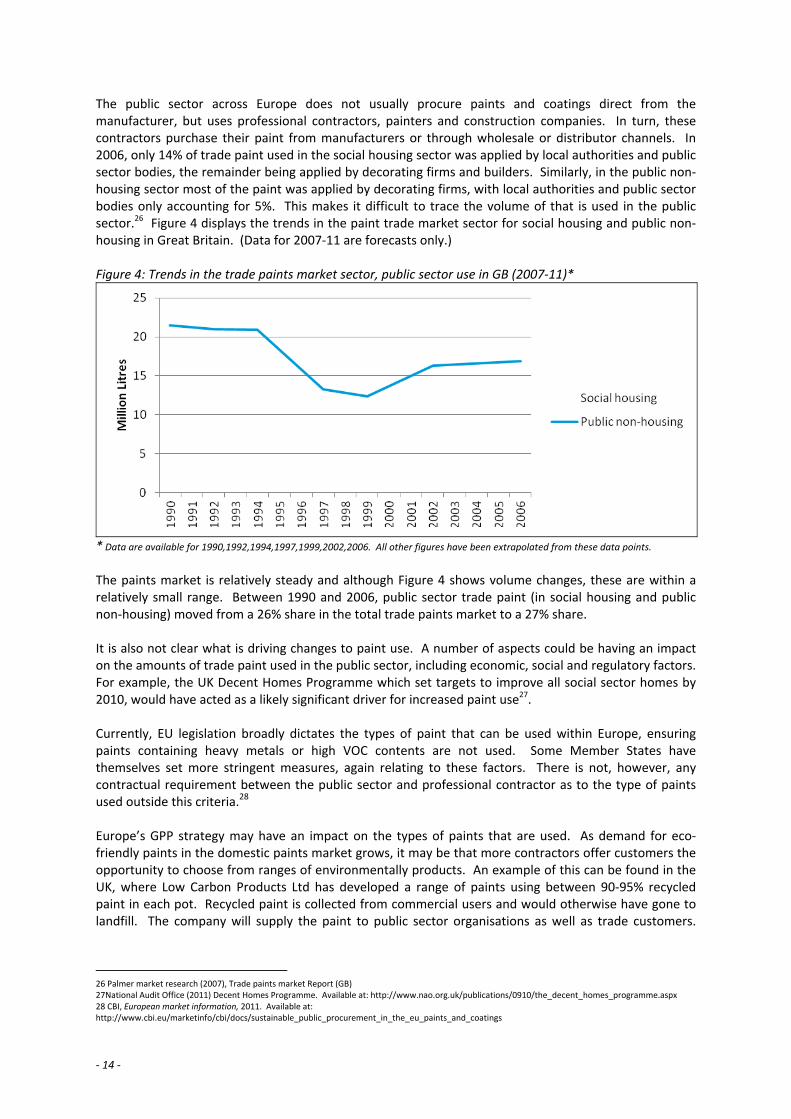
The public sector across Europe does not usually procure paints and coatings direct from the manufacturer, but uses professional contractors, painters and construction companies. In turn, these contractors purchase their paint from manufacturers or through wholesale or distributor channels. In 2006, only 14% of trade paint used in the social housing sector was applied by local authorities and public sector bodies, the remainder being applied by decorating firms and builders. Similarly, in the public non‐housing sector most of the paint was applied by decorating firms, with local authorities and public sector bodies only accounting for 5%. This makes it difficult to trace the volume of that is used in the public sector.26 Figure 4 displays the trends in the paint trade market sector for social housing and public non‐housing in Great Britain. (Data for 2007‐11 are forecasts only.) Figure 4: Trends in the trade paints market sector, public sector use in GB (2007‐11)*
* Data are available for 1990,1992,1994,1997,1999,2002,2006. All other figures have been extrapolated from these data points.
The paints market is relatively steady and although Figure 4 shows volume changes, these are within a relatively small range. Between 1990 and 2006, public sector trade paint (in social housing and public non‐housing) moved from a 26% share in the total trade paints market to a 27% share. It is also not clear what is driving changes to paint use. A number of aspects could be having an impact on the amounts of trade paint used in the public sector, including economic, social and regulatory factors. For example, the UK Decent Homes Programme which set targets to improve all social sector homes by 2010, would have acted as a likely significant driver for increased paint use27. Currently, EU legislation broadly dictates the types of paint that can be used within Europe, ensuring paints containing heavy metals or high VOC contents are not used. Some Member States have themselves set more stringent measures, again relating to these factors. There is not, however, any contractual requirement between the public sector and professional contractor as to the type of paints used outside this criteria.28 Europe’s GPP strategy may have an impact on the types of paints that are used. As demand for eco‐friendly paints in the domestic paints market grows, it may be that more contractors offer customers the opportunity to choose from ranges of environmentally products. An example of this can be found in the UK, where Low Carbon Products Ltd has developed a range of paints using between 90‐95% recycled paint in each pot. Recycled paint is collected from commercial users and would otherwise have gone to landfill. The company will supply the paint to public sector organisations as well as trade customers.
26 Palmer market research (2007), Trade paints market Report (GB) 27National Audit Office (2011) Decent Homes Programme. Available at: http://www.nao.org.uk/publications/0910/the_decent_homes_programme.aspx 28 CBI, European market information, 2011. Available at: http://www.cbi.eu/marketinfo/cbi/docs/sustainable_public_procurement_in_the_eu_paints_and_coatings

‐ 15 ‐
Additions to the paint, including anti‐bacterial, anti‐graffiti and anti‐chewing gum properties, make the product especially ideal for health and public buildings.29 Within the UK, public sector is estimated to account for 23% of total sales of decorative paints in 2008.30 Across the EU there is, however, a lack of available data with regards to public procurement of paints and varnishes. The use of contractors for public sector painting, the number of uses of paint, and the irregularity of which redecoration/renovation of public sector buildings takes place, are all significant aspects that hinder the ability to make estimates in this sector.
29 Low carbon products Ltd, 2011. Available at: http://www.recycledpaint.co.uk/ 30 AMA Research (2009), Paint, wall coverings and wood care market, UK 2009‐2013
‐ 16 ‐
4 Technical analysis
Information of the environmental performance of paints and varnishes along their whole life cycle is necessary to identify and address where the most significant impacts occur. This section details this information, identifies environmental concerns and where further investigation may be needed.
4.1 Review of life cycle assessments
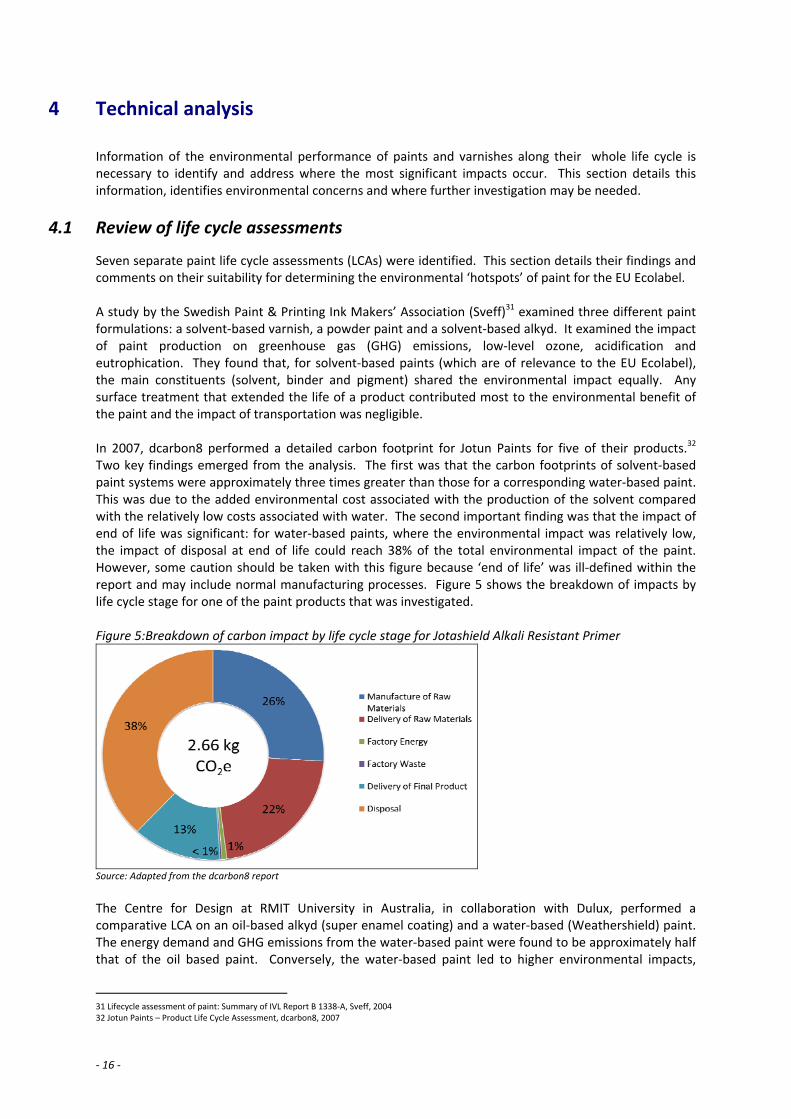
Seven separate paint life cycle assessments (LCAs) were identified. This section details their findings and comments on their suitability for determining the environmental ‘hotspots’ of paint for the EU Ecolabel. A study by the Swedish Paint & Printing Ink Makers’ Association (Sveff)31 examined three different paint formulations: a solvent‐based varnish, a powder paint and a solvent‐based alkyd. It examined the impact of paint production on greenhouse gas (GHG) emissions, low‐level ozone, acidification and eutrophication. They found that, for solvent‐based paints (which are of relevance to the EU Ecolabel), the main constituents (solvent, binder and pigment) shared the environmental impact equally. Any surface treatment that extended the life of a product contributed most to the environmental benefit of the paint and the impact of transportation was negligible. In 2007, dcarbon8 performed a detailed carbon footprint for Jotun Paints for five of their products.32 Two key findings emerged from the analysis. The first was that the carbon footprints of solvent‐based paint systems were approximately three times greater than those for a corresponding water‐based paint. This was due to the added environmental cost associated with the production of the solvent compared with the relatively low costs associated with water. The second important finding was that the impact of end of life was significant: for water‐based paints, where the environmental impact was relatively low, the impact of disposal at end of life could reach 38% of the total environmental impact of the paint. However, some caution should be taken with this figure because ‘end of life’ was ill‐defined within the report and may include normal manufacturing processes. Figure 5 shows the breakdown of impacts by life cycle stage for one of the paint products that was investigated. Figure 5:Breakdown of carbon impact by life cycle stage for Jotashield Alkali Resistant Primer
Source: Adapted from the dcarbon8 report
The Centre for Design at RMIT University in Australia, in collaboration with Dulux, performed a comparative LCA on an oil‐based alkyd (super enamel coating) and a water‐based (Weathershield) paint. The energy demand and GHG emissions from the water‐based paint were found to be approximately half that of the oil based paint. Conversely, the water‐based paint led to higher environmental impacts,
31 Lifecycle assessment of paint: Summary of IVL Report B 1338‐A, Sveff, 2004 32 Jotun Paints – Product Life Cycle Assessment, dcarbon8, 2007

‐ 17 ‐
particularly for acidification, eutrophication and heavy metal release. There is no indication of the full methodology used and so the validity of the results is difficult to measure. Figure 6 compares the two types of paint that were studied across all of the environmental impact categories; note that the values are expressed as a comparative percentage and that no conclusions about the magnitude or importance of each impact category can be made. Figure 6: Comparison of the two types of paint across all impact categories.
Source: Adapted from the RMIT report
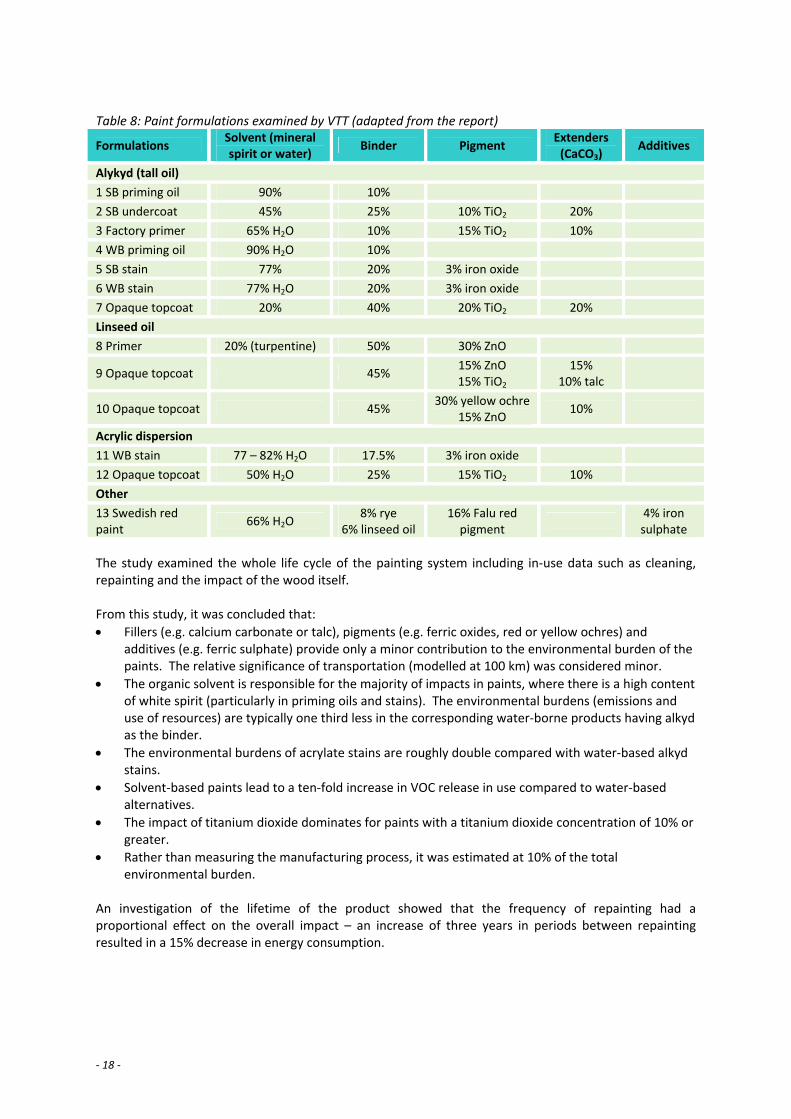
A comprehensive study33 by VTT Building Technology examined the environmental impact of exterior coating systems. They examined coated wooden cladding over a period of one hundred years including:
manufacture of raw materials for paint
manufacture of paints
transports
painting
care and renewal
recycling and final disposal. Thirteen model paints were analysed (Table 8). The study is comprehensive and is declared as complying with the now out‐dated ISO 14041 standard for performing life cycle assessment. As part of the collection of data, major paint manufacturers were surveyed and, although these are comparatively old data (from the late 1990s), some of the model paints appear to be in use today.
33 Environmental Impact of Coated Exterior Wooden Cladding, VTT Building Technology, 1999
‐ 18 ‐
Table 8: Paint formulations examined by VTT (adapted from the report)
Formulations Solvent (mineral spirit or water)
Binder Pigment Extenders (CaCO3)
Additives
Alykyd (tall oil)
1 SB priming oil 90% 10%
2 SB undercoat 45% 25% 10% TiO2 20%
3 Factory primer 65% H2O 10% 15% TiO2 10%
4 WB priming oil 90% H2O 10%
5 SB stain 77% 20% 3% iron oxide
6 WB stain 77% H2O 20% 3% iron oxide
7 Opaque topcoat 20% 40% 20% TiO2 20%
Linseed oil
8 Primer 20% (turpentine) 50% 30% ZnO
9 Opaque topcoat 45% 15% ZnO 15% TiO2
15% 10% talc
10 Opaque topcoat 45% 30% yellow ochre
15% ZnO 10%
Acrylic dispersion
11 WB stain 77 – 82% H2O 17.5% 3% iron oxide
12 Opaque topcoat 50% H2O 25% 15% TiO2 10%
Other
13 Swedish red paint
66% H2O 8% rye
6% linseed oil 16% Falu red pigment
4% iron sulphate
The study examined the whole life cycle of the painting system including in‐use data such as cleaning, repainting and the impact of the wood itself. From this study, it was concluded that:
Fillers (e.g. calcium carbonate or talc), pigments (e.g. ferric oxides, red or yellow ochres) and additives (e.g. ferric sulphate) provide only a minor contribution to the environmental burden of the paints. The relative significance of transportation (modelled at 100 km) was considered minor.
The organic solvent is responsible for the majority of impacts in paints, where there is a high content of white spirit (particularly in priming oils and stains). The environmental burdens (emissions and use of resources) are typically one third less in the corresponding water‐borne products having alkyd as the binder.
The environmental burdens of acrylate stains are roughly double compared with water‐based alkyd stains.
Solvent‐based paints lead to a ten‐fold increase in VOC release in use compared to water‐based alternatives.
The impact of titanium dioxide dominates for paints with a titanium dioxide concentration of 10% or greater.
Rather than measuring the manufacturing process, it was estimated at 10% of the total environmental burden.
An investigation of the lifetime of the product showed that the frequency of repainting had a proportional effect on the overall impact – an increase of three years in periods between repainting resulted in a 15% decrease in energy consumption.
‐ 19 ‐
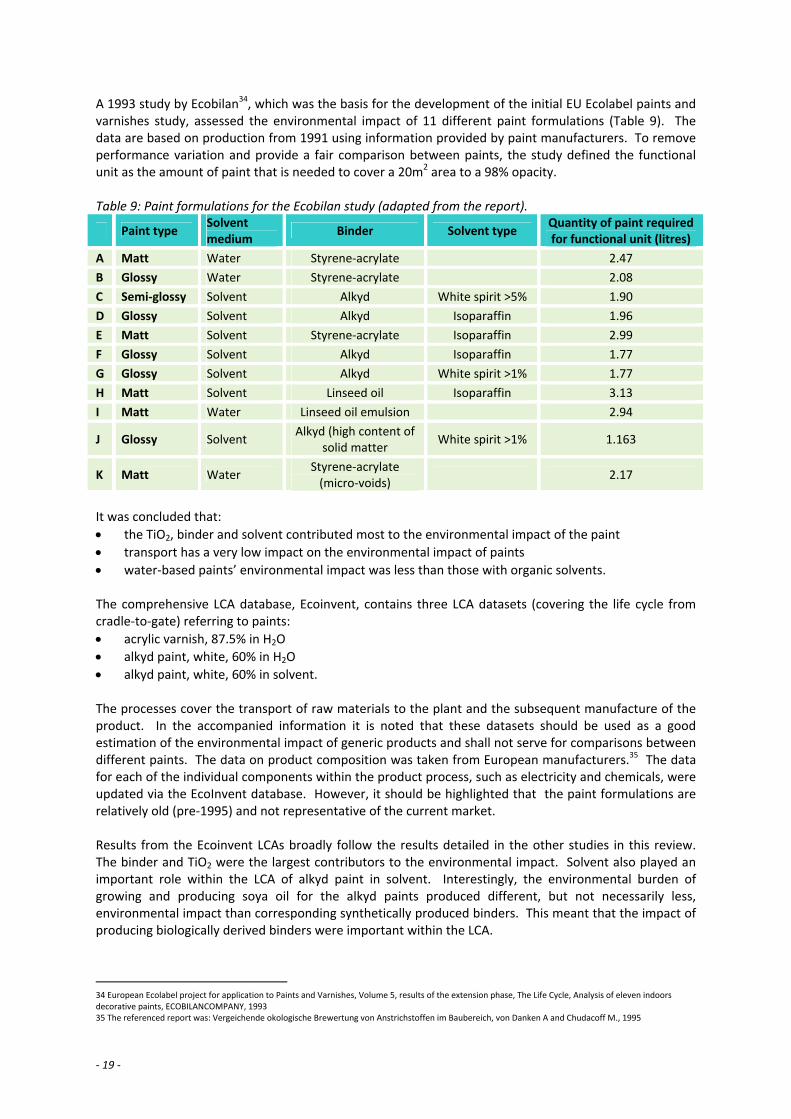
A 1993 study by Ecobilan34, which was the basis for the development of the initial EU Ecolabel paints and varnishes study, assessed the environmental impact of 11 different paint formulations (Table 9). The data are based on production from 1991 using information provided by paint manufacturers. To remove performance variation and provide a fair comparison between paints, the study defined the functional unit as the amount of paint that is needed to cover a 20m2 area to a 98% opacity. Table 9: Paint formulations for the Ecobilan study (adapted from the report).
Paint type Solvent medium
Binder Solvent type Quantity of paint required for functional unit (litres)
A Matt Water Styrene‐acrylate 2.47
B Glossy Water Styrene‐acrylate 2.08
C Semi‐glossy Solvent Alkyd White spirit >5% 1.90
D Glossy Solvent Alkyd Isoparaffin 1.96
E Matt Solvent Styrene‐acrylate Isoparaffin 2.99
F Glossy Solvent Alkyd Isoparaffin 1.77
G Glossy Solvent Alkyd White spirit >1% 1.77
H Matt Solvent Linseed oil Isoparaffin 3.13
I Matt Water Linseed oil emulsion 2.94
J Glossy Solvent Alkyd (high content of
solid matter White spirit >1% 1.163
K Matt Water Styrene‐acrylate (micro‐voids)
2.17
It was concluded that:
the TiO2, binder and solvent contributed most to the environmental impact of the paint
transport has a very low impact on the environmental impact of paints
water‐based paints’ environmental impact was less than those with organic solvents. The comprehensive LCA database, Ecoinvent, contains three LCA datasets (covering the life cycle from cradle‐to‐gate) referring to paints:
acrylic varnish, 87.5% in H2O
alkyd paint, white, 60% in H2O
alkyd paint, white, 60% in solvent.
The processes cover the transport of raw materials to the plant and the subsequent manufacture of the product. In the accompanied information it is noted that these datasets should be used as a good estimation of the environmental impact of generic products and shall not serve for comparisons between different paints. The data on product composition was taken from European manufacturers.35 The data for each of the individual components within the product process, such as electricity and chemicals, were updated via the EcoInvent database. However, it should be highlighted that the paint formulations are relatively old (pre‐1995) and not representative of the current market. Results from the Ecoinvent LCAs broadly follow the results detailed in the other studies in this review. The binder and TiO2 were the largest contributors to the environmental impact. Solvent also played an important role within the LCA of alkyd paint in solvent. Interestingly, the environmental burden of growing and producing soya oil for the alkyd paints produced different, but not necessarily less, environmental impact than corresponding synthetically produced binders. This meant that the impact of producing biologically derived binders were important within the LCA.
34 European Ecolabel project for application to Paints and Varnishes, Volume 5, results of the extension phase, The Life Cycle, Analysis of eleven indoors decorative paints, ECOBILANCOMPANY, 1993 35 The referenced report was: Vergeichende okologische Brewertung von Anstrichstoffen im Baubereich, von Danken A and Chudacoff M., 1995
‐ 20 ‐
The internal carbon footprint calculations of one stakeholder were made available to the team and show that environmental impacts related to packaging are high and can reach up to 70% of the overall GHG emissions. This differs significantly to other findings presented here.
4.1.1 Summary
Based on the review of the identified LCAs described above, the following conclusions can be made:
Solvent‐based paints have a higher environmental impact than corresponding water‐based paints.
Extending the life of a product contributed most to the environmental benefit of the paint.
The impact of transportation is negligible.
The lack of inventory data on paint fillers, pigments and additives meant that the assessment of the environmental impact of these components is largely incomplete. Solvent‐based paints can lead to a ten‐fold increase in the release of VOCs compared to water‐based paints.
Where more than 10% TiO2 is used, it is the most significant contributor to the environmental impact.
Manufacturing impacts were vague within all examined studies.
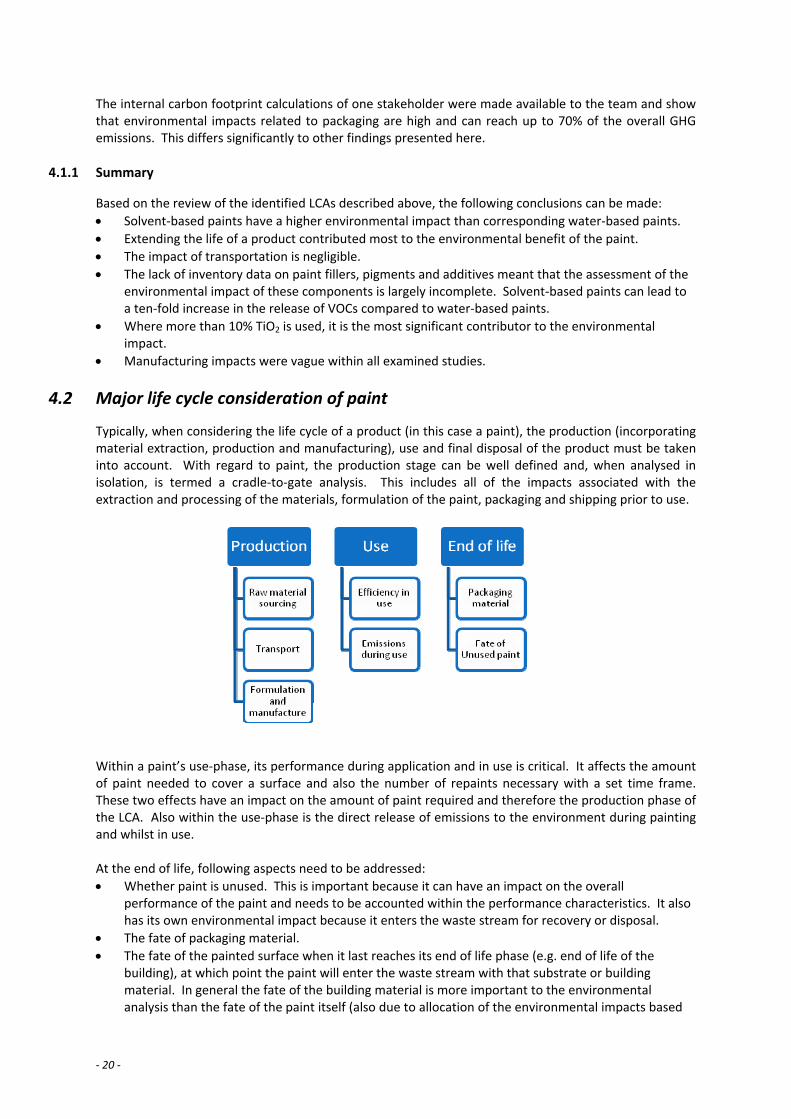
4.2 Major life cycle consideration of paint
Typically, when considering the life cycle of a product (in this case a paint), the production (incorporating material extraction, production and manufacturing), use and final disposal of the product must be taken into account. With regard to paint, the production stage can be well defined and, when analysed in isolation, is termed a cradle‐to‐gate analysis. This includes all of the impacts associated with the extraction and processing of the materials, formulation of the paint, packaging and shipping prior to use.
Within a paint’s use‐phase, its performance during application and in use is critical. It affects the amount of paint needed to cover a surface and also the number of repaints necessary with a set time frame. These two effects have an impact on the amount of paint required and therefore the production phase of the LCA. Also within the use‐phase is the direct release of emissions to the environment during painting and whilst in use. At the end of life, following aspects need to be addressed:
Whether paint is unused. This is important because it can have an impact on the overall performance of the paint and needs to be accounted within the performance characteristics. It also has its own environmental impact because it enters the waste stream for recovery or disposal.
The fate of packaging material.
The fate of the painted surface when it last reaches its end of life phase (e.g. end of life of the building), at which point the paint will enter the waste stream with that substrate or building material. In general the fate of the building material is more important to the environmental analysis than the fate of the paint itself (also due to allocation of the environmental impacts based
‐ 21 ‐
on the weight ratio of paint/building component), though the presence of the paint might alter the alternative fates available to the substrate.
4.3 Life cycle assessment of paint
In addition to the information currently available from the references, a cradle‐to gate LCA was performed using the Ecoinvent database to identify environmental ‘hotspots’, particularly for paint ingredients. The initial goal is to perform a simplified LCA which could provide sufficient data to identify where environmental impacts of paint manufacture are. The level of detail of the analysis can be extended later, depending on the significance of the expected outputs e.g. focus on relevant differences between alternative paints or on areas which are explicitly addressed in the current EU Ecolabel criteria etc. This section focuses on determining the environmental impact of the production phases of paint and final disposal of unused paint. The Ecoinvent database contains three LCAs of paints and varnishes (water‐based paint, solvent‐based paint and varnish). Despite the fact that these datasets are generic and do not correspond to modern paint formulations (data are from pre‐1995) they can provide a framework for the environmental impact of production of paint. A combination of the LCA model developed for the EcoInvent database and updated bills of material will provide sufficient depth to enable identification of key environmental hotspots.
4.3.1 Selection of paint
A key difficulty in defining the environmental impact of a paint is that there is no ‘standard’ paint formulation. One on‐line paint product directory contains 10,000 different resin/polymer formulations, 9,000 additives and 4,500 pigments and fillers.36 This large number of different ingredients can be used in a variety of combinations giving rise to hundreds of thousands of different paint formulations. Clearly, assessing the environmental impact of all varieties of paints will be impractical and a representative sample of products is needed. Information provided within the PRODCOM database identified two paint types with the largest market share:
Water‐based vinyl emulsions which can be used for a diverse range of paint applications from wall paints and trim paints
Water‐based Alkyd emulsions that are largely used in varnishes. Based on the analysis provided in section 3, these two paints represent approximately 50% of the entire European market share of paints. These are water‐based paints largely targeted at the home and professional market and therefore represent a large portion of paints relevant to the EU Ecolabel. The formulation and exact composition can vary significantly depending on the required properties for the paint, and therefore some assumptions over the bill of materials (BoM) are needed (see section 4.3.3). This has an effect, for example, on the amount of VOC within the paint, its hardness and the type of substrate that it can be applied to. Stakeholders are asked to provide feedback regarding further determination of representative paint case studies considered relevant for EU Ecolabel.
4.3.2 Functional unit and reference flow
The functional unit is used to define what the LCA is measuring, and provides a reference to which the inputs and outputs can be related. In this case a functional unit is suggested which will enable information regarding the amount of paint needed for a certain surface in a defined time frame to be incorporated (this would allow capture of environmental savings due to paint durability). A similar
36 http://www.specialchem4coatings.com/
‐ 22 ‐
functional unit is described in the LCA37 by the Danish Environmental Protection Agency which modelled the use of paint covering a defined surface for a defined time frame with intermittent repaints. As described in section 4.1, the use‐phase plays an important role in determining the overall environmental impact of the paint: a better performing paint requires fewer repaints, reducing the environmental impact in production in addition to well in other life cycle phases. An indication regarding the significance of the paint’s performance in the use phase and its environmental consequences are investigated separately in section 4.4. This analysis aims at emphasising the importance of the paint performance and provides the environmental implications but is not intended to capture precise quantification of these impacts. Further, this study intends to define ‘baseline’ environmental impacts rather than perform a comparative analysis. The outcome of a comparative analysis would be too specific as two single paint formulations will be then compared, providing only a limited overview of the issues whereas the scope of the EU Ecolabel covers several types of paints and varnishes. The detailed use phase and the end of life considerations are addressed separately within the document. The functional unit for this life cycle assessment was chosen to be the amount of paint required to cover a 20 m2 surface for a period of 21 years, assuming that a repaint is required every 7 years to maintain coverage. In the LCA no performance data were available for either of the two paint products that were modelled. In the absence of data there will be no reference flow differences modelled between the paints. To calculate the reference flow it is assumed that 1 kg of either paint product is required to paint 8 m2 of a surface to the required coverage. To fulfil the functional unit described above a total weight of 7.5 kg of either paint product is required. It is also assumed that there will be 10% paint wastage due to it being left unused in the containers38; this adds an additional requirement of 750 g of paint. The total paint production requirement to fulfil the functional unit is therefore 8.25 kg.
4.3.3 System boundaries, bill of materials and cut‐off level
A system boundary within an LCA defines the processes and products that are measured when determining the LCA of the product. To determine the manufacturing impacts of paints, the following impacts are assessed:
extraction of raw materials
manufacture of raw materials
transport of raw materials prior to formulation
processing impacts associated with production of the final paint
emissions and waste streams from the manufacturing process
disposal of any unused paint. The streamlined LCA does not include:
the manufacture or disposal of the paint pot
any packaging associated with the manufacture and distribution of components or the final product
the use phase including transport or impacts associated with the building
disposal of the final substrate material. Identification of the bill of materials (BoM) for these paints was achieved from several sources. Primarily, formulations were developed based on manufacturers recommended sample formulations using promotional material. Academic literature was also used to estimate bills of material for proprietary
37 B. Weidema, H. Wenzel, C. Petersen, K. Hansen, "The Product, Functional Unit and Reference Flows in LCA", Environmental News No. 70 2004, http://www.norlca.org/resources/777.pdf 38 Reported figures on the amount of wasted paint have varied widely. Values as high as 25% have been reported, but, during the 1st AHWG, industry argued
that the amount wasted should be set at 8%. As a compromise, a figure of 10% was chosen.
‐ 23 ‐
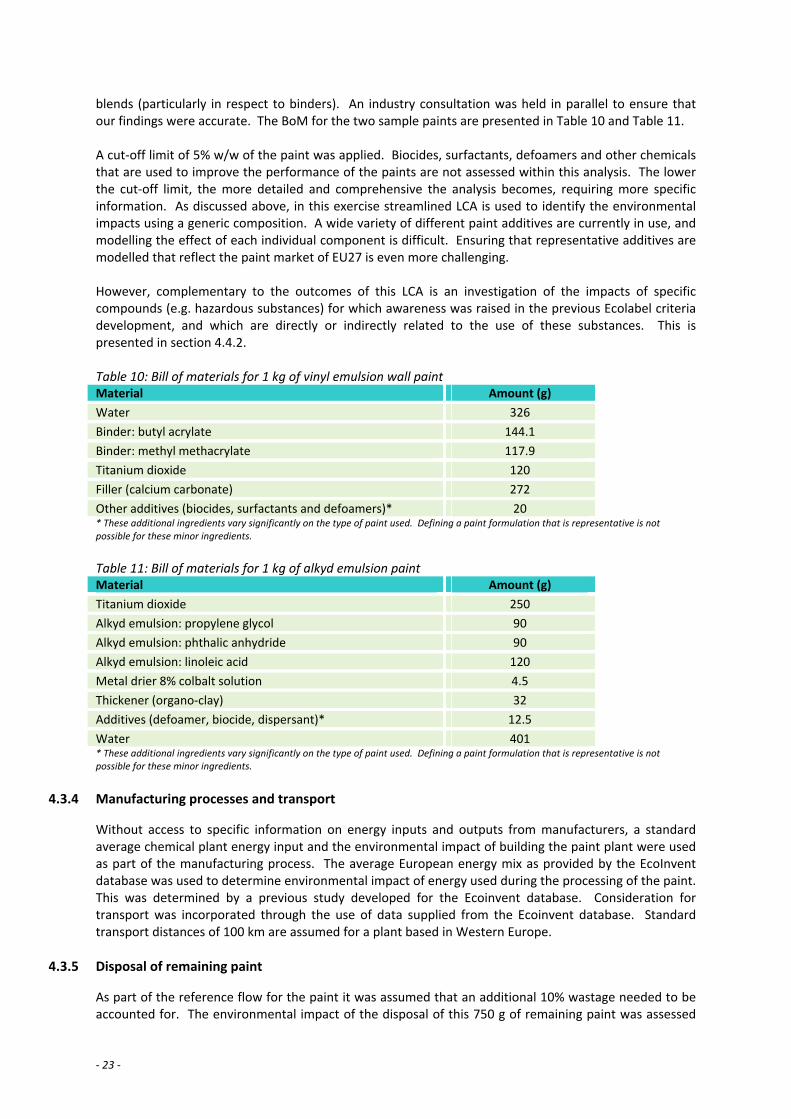
blends (particularly in respect to binders). An industry consultation was held in parallel to ensure that our findings were accurate. The BoM for the two sample paints are presented in Table 10 and Table 11. A cut‐off limit of 5% w/w of the paint was applied. Biocides, surfactants, defoamers and other chemicals that are used to improve the performance of the paints are not assessed within this analysis. The lower the cut‐off limit, the more detailed and comprehensive the analysis becomes, requiring more specific information. As discussed above, in this exercise streamlined LCA is used to identify the environmental impacts using a generic composition. A wide variety of different paint additives are currently in use, and modelling the effect of each individual component is difficult. Ensuring that representative additives are modelled that reflect the paint market of EU27 is even more challenging. However, complementary to the outcomes of this LCA is an investigation of the impacts of specific compounds (e.g. hazardous substances) for which awareness was raised in the previous Ecolabel criteria development, and which are directly or indirectly related to the use of these substances. This is presented in section 4.4.2. Table 10: Bill of materials for 1 kg of vinyl emulsion wall paint Material Amount (g)
Water 326
Binder: butyl acrylate 144.1
Binder: methyl methacrylate 117.9
Titanium dioxide 120
Filler (calcium carbonate) 272
Other additives (biocides, surfactants and defoamers)* 20 * These additional ingredients vary significantly on the type of paint used. Defining a paint formulation that is representative is not possible for these minor ingredients.
Table 11: Bill of materials for 1 kg of alkyd emulsion paint Material Amount (g)
Titanium dioxide 250
Alkyd emulsion: propylene glycol 90
Alkyd emulsion: phthalic anhydride 90
Alkyd emulsion: linoleic acid 120
Metal drier 8% colbalt solution 4.5
Thickener (organo‐clay) 32
Additives (defoamer, biocide, dispersant)* 12.5
Water 401 * These additional ingredients vary significantly on the type of paint used. Defining a paint formulation that is representative is not possible for these minor ingredients.
4.3.4 Manufacturing processes and transport
Without access to specific information on energy inputs and outputs from manufacturers, a standard average chemical plant energy input and the environmental impact of building the paint plant were used as part of the manufacturing process. The average European energy mix as provided by the EcoInvent database was used to determine environmental impact of energy used during the processing of the paint. This was determined by a previous study developed for the Ecoinvent database. Consideration for transport was incorporated through the use of data supplied from the Ecoinvent database. Standard transport distances of 100 km are assumed for a plant based in Western Europe.
4.3.5 Disposal of remaining paint
As part of the reference flow for the paint it was assumed that an additional 10% wastage needed to be accounted for. The environmental impact of the disposal of this 750 g of remaining paint was assessed
‐ 24 ‐
using a bespoke emulsion paint disposal scenario provided within the EcoInvent database. This waste treatment scenario models the incineration of paint as part of hazardous waste treatment process (based on Swiss values from the EcoInvent database). It includes the chemicals and fuels required as well as the emissions to air and water that occur. For comparison, a further analysis has been performed on landfilling residual paint using standard scenarios within SimaPro. The disposal of paint applied to substrate has not been included in this life cycle assessment. It is assumed that the paint will remain attached until the surface itself is disposed of. In the case of a demolished building the rubble will be sorted, crushed and reused as building materials for foundations. There is little available information on any impact of paint in this phase with the main focus on the impact of the overall building material. The environmental impact from this stage is expected to be relatively low compared to the manufacturing stage and has therefore not been modelled.
4.3.6 Analysis and comparison
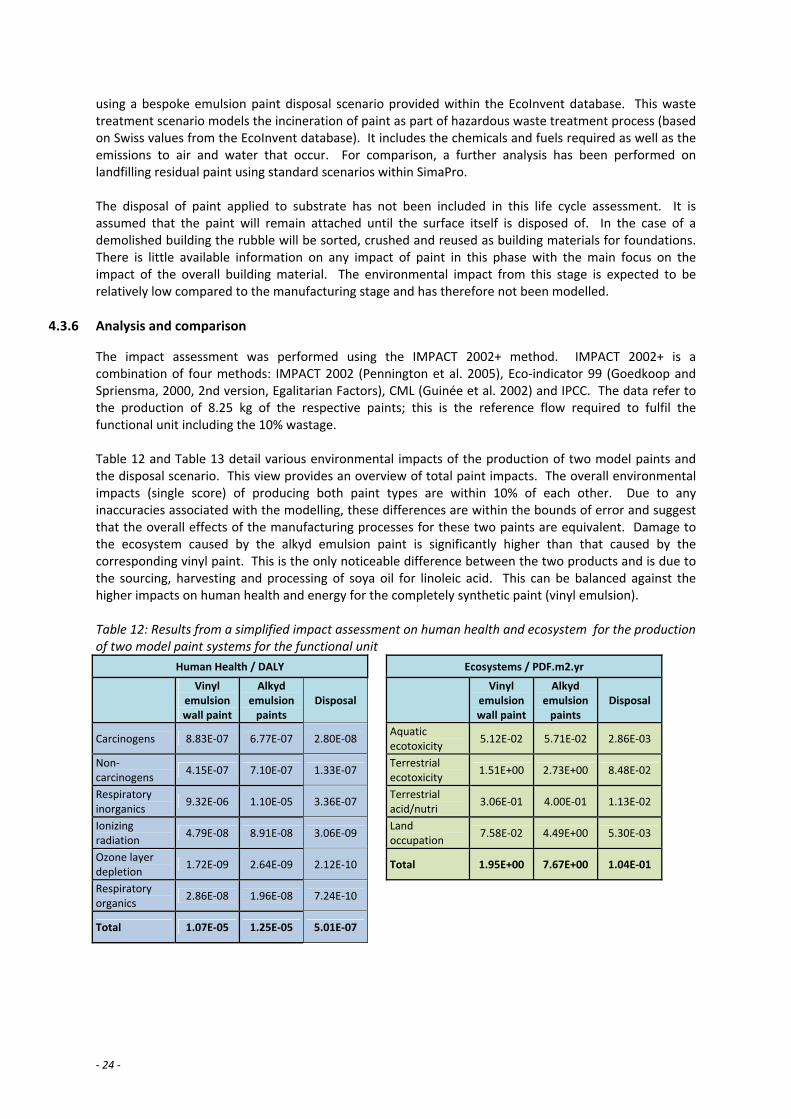
The impact assessment was performed using the IMPACT 2002+ method. IMPACT 2002+ is a combination of four methods: IMPACT 2002 (Pennington et al. 2005), Eco‐indicator 99 (Goedkoop and Spriensma, 2000, 2nd version, Egalitarian Factors), CML (Guinée et al. 2002) and IPCC. The data refer to the production of 8.25 kg of the respective paints; this is the reference flow required to fulfil the functional unit including the 10% wastage. Table 12 and Table 13 detail various environmental impacts of the production of two model paints and the disposal scenario. This view provides an overview of total paint impacts. The overall environmental impacts (single score) of producing both paint types are within 10% of each other. Due to any inaccuracies associated with the modelling, these differences are within the bounds of error and suggest that the overall effects of the manufacturing processes for these two paints are equivalent. Damage to the ecosystem caused by the alkyd emulsion paint is significantly higher than that caused by the corresponding vinyl paint. This is the only noticeable difference between the two products and is due to the sourcing, harvesting and processing of soya oil for linoleic acid. This can be balanced against the higher impacts on human health and energy for the completely synthetic paint (vinyl emulsion). Table 12: Results from a simplified impact assessment on human health and ecosystem for the production of two model paint systems for the functional unit
Human Health / DALY Ecosystems / PDF.m2.yr
Vinyl
emulsion wall paint
Alkyd emulsion paints
Disposal Vinyl
emulsion wall paint
Alkyd emulsion paints
Disposal
Carcinogens 8.83E‐07 6.77E‐07 2.80E‐08 Aquatic
ecotoxicity 5.12E‐02 5.71E‐02 2.86E‐03
Non‐carcinogens
4.15E‐07 7.10E‐07 1.33E‐07 Terrestrial
ecotoxicity 1.51E+00 2.73E+00 8.48E‐02
Respiratory inorganics
9.32E‐06 1.10E‐05 3.36E‐07 Terrestrial
acid/nutri 3.06E‐01 4.00E‐01 1.13E‐02
Ionizing radiation
4.79E‐08 8.91E‐08 3.06E‐09 Land
occupation 7.58E‐02 4.49E+00 5.30E‐03
Ozone layer depletion
1.72E‐09 2.64E‐09 2.12E‐10
Total 1.95E+00 7.67E+00 1.04E‐01
Respiratory organics
2.86E‐08 1.96E‐08 7.24E‐10
Total 1.07E‐05 1.25E‐05 5.01E‐07

‐ 25 ‐
Table 13: Results from a simplified impact assessment of resource consumption and single score for the production and disposal of two model paint system for the functional unit
Resources / MJ Primary Single Score / Pt
Vinyl
emulsion wall paint
Alkyd emulsion paints
Disposal Vinyl
emulsion wall paint
Alkyd emulsion paints
Disposal
Non‐renewable energy
4.26E+02 4.06E+02 1.64E+01 Human Health 1.51E‐03 1.76E‐03 7.07E‐05
Mineral extraction
2.66E‐01 3.47E‐01 8.78E‐03 Ecosystem quality
1.42E‐04 5.60E‐04 7.62E‐06
Total 4.26E+02 4.07E+02 1.64E+01 Climate change 2.02E‐03 1.93E‐03 1.89E‐04
Resources 2.80E‐03 2.67E‐03 1.08E‐04
Total 6.47E‐03 6.92E‐03
The carbon footprint of these two paints was 20.0 and 19.1 kg CO2e per functional unit of paint for the vinyl emulsion and alkyd emulsion respectively. This compares favourably to the results presented by dcarbon839 for their carbon footprint of a Jontun Paints product that had a carbon footprint of 21.9 kgCO2e given the same assumptions on the functional unit. The carbon footprint of the disposal of 750 g of paints remains was 2.5 kgCO2e. A more in‐depth analysis of the environmental impacts from production of the individual components enables the identification of ‘hotspots’ in the production of the paints and ensures that the developed criteria for the EU Ecolabel appropriately addresses these issues. Table 14 provides a breakdown of the environmental impact of manufacturing the major constituents of the paint and the hotspots associated with disposal. Table 14: The major environmental impacts of the components of a model vinyl and alkyd emulsion over the functional unit
Single Score (Pt x10‐4)
Human Health (DALY x10‐6)
Ecosystem (PDF x10‐1)
Global warming (Kg CO2e)
Vinyl emulsion
Butyl acylate 17.1 2.5 4.4 4.8
Methyl methacrylate 17.8 2.8 1.1 5.7
TiO2 (Cl process) 6.8 1.2 2.6 2.0
TiO2 (SO4 process) 8.0 2.0 2.3 2.3
Plant energy 12.9 1.8 7.6 4.7
Alkyd emulsion
TiO2 (SO4 process) 16.6 4.1 4.7 4.8
TiO2 (Cl process) 14.4 2.5 5.4 4.1
Penta erythritol 8.2 1.1 TRACE 2.1
Phthalic anhydride 7.3 1.1 TRACE 1.7
Soya oil (linoleic acid) 8.2 1.5 52.0 1.3
Plant energy 12.9 1.8 7.6 4.7
Disposal (Incineration)
Light fuel oil, burnt 0.5 0.018 0.057 0.08
Sodium hydroxide 0.033 0.005 0.014 0.02 (Key: red = high, orange = medium, green = low)
Based on the data provided above, the three biggest contributors to the environmental impact of paint are: binders, TiO2 pigment and paint plant energy in production/formulation. This mirrors the evidence
39 Jotun Paints – Product Life Cycle Assessment, dcarbon8, 2007

‐ 26 ‐
provided by the LCAs review in section 4.1. About one quarter of the overall environmental impact of the paint is from the paint manufacturer (operating formulation plant), while the remaining 75% of the impact is within the paint manufacturer’s supply chain. A reduction in the amount of TiO2 used could produce a significant reduction in the environmental impact of the paint. The environmental impact of TiO2 production was modelled based on a 50:50 mix of material produced via the sulphate process and chloride process. As can be seen from the breakdown of the emissions from these two manufacturing routes, the environmental impacts are similar, with the sulphate route being slightly more environmentally damaging than the corresponding chloride route. Based on this analysis there is an argument that the EU Ecolabel could encourage more use of chloride‐derived TiO2. The formulation of the vinyl paint uses a calcium carbonate filler in place of some of the TiO2. This has reduced the impact of this paint meaning the contribution to the overall impact from TiO2 is roughly half that of the corresponding alkyd paint. As a major constituent of paint, binders have a significant contribution to the overall impact. The most noticeable difference between the binders modelled here is that linoleic acid production increases the environmental damage to the ecosystem has at least ten times more than any other binders, as a consequence of the crop growth and agricultural activities. This is important to note if further discussions occur on the use of naturally derived materials for the use in paints. The whole life cycle of paint should be examined to determine if bio‐derived products give the intended environmental saving. A wide variety of binders is used, producing a range of properties that can be tailored to suit the performance needs of the paint. Binders include:
alkyds
cellulose
bitumens
epoxies
acrylics
vinyls
polyurethanes. Where possible, limiting the use of binders would reduce the overall environmental impact of the paint (assuming a similar performance can be achieved). Where a choice of binders could be used, it is conceivable that a requirement could be set within the EU Ecolabel to use those which are less environmentally damaging. However, due to the wide variety of properties and uses dictated by the choice of binder, analysis on a case‐by‐case basis would be necessary to determine the most appropriate binder. This data does not exist and any research would only be valid for that particular application. With additional primary research, it would be possible to rank the environmental performance of all binder systems, but prescribing the binders used would be impractical within the EU Ecolabel criteria because of the requirement for particular properties in the final product. Some aspects of the environmental damage of the binder can be assessed. The hazardous nature of some of the binders and, in particular, some of the binder precursors is addressed through the Hazardous Materials criteria. An additional reduction in the environmental impact of the binders could be addressed through carbon footprinting data. This is discussed within Part II of the report. The impacts associated with disposal via incineration of any remaining paint are low compared to the impact of production. This analysis is sensitive to the amount of wasted paint. Disposal via incineration has approximately a 50 times higher impact than that through landfill. This is largely due to the impact of burning fossil fuels in the incineration process. Therefore the figures presented above can be considered to be the worst case scenario, and any mix of landfilling and incineration will have a lower overall environmental effect on the disposal of residual paint.
‐ 27 ‐
Little additional information can be derived about the environmental impact of the processing and transport. Although a significant impact within both models, the data are based on information from a generic chemical manufacturing plant. Further investigation is warranted because it could be an impact factor in the environmental impact of paint manufacture. Examining the unit processes for the four main environmental impacts does not reveal further insight beyond the ‘top level’ data provided within Table 14. The complete flow diagrams are included in Appendix 2.
4.4 Assessment of the impact of paint in use
4.4.1 Paint application and durability
Conclusions from the LCAs reviewed in section 4.1 denote that the amount of paint used and the lifetime of the paint are important when considering their environmental impact. Within the confines of this project, information on the relative performance of a range of paints was not sufficient to allow integration with the LCA described in section 4.3, therefore the usage and lifetime of the paints was assumed to be equivalent. However, this approximation brings uncertainty to the assessment of the overall life cycle environmental impacts of the paint. In order to overcome this limitation and to get an indication regarding the environmental significance of this aspect a preliminary investigation was undertaken. A performance of paint can be investigated based on the following:
1. The overall amount that is necessary to use for painting a certain surface (and reach a predefined painting quality) and
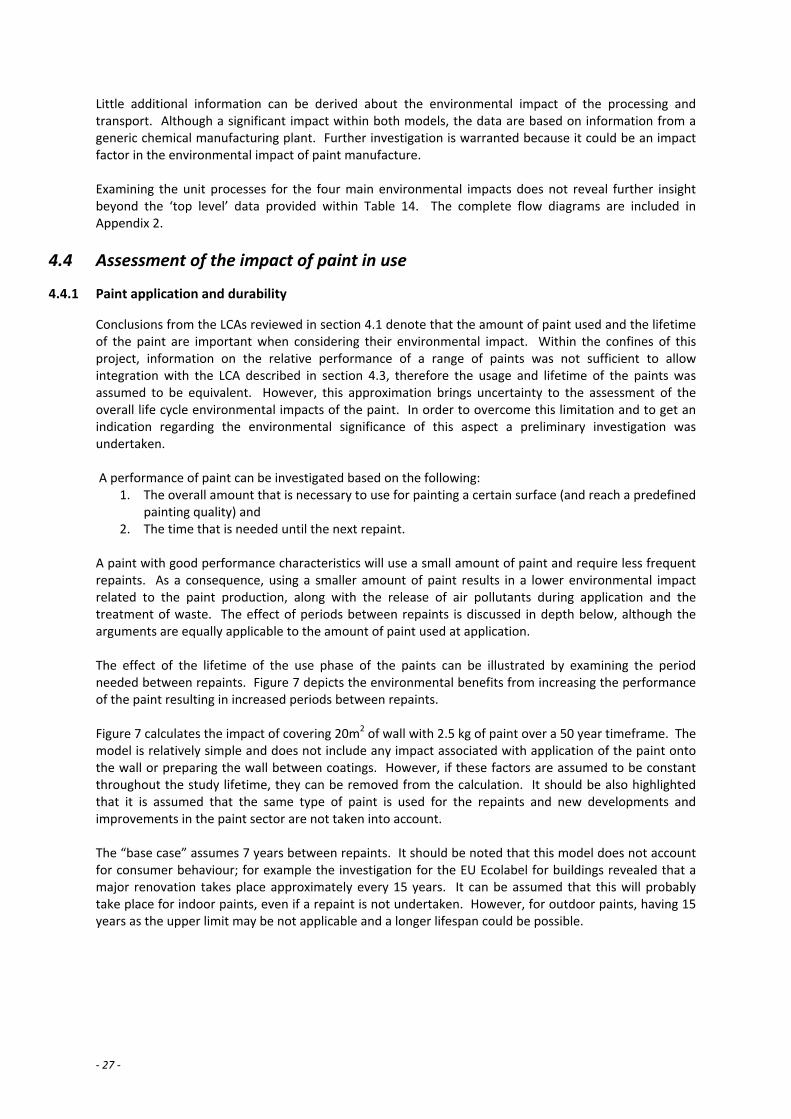
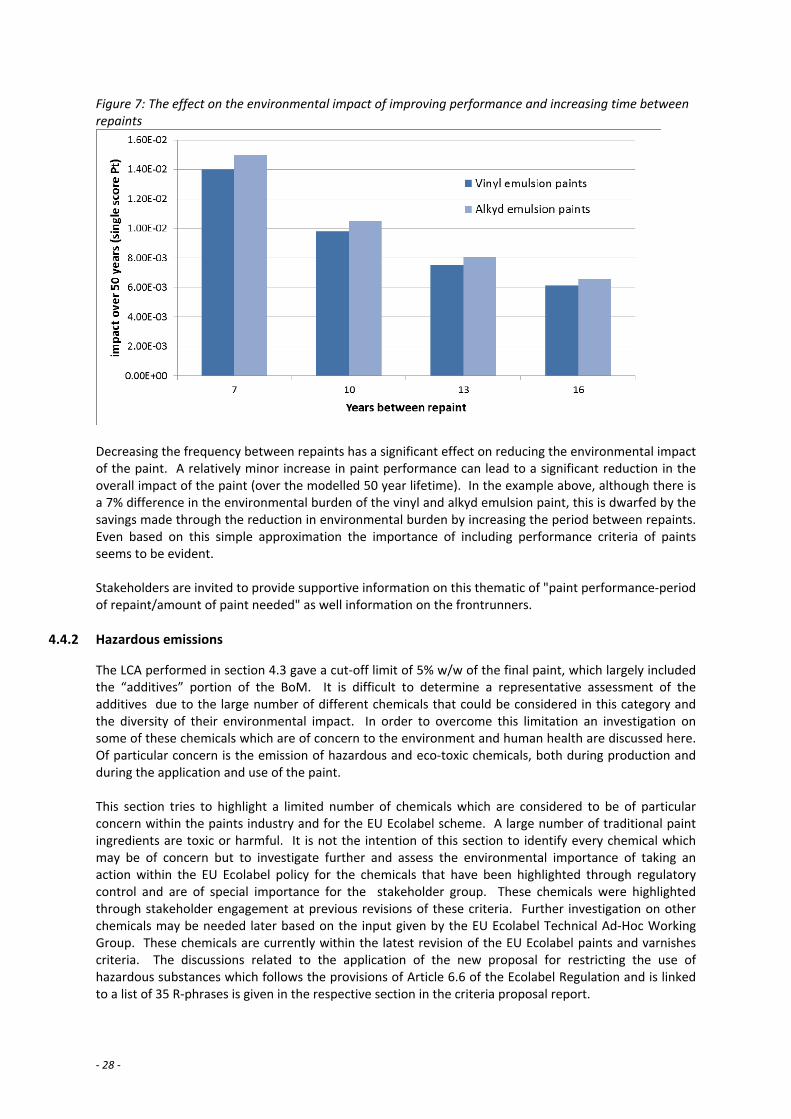
2. The time that is needed until the next repaint. A paint with good performance characteristics will use a small amount of paint and require less frequent repaints. As a consequence, using a smaller amount of paint results in a lower environmental impact related to the paint production, along with the release of air pollutants during application and the treatment of waste. The effect of periods between repaints is discussed in depth below, although the arguments are equally applicable to the amount of paint used at application. The effect of the lifetime of the use phase of the paints can be illustrated by examining the period needed between repaints. Figure 7 depicts the environmental benefits from increasing the performance of the paint resulting in increased periods between repaints. Figure 7 calculates the impact of covering 20m2 of wall with 2.5 kg of paint over a 50 year timeframe. The model is relatively simple and does not include any impact associated with application of the paint onto the wall or preparing the wall between coatings. However, if these factors are assumed to be constant throughout the study lifetime, they can be removed from the calculation. It should be also highlighted that it is assumed that the same type of paint is used for the repaints and new developments and improvements in the paint sector are not taken into account. The “base case” assumes 7 years between repaints. It should be noted that this model does not account for consumer behaviour; for example the investigation for the EU Ecolabel for buildings revealed that a major renovation takes place approximately every 15 years. It can be assumed that this will probably take place for indoor paints, even if a repaint is not undertaken. However, for outdoor paints, having 15 years as the upper limit may be not applicable and a longer lifespan could be possible.
‐ 28 ‐
Figure 7: The effect on the environmental impact of improving performance and increasing time between repaints
Decreasing the frequency between repaints has a significant effect on reducing the environmental impact of the paint. A relatively minor increase in paint performance can lead to a significant reduction in the overall impact of the paint (over the modelled 50 year lifetime). In the example above, although there is a 7% difference in the environmental burden of the vinyl and alkyd emulsion paint, this is dwarfed by the savings made through the reduction in environmental burden by increasing the period between repaints. Even based on this simple approximation the importance of including performance criteria of paints seems to be evident. Stakeholders are invited to provide supportive information on this thematic of "paint performance‐period of repaint/amount of paint needed" as well information on the frontrunners.
4.4.2 Hazardous emissions
The LCA performed in section 4.3 gave a cut‐off limit of 5% w/w of the final paint, which largely included the “additives” portion of the BoM. It is difficult to determine a representative assessment of the additives due to the large number of different chemicals that could be considered in this category and the diversity of their environmental impact. In order to overcome this limitation an investigation on some of these chemicals which are of concern to the environment and human health are discussed here. Of particular concern is the emission of hazardous and eco‐toxic chemicals, both during production and during the application and use of the paint. This section tries to highlight a limited number of chemicals which are considered to be of particular concern within the paints industry and for the EU Ecolabel scheme. A large number of traditional paint ingredients are toxic or harmful. It is not the intention of this section to identify every chemical which may be of concern but to investigate further and assess the environmental importance of taking an action within the EU Ecolabel policy for the chemicals that have been highlighted through regulatory control and are of special importance for the stakeholder group. These chemicals were highlighted through stakeholder engagement at previous revisions of these criteria. Further investigation on other chemicals may be needed later based on the input given by the EU Ecolabel Technical Ad‐Hoc Working Group. These chemicals are currently within the latest revision of the EU Ecolabel paints and varnishes criteria. The discussions related to the application of the new proposal for restricting the use of hazardous substances which follows the provisions of Article 6.6 of the Ecolabel Regulation and is linked to a list of 35 R‐phrases is given in the respective section in the criteria proposal report.

‐ 29 ‐
The concern for these chemicals is centred on their emission and associated impacts in the paint’s use phase rather than on their production. Inventory data on the rate of emission of these chemicals from paints is not available and would require further fundamental experiments into their release, which is beyond the scope of this project. Also, it is not possible to quantify the amount of each chemical within the paint because their amounts vary between paints. Stakeholders are asked to provide relevant information on this aspect. One way to assess the risk of these chemicals is to determine their impact based on the release of a standard amount into the environment. Table 15 models the environmental impact of a release of 50 g these chemicals into the environment. This is equivalent to the maximum amount of chemical used in approximately 2 litres of paint over 16 m2 of wall. The data for the impact of these chemicals is based on the Ecoinvent database. Table 15: The effect of releasing 50 g of chemicals highlighted as causing significant environmental impact
Human Health (DALY) Ecosystems (PDF m2 yr) Hazard Component Proxy
via Air via Water via Air via Water
Formaldehyde Formaldehyde 6.40E‐07 2.90E‐09 1.01E‐03 1.64E‐03
Halogenated Organic Solvents Hydrocarbons, halogenated 1.75E‐08 N/A 0.00E+00 N/A
Phthalates Phthalate, dioctyl‐ 8.90E‐07 4.63E‐08 1.14E‐04 2.85E‐02
Metals (including heavy metals) Mercury 5.35E‐05 1.12E‐04 1.52E+03 3.97E+01
Volatile Aromatic Hydrocarbons Aromatic hydrocarbons 4.96E‐04 2.18E‐05 7.20E‐03 4.29E‐01
Volatile Organic solvents Volatile Organic Compounds 3.23E‐08 0.00E+00 0.00E+00 0.00E+00
non‐methane volatile organic compounds
6.40E‐08 0.00E+00 0.00E+00 0.00E+00
VOC as C 6.45E‐08 0.00E+00 0.00E+00 0.00E+00
Isothiazolinone compounds 2‐n‐Octyl‐4‐isothiazolin‐3‐one 0.00E+00 0.00E+00 3.36E‐01 1.18E+00
1,2‐Benzisothiazolin‐3‐one 0.00E+00 0.00E+00 3.43E‐01 4.24E‐02 (Note that alkylphenolethoxylates (APEOs) and perfluorinated alkyl sulfonates (PFAS) are not included in this table because impact factors are not available.)
Each of the identified chemicals has a significant impact on the environment or human health. The values associated with APEOs and PFAS are not available through this analysis and further stakeholder engagement may be needed. The text below qualitatively describes the impact of these chemicals. Alkylphenolethoxylates (APEOs) APEOs are non‐ionic surfactants, which have an emulsifying and dispersing effect when processing paints, and in binders, dispersion aids, thickeners, driers, antifoam agents and pigment pastes.40 APEOs are produced in large volumes, with uses that lead to widespread release to the aquatic environment. They are highly toxic to aquatic organisms, and in the environment degrade to more environmentally persistent compounds. These chemicals have been detected in human breast milk, blood, and urine and are associated with reproductive and developmental effects in rodents.41 Perfluorinated alkyl sulfonates (PFAS) PFAS is the collective name for a group of fluorinated surfactants. Similar to APEOs, these are used in dispersants, thickeners, driers and pigment pastes. Of particular concern is perfluorooctane sulfonate (PFOS), which has been analysed in a limited number of European environmental and food samples and has been shown to bio‐accumulate in fish. This bio‐accumulation seems to be an important source of human exposure to PFOS.42
40 Paints and how they affect the environment, Tommi Nurmi and Konsta Kanniainen, 2008 41 http://www.epa.gov/oppt/existingchemicals/pubs/actionplans/RIN2070‐ZA09_NP‐NPEs%20Action%20Plan_Final_2010‐08‐09.pdf 42 Perfluorooctane sulfonate (PFOS), perfluorooctanoic acid (PFOA) and their salts, Scientific Opinion of the Panel on Contaminants in the Food chain, European Food Safety Authority, 2008.
‐ 30 ‐
Following absorption, PFOS is slowly eliminated and therefore accumulates in the body. PFOS shows moderate acute toxicity. In sub‐acute and chronic studies the liver was the major target organ and developmental toxicity was also seen. Other sensitive effects were changes in thyroid hormones.43 Formaldehyde Formaldehyde is used as a biocide in water‐based paints (particularly protecting the head‐space within the paint pot). Formaldehyde can cause irritation of the skin, eyes, nose, and throat. High levels of exposure may cause some types of cancers; for example, some studies of people exposed to formaldehyde in the workplace found more cases of cancer of the nose and throat than expected. In animal studies, rats exposed to high levels of formaldehyde in air developed nose cancer.44 Formaldehyde is often used as proxy, a reference indicator for other similar chemical structure substances which are not covered in the life cycle impact assessment models (no characterisation factor determined). Halogenated organic solvents A halogenated solvent is an organic solvent, molecules of which contain halogens: chlorine (Cl), fluorine (F) , bromine (Br) or iodine (I).45 They can be found in the paint industry in thinners, strippers and solvents. They are used as they are largely non‐flammable, though if they do combust they can produce toxic gases. Risk to health from using halogenated organic solvents in paint includes dermatitis and eye irritation. More serious exposure via vapours or high levels of the solvents can lead to kidney and liver damage, heart irregularities, and they are potentially carcinogenic.46 Phthalates Phthalates are commonly found in PVC where they are used as plasticisers, giving the plastic desired physical properties. They can be also used in paints to alter the overall finish of the paint. Several phthalates have been shown to be endocrine inhibitors; this can cause cancerous tumours, birth defects, and other developmental disorders. Some phthalates are in the candidate list to be classified as Substances of Very High Concern (SVHC) and, based on Article 6.7 of the Ecolabel Regulation, should be excluded from EU Ecolabel products. There is some guidance provided by the EU that certain phthalates, in particular di‐isononyl phthalate (DINP) and di‐isodecyl phthalate (DIDP) have no associated health risks.47 The determination of the health risks associated with phthalates relates mainly to plastic products rather than paints. Therefore decisive conclusions on the effect and exposure to phthalates within paints cannot be drawn. Heavy metals In large quantities, heavy metals are considered carcinogenic and hazardous to human health.48 Although present in the environment, and necessary for human health in small amounts, any large concentration can cause acute or chronic toxicity.49 As they are elements, they cannot be broken down and therefore will persist in the environment.50 When absorbed by humans, they have been shown to have detrimental effects on kidney function, reproductive organs and the nervous system, particularly in unborn infants and young children. The use of some of these metals is now subject to regulation from REACH which came into effect on 1 June 2007.51
Cadmium: Cadmium is used as a colourant in paint pigment52 and levels are controlled by EU regulations except in the use of certain items coloured for safety reasons.53 Paint that contains a
43 Perfluorooctane sulfonate (PFOS), perfluorooctanoic acid (PFOA) and their salts, Scientific Opinion of the Panel on Contaminants in the Food chain, European Food Safety Authority, 2008. 44 http://www.atsdr.cdc.gov/tfacts111.pdf 45 Dr. Dmitri Kopeliovich, Classification of Solvents, http://www.substech.com/dokuwiki/doku.php?id=classification_of_solvents 46 http://www.psfc.mit.edu/esh/halosolv.html 47 OJ C90/5 13.4.2006 (http://www.didp‐facts.com/upload/documents/document8.pdf) 48 http://www.apis.ac.uk/overview/pollutants/overview_HM.htm 49 http://www.lef.org/protocols/prtcl‐156.shtml 50 http://www.apis.ac.uk/overview/pollutants/overview_HM.htm 51 http://www.hse.gov.uk/foi/internalops/fod/oc/200‐299/253‐11.htm 52 HSE, web leaflet INDG391(rev1), revised 03/10 53 http://eur‐lex.europa.eu/LexUriServ/site/en/oj/2007/l_136/l_13620070529en00030280.pdf
‐ 31 ‐
level of cadmium (as a pigment) higher than 0.01% by mass is prohibited. If the paint contains a high level of zinc, the residual concentration of cadmium must be as low as possible, in any case not higher than 0.1% by mass.54
Lead: Lead‐based paints were banned for sale for use by the general public in the EU in 199255, although some specialist uses for industry and the military are still permitted. Lead had originally been used in paint as a pigment and drying agent. White lead was predominantly used as the white pigment in primer type paints. The lead‐based pigments (lead tetroxide/calcium plumbate, or "red lead") were used as an anti‐corrosive primer agent in paint used on metal56. Nowadays the exposure to, or removal of, old leaded paint can still present a hazard to human health.
Chromium VI: This is a group of compounds which has a low (acid) or neutral pH. Zinc, lead and calcium chromates form the most important compounds in the group. Calcium chromates are rarely used in paints nowadays. Zinc chromates are often used in primer paints as they have high anti‐corrosive properties.57 Lead chromates are used in topcoat paints and occasionally in primer paints.58 CrII is an unstable compound and therefore little used in paint. CrIII is used in paints as a green pigment or as a protective coatings on metals (anti‐corrosive). It may cause some respiratory difficulties or skin reactions but is not considered highly harmful.
Mercury: In the past, phenyl mercuric acetate was commonly used as a fungicide in water‐based latex paints, to prevent the growth of bacteria.59 Its use in paint was banned in the USA in 1991.60 In the UK, paint companies have voluntarily removed mercury from paints, though its use is still legal.
Arsenic: Arsenic is well known for its poisonous properties. It is not used in paint production today, although traces may rarely still be found in green paint pigment, particularly on artists’ frescoes or canvases.
Barium: Synthetic barium sulphate is used as a filler in the paint and varnish industry and can also be an element in white pigment. Its inertness and high density qualities make it useful to improve the consistency and handling properties of paint.61
Selenium: Selenium is normally extracted as a by‐product of copper production.62 One of the main applications for selenium is for pigmentation in glass manufacture to colour and decolourise glass, and also in paint, which comprises approximately 40% of the selenium demand. It is used in the photovoltaic industry and demand is therefore predicted to rise in the future.63
Antimony: This metal is found in paint pigments, as well as in batteries, ceramics and glass.64 It was initially used by make‐up artists for black face paint, known as ‘kohl’. Nowadays it is valued in paint for its flame‐retardant properties.65
Volatile aromatic hydrocarbons (VAHs) VAHs include compounds such as benzene, toluene and benzaldehyde, and are used as solvents in paints. They can have severe effects on the human body and the environment including having a effect on the reproductive system and carcinogenic.
54 www.cbi.eu/?pag=85&doc=416&typ=mid_document 55 Marketing and Use Directive (89/677/EEC) through the Environmental Protection (Controls on Injurious Substances) Regulations 1992 (Statutory Instrument 1992/31) 56 http://www.rsc.org/chemistryworld/News/2007/August/21080701.asp 57 HSE Information Sheets: Chromate Primer Paints, engineering sheet number 32 58 HSE Information Sheets: Chromate Primer Paints, engineering sheet number 32 59 UNECE, www.unece.org/.../TFHMs_3.ProductsReviewChapter.draft.05.04.06 60 http://www.epa.gov/hg/consumer.htm#pai 61 http://www.nanopartikel.info/cms/Wissensbasis/Bariumsulfat 62 http://www.mmta.co.uk/metals/Se/ 63 Minor Metals Trade Association, Selenium 64 http://www.lenntech.com/processes/heavy/heavy‐metals/heavy‐metals.htm 65 Minor Metals Trade Association, Antimony

‐ 32 ‐
Volatile organic solvents (VOCs) VOCs are used as solvents within paints to help keep them stable prior to use and to aid in spreading and delivery of the paint to the substrate. VOCs encompass a wide variety of compounds and are generally classed as organic substances with a boiling point less than 250°C.66 VOCs generally evaporate or sublimate from the paint during and after application. The release of these emissions can cause eye, nose, and throat irritation along with headaches and loss of co‐ordination. There is a diversity of compounds encompassed by this classification, and more extreme reactions can also present, in particular: damage to liver, kidney, and central nervous system and some are suspected or known to cause cancer in humans.67 Isothiazolinone compounds Isothiazolinone compounds are found in wood coatings68 and in some paint formulations. They are a broad spectrum fungicide, algicide and bacteriostat used in solvent‐based coatings, surface protection products and other xylene‐compatible products.69 For people susceptible to their effects, the compounds can cause irritation to the skin and mucous membranes.70 The extent to which they do this depends greatly on the level of concentration in the product used and the method of exposure – long‐term oral exposure being particularly hazardous.71
4.5 Assessment of the impact of paint at end of life
The environmental impacts associated in the end‐of‐life phase of the paint, as modelled in the streamlined assessment (section 4.3.6), is low compared to impacts in the production and manufacturing phase. This end‐of‐life phase, however, only models the impacts related to the processes involved in the incineration of the paint (and their associated environmental impacts). The environmental impacts associated with the production of the paint residuals are not expressly incorporated within the end‐of‐life phase of the current model (they are incorporated, but not highlighted, within the production phase). The unused paint has a significant environmental impact and it is therefore important to further investigate (including the impact of production). As mentioned above, there is significant debate over the average amount of paint wasted during application, with the current streamlined assessment assuming a conservative 10% level of wastage. A recent study72, based on relatively old data, highlights the problem of unused paint in the UK. In the domestic market, an estimated 25% of all paint goes unused, whereas wastage in trade use is 1.5%. Scaling up to Europe, this equates to approximately 900,000 tonnes of unused paint wasted every year, suggesting that approximately 12% of the environmental burden of paint is from wasted paint. Variations in wastage lead to significant differences in the overall environmental impact of the paints. Figure 8 indicates the effect of different amounts of unused paint based on painting 20 m2 of wall with 2.5 kg of paint (assumes that 1 litre of paint will cover 8m2 of wall based on a density of 1g per cm3). In simple terms, the relationship between the amount of paint used and the environmental impact of the paint can be considered to be inversely proportional, therefore the more paint unused the higher the environmental impact of painting a set area.
66 Directive 2004/42/CE 67 http://www.epa.gov/iaq/voc.html 68 Revision of European Ecolabel and Development of Green Public Procurement Criteria for Indoor and Outdoor Paints and Varnishes, October 2011 69 Akcros Chemicals, http://www.akcros.com/products/europeproductrange/productsbycategory/microbiocides.aspx 70 Consumer exposure to biocides ‐ identification of relevant sources and evaluation of possible health effects, Stefan Hahn, February 2010 71 Consumer exposure to biocides ‐ identification of relevant sources and evaluation of possible health effects, Stefan Hahn, February 2010 72 Paint and woodcare products ‐ distribution and delivery, WRAP, 2011

‐ 33 ‐
Figure 8: The effect of unused paint on the environmental impact of painting 20 m2
A reduction in the amount of unused paint can have significant environmental savings. A 5% reduction in the amount of unused paint has a similar environmental impact to reducing the amount of TiO2 used by approximately 25% (based on data provided in section 4.3.6). Any reduction in the amount of unused paint would have a significant reduction on the environmental impact of the paint and paint industry. Possible methods to achieve this reduction include:
The sale of appropriate quantities of paint using different sized tins or bespoke dosing systems or correctly conveying the amount of paint required by the user to prevent over‐ordering.
Where paint is not needed, the appropriate reuse (where possible) will also reduce the environmental impact.
Take‐back schemes are available (usually run by the charitable sector) that could limit wasted paint. The development of take‐back schemes for paints has also seen a recent increase. Crown Paints, for example, is the UK’s largest independent decorative paint manufacturers and has recently promoted a scheme which allows trade customers to return used Crown paint cans to store when they purchase new paint. A ‘can‐back’ scheme has also been piloted where used paint containers are collected at Crown retailers and either reused or recycled back into the supply chain for the production of new paint containers. The process of granulating and recycling used plastic paint containers is also being introduced on a larger scale by Crown paints. The company also set a ‘Zero waste to landfill by 2012’ target by recycling waste generated through manufacture.73 A variety of other companies also run schemes through which unwanted paint can be returned to the supplier. For example, Paint +, which operates across the UK, takes back unused paint free of charge to be sold or donated.74 There are also a number of charitable organizations who collect unwanted paint and use it in community projects.75 Further schemes operate overseas, for example CalRecycle operates a paint reuse facility in California.76 An additional problem is that waste paint can be considered a hazardous material and therefore disposal should be appropriately controlled.
73 Crown Paints, Crown Paints Launches Carbon Revolution at Ecobuild, 2011. Available at: http://www.crowntrade.co.uk/LatestNews/LatestNewsStories/Pages/CrownPaintsLaunchesCarbonRevolutionatEcobuild.aspx 74 Paint +, Returned paint pur to good use. Available at: http://www.paintplusuk.com/104/returned‐paint‐put‐to‐good‐use/ 75 Community RePaint. Available at: http://www.communityrepaint.org.uk/Where_Get_Paint.php 76 http://www.calrecycle.ca.gov/condemo/paint/

‐ 34 ‐
Used paint pots present a recycling challenge as they invariably contain leftover paint inside. It appears that the composition of paint pots (both steel and plastic) enables them to be readily recycled. However, containers are very unlikely to be in a sufficiently clean condition for this to be achieved. In general in the UK, spent paint pots are sent to landfill77 with efforts directed towards the reuse of left over paint rather than the recycling of the pots.78 Recycling of paint pots does appear to be possible in the trade sector but requires specialist equipment and is not suitable for the DIY market.79 The recovery of energy appears to be a favoured route to dispose of paint pots, for example using them as cement kiln furnaces for fuel.80 This has the advantage of eliminating any hazardous substances.
4.6 Nanomaterials
4.6.1 Overview
Nanotechnology is the study and manipulation of materials at the nanometre scale. One nanometre is one billionth of a metre and is the width of approximately ten atoms. At this scale, materials exhibit different properties to larger bulk materials, and this fact is being exploited by researchers to develop new products with new functionalities. There is wide ranging speculation on the potential uses of nanotechnology in areas from cosmetics through to solar cells. The use of nanomaterials within paints appears to be widespread; over 200 surface coatings and paints are registered on nanotech‐data website which compiles products using nanomaterials.81 Indeed, due to the relative ambiguity over the term ‘nanomaterial’, many paints are likely to contain nanomaterials without being overtly marketed as such (or even with the knowledge of the paint manufacturer). This is particularly of relevance for TiO2, silica, carbon black, alumina and paint pigments that usually contain particles at the nanoscale.82 The use of nanoparticles and other nanomaterials offers potential performance enhancements in a wide variety of consumer products. Nanoparticles within the paint sector are beginning to make an impact in several areas including increasing drying rate, dirt resistance, better humidity tolerance and water resistivity.83 The use of nanoparticles of silver as a biocide and antibacterial agent is seen as a particular application of interest in paints.
4.6.2 Potential issues
The main concerns with nanomaterials are that the properties are related to size and that current health and environmental exposure testing regimes (in particular REACH and CLP) are not sufficient to appropriately test these materials. As a result benign materials on the bulk scale could have adverse toxicological effects on the nanoscale. Also, variation in size at the nanoscale can change the severity and type of toxicological effect. Research is on‐going into the effects of nanomaterials on the environment and human health. Guidance documents are being developed for REACH84, with some recent work on exposure85, but little work assessing the impact of nanomaterials has been undertaken using this guidance. Indeed reporting under REACH varies from applicant to applicant and also on if the compounds
77 http://www.thisisgloucestershire.co.uk/ways‐recycling‐paint‐tins‐users‐urge/story‐11893909‐detail/story.html 78 http://www.recyclenow.com/what_can_i_do_today/can_it_be_recycled/liquids_and_chemicals/paint.html 79 http://www.hankinson.co.uk/news/hankinson‐recycling‐centre/ 80http://www.leics.gov.uk/index/environment/waste/recycling_sites_and_permits/recycling_household_waste_sites/recycling_information.htm 81 http://www.nanodaten.de/index2.php?lang=en&pID=1 82 Les Nanomatériaux: Sécurité au travail, Afsset, July 2008. 83 http://www.docstoc.com/docs/26408859/NANOMATERIALS‐FOR‐PAINTS‐AND‐COATINGS‐IN 84 http://ec.europa.eu/enterprise/sectors/chemicals/reach/nanomaterials/index_en.htm 85 http://www.safenano.org/KnowledgeBase/CurrentAwareness/ArticleView/tabid/168/ArticleId/204/ECHA‐forwards‐Draft‐Guidance‐Concerning‐Nanomaterials‐under‐REACH‐to‐CARACAL.aspx

‐ 35 ‐
are technically nanotechnology.86 To summarise, nanomaterials may have a toxicological effect; this effect varies depending on size and research is on‐going to determine these effects. To address the issue of exposure, some research into the effect of sanding nanomaterial‐containing paint has been performed.87 The work concluded that no additional nanomaterials were detected compared to conventional paint. A reason given was that the nanomaterial was encased within the binder’s polymer matrix and therefore largely inert.88 However, a different study investigated the release of metallic silver nanoparticles from paint.89 Leaching of the silver nanoparticles was observed with more than 30% of the available silver having leached from the paint into the environment in less than one year. There was ambiguity over the effect of this leaching. It was suggested that the nanoparticles would have reacted in the environment to a considerably less toxic compounds. This is important because silver ions are seen as the toxic compounds from silver nanoparticles.90 A potentially larger problem for paints and varnishes is that a Swiss study identified that nanoparticles of TiO2 could exceed minimum “no‐effect” concentrations.91 Their wide use in light coloured paints means that many different formulations could be affected. Adverse effects of the nanomaterials were not investigated. The risk associated with the inclusion of nanoparticles within paints need careful assessment. There is some evidence of an inherent health risk posed by exposure to nanoparticles92; however, these possible risks must be balanced against the performance gains from the use of such materials. For example, there have been reports where the inclusion of certain nanomaterials has resulted in the performance of water‐based paints to match those of traditionally ‘better’ solvent‐based alternatives, thus reducing the exposure to solvents during application of the paint.93 In a second example, the use of silver nanoparticles could reduce the need for using biocides such as isothiazoline compounds, which are shown to be damaging to health and the environment.94
4.6.3 EU Ecolabel and legislative framework
The current REACH Regulation, including information requirements, does not contain any specific provisions related to nanomaterials. However, the REACH Competent Authority95 has stated that REACH provisions apply to nanomaterials and should not be treated any differently than any other chemical. As a result, manufactured nanomaterials will be expected to undergo similar testing regimes to those mandated by conventional materials. Therefore, assuming that they do not have prohibited risk phrases, they will be suitable for use within EU Ecolabelled paints and varnishes. This viewpoint is likely to strengthen over time and should therefore be reflected within the EU Ecolabel criteria. In addition to the EU examining the use of nanomaterials in products, work is underway to examine the legislative framework for controlling and appropriately disposing of nanomaterials at the end of life. A recent study96 examining the legislative framework for controlling nanomaterial release stated that limitations in both exposure and hazard data for specific nanomaterials make it difficult to assess the
86 NANO SUPPORT Project Scientific technical support on assessment of nanomaterials REACH registration dossiers and adequacy of available information, Final report JRC, 2012. 87 “Comparison of dust released from sanding conventional and nanoparticle‐doped wall and wood coatings”, Journal of Exposure Science and Environmental Epidemiology (2011) 21, 408–418. 88 Gaborieay, A, .Release‐ability of nano‐fillers from paints, NanoSafe2010, 15‐17 November 2010, 89 Kaegi R, Sinnet B, Zuleeg S, Hagendorfer H, Mueller E, Vonbank R, Boller M, Burkhardt M. “Release of silver nanoparticles from outdoor facades” Environ Pollut. 2010;158(9):2900‐5. 90 Wijnhoven S.W.P., Peijnenburg W.J.G.M., Herberts C.A., Hagens W.I., Oomen A.G., Heugens E.H.W., Roszek B., Bisschops J., Gosens I., Van De Meent D., Dekkers S., De Jong W. H., van Zijverden M., Sips A.J.A.M. and Geertsma R.E. “Nano‐silver – a review of available data and knowledge gaps in human and environmental risk assessment” Nanotoxicology, 2009, Vol. 3, No. 2 , Pages 109‐138 91 Mueller N.C. and Nowack B., “Exposure Modelling of Engineered Nanoparticles in the Environment”, Environ. Sci. Technol., 2008, 42 (12), pp 4447–4453 92 SCIENTIFIC COMMITTEE ON EMERGING AND NEWLY IDENTIFIED HEALTH RISKS (SCENIHR),modified Opinion (after public consultation) on “The appropriateness of existing methodologies to assess the potential risks associated with engineered and adventitious products of nanotechnologies”, 2006 93 http://www.empa.ch/plugin/template/empa/*/98022/‐‐‐/l=2 94SpecialChem (2009) “Preservation of Coatings with Silver”; available at http://www.specialchem4coatings.com/resources/articles/article.aspx?id=11343&q=nano‐silver (accessed 28.05.2011) 95 Follow‐up to the 6th Meeting of the REACH Competent Authorities for the implementation of Regulation (EC) 1907/2006 (REACH), CA/59/2008 rev. 1 96 Review of Environmental Legislation for the Regulatory Control of Nanomaterials, Amec, September 2011.
‐ 36 ‐
potential risks of nanomaterials. This lack of understanding of the risks posed by nanomaterials makes it difficult to justify controlling legislative gaps. The study did however, advocate the use of the precautionary principle for the control of nanomaterials. A further study97 suggests that research should focus on the collection of information on waste disposal pathways for nanotechnology. This is to ensure that appropriate controls for nanomaterials are in place to ensure that waste facilities are appropriately protected. A review by DG Environment examined the possibility of developing a framework for an inventory of nano‐enabled products.98 One of the key recommendations was to require producers to declare products that contain nanomaterials. Such a scheme could be implemented within the EU Ecolabel. Recently, the definition of nanomaterials has been resolved by the Commission:99
‘Nanomaterial’ means a natural, incidental or manufactured material containing particles, in an unbound state or as an aggregate or as an agglomerate and where, for 50 % or more of the particles in the number size distribution, one or more external dimensions is in the size range 1 nm‐100 nm.
Three types of nanomaterial are identified:
Natural nanoparticles are produced in biological and other natural systems.
Incidental nanomaterials are nanomaterials that are synthetic are in use but have not been specifically engineered. Usually these nanomaterials are part of large bulk systems and are usually not the intended product. They are also not produced for any particular enhancement to a product.
Manufactured nanomaterials are intentionally made nanomaterials that provide enhanced properties over a conventional material.
Using this definition of nanomaterials, several components of paints and varnishes can be considered as incidental nanomaterial; in particular, pigments have dimensions that are encompassed with this definition. Within the context of the EU Ecolabel, excluding or limiting their use may prohibit a large portion of currently available and Ecolabelled paints from obtaining EU Ecolabel certification. This view is backed by stakeholders. It may be possible within the EU Ecolabel to differentiate between incidental and manufactured nanomaterials. Manufactured nanomaterials could be prohibited (unless accompanied by an appropriate Safety Data Sheet), whereas incidental nanomaterials could be permitted. Uncertainty about health and environmental concerns100 of nanomaterials have led to the Austrian Ecolabel to develop a criterion within their Varnishes and Wood Sealants and Wall Paints criteria on the use of nanomaterials. This uses the Swiss categorisation of risk based on a precautionary approach to the application and use of nanomaterials. In particular, the approach examines the risk of exposure, its chemical activity and its human toxicity; where the latter is not known, the nanomaterial is assumed to be hazardous.101 Where risk is deemed as ‘high’, the nanomaterials are prohibited from the ecolabelled paints. Such a scheme could be implemented within the EU Ecolabel, but is likely to be opposed by industry.
97 BIO Intelligence Service (2011), Study on coherence of waste legislation, Final report for the EU (DG ENV), 2011 98 Development of an inventory for consumer products containing nanomaterials, DG Environment 2010 99 Commission Recommendation of 18 October 2011 On The Definition of Nanomaterial (2011/696/EU) 100 The appropriateness of the risk assessment methodology in accordance with the technical guidance documents for new and existing substances for assessing the risks of nanomaterials, SCENIHR, 2007 101 http://www.nanotechia.org/news/global/swiss‐government‐publishes‐precautionary‐matrix‐f

‐ 37 ‐
4.7 Greenhouse gas emissions and water use
Minimising the impact of climate change by reducing the release of carbon dioxide and other GHGs into the atmosphere is a priority for many countries, as well as for businesses keen to convey the benefits of products to consumers. GHG emissions can be classed as either:
direct GHG emissions ‐ emissions from sources that are owned or controlled by the manufacturer e.g. energy used in manufacture, or
indirect GHG emissions that are a consequence of the activities of the manufacturer, but occur at sources owned or controlled by another supply chain entity e.g. allocation of emissions from processes in which purchased materials.
Measuring the carbon emissions of paint manufacture could be used as a method to control the environmental impact of binders (which account for between one third and half of the environmental impact of the paint). Other EU Ecolabel criteria are examining the possibility of limiting the amount of GHGs that can be released in the manufacture of a product. Several larger paint manufacturers have completed carbon footprint analyses but the practice and the methodology employed to perform such analyses were not uniform. The LCA suggests that the majority of the impact in paint production occurs within the paint’s supply chain, not at the point of formulation. This means that the majority of emissions are produced by the suppliers to the paint manufacturers (the applicants), and controlling or accurately reporting on these emissions is a significant challenge to the applicants, especially for SMEs. Where maximum emissions limits are being set in other EU Ecolabel product groups (for example in the criteria for paper), most of the impacts are associated with emissions by the manufacturer/applicant. Effective lowering of GHG emissions from the production of paint will therefore require the applicant to demand a carbon footprint from each of its suppliers and/or to perform a full carbon footprint based on proxies. Both these solutions are probably impractical and would add an additional cost burden to applicants. Stakeholders largely endorse this viewpoint. Direct emissions (those emitted by the paint manufacturer) are relatively small but could still reduce the environmental burden of paint. Unfortunately industry average data on the formulation of paint are not yet available. Also, due to the wide range of paints, different data sets would be needed. There appear to be many practical constraints to specifying limits to direct emission in this revision.
4.7.1 Water use
The current EU Ecolabel criteria do not address minimising water usage in production. The focus would be on water consumption at the plant rather than the amount of water present within the paint itself. Stakeholders seemed receptive to the idea, but doubted that a threshold could be set or measured. There were concerns that the additional costs associated with data collection would disproportionately impact smaller organisations, particularly those without ISO 14001 (or equivalent EMS). Also, without industry average data across the different types of product, a baseline is lacking against which a comparison and threshold can be set. Unless evidence from stakeholders can provide insight, developing a water use criterion is not considered relevant. The consumption of water is one environmental aspect that is addressed within the paint LCA. Addressing water use separately therefore does not currently seem to be necessary based on the outcomes of technical analysis.
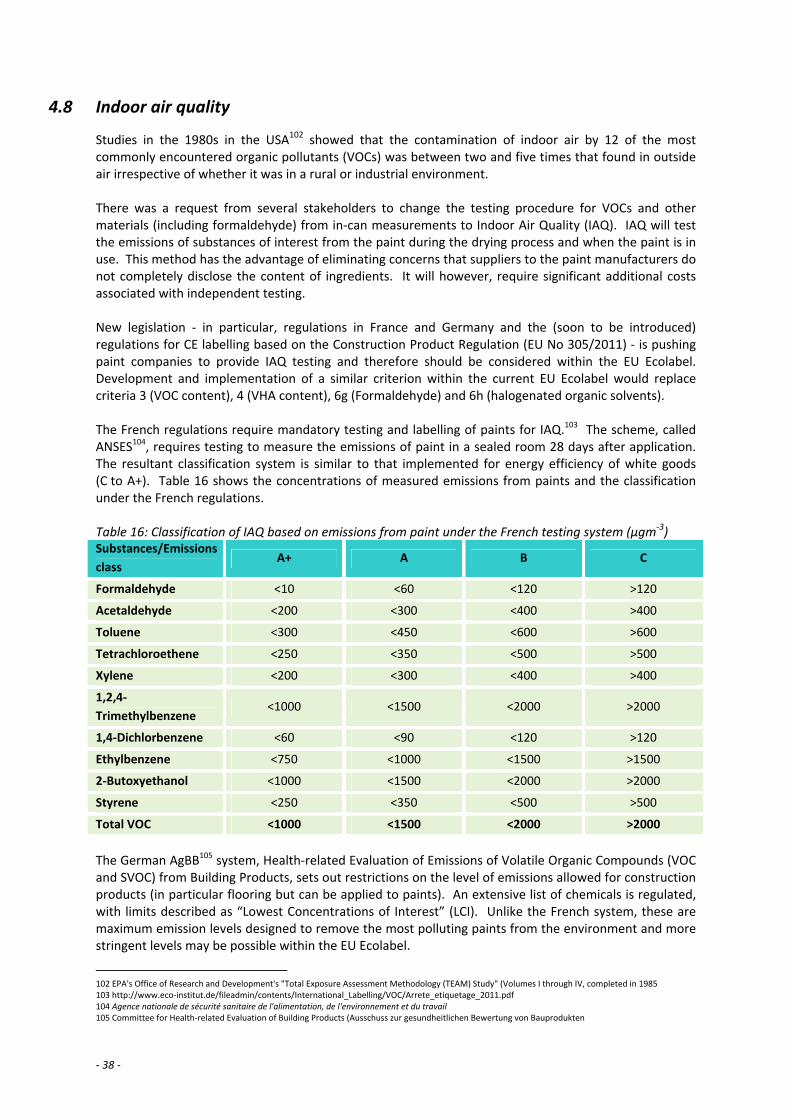
‐ 38 ‐
4.8 Indoor air quality
Studies in the 1980s in the USA102 showed that the contamination of indoor air by 12 of the most commonly encountered organic pollutants (VOCs) was between two and five times that found in outside air irrespective of whether it was in a rural or industrial environment. There was a request from several stakeholders to change the testing procedure for VOCs and other materials (including formaldehyde) from in‐can measurements to Indoor Air Quality (IAQ). IAQ will test the emissions of substances of interest from the paint during the drying process and when the paint is in use. This method has the advantage of eliminating concerns that suppliers to the paint manufacturers do not completely disclose the content of ingredients. It will however, require significant additional costs associated with independent testing. New legislation ‐ in particular, regulations in France and Germany and the (soon to be introduced) regulations for CE labelling based on the Construction Product Regulation (EU No 305/2011) ‐ is pushing paint companies to provide IAQ testing and therefore should be considered within the EU Ecolabel. Development and implementation of a similar criterion within the current EU Ecolabel would replace criteria 3 (VOC content), 4 (VHA content), 6g (Formaldehyde) and 6h (halogenated organic solvents). The French regulations require mandatory testing and labelling of paints for IAQ.103 The scheme, called ANSES104, requires testing to measure the emissions of paint in a sealed room 28 days after application. The resultant classification system is similar to that implemented for energy efficiency of white goods (C to A+). Table 16 shows the concentrations of measured emissions from paints and the classification under the French regulations. Table 16: Classification of IAQ based on emissions from paint under the French testing system (µgm‐3) Substances/Emissions
class A+ A B C
Formaldehyde <10 <60 <120 >120
Acetaldehyde <200 <300 <400 >400
Toluene <300 <450 <600 >600
Tetrachloroethene <250 <350 <500 >500
Xylene <200 <300 <400 >400
1,2,4‐
Trimethylbenzene <1000 <1500 <2000 >2000
1,4‐Dichlorbenzene <60 <90 <120 >120
Ethylbenzene <750 <1000 <1500 >1500
2‐Butoxyethanol <1000 <1500 <2000 >2000
Styrene <250 <350 <500 >500
Total VOC <1000 <1500 <2000 >2000
The German AgBB105 system, Health‐related Evaluation of Emissions of Volatile Organic Compounds (VOC and SVOC) from Building Products, sets out restrictions on the level of emissions allowed for construction products (in particular flooring but can be applied to paints). An extensive list of chemicals is regulated, with limits described as “Lowest Concentrations of Interest” (LCI). Unlike the French system, these are maximum emission levels designed to remove the most polluting paints from the environment and more stringent levels may be possible within the EU Ecolabel.
102 EPA's Office of Research and Development's "Total Exposure Assessment Methodology (TEAM) Study" (Volumes I through IV, completed in 1985 103 http://www.eco‐institut.de/fileadmin/contents/International_Labelling/VOC/Arrete_etiquetage_2011.pdf 104 Agence nationale de sécurité sanitaire de l'alimentation, de l'environnement et du travail 105 Committee for Health‐related Evaluation of Building Products (Ausschuss zur gesundheitlichen Bewertung von Bauprodukten

‐ 39 ‐
The development of the two national schemes is leading to an EU‐level harmonisation project by the JRC: IHCP at Ispra. The project favours the LCI approach and is expecting to deliver acceptable levels of emissions on 170 chemicals during 2012.106 The ultimate goal is an EU‐wide harmonised standard for IAQ that will apply to all building materials. A related but separate committee has been established under the European Committee for Standardisation (CEN) to develop a harmonised testing procedure for IAQ. This is in a response to the European Construction Products Directive (CPD) which requires manufacturers of construction products to declare “regulated properties” in CE marking. In addition to traditional properties such as mechanical strength and fire safety, CPD refers also to the protection of hygiene, health and environment (Essential Requirement No. 3), which is interpreted to include air emissions. This regulation can apply paints and varnishes and ultimately requires all paints to undergo IAQ testing before they receive CE marking. Currently, paints are not required to meet this criterion because there are no mandated national or EU‐wide tests for IAQ.107 The initial publication by CEN is due by the end of 2012, but completion of the standards is not expected until 2017.108 The standards will be based on the ISO 16000 series. It appears that the LCI levels for chemicals defined by the JRC:IHCP will be tested using the unified standard developed by CEN as a basis for CE marking. The following conclusions can be drawn:
There is a general move towards IAQ testing for construction materials (including paints), which will at some point be mandatory through the CE marking scheme.
There is not an internationally recognised/harmonised standard for testing,
IAQ is only relevant for indoor paints and varnishes.
The current research by the JRC:IHCP is intended as a minimum standard and therefore probably lower than required by the EU Ecolabel.
The work performed particularly by the French could form the basis of a threshold for EU Ecolabel paints and varnishes.
In general, there is support for the use of IAQ to determine the emissions of VOC from paint. However, there appears to be uncertainty over the test method used. Although the national standards are well developed, there is concern that favouring a single standard would unduly benefit companies that are currently subscribing to that system. The international standard is unlikely to be ready until at least the next revision of the EU Ecolabel paints and varnishes criteria. Although harmonisation of testing regimes does not exist, the development of a criterion in this area is desirable. It will signal the intent of the GPP and encourage further development of the standard.
106 Minutes of the 8th Indoor Air Quality (IAQ) Expert Group meeting 14 June 2011 ‐ Luxembourg 107 Evaluation of a horizontal approach to assess the possible release of dangerous substances from construction products in support of requirements from the construction products directive, Energy Research Centre of the Netherlands, 2008 108 New regularity controls on chemical release to indoor air: is it all bad news?, BCF update seminar, 2011

‐ 40 ‐
4.9 Specific topics for road markings
As a sub‐set of paint, road markings have undergone a series of life cycle assessments to determine the most environmentally beneficial system. Water‐based road markings are similar to the paints described above, whereas solvent‐based paints and thermoplastics are significantly different.
4.9.1 Comparative life cycle assessment
Dow109 looked at solvent‐based, water‐based and hot melt paint (To cover 1 m2 of highway with white colour reflective traffic markings for 10 years). Solvent‐based paint carried large impacts in all six areas (energy use, VOC, total solid waste, GHG release, water pollution and toxicity to humans), with latex paint being the least harmful, especially regarding VOCs and water pollution. Figure 9: A comparative life cycle assessment for road markings.
Source: http://www.nzrf.co.nz/techdocs/conferencepapers2011/comparison_of_life cycles.pdf
This LCA commented on the following points: Water‐based paints (w/b above)
Binders contribute the most significant impacts except water and VOC.
TiO2 contributes most water consumption and impacts on many other categories, reflecting its environmental impact.
The production process contributes a relatively small impact compared to hot melt inputs.
Solvent‐based paints (s/b above)
Binders and VOC as per water‐based.
Solvents contribute most VOC, energy input and environmental and human toxicity.
The production process contributes relatively small impact compared to hot melt inputs.
Hot Melt (h/m above)
Similar to water‐based paint, production for repaint contributes the most impact for all impact categories.
The thickness of application is also a major factor relative to paint.
The application stage contributes most to the greenhouse effect.
109
Retrieved from http://www.nzrf.co.nz/techdocs/conferencepapers2011/comparison_of_lifecycles.pdf

‐ 41 ‐
Water‐based paints had lowest overall environmental impact. (Note that this information is provided by a manufacturer promoting water‐based paints.) The solvent content is the focus of most national legislation with regards to road markings. Table 17 summarises these different limits. Table 17: Current national limits on the amount of VOC permitted within road marking paint. Country Limit of VOC content
Netherlands 28 wt%
Austria >75 wt% solids
Germany 25 wt%
Finland 2 wt%
Sweden 2 wt%
USA* 8 wt%
Canada* 150 g/l (summer) 450 g/l (winter)
*Acetone is not considered a VOC within their calculations. Source: the European Directive 2004/42/EC. (2009). Section 20: Potential Scope Extension Covering Road Markings. Hamburg: European Union/Okopol
Scandinavian countries have effectively banned the use of solvent‐based road markings, and are nearly completely reliant on thermoplastics. The Netherlands, Austria and Germany have limited the solvent‐based paints. It is difficult to directly compare the USA and Canada’s limits because of the exclusion of acetone from the VOC classification; due to harsh winter conditions, Canada allows the use of solvent‐based paints but limits their use in summer. A review of the Paints and Varnishes Directive (2004/42/EC) by Ökopol110 examined whether the amount of solvent could be limited within road markings. They explored the concerns that water‐based paints were technically inferior. They concluded that improvements in water‐based paint may mean that such arguments are not necessarily valid and that water‐based systems offer similar performance characteristics to solvent‐based alternatives. Based on their findings they recommended that at total exclusion of solvent‐based road marking paints should be explored (limiting the paints to 60 g/l).
4.9.2 End of life and removal of road markings
Waste from removal of yellow thermoplastic and yellow painted traffic stripe‐ and pavement‐marking contains lead chromate in concentrations between 350 and 1000 mg/kg. These residues may contain
heavy metals that exceed established safety thresholds and may produce toxic fumes when heated.111 There is evidence of a move away from these chemicals but they are still in wide use. Some methods of line removal ‐ such as the heated compressed air lance ‐ produce fumes and smoke which, although not thought to be highly toxic, nonetheless carry a health/environmental hazard. Hydro‐blasting is a newer technique whereby the waste elements are drawn by vacuum into a water tank, and
then filtered for appropriate disposal.112
110 Implementation and review of directive 2004/42/EC, Okopol, 2009 111 http://environment.transportation.org/environmental_issues/construct_maint_prac/compendium/manual/5_5.aspx#tooltip 112 Retrieved from www.markout.co.uk
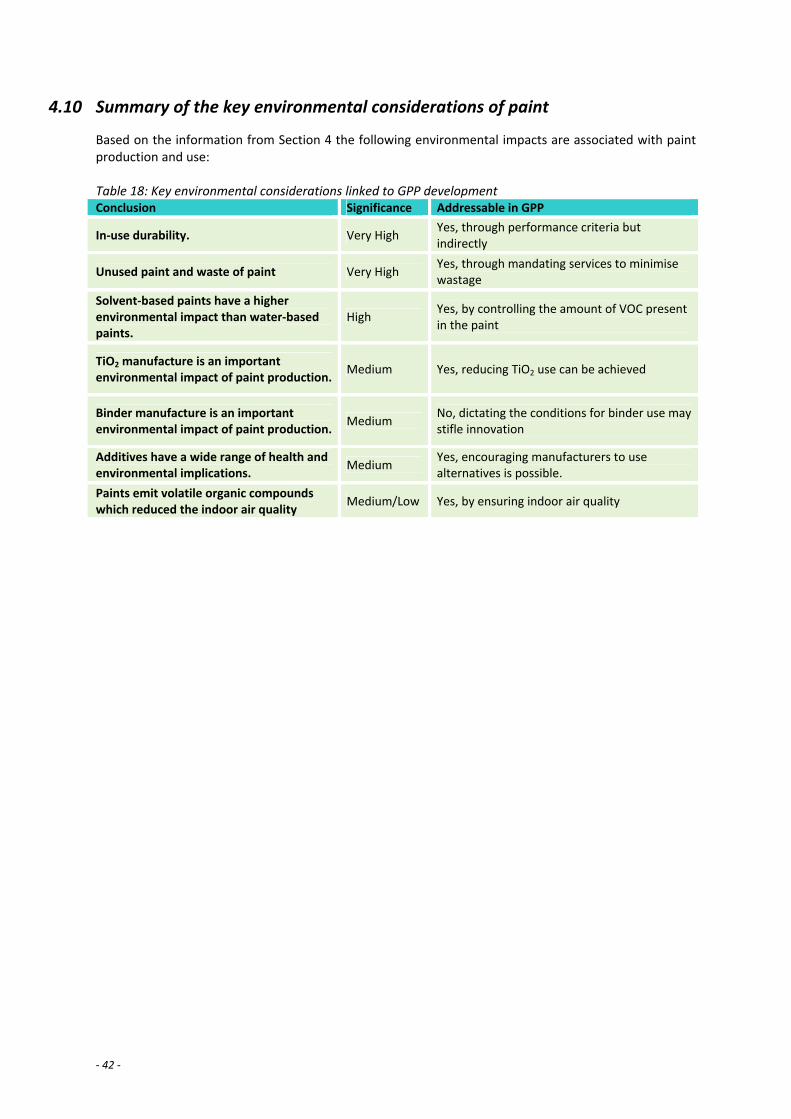
‐ 42 ‐
4.10 Summary of the key environmental considerations of paint
Based on the information from Section 4 the following environmental impacts are associated with paint production and use: Table 18: Key environmental considerations linked to GPP development Conclusion Significance Addressable in GPP
In‐use durability. Very High Yes, through performance criteria but indirectly
Unused paint and waste of paint Very High Yes, through mandating services to minimise wastage
Solvent‐based paints have a higher environmental impact than water‐based paints.
High Yes, by controlling the amount of VOC present in the paint
TiO2 manufacture is an important environmental impact of paint production.
Medium Yes, reducing TiO2 use can be achieved
Binder manufacture is an important environmental impact of paint production.
Medium No, dictating the conditions for binder use may stifle innovation
Additives have a wide range of health and environmental implications.
Medium Yes, encouraging manufacturers to use alternatives is possible.
Paints emit volatile organic compounds which reduced the indoor air quality
Medium/Low Yes, by ensuring indoor air quality
‐ 43 ‐
5 Life cycle costs
5.1 Introduction to life cycle costs
In order to allow public procurers to select the products that will be most cost‐effective it is recommended to use a product life cycle perspective and apply a life cycle cost (LCC) approach. LCC considers the entire (physical) life cycle of a product, from production to disposal. Depending on the perspective taken in the LCC assessment, costs of different stages can be calculated with more or less detail. The use phase of the life cycle is relevant for the public procurers since this cost will be incurred. The production cost of the product to be purchased does not need to be calculated in detail, since the relevant cost element for the purchasing authority would be integrated in the final product price. Many procured items, such as computers or printers, require electricity and consumables to function and the costs of these can often exceed the initial purchase cost of the item. For paints and varnishes the life time costs are generally only incurred at the point of painting. The main considerations for calculating the life cycle costs are the:
cost of purchasing and delivery (e.g. cost per litre of paint or varnish as delivered)
application performance (e.g. amount of paint required to cover a given surface area)
lifetime performance (number of repaints required to maintain coverage over time)
disposals costs (disposal of unused paints). Costs that may theoretically be incurred but were not considered were:
For outdoor paints, the change in thermal performance for the building: o The choice of colour is the dominant factor affecting thermal performance.
Labour time and equipment cost for application of the paint: o It would be impossible to meaningfully to establish costs and differentiate products based on this
variable.
Additional disposal costs at the end of life for the painted surface: o Disposal cost of the painted surfaces are unlikely to be affected by the paint that was applied
Indoor paints: any energy saving from having a lighter painted room and therefore less use of artificial light.
The aforementioned costs have also environmental costs which are commonly studied under the frame of "environmental externalities" but these were not considered relevant for the development of GPP criteria and were not included in the analysis. It can be seen from this that it is not sufficient to simply consider the advertised cost per litre of paint.
5.2 Functional unit
To calculate the life cycle cost of each paint it is necessary to define a functional unit of interest. The functional unit for this life cycle costing was chosen to be the cost of paint required to cover a 20 m2 surface for a period of 21 years, given a baseline assumption that a repaint is required every 7 years to maintain sufficient coverage. This is the same functional unit that was applied to the life cycle assessment of the paints. The variables that are required to calculate the functional unit are:
cost per litre of paint
spreading rate to meet performance criteria
time between repaints to maintain performance criteria
expected losses due to wastage
disposal costs of waste paint.
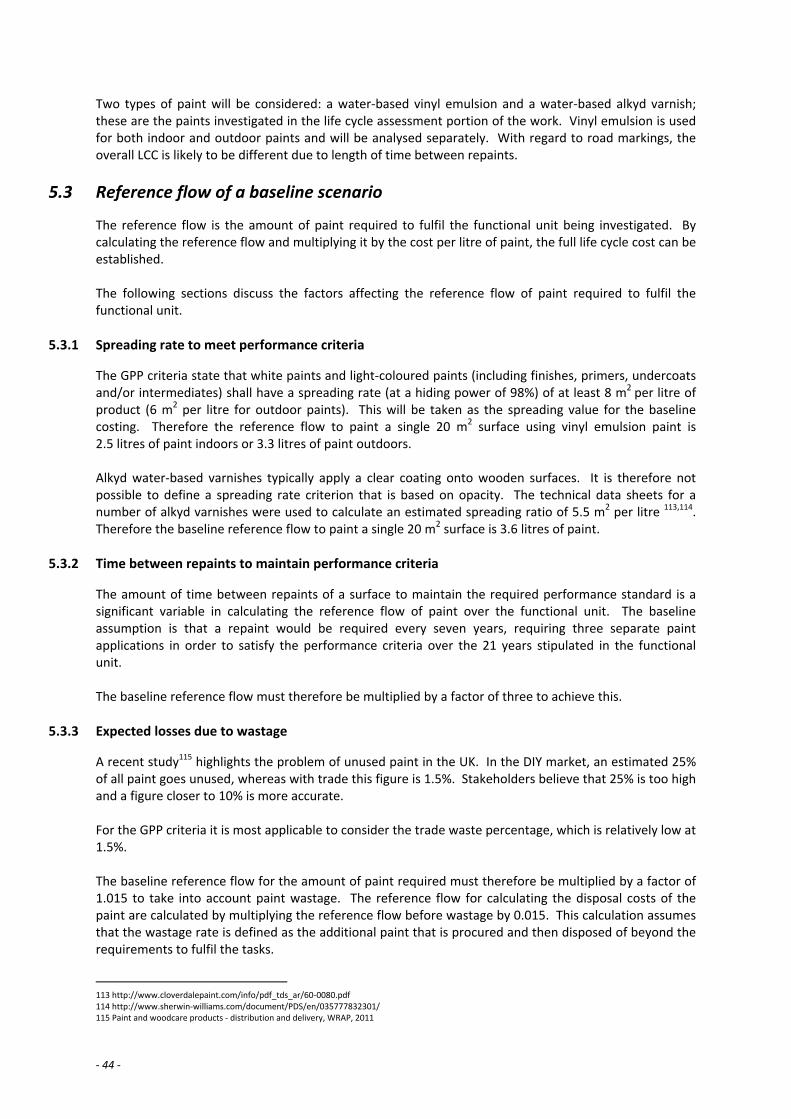
‐ 44 ‐
Two types of paint will be considered: a water‐based vinyl emulsion and a water‐based alkyd varnish; these are the paints investigated in the life cycle assessment portion of the work. Vinyl emulsion is used for both indoor and outdoor paints and will be analysed separately. With regard to road markings, the overall LCC is likely to be different due to length of time between repaints.
5.3 Reference flow of a baseline scenario
The reference flow is the amount of paint required to fulfil the functional unit being investigated. By calculating the reference flow and multiplying it by the cost per litre of paint, the full life cycle cost can be established. The following sections discuss the factors affecting the reference flow of paint required to fulfil the functional unit.
5.3.1 Spreading rate to meet performance criteria
The GPP criteria state that white paints and light‐coloured paints (including finishes, primers, undercoats and/or intermediates) shall have a spreading rate (at a hiding power of 98%) of at least 8 m2 per litre of product (6 m2 per litre for outdoor paints). This will be taken as the spreading value for the baseline costing. Therefore the reference flow to paint a single 20 m2 surface using vinyl emulsion paint is 2.5 litres of paint indoors or 3.3 litres of paint outdoors. Alkyd water‐based varnishes typically apply a clear coating onto wooden surfaces. It is therefore not possible to define a spreading rate criterion that is based on opacity. The technical data sheets for a number of alkyd varnishes were used to calculate an estimated spreading ratio of 5.5 m2 per litre 113,114. Therefore the baseline reference flow to paint a single 20 m2 surface is 3.6 litres of paint.
5.3.2 Time between repaints to maintain performance criteria
The amount of time between repaints of a surface to maintain the required performance standard is a significant variable in calculating the reference flow of paint over the functional unit. The baseline assumption is that a repaint would be required every seven years, requiring three separate paint applications in order to satisfy the performance criteria over the 21 years stipulated in the functional unit. The baseline reference flow must therefore be multiplied by a factor of three to achieve this.
5.3.3 Expected losses due to wastage
A recent study115 highlights the problem of unused paint in the UK. In the DIY market, an estimated 25% of all paint goes unused, whereas with trade this figure is 1.5%. Stakeholders believe that 25% is too high and a figure closer to 10% is more accurate. For the GPP criteria it is most applicable to consider the trade waste percentage, which is relatively low at 1.5%. The baseline reference flow for the amount of paint required must therefore be multiplied by a factor of 1.015 to take into account paint wastage. The reference flow for calculating the disposal costs of the paint are calculated by multiplying the reference flow before wastage by 0.015. This calculation assumes that the wastage rate is defined as the additional paint that is procured and then disposed of beyond the requirements to fulfil the tasks.
113 http://www.cloverdalepaint.com/info/pdf_tds_ar/60‐0080.pdf 114 http://www.sherwin‐williams.com/document/PDS/en/035777832301/ 115 Paint and woodcare products ‐ distribution and delivery, WRAP, 2011

‐ 45 ‐
5.3.4 Reference flow for the functional unit
Table 19 shows the baseline total reference flows for the three scenarios that were discussed. The three scenarios, differentiated only by spreading rates, have very different reference flows. The alkyd scenario requires 45% more paint than the indoor vinyl emulsion scenario. Table 19: Reference flows in litres for three paint scenarios. Scenario To paint 20 m2 Repaint 3 times Paint wastage Reference flow
Vinyl (Indoors) 2.5 7.5 0.11 7.61
Vinyl (Outdoors) 3.3 10.0 0.15 10.15
Alkyd 3.6 10.9 0.16 11.07
5.4 Life cycle costs of a baseline scenario
5.4.1 Cost per litre of paint
The cost per litre of paint is highly variable, depending on the brand, paint range and bulk purchasing discounts. The costs used for the baseline life cycle costing scenario were chosen as the likely cost to the decorating trade for high quality paint; this is shown in Table 20. Also indicated in the table are the ranges of prices that could be expected. Sensitivity to purchase cost is explored in section 5.5. Table 20: Representative costs of purchasing paint per litre for each scenario. Scenario
Range Representative cost per litre
Vinyl (Indoors) €3.00 ‐ €12.00 €5.00
Vinyl (Outdoors) €4.00 ‐ €14.00 €6.00
Alkyd €9.00 ‐ €25.00 €15.00
5.4.2 Disposal costs of waste paint
Discussion with licensed waste disposal operators in the UK revealed that hazardous waste disposal costs approximately €1.10 ‐ €1.90 per litre of solvent‐based paint depending on its condition. Water‐based paints are much less expensive to dispose of, at approximately €0.15 ‐ €0.65 per litre. Solvent‐based paints can therefore be ten time s more expensive to dispose of than water‐based alternatives. (These costs are only representative and depend on factors such as the amount that is disposed of, the distance that it must be transported and the condition of the paint.) Better options for disposal of high quality paints are donation to reuse projects or take‐back schemes. The cost of transporting the paint would be the only disposal cost incurred in these cases. Table 21 shows the estimated costs associated with waste disposal for the functional unit of paint. A range of costs has been calculated, representing both the minimum and maximum expected costs for non‐hazardous and hazardous waste. The inclusion of the zero cost of disposing of paint through a reuse or take‐back scheme is also shown. Sensitivity to paint wastage rates and disposal costs are explored in section 5.5.
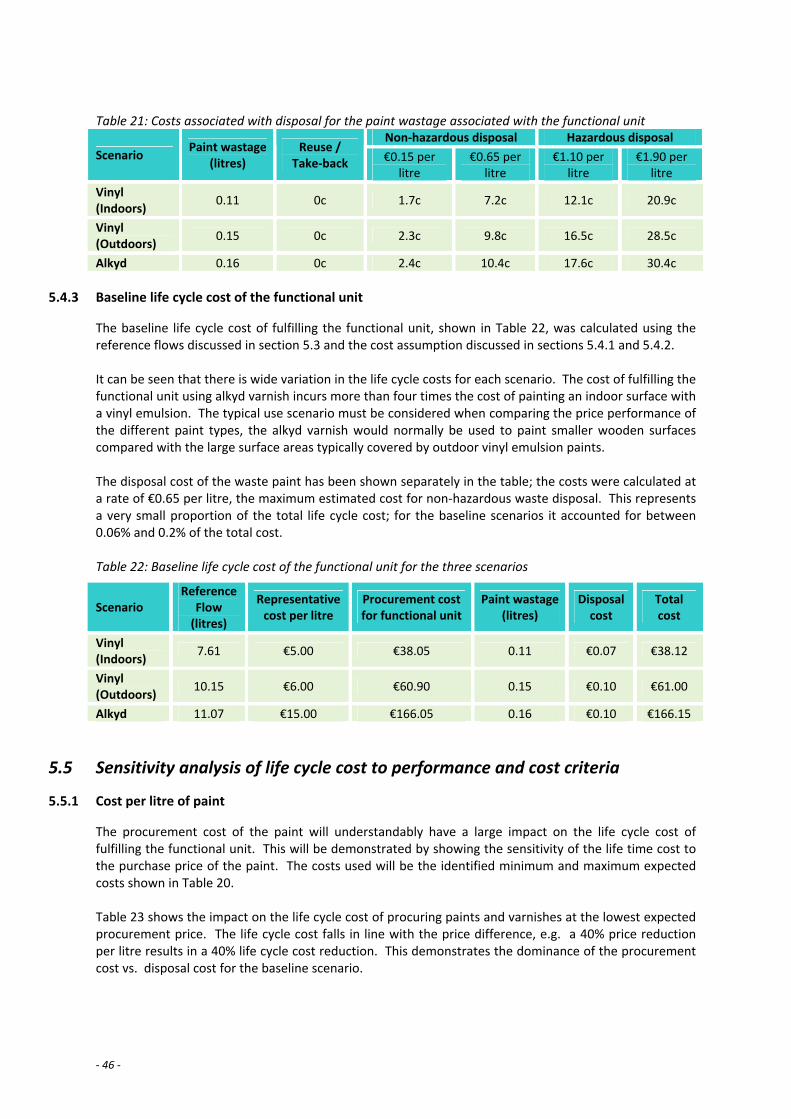
‐ 46 ‐
Table 21: Costs associated with disposal for the paint wastage associated with the functional unit
Non‐hazardous disposal Hazardous disposal
Scenario Paint wastage
(litres) Reuse /
Take‐back €0.15 per litre
€0.65 per litre
€1.10 per litre
€1.90 per litre
Vinyl (Indoors)
0.11 0c 1.7c 7.2c 12.1c 20.9c
Vinyl (Outdoors)
0.15 0c 2.3c 9.8c 16.5c 28.5c
Alkyd 0.16 0c 2.4c 10.4c 17.6c 30.4c
5.4.3 Baseline life cycle cost of the functional unit
The baseline life cycle cost of fulfilling the functional unit, shown in Table 22, was calculated using the reference flows discussed in section 5.3 and the cost assumption discussed in sections 5.4.1 and 5.4.2. It can be seen that there is wide variation in the life cycle costs for each scenario. The cost of fulfilling the functional unit using alkyd varnish incurs more than four times the cost of painting an indoor surface with a vinyl emulsion. The typical use scenario must be considered when comparing the price performance of the different paint types, the alkyd varnish would normally be used to paint smaller wooden surfaces compared with the large surface areas typically covered by outdoor vinyl emulsion paints. The disposal cost of the waste paint has been shown separately in the table; the costs were calculated at a rate of €0.65 per litre, the maximum estimated cost for non‐hazardous waste disposal. This represents a very small proportion of the total life cycle cost; for the baseline scenarios it accounted for between 0.06% and 0.2% of the total cost. Table 22: Baseline life cycle cost of the functional unit for the three scenarios
5.5 Sensitivity analysis of life cycle cost to performance and cost criteria
5.5.1 Cost per litre of paint
The procurement cost of the paint will understandably have a large impact on the life cycle cost of fulfilling the functional unit. This will be demonstrated by showing the sensitivity of the life time cost to the purchase price of the paint. The costs used will be the identified minimum and maximum expected costs shown in Table 20. Table 23 shows the impact on the life cycle cost of procuring paints and varnishes at the lowest expected procurement price. The life cycle cost falls in line with the price difference, e.g. a 40% price reduction per litre results in a 40% life cycle cost reduction. This demonstrates the dominance of the procurement cost vs. disposal cost for the baseline scenario.
Scenario Reference
Flow (litres)
Representative cost per litre
Procurement cost for functional unit
Paint wastage (litres)
Disposal cost
Total cost
Vinyl (Indoors)
7.61 €5.00 €38.05 0.11 €0.07 €38.12
Vinyl (Outdoors)
10.15 €6.00 €60.90 0.15 €0.10 €61.00
Alkyd 11.07 €15.00 €166.05 0.16 €0.10 €166.15
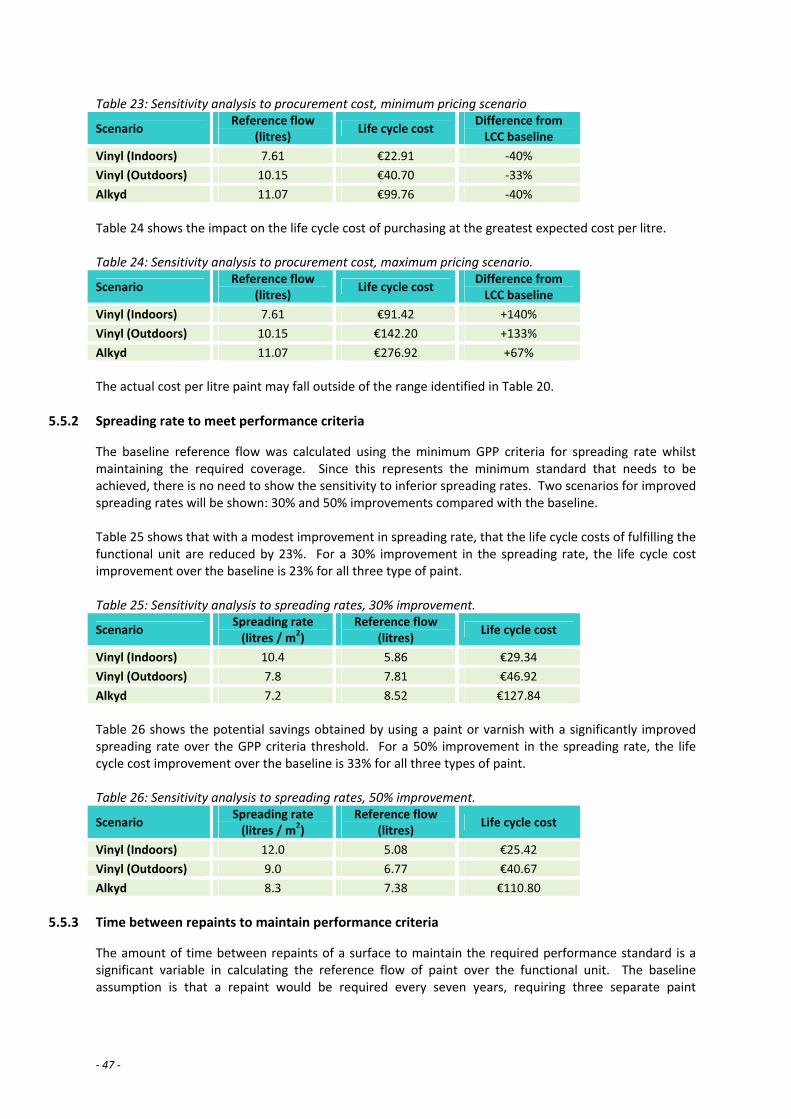
‐ 47 ‐
Table 23: Sensitivity analysis to procurement cost, minimum pricing scenario
Scenario Reference flow
(litres) Life cycle cost
Difference from LCC baseline
Vinyl (Indoors) 7.61 €22.91 ‐40%
Vinyl (Outdoors) 10.15 €40.70 ‐33%
Alkyd 11.07 €99.76 ‐40%
Table 24 shows the impact on the life cycle cost of purchasing at the greatest expected cost per litre. Table 24: Sensitivity analysis to procurement cost, maximum pricing scenario.
Scenario Reference flow
(litres) Life cycle cost
Difference from LCC baseline
Vinyl (Indoors) 7.61 €91.42 +140%
Vinyl (Outdoors) 10.15 €142.20 +133%
Alkyd 11.07 €276.92 +67%
The actual cost per litre paint may fall outside of the range identified in Table 20.
5.5.2 Spreading rate to meet performance criteria
The baseline reference flow was calculated using the minimum GPP criteria for spreading rate whilst maintaining the required coverage. Since this represents the minimum standard that needs to be achieved, there is no need to show the sensitivity to inferior spreading rates. Two scenarios for improved spreading rates will be shown: 30% and 50% improvements compared with the baseline. Table 25 shows that with a modest improvement in spreading rate, that the life cycle costs of fulfilling the functional unit are reduced by 23%. For a 30% improvement in the spreading rate, the life cycle cost improvement over the baseline is 23% for all three type of paint. Table 25: Sensitivity analysis to spreading rates, 30% improvement.
Scenario Spreading rate (litres / m2)
Reference flow (litres)
Life cycle cost
Vinyl (Indoors) 10.4 5.86 €29.34
Vinyl (Outdoors) 7.8 7.81 €46.92
Alkyd 7.2 8.52 €127.84
Table 26 shows the potential savings obtained by using a paint or varnish with a significantly improved spreading rate over the GPP criteria threshold. For a 50% improvement in the spreading rate, the life cycle cost improvement over the baseline is 33% for all three types of paint. Table 26: Sensitivity analysis to spreading rates, 50% improvement.
Scenario Spreading rate (litres / m2)
Reference flow (litres)
Life cycle cost
Vinyl (Indoors) 12.0 5.08 €25.42
Vinyl (Outdoors) 9.0 6.77 €40.67
Alkyd 8.3 7.38 €110.80
5.5.3 Time between repaints to maintain performance criteria
The amount of time between repaints of a surface to maintain the required performance standard is a significant variable in calculating the reference flow of paint over the functional unit. The baseline assumption is that a repaint would be required every seven years, requiring three separate paint

‐ 48 ‐
applications in order to satisfy the performance criteria over the 21 years stipulated in the functional unit. There are several GPP criteria that would affect the time between repaints such as the scrub resistance and the weathering resistance. The sensitivity to these criteria will be analysed by investigating the single variable of time between repaints since there would be no distinction in the life cycle costing to which factor was causing the difference. For the baseline life costing scenario the time between repaints was set at seven years to maintain consistency with the life cycle assessment work. The functional unit period of 21 years was tailored to the seven year cycle, thereby requiring the original paint applications and two repaints and thereby fully realising the benefits of the final repaint. For the sensitivity analysis the repaint period will be set at four and ten years, representing a three‐year deviation either way from the baseline. For consistency the functional unit must remain constant despite not being perfectly divisible by the new repaint periods. There are two methods by which this can be compensated for: allow a non‐integer number of repaints or strictly account for the number of repaints that would occur in the functional unit time frame. The latter method ignores the full benefit of the final repaint; in the case of the ten‐year repaint cycle it would still require three repaints and therefore be identical to the baseline scenario. Given the assumption that the surface to be painted would last longer than the 21 years specified in the functional unit it would be reasonable to allow a non‐integer number of repaints to accurately apportion the benefit of the final paint cycle to the functional unit. The non‐integer method was used for this sensitivity analysis. Table 27 shows the worst case scenario for repaint periods: most paints would be expected to satisfy performance criteria up to four years. A repaint prior to this would be for aesthetic reasons rather than significant degradation of the paint. The number of repaints required to fulfil the functional unit would be 5.25 and result in a 75% increased cost over the baseline scenario. This scenario would also incur a 75% greater labour cost due to repainting. Table 27: Sensitivity analysis to repaint periods, 4 year repaint period.
Scenario Reference flow
(litres) Life cycle cost
Vinyl (Indoors) 13.32 €66.74
Vinyl (Outdoors) 17.76 €106.75
Alkyd 19.38 €290.85
Table 28 shows a significantly improved repaint requirement scenario with repaints only required every 10 years; some heavy duty paints could even be expected to exceed this performance. The number of repaints required to fulfil the functional unit would be 2.1 and result in a 30% reduced cost over the baseline scenario. The 30% reduction in cost would also be realised for labour cost since fewer repaints are required. Table 28: Sensitivity analysis to repaint periods, 10 year repaint period.
Scenario Reference flow
(litres) Life cycle cost
Vinyl (Indoors) 5.33 €26.69
Vinyl (Outdoors) 7.11 €42.70
Alkyd 7.75 €116.34
5.5.4 Expected losses due to wastage and disposal costs
Table 22 gave the breakdown life cycle cost assessment and showed that the disposal costs were negligible for the baseline scenario, given the assumption of a 1.5% paint wastage rate and a €0.65 per litre disposal cost.

‐ 49 ‐
This sensitivity analysis will explore the two variables in determining the cost of waste: the wastage rate and the disposal costs. The output is expressed in the percentage increased (or in one case decreased) cost over the baseline scenario. Table 29 shows the sensitivity analysis for both vinyl paint scenarios: the minor differences between the indoor and outdoor scenarios did not warrant being analysed separately. The cost of paint wastage is insensitive to the cost of disposal, but is dominated by the cost of purchasing more paint than is needed to complete the task. Table 29: Sensitivity analysis to paint wastage, non‐hazardous vinyl emulsions. Vinyl 1.5% Wastage 5% Wastage 25% Wastage
€0.15 per litre ‐0.1% 3.4% 23.7%
€0.65 per litre 0.0% 3.9% 26.2%
Table 30 shows the sensitivity analysis for the alkyd varnish. This was assessed separately since non‐water‐based alkyd varnish must be disposed of as hazardous waste which carries a much greater disposal cost. From the figures below it can be seen that the cost associated with paint wastage remains insensitive to disposal cost: a 1,250% increase in the cost of disposal only results in a modest 2.8% increase above baseline costs. Table 30: Sensitivity analysis to paint wastage, hazardous and non‐hazardous alkyd varnishes. Alkyd 1.5% Wastage 5% Wastage 25% Wastage
€0.15 per litre 0.0% 3.5% 23.4%
€0.65 per litre 0.0% 3.6% 24.2%
€1.10 per litre 0.1% 3.8% 24.9%
€1.90 per litre 0.2% 4.0% 26.2%
5.6 Conclusion
The life cycle cost of paints and varnishes were established by calculating the baseline cost of fulfilling the functional unit that was set in the life cycle assessment technical work. The life cycle cost considered the procurement cost, the spreading rate, the longevity of the finish and the paint wastage, which included the disposal cost. It was found that all investigated factors had a large impact on the life cycle cost, with the exception of the disposal cost of waste paint. The majority of the cost from paint wastage occurred due to the additional paint that needed to be procured. The analysis shows that the procurement cost cannot be considered in isolation and that even moderate improvements in performance can outweigh the additional cost of purchasing more expensive paint. A 20% price increase would, for example, be justified if the paint finish lasted 8.5 years or more compared with the baseline 7 years. Similarly the 20% price increase would be outweighed if a spreading of 9.6 m2 per litre could be achieved instead of 8 m2 per litre. Whilst the quality and cost of the procured paint or varnish were dominant factors in determining the life cycle cost, it is essential to consider the impact of the application and the use phase. Correct cleaning and pre‐treatment of the surfaces may significantly extend the life of the painted surface and be a cost‐effective step to carry out. Skilled decorators should be able to achieve the advertised spreading rates on suitable surfaces and leave a durable finish that will last a long time, whereas less skilled decorators may use more paint than is necessary and their work may not last as long. A labour cost saving may therefore not result in a life cycle cost saving.
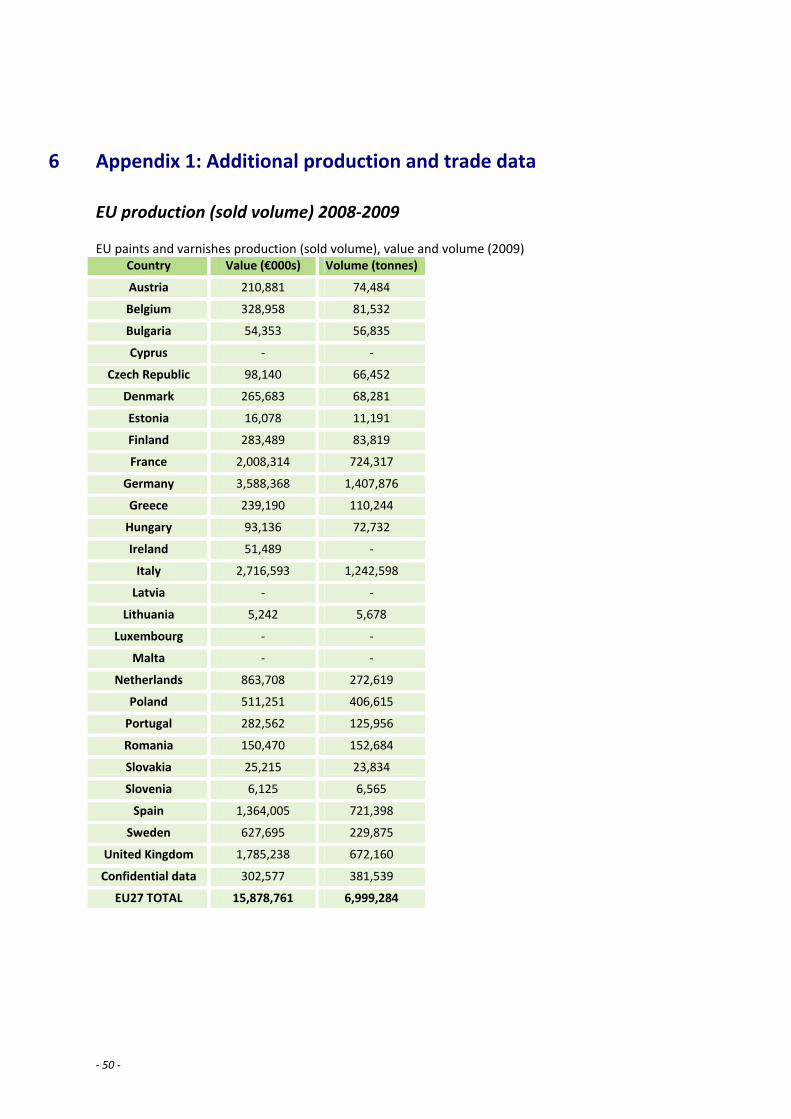
‐ 50 ‐
6 Appendix 1: Additional production and trade data
EU production (sold volume) 2008‐2009 EU paints and varnishes production (sold volume), value and volume (2009)
Country Value (€000s) Volume (tonnes)
Austria 210,881 74,484
Belgium 328,958 81,532
Bulgaria 54,353 56,835
Cyprus ‐ ‐
Czech Republic 98,140 66,452
Denmark 265,683 68,281
Estonia 16,078 11,191
Finland 283,489 83,819
France 2,008,314 724,317
Germany 3,588,368 1,407,876
Greece 239,190 110,244
Hungary 93,136 72,732
Ireland 51,489 ‐
Italy 2,716,593 1,242,598
Latvia ‐ ‐
Lithuania 5,242 5,678
Luxembourg ‐ ‐
Malta ‐ ‐
Netherlands 863,708 272,619
Poland 511,251 406,615
Portugal 282,562 125,956
Romania 150,470 152,684
Slovakia 25,215 23,834
Slovenia 6,125 6,565
Spain 1,364,005 721,398
Sweden 627,695 229,875
United Kingdom 1,785,238 672,160
Confidential data 302,577 381,539
EU27 TOTAL 15,878,761 6,999,284

‐ 51 ‐
EU paints and varnishes production (sold volume), value and volume (2008)
Country Value (€000s) Volume (tonnes)
Austria 270,306 88,701
Belgium 407,368 89,846
Bulgaria 68,823 75,344
Cyprus ‐ ‐
Czech Republic 119,415 103,542
Denmark 162,157 40,476
Estonia 23,059 15,304
Finland 368,564 112,080
France 1,566,417 627,861
Germany 3,543,557 1,527,214
Greece 273,749 120,998
Hungary 111,106 98,495
Ireland 74,606 36,402
Italy 3,066,936 1,397,158
Latvia ‐ ‐
Lithuania 5,637 6,835
Luxembourg ‐ ‐
Malta ‐ ‐
Netherlands 952,439 334,647
Poland 642,119 440,097
Portugal 378,666 177,487
Romania 175,044 130,626
Slovakia 1,728 935
Slovenia 9,679 6,707
Spain 1,679,678 845,984
Sweden 755,367 269,773
United Kingdom 2,084,095 763,420
Confidential data 1,177,099 416,438
EU27 TOTAL 17,917,613 7,726,369

‐ 52 ‐
EU total trade, imports and exports 2008‐2009 EU total trade in paints and varnishes, imports and exports in value and volume (2009)
Value Volume Country
Imports (€000s)
Exports (€000s)
Net Exports (€000s)
Imports (tonnes)
Exports (tonnes)
Net Exports (tonnes)
Austria 196,936 162,510 ‐34,426 81,981 73,700 ‐8,281
Belgium 440,284 611,673 171,390 139,215 140,505 1,290
Bulgaria 37,630 10,200 ‐27,430 14,664 15,239 576
Cyprus 14,388 821 ‐13,567 6,803 6133.6 ‐669
Czech Republic 224,308 31,870 ‐192,438 76,515 70,143 ‐6,372
Denmark 120,628 153,955 33,327 193,263 228,040 34,776
Estonia 27,060 42,729 15,669 46,888 50,134 3,246
Finland 60,582 115,673 55,091 11,505 16,803 5,298
France 482,551 612,005 129,453 99,102 103,240 4,138
Germany 568,975 1,799,986 1,231,011 17,831 20,371 2,540
Greece 92,895 43,037 ‐49,858 183,406 193,525 10,118
Hungary 88,439 16,498 ‐71,941 122,341 120,451 ‐1,890
Ireland 51,167 6,965 ‐44,201 26,660 27,042 381
Italy 246,469 669,663 423,193 35,768 34,375 ‐1,393
Latvia 20,511 9,265 ‐11,247 30,610 28,390 ‐2,221
Lithuania 43,731 18,335 ‐25,396 78,039 106,444 28,404
Luxembourg 23,301 5,463 ‐17,838 17,880 16,171 ‐1,709
Malta 7,024 2,659 ‐4,365 6,476 6020.9 ‐455
Netherlands 262,272 492,689 230,417 9,429 8,700 ‐729
Poland 356,219 117,108 ‐239,111 1,758 1,905 146
Portugal 104,427 96,859 ‐7,568 105,306 113,148 7,842
Romania 134,701 7,367 ‐127,334 125,523 124,416 ‐1,107
Slovakia 101,434 7,920 ‐93,514 29,368 40,569 11,201
Slovenia 42,957 73,093 30,136 55,576 50,306 ‐5,270
Spain 346,587 316,857 ‐29,730 54,012 71,763 17,751
Sweden 153,608 376,827 223,219 12,909 19,348 6,439
United Kingdom 327,516 469,978 142,462 57,915 54,637 ‐3,278
EU27 TOTAL 4,576,600 6,272,004 1,695,403 1,640,743 1,741,515 100,773

‐ 53 ‐
EU total trade in paints and varnishes, imports and exports in value and volume (2008)
Value Volume
Country Imports (€000s)
Exports (€000s)
Net Exports (€000s)
Imports (tonnes)
Exports (tonnes)
Net Exports (tonnes)
Austria 228,487 206,403 ‐22,083 89,428 80,395 ‐9,034
Belgium 463,913 739,144 275,231 146,523 140,522 ‐6,001
Bulgaria 43,005 13,660 ‐29,345 15,075 19,320 4,244
Cyprus 17,700 863 ‐16,837 8,487 8025.8 ‐461
Czech Republic 262,218 44,913 ‐217,306 88,508 79,768 ‐8,740
Denmark 146,874 174,648 27,774 52,278 54,950 2,673
Estonia 39,779 52,590 12,811 16,599 23,578 6,979
Finland 77,112 166,246 89,134 23,292 30,181 6,889
France 544,105 769,035 224,930 196,853 219,063 22,210
Germany 692,701 2,074,507 1,381,806 229,406 265,943 36,537
Greece 117,027 52,071 ‐64,956 34,971 33,520 ‐1,451
Hungary 121,941 22,096 ‐99,846 47,486 45,870 ‐1,616
Ireland 71,067 3,806 ‐67,261 39,167 35,335 ‐3,832
Italy 285,303 799,662 514,359 84,398 116,513 32,115
Latvia 29,651 13,452 ‐16,200 14,578 13,579 ‐999
Lithuania 55,445 18,045 ‐37,400 22,452 19,905 ‐2,547
Luxembourg 24,418 5,669 ‐18,748 7,251 6,889 ‐362
Malta 8,716 2,457 ‐6,259 2,471 2411.7 ‐60
Netherlands 325,527 563,671 238,144 111,448 115,337 3,889
Poland 442,074 150,350 ‐291,725 151,133 151,104 ‐30
Portugal 123,013 115,030 ‐7,983 31,108 46,509 15,402
Romania 151,400 5,831 ‐145,569 64,339 56,226 ‐8,113
Slovakia 131,064 7,355 ‐123,709 78,747 74,816 ‐3,932
Slovenia 49,705 110,005 60,300 15,206 23,442 8,236
Spain 366,835 352,179 ‐14,656 144,274 149,257 4,983
Sweden 211,121 434,761 223,640 71,866 89,049 17,183
United Kingdom 380,773 603,951 223,178 145,827 144,862 ‐965
EU27 TOTAL 5,410,974 7,502,400 2,091,426 1,933,171 2,046,369 113,199

‐ 54 ‐
7 Appendix 2: Unit flow processes for LCA
Alkyd emulsion paint
Single score
0.12 kg Soy beans IP, at
farm/CH U
7.55E-5 Pt
0.125 kg Titanium dioxide at
plant, sulphate process, at
0.000201 Pt
0.125 kg Titanium dioxide, chloride process, at plant/RER S
0.000174 Pt
4.46 MJ Heat, unspecific,
in chemical plant/RER U
0.000111 Pt
0.09 kg Penta-erythritol, at plant/RER U
9.95E-5 Pt
0.09 kg Phthalic
anhydride, at plant/RER U
8.87E-5 Pt
0.12 kg Soya oil, at plant/RER U
9.96E-5 Pt
0.086 kg Xylene, at
plant/RER U
5.96E-5 Pt
1.41 MJ Electricity, high
voltage, production UCTE,6.31E-5 Pt
1.27 MJ Electricity, medium
voltage, production UCTE,5.84E-5 Pt
1.44 MJ Electricity,
production mix UCTE/UCTE U
6.38E-5 Pt
6.25 MJ Natural gas, high
pressure, at consumer/RER U
6.16E-5 Pt
4.51 MJ Natural gas,
burned in industrial furnace 7.23E-5 Pt
0.171 m3 Natural gas, at long-distance pipeline/RER U
6.09E-5 Pt
1 kg Alkyd emulsion
paints
0.000839 Pt
1 kg Transport and
energy for paints
0.000156 Pt

‐ 55 ‐
Human Health
0.12 kg Soy beans IP, at
farm/CH U
1.1E-7 DALY
0.125 kg Titanium dioxide at
plant, sulphate process, at
4.95E-7 DALY
0.125 kg Titanium dioxide, chloride process, at plant/RER S
3.01E-7 DALY
5.77E-10 p Chemical plant,
organics/RER/I U
8.66E-8 DALY
4.46 MJ Heat, unspecific,
in chemical plant/RER U
1.18E-7 DALY
0.09 kg Penta-erythritol, at plant/RER U
1.29E-7 DALY
0.09 kg Phthalic
anhydride, at plant/RER U
1.37E-7 DALY
0.12 kg Soya oil, at plant/RER U
1.83E-7 DALY
1.41 MJ Electricity, high
voltage, production UCTE,1.09E-7 DALY
1.27 MJ Electricity, medium
voltage, production UCTE,1E-7 DALY
1.44 MJ Electricity,
production mix UCTE/UCTE U
1.1E-7 DALY
1.16 MJ Hard coal, burned
in industrial furnace
8.44E-8 DALY
1 kg Alkyd emulsion
paints
1.51E-6 DALY
1 kg Transport and
energy for paints
2.21E-7 DALY

‐ 56 ‐
Ecosystem quality
0.41 m2 Green manure IP, until march/CH U
0.311 PDF*m2*yr
0.12 kg Soy beans IP, at
farm/CH U
0.628 PDF*m2*yr
0.125 kg Titanium dioxide at
plant, sulphate process, at
0.0571 PDF*m2*yr
0.125 kg Titanium dioxide, chloride process, at plant/RER S
0.0656 PDF*m2*yr
5.77E-10 p Chemical plant,
organics/RER/I U
0.0481 PDF*m2*yr
4.46 MJ Heat, unspecific,
in chemical plant/RER U
0.0469 PDF*m2*yr
0.12 kg Soya oil, at plant/RER U
0.643 PDF*m2*yr
1 kg Alkyd emulsion
paints
0.93 PDF*m2*yr
1 kg Transport and
energy for paints
0.0918 PDF*m2*yr

‐ 57 ‐
Climate change
0.125 kg Titanium dioxide at
plant, sulphate process, at
0.578 kg CO2 eq
0.125 kg Titanium dioxide, chloride process, at plant/RER S
0.498 kg CO2 eq
4.46 MJ Heat, unspecific,
in chemical plant/RER U
0.428 kg CO2 eq
0.09 kg Penta-erythritol, at plant/RER U
0.26 kg CO2 eq
0.09 kg Phthalic
anhydride, at plant/RER U
0.206 kg CO2 eq
0.12 kg Soya oil, at plant/RER U
0.158 kg CO2 eq
0.086 kg Xylene, at
plant/RER U
0.121 kg CO2 eq
1.41 MJ Electricity, high
voltage, production UCTE,0.195 kg CO2 eq
1.27 MJ Electricity, medium
voltage, production UCTE,0.18 kg CO2 eq
1.44 MJ Electricity,
production mix UCTE/UCTE U
0.197 kg CO2 eq
4.51 MJ Natural gas,
burned in industrial furnace
0.294 kg CO2 eq
1.41 MJ Light fuel oil,
burned in industrial furnace0.121 kg CO2 eq
1 kg Alkyd emulsion
paints
2.32 kg CO2 eq
1 kg Transport and
energy for paints
0.571 kg CO2 eq

‐ 58 ‐
Resources
0.125 kg Titanium dioxide at
plant, sulphate process, at
10.4 MJ primary
0.125 kg Titanium dioxide, chloride process, at plant/RER S
11.5 MJ primary
0.0847 kg Formaldehyde,
production mix, at plant/RER U
4.01 MJ primary
4.46 MJ Heat, unspecific,
in chemical plant/RER U
7.18 MJ primary
0.0967 kg Methanol, at plant/GLO U
3.8 MJ primary
0.09 kg Penta-erythritol, at plant/RER U
8.01 MJ primary
0.09 kg Phthalic
anhydride, at plant/RER U
7.15 MJ primary
0.086 kg Xylene, at
plant/RER U
5.76 MJ primary
1.41 MJ Electricity, high
voltage, production UCTE,4.1 MJ primary
1.27 MJ Electricity, medium
voltage, production UCTE,3.76 MJ primary
1.44 MJ Electricity,
production mix UCTE/UCTE U
4.15 MJ primary
6.25 MJ Natural gas, high
pressure, at consumer/RER U
7.73 MJ primary
4.51 MJ Natural gas,
burned in industrial furnace 5.65 MJ primary
0.171 m3 Natural gas, at long-distance pipeline/RER U
7.72 MJ primary
0.0758 m3 Natural gas, at
production onshore/DZ U
3.14 MJ primary
0.0734 m3 Natural gas, at
production onshore/RU U
3.07 MJ primary
0.0627 m3 Natural gas,
production RU, at long-distance
3.08 MJ primary
1 kg Alkyd emulsion
paints
49.3 MJ primary
1 kg Transport and
energy for paints
9.26 MJ primary

‐ 59 ‐
Vinyl emulsion wall paint (TiO2 as filler and talc) (5% cut‐off)
Single score
0.196 kg Titanium dioxide at
plant, sulphate process, at
0.000315 Pt
0.196 kg Titanium dioxide,
chloride process, at plant/RER S
0.000272 Pt
0.085 kg Acrylic acid, at
plant/RER U
6.53E-5 Pt
0.144 kg Butyl acrylate, at
plant/RER U
0.000207 Pt
5.15 MJ Heat, unspecific, in chemical plant/RER
U
0.000128 Pt
6.46 MJ Natural gas, high
pressure, at consumer/RER U
6.38E-5 Pt
5.34 MJ Natural gas, burned in industrial furnace
>100kW/RER U
8.55E-5 Pt
0.177 m3 Natural gas, at long-distance
pipeline/RER U
6.3E-5 Pt
0.118 kg Methyl
methacrylate, at plant/RER U
0.000216 Pt
0.129 kg Propylene, at plant/RER U
8.93E-5 Pt
0.0821 kg 1-butanol, propylene hydroformylation, at
plant/RER U
7.74E-5 Pt
1 kg Transport and
energy for paints
0.000156 Pt
1 kg Vinyl emulsion wall paint (TiO2 heavy)
0.00119 Pt
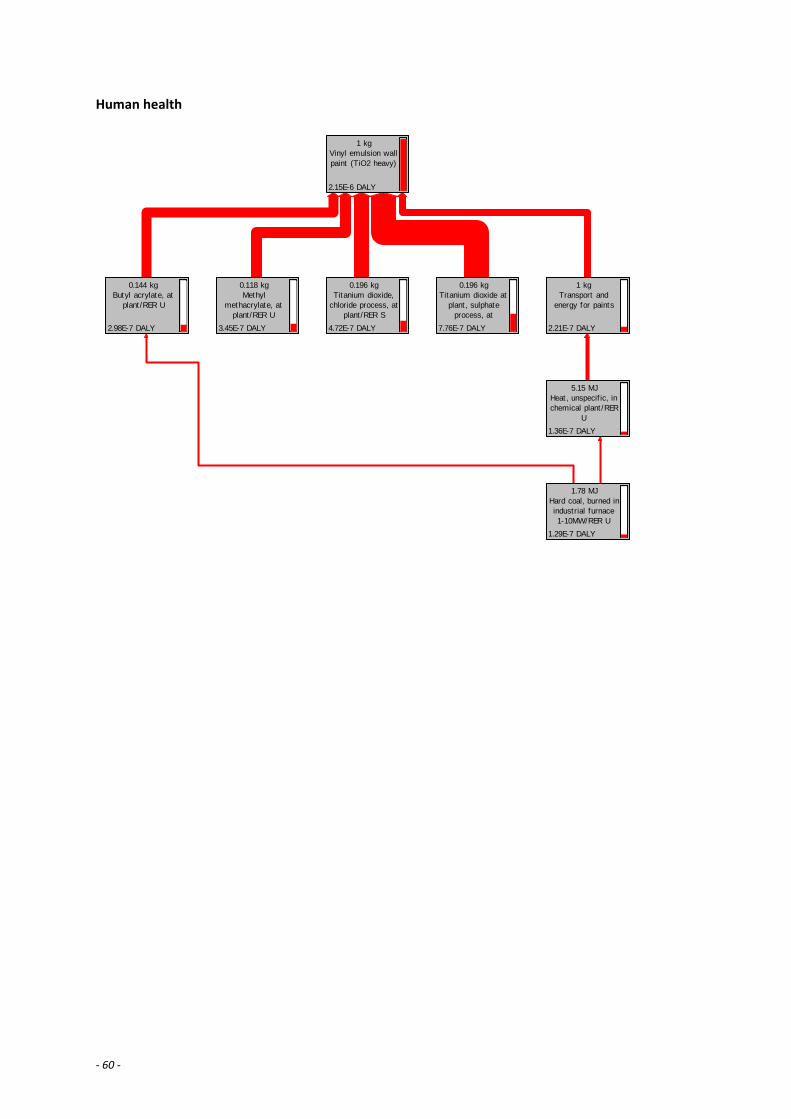
‐ 60 ‐
Human health
0.196 kg Titanium dioxide at
plant, sulphate process, at
7.76E-7 DALY
0.196 kg Titanium dioxide,
chloride process, at plant/RER S
4.72E-7 DALY
0.144 kg Butyl acrylate, at
plant/RER U
2.98E-7 DALY
5.15 MJ Heat, unspecific, in chemical plant/RER
U
1.36E-7 DALY
1.78 MJ Hard coal, burned in industrial furnace 1-10MW/RER U
1.29E-7 DALY
0.118 kg Methyl
methacrylate, at plant/RER U
3.45E-7 DALY
1 kg Transport and
energy for paints
2.21E-7 DALY
1 kg Vinyl emulsion wall paint (TiO2 heavy)
2.15E-6 DALY

‐ 61 ‐
Ecosystem quality
0.00125 kg Dithiocarbamate-co
mpounds, at regional
0.00671 PDF*m2*yr
0.005 kg Biocides, for paper
production, unspecified, at
0.00916 PDF*m2*yr
0.196 kg Titanium dioxide at
plant, sulphate process, at
0.0895 PDF*m2*yr
0.196 kg Titanium dioxide,
chloride process, at plant/RER S
0.103 PDF*m2*yr
0.144 kg Butyl acrylate, at
plant/RER U
0.0537 PDF*m2*yr
5.43E-10 p Chemical plant,
organics/RER/I U
0.0453 PDF*m2*yr
0.0161 kg Chemicals organic,
at plant/GLO U
0.00291 PDF*m2*yr
5.15 MJ Heat, unspecific, in chemical plant/RER
U
0.0541 PDF*m2*yr
0.00274 kg Methanol, at plant/GLO U
0.000167 PDF*m2*yr
8.87E-5 m3 Building,
multi-storey/RER/I U
0.0184 PDF*m2*yr
0.00684 kg Facilities, chemical production/RER/I U
0.0255 PDF*m2*yr
0.000163 kg Blasting/RER U
0.0257 PDF*m2*yr
1.78 MJ Hard coal, burned in industrial furnace 1-10MW/RER U
0.0341 PDF*m2*yr
0.00103 kg Copper, at regional
storage/RER U
0.0192 PDF*m2*yr
0.000562 kg Manganese
concentrate, at beneficiation/GLO U
4.36E-5 PDF*m2*yr
0.0345 m3 Natural gas, at
production onshore/DZ U
0.00197 PDF*m2*yr
1.81 MJ Light fuel oil, burned in industrial furnace
1MW,
0.0343 PDF*m2*yr
1.34E-6 m Well for exploration
and production, onshore/GLO/I U
0.0225 PDF*m2*yr
0.000318 kg Disposal, drilling waste, 71.5%
water, to
0.0222 PDF*m2*yr
1 kg Transport and
energy for paints
0.0918 PDF*m2*yr
1 kg Vinyl emulsion wall paint (TiO2 heavy)
0.363 PDF*m2*yr
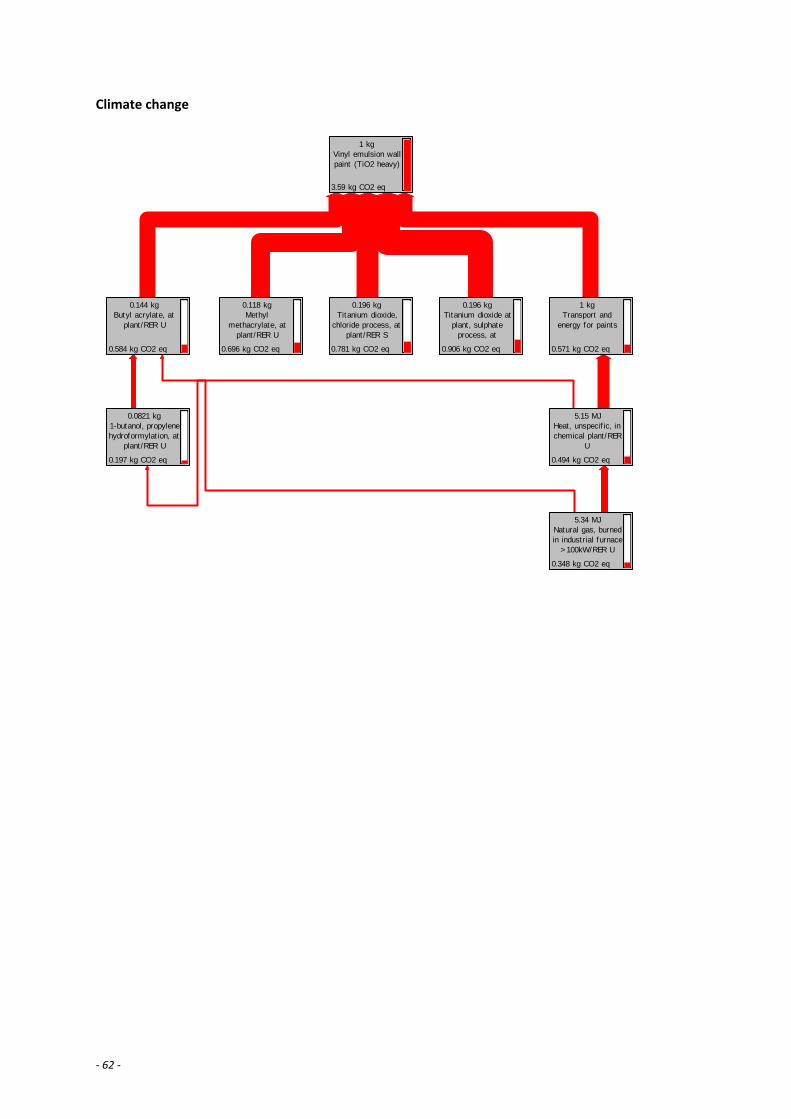
‐ 62 ‐
Climate change
0.196 kg Titanium dioxide at
plant, sulphate process, at
0.906 kg CO2 eq
0.196 kg Titanium dioxide,
chloride process, at plant/RER S
0.781 kg CO2 eq
0.144 kg Butyl acrylate, at
plant/RER U
0.584 kg CO2 eq
5.15 MJ Heat, unspecific, in chemical plant/RER
U
0.494 kg CO2 eq
5.34 MJ Natural gas, burned in industrial furnace
>100kW/RER U
0.348 kg CO2 eq
0.118 kg Methyl
methacrylate, at plant/RER U
0.696 kg CO2 eq
0.0821 kg 1-butanol, propylene hydroformylation, at
plant/RER U
0.197 kg CO2 eq
1 kg Transport and
energy for paints
0.571 kg CO2 eq
1 kg Vinyl emulsion wall paint (TiO2 heavy)
3.59 kg CO2 eq

‐ 63 ‐
Resources
0.196 kg Titanium dioxide at
plant, sulphate process, at
16.3 MJ primary
0.196 kg Titanium dioxide,
chloride process, at plant/RER S
18.1 MJ primary
0.085 kg Acrylic acid, at
plant/RER U
5.55 MJ primary
0.144 kg Butyl acrylate, at
plant/RER U
15.5 MJ primary
5.15 MJ Heat, unspecific, in chemical plant/RER
U
8.29 MJ primary
6.46 MJ Natural gas, high
pressure, at consumer/RER U
8 MJ primary
5.34 MJ Natural gas, burned in industrial furnace
>100kW/RER U
6.68 MJ primary
0.177 m3 Natural gas, at long-distance
pipeline/RER U
7.99 MJ primary
0.118 kg Methyl
methacrylate, at plant/RER U
14.7 MJ primary
0.129 kg Propylene, at plant/RER U
8.93 MJ primary
0.0821 kg 1-butanol, propylene hydroformylation, at
plant/RER U
6.77 MJ primary
1 kg Transport and
energy for paints
9.26 MJ primary
1 kg Vinyl emulsion wall paint (TiO2 heavy)
75.4 MJ primary
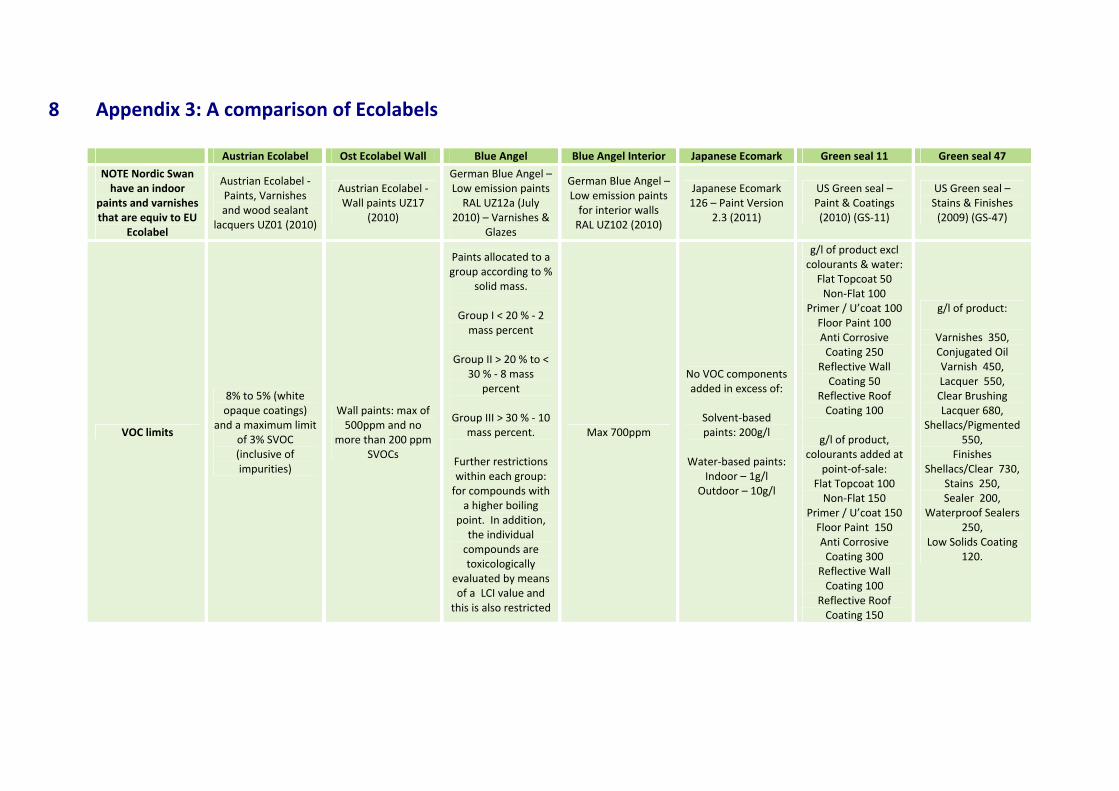
8 Appendix 3: A comparison of Ecolabels
Austrian Ecolabel Ost Ecolabel Wall Blue Angel Blue Angel Interior Japanese Ecomark Green seal 11 Green seal 47
NOTE Nordic Swan have an indoor
paints and varnishes that are equiv to EU
Ecolabel
Austrian Ecolabel ‐ Paints, Varnishes and wood sealant
lacquers UZ01 (2010)
Austrian Ecolabel ‐ Wall paints UZ17
(2010)
German Blue Angel – Low emission paints RAL UZ12a (July
2010) – Varnishes & Glazes
German Blue Angel – Low emission paints for interior walls RAL UZ102 (2010)
Japanese Ecomark 126 – Paint Version
2.3 (2011)
US Green seal – Paint & Coatings (2010) (GS‐11)
US Green seal – Stains & Finishes (2009) (GS‐47)
VOC limits
8% to 5% (white opaque coatings)
and a maximum limit of 3% SVOC (inclusive of impurities)
Wall paints: max of 500ppm and no
more than 200 ppm SVOCs
Paints allocated to a group according to %
solid mass.
Group I < 20 % ‐ 2 mass percent
Group II > 20 % to <
30 % ‐ 8 mass percent
Group III > 30 % ‐ 10
mass percent.
Further restrictions within each group: for compounds with a higher boiling
point. In addition, the individual compounds are toxicologically
evaluated by means of a LCI value and this is also restricted
Max 700ppm
No VOC components added in excess of:
Solvent‐based paints: 200g/l
Water‐based paints:
Indoor – 1g/l Outdoor – 10g/l
g/l of product excl colourants & water: Flat Topcoat 50 Non‐Flat 100
Primer / U’coat 100 Floor Paint 100 Anti Corrosive Coating 250
Reflective Wall Coating 50
Reflective Roof Coating 100
g/l of product,
colourants added at point‐of‐sale:
Flat Topcoat 100 Non‐Flat 150
Primer / U’coat 150 Floor Paint 150 Anti Corrosive Coating 300
Reflective Wall Coating 100
Reflective Roof Coating 150
g/l of product:
Varnishes 350, Conjugated Oil Varnish 450, Lacquer 550, Clear Brushing Lacquer 680,
Shellacs/Pigmented 550,
Finishes Shellacs/Clear 730,
Stains 250, Sealer 200,
Waterproof Sealers 250,
Low Solids Coating 120.
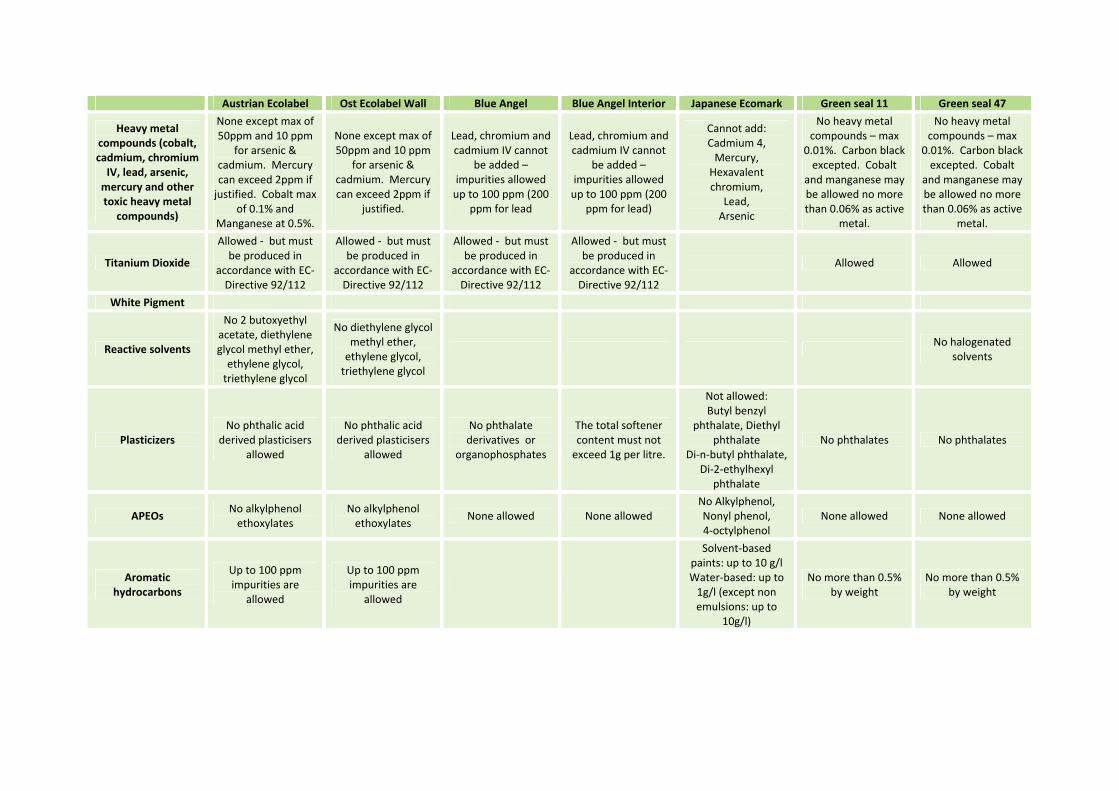
Austrian Ecolabel Ost Ecolabel Wall Blue Angel Blue Angel Interior Japanese Ecomark Green seal 11 Green seal 47
Heavy metal compounds (cobalt, cadmium, chromium IV, lead, arsenic, mercury and other toxic heavy metal
compounds)
None except max of 50ppm and 10 ppm
for arsenic & cadmium. Mercury can exceed 2ppm if justified. Cobalt max
of 0.1% and Manganese at 0.5%.
None except max of 50ppm and 10 ppm
for arsenic & cadmium. Mercury can exceed 2ppm if
justified.
Lead, chromium and cadmium IV cannot
be added – impurities allowed up to 100 ppm (200
ppm for lead
Lead, chromium and cadmium IV cannot
be added – impurities allowed up to 100 ppm (200
ppm for lead)
Cannot add: Cadmium 4, Mercury, Hexavalent chromium,
Lead, Arsenic
No heavy metal compounds – max
0.01%. Carbon black excepted. Cobalt
and manganese may be allowed no more than 0.06% as active
metal.
No heavy metal compounds – max
0.01%. Carbon black excepted. Cobalt
and manganese may be allowed no more than 0.06% as active
metal.
Titanium Dioxide
Allowed ‐ but must be produced in
accordance with EC‐Directive 92/112
Allowed ‐ but must be produced in
accordance with EC‐Directive 92/112
Allowed ‐ but must be produced in
accordance with EC‐Directive 92/112
Allowed ‐ but must be produced in
accordance with EC‐Directive 92/112
Allowed Allowed
White Pigment
Reactive solvents
No 2 butoxyethyl acetate, diethylene glycol methyl ether, ethylene glycol, triethylene glycol
No diethylene glycol methyl ether, ethylene glycol, triethylene glycol
No halogenated
solvents
Plasticizers No phthalic acid
derived plasticisers allowed
No phthalic acid derived plasticisers
allowed
No phthalate derivatives or
organophosphates
The total softener content must not exceed 1g per litre.
Not allowed: Butyl benzyl
phthalate, Diethyl phthalate
Di‐n‐butyl phthalate, Di‐2‐ethylhexyl
phthalate
No phthalates No phthalates
APEOs No alkylphenol ethoxylates
No alkylphenol ethoxylates
None allowed None allowed No Alkylphenol, Nonyl phenol, 4‐octylphenol
None allowed None allowed
Aromatic hydrocarbons
Up to 100 ppm impurities are
allowed
Up to 100 ppm impurities are
allowed
Solvent‐based paints: up to 10 g/l Water‐based: up to 1g/l (except non emulsions: up to
10g/l)
No more than 0.5% by weight
No more than 0.5% by weight
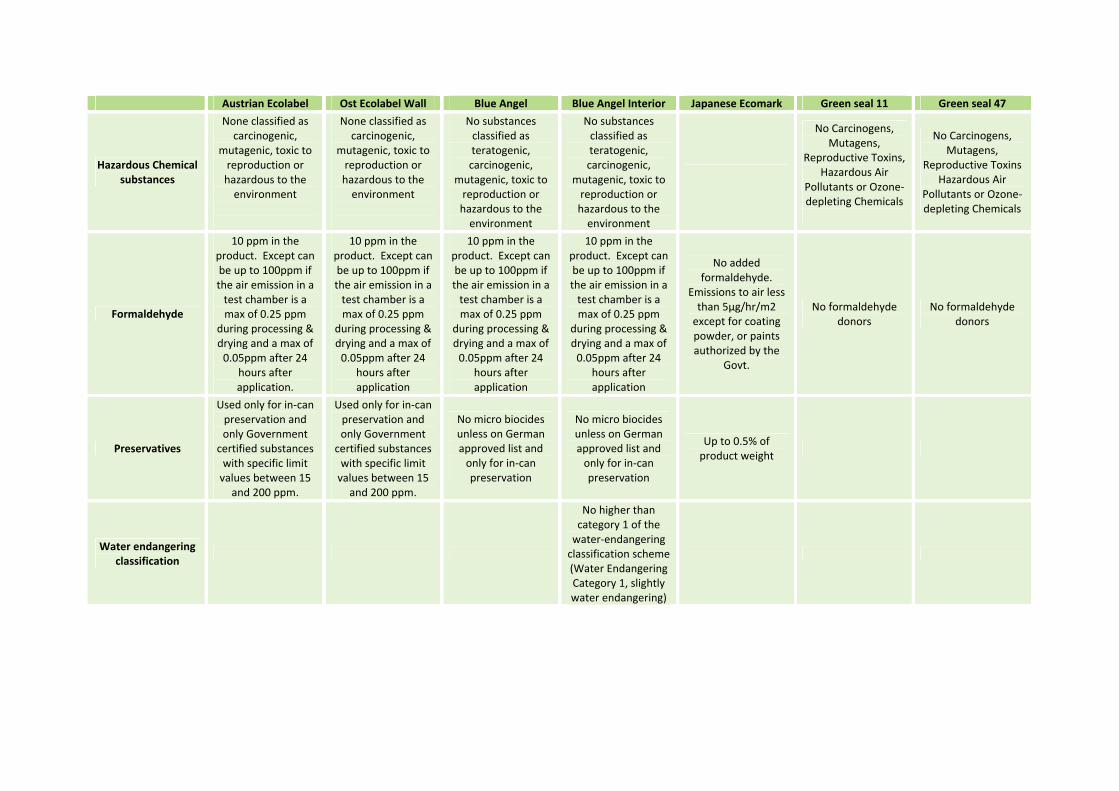
Austrian Ecolabel Ost Ecolabel Wall Blue Angel Blue Angel Interior Japanese Ecomark Green seal 11 Green seal 47
Hazardous Chemical substances
None classified as carcinogenic,
mutagenic, toxic to reproduction or hazardous to the environment
None classified as carcinogenic,
mutagenic, toxic to reproduction or hazardous to the environment
No substances classified as teratogenic, carcinogenic,
mutagenic, toxic to reproduction or hazardous to the environment
No substances classified as teratogenic, carcinogenic,
mutagenic, toxic to reproduction or hazardous to the environment
No Carcinogens, Mutagens,
Reproductive Toxins, Hazardous Air
Pollutants or Ozone‐depleting Chemicals
No Carcinogens, Mutagens,
Reproductive Toxins Hazardous Air
Pollutants or Ozone‐depleting Chemicals
Formaldehyde
10 ppm in the product. Except can be up to 100ppm if the air emission in a test chamber is a max of 0.25 ppm
during processing & drying and a max of 0.05ppm after 24
hours after application.
10 ppm in the product. Except can be up to 100ppm if the air emission in a test chamber is a max of 0.25 ppm
during processing & drying and a max of 0.05ppm after 24
hours after application
10 ppm in the product. Except can be up to 100ppm if the air emission in a test chamber is a max of 0.25 ppm
during processing & drying and a max of 0.05ppm after 24
hours after application
10 ppm in the product. Except can be up to 100ppm if the air emission in a test chamber is a max of 0.25 ppm
during processing & drying and a max of 0.05ppm after 24
hours after application
No added formaldehyde.
Emissions to air less than 5µg/hr/m2 except for coating powder, or paints authorized by the
Govt.
No formaldehyde donors
No formaldehyde donors
Preservatives
Used only for in‐can preservation and only Government certified substances with specific limit values between 15 and 200 ppm.
Used only for in‐can preservation and only Government certified substances with specific limit values between 15 and 200 ppm.
No micro biocides unless on German approved list and only for in‐can preservation
No micro biocides unless on German approved list and only for in‐can preservation
Up to 0.5% of product weight
Water endangering classification
No higher than category 1 of the water‐endangering classification scheme (Water Endangering Category 1, slightly water endangering)

Austrian Ecolabel Ost Ecolabel Wall Blue Angel Blue Angel Interior Japanese Ecomark Green seal 11 Green seal 47
Packaging
No use of halogenated organic based plastics, re‐sealable. No sprays.
No use of halogenated organic based plastics, re‐sealable. No sprays.
Containers shall be returnable.
Containers shall be lead‐free metal cans of recyclable design.
Containers are collected and recycled.
Doesn’t apply to certain categories
No aerosols
A minimum of 20% recovered material content, except if manufacturer take‐back programme for recycling in place Heavy metals and phthalates can’t be used unless part of recovered material.
No aerosols.
A minimum of 25% recovered material content, except if manufacturer take‐back programme for recycling in place Heavy metals, phthalates,
Bisphenol A, and chlorinated
compounds can’t be used unless part of recovered material.
No aerosols.
Disposal Take back and
recovery/recycling system
Take back and recovery/recycling
system Encourage recycling Encourage recycling
Fitness for use
All claims are tested according to instructions.
Standard tests for adhesion, ductility, coverage and dry film thickness etc.
All claims are tested according to instructions.
Standard tests for adhesion, ductility, coverage and dry film thickness etc.
All claims are tested according to instructions.
Standard tests used.
All claims are tested according to instructions.
Standard tests used.
Various tests according to
standards specified dependent on prospective use
Various tests according to use, in accordance with
specified standards:
Various tests according to use, in accordance with
specified standards:
Nano materials
Special attention using Swiss
categorisation of risks
Special attention using Swiss
categorisation of risks
Production Waste management systems required in production facility
Waste management systems required in production facility
End user information
Expiry date and %age solvents
Expiry date and %age solvents
Instructions on use
etc.
Instructions on dosage and use
online and in print format
Instructions on dosage and use
online and in print format
Residual monomers Limited to max 5% of
binder

Austrian Ecolabel Ost Ecolabel Wall Blue Angel Blue Angel Interior Japanese Ecomark Green seal 11 Green seal 47
Anti‐fouling ingredients
Triphenyl tins and tributyl tins not
allowed
Triphenyl tins and tributyl tins not
allowed
Triphenyl tins and tributyl tins not
allowed
Irritant components No components labelled Xi and C
Other
No Tetradecane, Acetaldehyde
No
chlorofluorocarbon (CFC5s), specified
halogenated hydrocarbons, other
CFCs, carbon tetrachloride,
trichloroethane and alternatives for
chlorofluorocarbon.
No 1,2‐dichlorobenzene
No 1,2‐dichlorobenzene