Embed Size (px)
Citation preview

March 2011
Revised BART Cost Effectiveness Analysis for Tail-End Selective Catalytic Reduction
at the Basin Electric Power Cooperative
Leland Olds Station Unit 2
Final Report
Prepared for
U.S. Environmental Protection Agency Region 8 Air Quality Planning Unit
1595 Wynkoop Street Mail Code: 8P-AR
Denver, CO 80202-1129
Prepared by
Phyllis Fox, Ph.D., PE (Consultant)
RTI Project Number 0209897.004.095

TABLE OF CONTENTS
I. INTRODUCTION AND SUMMARY
II. COSTING METHOD
III. REVISED COST EFFECTIVENESS ANALYSIS
A. CAPITAL COST
1. SCR Capital Cost
2. Sorbent Injection System
3. Advanced Separate Overfire Air (ASOFA)
B. OPERATING AND MAINTENANCE COSTS
1. Levelized O&M Costs
2. Catalyst Replacement Costs
a. Ash and Poisons b. Catalyst Lifetime c. Number of Catalyst Layers d. Time Value of Money e. Unit Catalyst Cost f. Catalyst Volume g. Catalyst Changeout Time
3. Cost of Utilities And Supplies
a. Ammonia b. Natural Gas c. Power
4. Capacity Factor
C. NOx EMISSION REDUCTION
D. COST EFFECTIVENESS SUMMARY
2

I. INTRODUCTION AND SUMMARY
A cost effectiveness analysis evaluates the cost of controlling pollution in dollars per ton of pollutant removed. In response to a request from the North Dakota Department of Health (NDDH), Sargent & Lundy prepared a cost effectiveness analysis to control nitrogen oxides (NOx) emissions from Basin Electric Power Cooperative's (BEPC's) Leland Olds Unit 2 using tail-end selective catalytic reduction. l This analysis evaluated five options for tail-end SCR with reported costs ranging from $4, 170/ton to $5,976/ton.2
North Dakota, in tum, used Sargent & Lundy's analysis to make a Best Available Retrofit (BART) determination for Leland Olds Unit 2. North Dakota concluded that tail-end SCR is technically feasible but eliminated it because the cost effectiveness and incremental cost of SCR were excessive.3
,
I reviewed the Sargent & Lundy cost effectiveness analysis and supporting draft Excel spreadsheets4 and prepared a revised cost effectiveness analysis for both SCR alone and SCR plus advanced separated overfire air (ASOFA), correcting errors I found. I evaluated SCR + ASOFA combined because this is the primary option that the Sargent & Lundy analysis considered. The ASOFA was installed in November 2009. Thus, I also separately determined the cost effectiveness of SCR alone. My review was hampered by the lack of support for many of the assumptions in the Sargent & Lundy analysis. I estimate the cost effectiveness of a tail end SCR plus ASOFA at Leland Olds Unit 2 to be about $1 ,954/ton and of SCR alone, after ASOFA is installed, to be $2,609/ton. My revised cost analysis is compared to Sargent & Lundy's in Exhibit 1.
II. COSTING METHOD
Cost effectiveness, measured in dollars per ton of pollutant removed, is calculated according to the EPA Air Pollution Control Cost Manual or "Cost Manual",s as stipulated in the BART Guidelines. While use of the BART guidelines is required for power plants
lLetter from Cris Miller, Senior Environmental Project Administrator, Basin Electric Power Cooperative, to Terry L. O'Clair, North Dakota Department of Health, Attaching Letter from William DePriest, Senior Vice President, Environmental Services, to Cris Miller, Re: BART Evaluation Update - Tail End SCR, May 27, 2009 (5/27/09 S&L Cost Analysis).
2 5/27/09 S&L Cost Analysis, Table 2.5-5.
3 North Dakota Department of Health (NDDH), BART Determination for Leland Olds Station Units I and 2, undated.
4 Email fromGailFallon.EPARegion8.toPhylJisFox.Re: Sargent & Lundy Spreadsheets for Leland Olds, February 8, 20 10. The attached spreadsheets are referred to in this report as the "Sargent & Lundy Excel Spreadsheets." There are three, captioned as follows: (I) low-high dust scr-Ieland 0lds2 - Sens2-cat Iife_0521 09.xls; (2) low-high dust scr-Ieland 0lds2 - Sens2-cat life.xls; (3) low-high dust scr-Ieland 0lds2 Sens2-cat life_05209.xls. These were produced in response to an EPA Section 114 request.
5 U.S. EPA, EPA Air Pollution Control Cost Manual, Report EPA/452/B-02-001, 6th Ed., January 2002 ("Cost Manual"), The EPA Air Pollution Control Cost Manual is the current name for what was previously known as the OAQPS Control Cost Manual, the name for the Cost Manual in previous (pre-2002) editions of the Cost Manual.
3

with a capacity greater than 750 MW, the EPA encourages States to use the guidelines for all BART determinations to assure uniformity in making cost effectiveness determinations.6 A control technology is considered to be "cost effective" if it falls within a reasonable range of cost-effectiveness estimates. The Cost Manual sets out both a general costing procedure and specific methods for individual pollution control methods. Sargent & Lundy failed to follow the general costing procedure which has been used for decades for regulatory cost effectiveness analyses.
Cost effectiveness determinations include several steps. First, the capital cost is estimated and annualized using a capital recovery factor. Second, the annual operating and maintenance (O&M) costs are estimated. Third, these costs are summed and divided by the tons of pollutant removed.
Cost effectiveness is determined by comparing annual cost per ton of pollutant removed for the source of interest to the range of cost effectiveness values for other similar permit decisions. If a given cost effectiveness value falls within the range of costs borne by others, it is per se cost effective unless unusual circumstances exist at the source.7 Thus, cost effectiveness is a relative determination, based on costs borne by other similar facilities. To compare costs among units, a level playing field must be established by following the same cost rules in each determination.8 The Sargent & Lundy cost estimating method deviates from the standard procedure developed by EPA to establish the range of acceptable cost effectiveness values. Thus, comparison of Sargent & Lundy's cost effectiveness values with those estimated by others who did follow the Manual is meaningless.
In evaluating cost effectiveness, it is important that a consistent set of rules be used. These rules are set out in guidelines promulgated by EPA for determining BART9
in Appendix Y to Part 51, "Guidelines for BART Determinations Under the Regional Haze Rule." These Guidelines include methods to determine both cost and cost effectiveness. For cost analyses, the Guidelines stipulate: "In order to maintain and improve consistency, cost estimates should be based on the OAQPS Cost Control Manual, where possible."lo While some SCR-specific design parameters and estimating methods in the Cost Manual may not be applicable to tail-end SCR, the cost methodology and accounting practices should be followed using site specific information where available.
670 FR 39108 (July 6, 2005).
7 70 FR 39168 (July 6, 2005).
8 See discussion of this issue in: Letter from Andrew M. Gaydosh, Assistant Regional Administrator, EPA Region 8, to Terry O'Clair, Director, Division of Air Quality, North Dakota Department of Health, Re: EPA's Comments on the North Dakota Department of Health's April 2010 Draft BACT Detennination for NOx for the Milton R. Young Station, May 10,2010, pp. 14-16: ("The standard approach is outlined in the Control Cost Manual, so that comparisons of cost-effectiveness can be made with other projects nationally.").
9 See, e.g., 70 FR 39158 (July 6, 2005) ("States must follow the guidelines in making BART detenninations on a source-by-source basis for 750 megawatt (MW) power plants...").
10 70 FR 39166 (July 6, 2005).
4
The purpose of the BART Guidelines is to prepare a regulatory cost estimate that allows comparison across multiple units. This estimate is expressed in real or constant dollars, less inflation. Consistency among analyses performed across the United States is essential to establish cost effectiveness. Sargent & Lundy violated these guidelines by including projects that are not required for a retrofit SCR at Leland Olds (sorbent injection system); extrapolating capital costs from inflated unit capital cost; by using levelized O&M costs; and by using excessively high unit cost for utilities and commodities, among others.
These deviations from standard practice make it appear that the cost to control NOx using tail-end SCR at Leland Olds is higher than at other similar sources. However, these inflated costs are due to the costing method, not to any unique circumstances at Leland Olds Unit 2 that make SCR unusually costly. While a tail-end SCR can result in higher costs than a conventional high-dust installation, those costs are explicitly accounted for in the analysis that follows.
III. REVISED COST EFFECTIVENESS ANALYSIS
The following sections identify some of the sources of overestimation in the cost analysis in the May 27, 2009 Sargent & Lundy Cost Analysis. I I This analysis estimated the cost effectiveness in dollars per ton ($/ton) for five separate tail-end SCR cases. These alternatives varied capital cost, catalyst life, natural gas cost, and ammonia cost (Alternatives E-I) for SCR plus ASOFA. My revised cost analysis is presented in Exhibit 1. My analysis modifies draft Excel spreadsheets provided by Sargent & Lundy in response to EPA's Section 114 request. My analysis is found in Exhibit 1a, Column E, Fox Revised Cost for SCR + ASOFA. The Sargent & Lundy cost options are found in Exhibit 1, Columns F - J, labeled Cases I through E. I also prepared a cost analysis for SCR alone, as ASOFA is already installed, which is the current situation.
The 5/27/09 Sargent & Lundy Cost Analysis provided to NDDH reports only lump sum capital and operating costs without any supporting calculations. It is not possible to determine how the cost effectiveness values were derived from the information in this letter report.
In January 2011, Sargent & Lundy provided Excel spreadsheets in response to an EPA Section 114 request. 12 These spreadsheets disclose the formulas and calculations used to generate the cost information in the 5/27/09 Sargent & Lundy Cost Analysis. was able to rearrange and modify these spreadsheets to yield cost effectiveness values
115/27/09 S&L Cost Analysis, Tables 2.5-1 to 2.5-5.
12 Letter from Stephen S. Tuber, Assistant Regional Administrator, EPA Region 8, to William DePriest, Senior Vice President, Environmental Services, Sargent & Lundy LLC Re: Request for Information for Basin Electric's Leland Olds Station in North Dakota Pursuant to Section 114 of the Clean Air Act, December 6, 2010, p.l: (Provide all calculations, formulas, and methodologies, including electronic spreadsheet files, used to generate the costs presented in the Sargent & Lundy LLC letter to Basin Electric Power Cooperative dated May 27,2009 on the subject of "BART Evaluation Update - Tail End SCR.").
5
I

that agree with those in the 5/27/09 Cost Analysis sent to NDDH, rounded to two significant figures. This spreadsheet is Exhibit 1. I was unable to match the 5/27/09 analysis exactly (compare rows 80 and 81) due to differences in rounding methods.. These spreadsheets are the basis for much of my discussion below as they contain underlying calculations that are missing from the 5/27/09 Sargent & Lundy Cost Analysis. However, even with the spreadsheets, many assumptions remain unsupported.
A. CAPITAL COST
In the selective catalytic reduction process or SCR, the gas stream is passed through a catalyst bed in the presence of ammonia to reduce NOx to nitrogen gas and water. The process is termed "selective" because the ammonia preferentially reacts with NOx rather than other components in the flue gas. A catalyst is used to enhance the reaction between NOx and ammonia. The SCR can be located in three places in the gas stream: (l) high dust, hot-side at the outlet of the boiler where dust loadings are high; (2) low dust after the particulate control device where dust loadings are low; and (3) tail end, at the tail end of the plant, between the S02 scrubber and the stack. 13 This analysis assumes the tail-end location (Fig. 1), based on Sargent & Lundy's cost analysis. This location is preferable in this case as it minimizes the amount of ash and catalyst poisons that would otherwise be present in the flue gases, thus increasing catalyst life and decreasing operating costS.1 4
13 McIlvaine, Next Generation SCR Choices - High-Dust, Low-Dust and Tail-End, FGD & DeNOx Newsletter, no. 369, January 2009.
14 See, e.g., Gerd Beckman and Clayton A. Erickson, Operating Experience and Future Challenges with SCR Installations, p. 4 ("The main advantage of this arrangement [tail end] is the considerably smaller loss of activity over the working life compared to the high dust catalysts, because many catalytic poisons such as arsenic, alkali metals, and alkaline earth metals are removed in the upstream flue gas cleaning stages."), Power-Gen Intemational2000, November 14,2000, Available at: http://www.babcockpower.com/pdf/rst170.pdf
6

Figure 1. Tail-End SCR Arrangement (EPA/452/B-02/00l)
tJ,0ILER i
The SCR consists of a metal frame placed in the flue gas path that is stuffed with hundreds of modules or blocks of catalyst, each with many openings to allow the gas to pass through. The size of the openings is called the pitch. The catalyst consists of an inert substrate impregnated with "active" elements such as vanadium, tungsten, and molybdenum. The ammonia is injected into the flue gas ahead of the SCR to accelerate the reaction. A small amount of the ammonia does not react with NOx and slips through the catalyst. This ammonia is known as "ammonia slip."
Installed capital cost was estimated by Sargent & Lundy from the sum of several components: the cost of the SCR combined with advanced separated overfire air (ASOFA), and in some scenarios, an additional cost for a sorbent injection system. These costs were rolled into a single unit capital cost expressed in dollars per kilowatt of capacity. The SCR cost is overstated, the sorbent injection system is not required, and the ASOFA is already installed.
A.I SCR Capital Cost
The 5/27/09 Sargent & Lundy Cost Analysis reports a capital cost range of$165.8 to $170.8 million for installed capital costs of SCR + ASOFA in 2009 dollars. IS These costs were estimated from a lump sum unit capital cost estimate expressed in dollars per kilowatt of electricity generated. These costs are overestimated based on costs reported for other similar installations. However, I am not able to determine why as Sargent & Lundy did not support their unit capital cost estimate. Equipment (e.g., reactor housing, ducts, bypass, ammonia injection system, sonic horns, etc) and installation costs which are commonly broken out and separately costed are not identified. The following sections discuss costs for other similar retrofits and discuss one component of those costs, sorbent injection, that should not have been included.
15 5/27/09 S&L Cost Analysis, Table 2.5-2.
7
The capital cost of the SCR in combination with advanced separated overfire air (ASOFA) and sorbent injection (SI) in the 5/27/09 Sargent & Lundy Cost Analysis was estimated by multiplying the generating capacity of 440 MW by a unit capital cost factor that ranges from $376/kW to $387/kW in 2009 dollars.!6 These costs include the cost of a sorbent injection system (387-376=$11IkW) and ASOFA ($26IkW)Y The SCR taken alone is $3501kW in 2009 dollars18 or $373/kW in 2010 dollars.!9 This section compares the SCR unit capital cost in 2010 dollars with the cost of other SCR retrofits. As demonstrated below, a unit cost of $3 73/kW for SCR alone is high for the subject application.
Five industry studies conducted between 2002 and 2007 have reported the installed unit capital cost of SCRs, or the costs actually incurred by owners, to range from $79/kW to $3161kW in 2010 dollars. These studies and other SCR cost data are reviewed below. Costs are escalated to 2010 dollars using the Chemical Engineering Plant Cost Index ("CEPCI") as reported in Chemical Engineering. These studies show actual capital costs are lower than estimated by Sargent & Lundy for Leland Olds ($373/kW) for SCR alone.
The first study evaluated the installed costs of more than 20 SCR retrofits from 1999 to 2001. The installed capital cost ranged from $112 to $250/kW, converted to 2010 dollars?O The second survey of 40 installations at 24 stations reported a cost range of$80 to $256/kW, converted to 2010 dollars?! The third study, by the Electric Utility Cost Group, surveyed 72 units totaling 41 GW, or 39% of installed SCR systems in the U.S. This study reported a cost range of $125/kW to $277lkW, converted to 2010 dollars.22 A fourth study, presented in a course at PowerGen 2005, reported an upper
16 The 5/27/09 S&L Cost Analysis states on p. 9 that capital costs were calculated from $387/kW. However, $170,800/440 MW = $388/kW was actually used. This factor includes the SCR, ASOFA, and a sorbent injection system.
175/27/09 S&L Cost Analysis, Table 2.5-1 and Sargent & Lundy Excel Spreadsheet (which used $350/kW).
L8 5/27/09 S&L Cost Analysis, p. 4 (2009 dollars).
19 The cost ofjust SCR, escalated to 2010 dollars, based on the most recent CEPCI for October 2010 (Chemical Engineering. January 20 II, p.60) is: (556.2/521.9)(350) = $373/kW.
20 Bill Hoskins, Uniqueness of SCR Retrofits Translates into Broad Cost Variations, Power Engineering, May 2003. Available here: http://www.powergenworldwide.com/index/display/articledisplay/I 76832/articles/powerengineering/volume-I 07/issue-5/features/uniqueness-of-scr-retrofits-trans lates-into-broad-costvariations.html. The reported range of $80 to $160/kW was converted to 2010 dollars ($112 - $250/kW) using the ratio ofCEPCI in October 2011 to 2002: 556.2/395.6.
211. Edward Cichanowicz, Why are SCR Costs Still Rising?, Power, April 2004; Jerry Burkett, Readers Talk Back, Power, August 2004. The reported range of $56/kW - $185/kW was converted to 2010 dollars ($80 - $256/kW) using the ratio of CEPCI for October 2010 to 1999 (556.2/390.6) for lower end of the range and 2010 to 2003 (556.7/401.7) for upper end of range, based on Figure 3.
22 M. Marano, Estimating SCR Installation Costs, Power, JanuarylFebruary 2006. The reported range of $100 - $221 /kW was converted to 20 I0 dollars ($125 - $277/kW) using the ratio of CEPCI for October
8

bound range of$190/kW to $214/kW, converted to 2010 dollars.23 A fifth summary study reports recent applications that were installed in 2006 and 2009. The costs for these units, converted to 2010 dollars, ranges from $195/kW to $330/kW. 24
Thus, the overall range for these industry studies is $80/kW to $330/kW in 2010 dollars. The upper end of this range is for highly complex retrofits with severe space constraints, such as Cinergy's Gibson Units 2 - 4. Gibson, a highly complex, spaceconstrained retrofit in which the SCR was built 230 feet above the power station using the largest crane in the world,25 only cost $252/kW in 2010 dollars.26 The Leland aIds site is not similarly constrained.
Other recent estimates not included in these surveys confirm that the Leland aIds SCR capital costs are overestimated. The unit capital cost for the St. Johns River Power Park (SJRPP) SCR that burns a very challenging blend ofcoke/coal is $188/kW in 2010 dollars.27 Wisconsin Electric estimated the cost to retrofit SCR on Oak Creek Units 5-8 to be $187/kW28 for a cold-side SCR. This cost was certified in July 2008 for construction by the Wisconsin Public Services Comrnission.29 The comparable cost for a tail-end SCR is $175/kW. Wisconsin Power and Light estimated the cost to retrofit SCR
20 I0 to 2004: 556.2/444,2. Available here: http://findarticles.com/p/articles/mi_qa5392/is_200602/ai_n21409717/print?tag=artBody;coll.
23 PowerGen 2005, Selective Catalytic Reduction: From Planning to Operation, Competitive Power College, by Babcock Power, Inc. and LG&E Energy, December 2005. The reported range of $160 $180/kW) was converted to 2010 dollars ($190 - $214/kW) using the ratio ofCEPCI for October 2010 to 2005 (556.2/468.2).
241. Edward Cichanowicz, Current Capital Cost and Cost-Effectiveness of Power Plant Emissions Control Technologies, June 2007, pp. 28-29, Figure 7-1. The reported range of $175 - $225/kW installed in 2006 was converted to 20 I0 dollars ($195 - $250/kW) using the ratio of CEPCI for October 2010 to 2006 (556.2/499.6). The 2009 value of $300/kW was converted to October 2010 dollars ($330/kW) using the ratio ofCEPCI for July 2010 to 2009 (556.2/521.9).
25 Bob Ellis, Standing on the Shoulder of Giants, Modem Power Systems, July 2002.
26 McIlvaine, NOx Market Update, August 2004. SCR was retrofit on Gibson Units 2-4 in 2002 and 2003 at $179/kW. Assuming 2002 dollars, this escalates to ($1 79/kW)(556.2/395.6) = $252/kW. http://www.mcilvainecompany.com/sampleupdateslNoxMarketUpdateSample.htm.
27 Email from Norem to Kordzi, October 21, 20 I0, PNM Responses to Follow-Up Questions from October 14,2010 Conference Call Regarding BART Cost Estimate, Response to Question 7: (556.2/499.6)($228,092,9 14)(12(675MW)(1 000)) = $188/kW.
28 Wisconsin Electric Power Company's Application to Install Wet Flue Gas Desulfurization and Selective Catalytic Reduction Facilities and Associated Equipment on Oak Creek Power Plant Units 5, 6, 7 & 8 for Control of Sulfur Dioxide and Nitrogen Oxide Emissions, Appendix C, Emission Reduction Study, Volume I, Addendum August 20,2007. Unit cost for cold -side unit = ($190,500,000/1,135,000 kW)(556.2/499.6) = $187 kW. Unit cost for tail-end unit = ($178,600,000/1,135,000 kW)(556.2/499.6) = $175/kW.
29 Certificate and Order, Application to Install Wet Flue Gas Desulfurization and Selective Catalytic Reduction Facilities and Associated Equipment on Oak Creek Power Plant Units 5, 6, 7 & 8 for Control of Sulfur Dioxide and Nitrogen Oxide Emissions, Case 6630-CE-299, July 10,2008. Available here: http://www.we-energies.com/home/OCPP_approvalPSCWOrder.pdf.
9

on the 430-MW Edgewater Unit 5 to be $324/kW in January 2008,30 which escalates to $343/kW in 2010 dollars?! Similarly, American Electric Power (AEP) estimated that the average capital cost to install SCRs to remove 85%-93% of the NOx from many of its units was $162/kW.32
This data indicates that Sargent & Lundy's estimates of capital cost to retrofit SCR at Leland Olds ($373/kW in 2010 dollars) is higher than actual installed cost for existing retrofit SCRs, including those with extreme retrofit difficulty and those requiring flue gas reheat. Thus, the resulting cost effectiveness is conservative in favor ofBEPC. It is not possible to further comment on why it is excessively high as this unit cost is not supported in the record. Thus, my cost effectiveness values reported below are upper bounds, i.e., cost effectiveness is more favorable than my estimates suggest.
While there are issues that may elevate operating costs of an SCR at Leland Olds compared to some sites, the issues are not more costly than many existing complex retrofits at space constrained site using difficult fuels such as coke and PRB coal. Further, the SCR equipment at Leland Olds is conventional, i.e., reactor housing, ammonia injection system, ductwork modifications. Thus, the capital costs to retrofit SCR on a lignite-fired boiler should be well within the range ofcapital costs for other retrofits. As discussed below, catalyst volume and lifetime are key cost drivers, which, when properly calculated, will reduce both capital and operating costs.
A.2 Sorbent Injection System
Sargent & Lundy claims that an SCR on Leland Olds might trigger New Source Review permitting for sulfuric acid mist, requiring sorbent injection. They evaluated sorbent inJection in their alternatives H and I and assumed it would cost $5,000,000 or $11 /kW.3 Their sulfuric acid mist calculations, which are unsupported, assume that 1% of the sulfur dioxide (S02) exiting the wet scrubber would be converted to sulfuric acid mist (SAM) in a tail-end SCR,34
An SCR catalyst does convert some of the S02 in flue gases to sulfur trioxide (S03). The sulfur trioxide combines with water in the exhaust gases and is converted into very small liquid droplets of sulfuric acid (H2S04), called sulfuric acid mist or SAM,
30 Wisconsin Power & Light Co., Certificate of Authority Application, Edgewater Generating Station Unit 5 NOx Reduction Project, Project Description and Justification, November 2008, PSC Ref#: 105618, p. 11. The unit cost was calculated from the total project cost minus escalation divided by gross generating capacity or: ($153,944,000 - $14,695,000)/430 MW = $323.8!kW.
31 Edgewater SCR costs escalation to 2010 dollars: ($324!kW)(556.2/525.4) = $343/kW.
32 AEP, 2008 Fact Book, 43rd Financial Conference, Phoenix, AZ, pdf 103. Available here: http://www.aep.com/investors/present/documents/2008EEI-Fact-Book.pdf.
33 This is estimated by subtracting the capital cost of Cases E, F, and G (with no sorbent injection) from cases Hand 1(with sorbent injection). This cost is included in the unit capital cost, i.e., $387!kW for cases H and I and $376!kW for cases E, F, and G or ($387!kW - $376!kW)440,000 kW = $4,840,000.
345/27/09 S&L Cost Analysis, p. 6.
10
before it leaves the stack.35 The extent of this oxidation depends on the catalyst formulation and the SCR operating temperature. 36 Low conversion catalysts capable of achieving an S02 to S03 conversion as low as 0.1 % per layer of catalyst in the high dust, hot (>650 F) position are available.3? Tail-end SCRs operate at much lower temperatures, 525 F to 600 F, than high dust SCRs, which significantly reduces the conversion of S02 to S03.38
The S02 to S03 conversion rate is an SCR design parameter that is typically specified to assure sulfuric acid mist emissions remain low. Thus, if sulfuric acid mist were a concern, a low conversion catalyst could be specified. For example, the design basis could specify a total S02 to S03 conversion of 0.2% with three layers installed. Therefore, even assuming Sargent & Lundy's calculations, the sulfuric acid mist emissions would drop from 24.1 tonlyr based on 1% conversion to 4.8 tonlyr based on 0.2% per layer. This is well below the significance threshold of 7 tonlyr. Thus, I have not included any costs for a sorbent injection system in my revised cost analysis. (Ex. 1, Cells E51, E74)
A.3 Advanced Separated Overfire Air (ASOFA)
The Sargent & Lundy cost analyses include the cost of ASOFA in each of its five 39 cases. The ASOFA was installed in November 2009. Thus, I also determine the cost
effectiveness of SCR by itself. These calculations are included in Exhibit 1b.
35 R.K. Srivastava and others, Emissions of Sulfur Trioxide from Coal-Fired Power Plants, J. Air & Waste Manage. Assoc., June 2004, v. 54, pp. 750-762, p. 750; EPRl, Estimating Total Sulfuric Acid Emissions from Stationary Power Plants, Version 2010a, Technical Update, April 2010, p. 3-3; 1.1. Gmitro and T. Vermeulen, Vapor-Liquid Equilibria for Aqueous Sulfuric Acid, Am. Inst. Ch. Eng. Journal, v. 10, no. 5, Sept. 1964, pp. 740-76.
36 H. Gutberlet and others, S02 Conversion Rate of DENOX Catalysts, VGB Kraftwerkstechnik, v. 70, no. 11, 1990, pp. 826 - 834; R.K. Srivastava and others, Emissions of Sulfur Trioxide from Coal-Fired Power Plants, J. Air & Waste Manage. Assoc., v. 54, June 2004, pp. 750-762.
37 DNx™ _ Topsoe SCR DeNOx Catalysts Oxidation of S02 into S03 ("Topsoe has demonstrated superior performance together with low S02 oxidation under industrial conditions and has provided guarantees for S02 oxidation down to 0.1 %."); Isato Morita and others, Development and Operating Results of Low S02 to S03 Conversion Rate Catalyst for DeNOx Application; Haldor Topsoe, DNXTopsoe SCR DeNOx Catalysts Oxidation of S02 into S03, Accessed 1/1/11 at http://www.topsoe.comlbusiness areaslflue and waste gas/~/media/PDF%20files/Scr denox/Topsoe scr oxidation.ashx; Anthony C. Favale and others, Application and Operating Results of Low S02 to S03 Conversion Rate Catalyst for DeNOx Application at AEP Gavin Unit 1, Proceedings of the 2006 Environmental Controls Conference, U.S. Department of Energy, National Energy Technology Laboratory.
38 Selective Catalytic Reduction (SCR) Technical Feasibility for M.R. Young Station, Appendix D, Vendor Emails on North Dakota Lignite, Email from Flemming Hansen, Haldor Topsoe, to Hans Hartenstein, Evonik, Re: Tail-end SCR, June 24, 2008 ("At the low operating temperature expected at the tail-end position the S02 oxidation will be negligible.").
39 5/27/09 S&L Cost Analysis, pp. 6-7.
11

B. OPERATING AND MAINTENANCE (O&M) COSTS
Sargent & Lundy prepared a "hypothetical" cost estimate that evaluated a range for several operational costs, including the cost of catalyst replacement, ammonia, and natural gas. The upper ends of these ranges are major drivers in overestimating the cost effectiveness of SCR at Leland Olds.
B.1 Levelized O&M Costs
In its 5/27/09 Cost Analysis, Sargent & Lundy estimated the annual O&M cost as the sum of certain fixed and variable expenses discussed below. The annual total was then levelized using methods laid out in the original BEPC BART Determination Study. This method takes into account the inflation rate, the discount rate, and the equipment life. The sum of fixed and variable O&M costs was levelized by multiplying it by the O&M cost factor of 1.19314.40 In other words, O&M costs were increased by 20% to account for inflation and other future events.41
The Cost Manual approach, recommended by the BART Guidance to estimate cost effectiveness, explicitly excludes future escalation as cost comparisons are made on a current real dollar basis. Inflation is not included in cost effectiveness analyses as they rely on the most accurate information available at current prices and do not try to extrapolate those prices into the future. 42 I did not levelize O&M costs. (Ex. 1, Cell E45).
B.2 Catalyst Replacement Costs
The catalyst in an SCR is deactivated over time by chemicals present in the flue gas stream that block the catalyst pores and poison the active sites. Thus, the catalyst must be replaced periodically. The annual cost to replace catalyst is estimated from the number of catalyst layers, the total catalyst volume required to achieve the desired NOx
reduction, the cost per unit volume of catalyst, the catalyst lifetime, and a future worth factor, as explained in the EPA Cost Manual and set out in equations 2.50 to 2.53 therein.
Sargent & Lundy selected values for each ofthese variables that significantly overstate catalyst replacement cost. They used arbitrary and unsupported values for all of the variables required to calculate catalyst replacement cost: (l) a very short catalyst lifetime, 6 months to 1 year; (2) frequent catalyst changeouts, every six months to one year; (3) very large catalyst volume, 530 m3; (4) 2 to 4 weeks to replace the catalyst; (5) a special outage for catalyst replacement, in which the unit is taken off line just to replace catalyst; (6) high unit catalyst cost, $7,500/m3; and (7) ignored the time value ofmoney.43
40 5/27/09 S&L Cost Analysis, Table 2.5-3, note (3).
41 Bums & McDonnell, BART Determination Study for Leland OIds Station Unit I and 2, Basin Electric Power Cooperative, Final Draft, August 2006, Section 1.3.5.
42 See, e.g., Cost Manual, p. 2-36, pdf 50.
43 Sargent & Lundy Excel Spreadsheets and 5/27/09 S&L Cost Analysis, p. 7.
12

These assumptions result in excessive annual cost to replace catalyst, amounting to $4 to $8 million for the catalyst itself (Ex. 1, Row 70) and an additional $7 to $15 million in lost generation (Ex. 1, Row 71). These factors also inflate capital cost, e.g., catalyst volume, and in part account for the overestimate of capital costs discussed above in Section A.l.
The specific assumptions used to estimate catalyst replacement costs are not disclosed in the 5/27/09 S&L Cost Analysis. Rather, they are summed along with ammonia, natural gas and power and reported as total annual O&M cost. Thus, the underlying calculations and assumptions for each component cannot be ascertained without additional information. I figured out some of the underlying calculations and assumptions using the Excel spreadsheets provided by Sargent & Lundy in response to EPA's Section 114 request. The assumptions used in these spreadsheets are inconsistent with standard SCR design procedures and significantly overestimate catalyst replacement cost.
In the following sections, I first explain why the studies and other information relied on by Sargent & Lundy do not support their assumption that large volumes of catalyst must be replaced once to twice a year due to deactivation. Next, I explain why the specific variables they used overestimate catalyst replacement cost. Finally, I recalculate replacement cost in Exhibit 1 by making the following changes to Sargent & Lundy's assumptions: (1) increasing catalyst lifetime from 4,400 hours to 24,000 operating hours; (2) changing the initial catalyst layout to two active layers and one spare; (3) reducing the catalyst volume from 530 m3 to 440 m3
; (4) using a future worth factor of 0.31; (5) reducing the time to replace catalyst from 2 to 4 weeks to 3.6 days; and (6) eliminating catalyst replacement outages. The results of these changes reduce catalyst replacement cost from $11 to $23 million (catalyst + power) estimated by Sargent & Lundy to $342,000 (Ex. 1, Row 70).
a. Ash and Poisons
Sargent & Lundy provided no specific support for its unusual catalyst replacement assumptions, citing "our engineering judgment" and a brief unreferenced overview of alleged ash plugging and alkaline (Na, K, Ca) poisoning due to the composition of North Dakota lignites.44 Some slip stream studies were produced in response to EPA's Section 114 request. 45 Sargent & Lundy apparently interprets these studies as demonstrating that flue gases from North Dakota lignite fired cyclone boilers
44 5/27/09 S&L Cost Analysis, pp. 2-5.
45 See, e.g., Steven A. Benson, Ash Impacts on SCR Catalyst Perfonnance, Slides, February 21, 2006, BEPC_002065; S.A. Benson and others, Ash and Mercury Behavior in SCR Catalysts when Firing Subbituminous and Lignite Coals, Submitted to Fuel Processing Technology, BEPC_003820; S.A. Benson and 1.H. Pavlish, SCR Catalyst Perfonnance in Flue Gases Derived from Subbituminous and Lignite Coals, Fuel Processing Technology, v. 86, no. 5, February 25,2005, pp. 577-613, BPEC_003785; Y. Zheng and others, Deactivation of V205-W03-Ti02 SCR Catalyst at Biomass Fired Power Plants: Elucidation of Mechanisms by Lab- and Pilot-Scale Experiments, Applied Catalysis B: Environmental, v. 83,2008, pp. 186-194, etc.
13
have unique properties that deactivate SCR catalyst much more rapidly than flue gases from other fuels. However, these arguments are refuted by vendors and are not persuasive.
First, these arguments are based mostly on data collected at boiler exits, in the high dust SCR position, which is not proposed for Leland Olds. The SCR at Leland Olds would be located at the tail end, after the electrostatic precipitator and new wet scrubber. These control devices remove the majority ofthe ash and catalyst poisons, allowing a longer catalyst lifetime than suggested in the cited slipstream tests.46 Flue gas composition data collected at Milton R. Young, which has an inefficient old wet scrubber, proves that the amount of submicron alkali aerosols is so small that catalyst deactivation does not occur rapidly.47 Further, any remaining soluble alkaline substances do not poison the catalyst at tail-end SCR operating temperatures. Significant deactivation only occurs if condensed moisture is present at the catalyst surface, i.e., when the catalyst is being cooled down to below the water dew point. This does not happen very often at a base-loaded unit such as Leland Olds and can be prevented by bypassing or buttoning up the SCR reactor during forced outages of a few days.48 Regardless, catalyst vendors have ample experience preventing moisture condensation in SCR catalysts.49
46 See. e.g., 5/30/07 (Alstom) Letter in 5/8/08 Milton R. Young Additional Infonnation, p. 2 (As to high dust SCR, a worst case: "Based on our experience with wood fired units, a hot side ESP is effective in removing the fly ash compounds that result in catalyst poisoning... the fly ash constituents that can poison the catalyst will have been removed from the flue gas stream by the existing ESPs.."), In Additional Infonnation and Discussion of Vendor Responses on SCR Technical Feasibility North Dakota's NOx BACT Determination for Milton R. Young Station Units I & 2, May 8, 2008 (5/8/08 Milton R. Young Additional Infonnation).
47 1/8/10 EPA Comments, Enclosure 2, pp. 24-25 ("As discussed extensively in the Minnkota BACT comments, the actual flue gas composition analysis data measured downstream of the wet FGD at MRYS proves that the amount of submicron alkali aerosols is so small that catalyst deactivation does not occur rapidly and a relatively long catalyst life can reasonably expected (sic) compared to most HDSCR [high dust SCR] installations.");
48 5/6/08 Cochran (CERAM) Email, p. 2 (As to high dust SCR:, a worst case: "Due to the high sodium and iron concentrations it is recommended that a full SCR bypass system be installed. During lay-up periods the catalyst would need to remain warm and dry (above condensing conditions), for instance with an air drying or dehumidification system. This may necessitate the use of a dehumidifier and air lock system to access the reactor."), in 5/8/08 Milton R. Young Additionallnfonnation.
49 Minnkota Power Cooperative, Inc. and Square Butte Electric Cooperative, Additional Information and Discussion of Vendor Responses on SCR Technical Feasibility, North Dakota's NOx BACT Detennination for Milton R. Young Station Units I & 2, Appendix A, Vendor Emails, Email from John Cochran, CERAM Environmental, Inc., to Robert Blakley, Re: Request for Lignite SCR Feasibility Commercial and Technical Infonnation, May 6, 2008 ("Sodium is a catalyst poison. Concerns reported by Dr. Benson regarding high sodium content and fine fume are duly noted, but inadequate evidence is presented that this could be a fatal flaw to application of SCR considering the flawed pitch and resultant pluggage of the catalyst used during the Coyote Station testing [North Dakota lignite]. Sodium is not a poison to catalyst at SCR operating temperatures. Significant deactivation can occur if condensed moisture transports sodium residing at the surface into the catalyst pore structure during outage or layup. CERAM has experience with high sodium applications to substantiate this effect. Important to avoid deactivation from sodium is the need to protect the catalyst from going through a condensation event.")
14
Second, mini tests relied on to desi§n the Leland Olds SCR do not always accurately predict full-scale performance.5 Slipstream1 reactors are susceptible to ash accumulation due to wall effects.51 Turbulence at the inlet of a slipstream catalyst is higher, which exaggerates deactivation rates compared to a full-scale SCR, where flows are laminar. 52 Soot blowers, used to control ash plugging on full-scale SCRs, do not work effectively on small scale tests, allowing ash accumulation. 53 The one study that included North Dakota lignite54 used a pitch that was too small for the ash loading and ash characteristics, causing plugging.55 This study, which collected slip stream samples
50 See, e.g., S. Pritchard and others, Optimizing SCR Catalyst Design and Performance for Coal-Fired Boilers, Presented at EPAIEPRI 1995 Joint Symposium, Stationary Combustion NOx Control, May 16-19, 1995; Steven A. Benson, Ash Impacts on SCR Catalyst Performance, Slides, February 21,2006, BEPC_002065; S.A. Benson and others, Ash and Mercury Behavior in SCR Catalysts when Firing Subbituminous and Lignite Coals, Submitted to Fuel Processing Technology, BEPC_003820; S.A. Benson and lH. Pavlish, SCR Catalyst Performance in Flue Gases Derived from Subbituminous and Lignite Coals, Fuel Processing Technology, v. 86, no. 5, February 25, 2005, pp. 577-613, BPEC_003785; Y. Zheng and others, Deactivation of V205-W03-Ti02 SCR Catalyst at Biomass Fired Power Plants: Elucidation of Mechanisms by Lab- and Pilot-Scale Experiments, Applied Catalysis B: Environmental, v. 83,2008, pp. 186-194, etc.
51 5/6/08 Cochran (CERAM) Email, p. I ("CERAM has experience with the slipstream test reactor used for testing at Baldwin and can confirm that this reactor is susceptible to ash accumulation due to wall effects.") in 5/8/08 Milton R. Young Additional Information.
52 A. Kling and others, Alkali Deactivation of Higher Dust SCR Catalysts used for NOx Reduction Exposed to Flue Gas from 100 MW-scale Biofuel and Peat Fired Boilers: Influence of Flue Gas Composition, Applied Catalysis, 2007; E-mail from Flemming Hanson, HaldorTepsoe, to Phyllis Fox, P.E., Re: Benson et a1. 2008, January 15,2008 ("I believe that when everything becomes more compact you are more sensitive to wall cooling, shorter distances between turns and supports and ammonia injection. That doesn't mean that ash couldn't build up on a full scale SCR as well, but instead of a foot in distance between the turning vanes and the catalyst it may be 20 feet. A lot of ash problems arise because the ash is not hitting the catalyst channels parallel but at an angle. The lee side will build up ash.") 53 5/5/08 Email fromFlemmingHansen.HaldorTepsoe.toRobertBlakleY.Bums&McDonnell.Re: Comments to SCR Technology at MRYS Units 1&2, May 5, 2008 ("It is well known that soot blowing is difficult in pilot scale due to edge effects but also due to the dimensions of the soot blower tubes O. Orifices have to be smaller compared to full scale in order to distribute the soot blower air. As a consequence the soot blower should be moved closer to the catalyst in order to obtain the same dynamic pressure at the catalyst surface which makes it difficult to actually cover the entire catalyst surface."), in 5/8/08 Milton R. Young Additional Information.
54 S.A. Benson and lH. Pavlish, SCR Catalyst Performance in Flue Gases Derived from ·Subbituminous and Lignite Coals, Fuel Processing Technology, v. 86, no. 5, February 25, 2005, pp. 577-613, BPEC 003785.
55 Minnkota Power Cooperative, Inc. and Square Butte Electric Cooperative, Additionallnformation and Discussion of Vendor Responses on SCR Technical Feasibility, North Dakota's NOx BACT Determination for Milton R. Young Station Units I & 2, Appendix A, Vendor Emails, Email from John Cochran, CERAM Environmental, Inc., to Robert Blakley, Re: Request for Lignite SCR Feasibility Commercial and Technical Information, May 6, 2008 ("CERAM has experience with the slipstream test reactor used for testing at Baldwin and can confirm that this reactor is susceptible to ash accumulation due to wall effects. Additionally, the 6 mm pitch Haldor T0psoe catalyst used for the Coyote Station testing [the ND lignite site] was an inadequate choice considering the ash loading and ash characteristics. Considering this choice of catalyst pitch and use of this slipstream reactor the results cannot be assumed to be representative of a full scale application. Based on the ash loading and chemistry for Milton R. Young Units I and 2 we would consider that at least a 7.4 mm pitch catalyst be utilized. A more conservative approach would be to
15

from one lignite (Coyote) and two PRB-fired boilers (Baldwin, Columbia Station), predicted that SCR catalyst at the PRB-fired Baldwin Station would deactivate rapidly.56 Subsequently, a full-scale SCR was installed at Baldwin and has not experienced any of the problems anticipated by the slipstream tests. BEPC and its consultants were aware of this and made their arguments anyway.57
Finally, there is a long history of applicants arguing that SCR is not technically feasible on every new coal that is proposed, dating back to the 1980s. In each case, industry argues that plugging and poisoning will occur due to unique characteristics of its coal. In the early 1990s, U.S. industry argued SCR would not work with "unique" U.S. bituminous coals, in spite of wide-scale, successful SCR application in Japan and Germany.58 Today, there are 100,000 MW of successful SCRs operating on U.S. bituminous coals, including many with high sulfur.
Next, in the late 1990s, industry argued that SCR would be overcome by plugging and poisoning when used on Powder River Basin (PRB) coals, raising many of the same concerns advanced by Sargent & Lundy for North Dakota lignite. The slipstream studies that Sargent & Lundy relies on predict poor performance for PRB coals, just as they do for lignites. However, today, there are over 25,000 MW of SCR installed on PRB coal, starting in 1999 with the New Madrid cyclone boilers (2x660 MW).59 In fact, some of the lowest NOx emissions rates in the industry have been achieved on PRB-coal fired boilers (e.g., Pleasant Prairie, Parish), in spite of industry's dire predictions to the
use either an 8.2 or 9.2 mm catalyst. This could have alleviated the noted test element ash pluggage issues.")
56 S.A. Benson et ai, SCR Catalyst Performance in Flue Gases Derived from Subbituminous and Lignite Coals, Fuel Processing Technology, v. 86, 2005, pp. 577-623.
57 E-mail from Carl Weilert, Bums & McDonnell, to John Shultz, BEPC,Re: B&McD Comments on SCR Presentation, February 17,2006, BEPC_001410 ("Our concern is that the Baldwin Station eventually did install full-scale high-dust SCR, and they seem to be working OK. These slides need to be used to illustrate that there was a significantly worse problem at Coyote than at Baldwin, or else the "opposition" can argue that the slip stream tests are invalid as a predictor of performance of a full-scale SCR.") and S.A. Benson, Ash Impacts on SCR Catalyst Performance, Slides Presented to North Dakota State Health Department, February 21, 2006, p. 19.
58 Leslie L. Sloss and others, Nitrogen Oxides Control Technology Fact Book, Noyes Data Corp., Park Ridge, New Jersey, 1992, Chapter 5; H. Christopher Frey, Engineering-Economic Evaluation ofSCR NOx Control Systems for Coal-Fired Power Plants, Proceedings of the American Power Conference, v. 57-11, April 1995, pp. 1583-1588. 59 5/26/08 Cochran (CERAM) Email, p. I ("The concerns presented are similar in argument to those that were used 10 years ago against the application of PRB for high dust applications. The results of the cited test reactor work for Baldwin and Columbia would even seemingly indicate that the use of high dust SCR on PRB applications would be similarly difficult to an installation on a lignite application. Meanwhile, dating from 1999 starting with the New Madrid project 0 there has been in excess of25,000 MW ofSCR installed on PRB fueled cyclone, wall, and tangential fired units with good success."); Letter from Eric N. Balles, Senior Vice President, Babcock Power Inc., to Glenn Shankle, Executive Director, TCE, Re: Response to SOAH Proposal for Decision, August 30, 2006 ("BPI has been involved in the development and early installation of the first Powder River Basin (PRB) fired SCR installation where many of the same concerns existed for SCR. The patented BPI Delta Wing SCR system was installed and its operation has consistently met or exceeded the NOx reduction guarantee.")
16

contrary due to ash and alkaline poisons, the very culprits pointed to by Sargent & Lundy for North Dakota lignites.
Currently, industry is arguing that SCR is not technically feasible or cost effective on lignite coals, even though there are successful lignite applications in Europe and in the United States on Texas lignites (Sandow 4, Oak Grove 1&2), with more planned (Martin Lake 1-3). In fact, every coal is unique. CouFc0n tests and small scale reactors are commonly used to aid in the design of SCRs. 0 The SCR catalyst is routinely formulated for each unique coal and application. North Dakota lignite is no different. As any coal, North Dakota lignite has unique challenges, but as the vendors indicate, these can be accommodated by proper design and catalyst formulation. 61
b. Catalyst Lifetime
An SCR catalyst must be changed out periodically. The catalyst lifetime is a function of catalyst activity and ammonia slip. As catalyst activity decreases over time, ammonia slip increases until it reaches the design limit, typically 2 ppm, at which point new catalyst is added. Catalyst lifetime is a design parameter that is usually specified by the purchaser and guaranteed by the catalyst vendor for the first three years of operation.62
Sargent & Lundy assumed a catalyst lifetime of 6 months to 1 year, which amounts to about 4,400 hours to 8,700 operating hours.63 This arbitrarily selected and upsupported lifetime is very low for SCR catalyst, which is typically specified to last 16,000 to 24,000 hours for hot-side (or high-ash) SCRs (after the boiler), the worst-case location for catalyst life. In the tail-end position, after ash and catalyst poisons have been significantly reduced by pollution control devices, SCR catalyst lasts 50,000 to over 100,000 hours.64 The erroneously assumed short catalyst lifetime is one ofthe major drivers of Sargent & Lundy's significantly overestimated operating costS.65
60 See, e.g., Noel Rosha and others, St. Johns River Power Park 2 x 670 MW SCR- Designed to Ensure Fuel Flexibility, Mega Symposium, 2008.
61 See, e.g., Letter from Michael G. Phil1ips, Aistom, to Robert Blakley, Bums & McDonnell, Re: Request for SCR Information Milton R. Young Units 1&2 ,May 30, 2007, p. 1 ("ND lignite does create many challenges for SCRs, but even with all those challenges, it is possible to use ND lignite if the system is designed properly ... "), p. 2 ("Fuels high in sodium and potassium require special selection of catalyst, but can be treated by SCR.") in 5/8/08 Milton R. Young Additional Information.
62 Cost Manual, SCR Section, pp. 2-46 - 2-47.
63 5/28/09 S&L Cost Analysis, p. 7.
64 See, for example, vendor e-mails in Appendix D of the NDPH Report: Selective Catalytic Reduction (SCR) Technical Feasibility for M.R. Young Station; McIlvaine, Next Generation SCR Choices - HighDust, Low-Dust and Tail-End, FGD & DeNOx Newsletter, no. 369, January 2009; Hans Hartenstein, Steag's Long-Term SCR Catalyst Operating Experience and Cost, EPRI SCR Workshop, 2005.
65 Sargent & Lundy Spreadsheets
17

The excessively short catalyst lifetimes assumed in the Sargent & Lundy cost analysis are contradicted by vendor proposals for a nearly identical application at the Milton R. Young Station, which bums a similar North Dakota lignite in similar cyclone boilers. An exhaustive review of catalyst lifetime in that case, based on proposals from three separate vendors requested by two separate parties, indicates vendors estimated an initial catalyst lifetime guarantee of 24,000 operating hours with two active and one spare layer of catalyst in the low dust or tail-end position. At the end of the first 24,000 hours, a new third layer of catalyst would be added to the spare or empty layer. The first replacement layer would not be needed for about 88,000 hours or about 11 years of SCR operation.66 Thus, my revised cost analysis assumes a catalyst lifetime of 24,000 operating hours (Ex. l, Cell E4l).
c. Number of Catalyst Layers
The catalyst volume required to achieve a given NOx level is typically divided into layers that can be separately replaced. Most SCR designs include an empty layer that can be filled with catalyst as the need arises. The most common configuration is two active layers with one spare. Initially, two layers are filled with catalyst. The third layer is added at the end ofthe guarantee period, after 24,000 operating hours.
Sargent & Lundy's calculations assume that 100% ofthe catalyst is replaced at the end of very short lifetimes, 6 months to 1 year, and is silent as to layers.67
Apparently, they have assumed one active and no spare layer. This is an overly conservative assumption that is not used to design modem SCRs. The vendor proposals contemplated two active layers of catalyst with one spare. The catalyst replacement cost is estimated by dividing the total catalyst cost by the number oflayers.68 I assumed initially two filled and one empty layer in my revised cost calculations (Ex. 1, Cell E42).
d. Time Value of Money
The Sargent & Lundy calculations did not consider the time value of money in estimating catalyst replacement cost.69 The Cost Manual explains that the future worth factor should be used to amortize catalyst cost over the years preceding the actual catalyst purchase. As money is allocated in advance of purchase, the sum of the annual catalyst replacement cost is less than the purchase price ofthe .catalyst. Thus, the purchase price
66 Hartenstein Report, April 2010, pp. 10-23. See, for example, p. 14 ("In CERAM's budgetary catalyst proposal dated 10/13/2009 CERAM clearly specifies for: TESCRs [tail end SCR] at M.R. Young's Units 1 and 2 an initial catalyst design life of 24,000 hours followed by the addition of a third catalyst layer at that time. CERAM then expects that the first catalyst replacement doesn't occur until about 88,000 hours or about II years of SCR operation. The second catalyst replacement isn't needed until approximately 125,000 hours or almost 16 years of SCR operation."), p. 22 ("In summary it can be stated that none of the three (3) catalyst suppliers had any issues providing an initial catalyst life guarantee of 24,000 operating hours in response to my own Request for Proposal.").
67 5/28/09 S&L Cost Analysis, p. 7 and Sargent & Lundy Excel Spreadsheets.
68 Cost Manual, SCR Section, Eqn. 2.50, pdf 489.
69 5/28/09 S&L Cost Analysis, p. 7 and Sargent & Lundy Excel Spreadsheets.
18
should have been multiplied by a future worth factor. Assuming an interest rate of 7%, a catalyst life of 24,000 hours, and a capacity factor of 86.5%, the future worth factor is 0.31. 70 In other words, the cost of catalyst replacement should be as little as one third of what Sargent & Lundy assumed based on this factor alone (Ex. 1, Cell E43).
e. Unit Catalyst Cost
Sargent & Lundy assumed a cost of 7,500 dollars per cubic meter of catalyst ($/m\71 This is very high compared to values typically quoted by vendors, $4,500/m3
$6,500/m3, depending upon volume per order. 72 While I believe $7,500/m3 is high, I
have not modified this value in my revised calculations as I do not have access to specific vendor quotes for this application due to confidentiality claims. Sargent & Lundy should support their assumed value or lower it appropriately (Ex. 1, Cell E33).
f. Catalyst Volume
Sargent & Lundy assumed a catalyst volume of 530 m3 in its cost calculations. 73 The spreadsheets produced in response to EPA's Section 114 request indicate that this figure was derived by arbitrarily increasing a catalyst volume of 440 m3by 20%.74 The source of the starting point, the 440 m3 and the 20% adjustment, are not disclosed.
As noted by EPA in its comments on the draft Regional Haze SIP, the value of 530 m3 is high for a tail end SCR. Typically, cyclone fired units require about 1.5 m3of catalyst per MW for a high dust SCR, while tail end SCRs require less than half the catalyst volume of a high dust SCR.75 Thus, one would expect a catalyst volume of about 330 m3. Therefore, I have used the unadjusted catalyst volume of 440 m3 from Sargent & Lundy's spreadsheets as a potential upper bound (Ex. 1, Cell E35).
70 Cost Manual, pdf 489-490, Eqn. 2.52: FWF = 0.07[ 1/(1.073-I)] = 0.31. Y = 24,000 hr/(8760)(0.865) =
3.2, rounds to 3.
71 5/27/09 S&L Cost Analysis, p. 7.
72 Letter from Callie A. Videtich, Director, Air Program, EPA Region 8, to Terry O'Clair, Director, Division of Air Quality, North Dakota Department of Health, Re: EPA Region 8 Comments on December 2009 Draft Regional Haze SIP (Public Comment Version), January 8, 2010, Enclosure 2, p. 28; Email from Anthony C. Favale, Director - SCR Products, Hitachi Power Systems America, Ltd., to Anita Lee, U.S. EPA, Region 9, Re: CX Catalyst Question, April 1,2010 ($5,500/m3to $6,000/m\ Email from Flemming Hansen, Manager SCR DeNOx Catalyst, Haldor Topsoe, to Phyllis Fox, P.E., Re: Catalyst Cost, January 23,2008 ($6,000/m\
735/27/09 S&L Cost Analysis, p. 7.
74 See, e.g., Sargent & Lundy spreadsheet: low-high dust scr-Ieland 01d2 - Sens2-cat life_05109.xls, cell E25 (440x1.20).
75 1/8/10 EPA Comments, Enclosure I, p. 27.
19
g. Catalyst Changeout Time
Sargent & Lundy assumed an outage of 1 to 4 weeks would be required to change out the catalyst every 6 months to a year, as major scheduled outages occur only every 3 years. 76 This is unsupported and inconsistent with the long history of SCR operation in both Europe and the United States.
First, a special outage to change out the catalyst would not be required. The catalyst can be changed out during scheduled major outages, which occur every 3 years. The first catalyst change would occur 3 years after installation. Thus, careful planning would align the first and subsequent changes with major outages, requiring no lost generation charges.
Second, 1 to 4 weeks to change out the reported catalyst volume is excessive. The estimated catalyst exchange rate for a tail-end SCR on the similar Milton R. Young units was 2.2 days for Unit 1 (257 MW) and 3.8 days for Unit 2 (477 MW).77 Based on these values, the proportional exchange time for Leland Olds is 3.6 days. This is generally consistent with industry experience. Alternatively, as the boiler is typically down for cleaning 3 to 4 times per year for a period of about 4 days each time, this downtime would be sufficient to exchange a layer should one be required before a major outage. SCR systems are designed to minimize unit downtime to minimize operating costs.
Thus, I assumed there would be no lost generation during catalyst replacement as it would be prudent design and operating practices to schedule these events during routinely scheduled maintenance outages (Ex. 1, Cell E73).
B.3 Cost of Utilities and Supplies
Sargent & Lundy evaluated a range of costs for ammonia, the reagent used in the SCR, and natural gas, used to reheat the flue gas.78 The range of costs includes those that may occur in the future. Speculation about future commodity prices is inconsistent with cost effectiveness methodology, which is based on the current annualized cost without escalation. The Cost Manual approach, recommended by the BART Guidance, explicitly excludes future escalation as cost comparisons are made on a current real dollar basis. Inflation is not included in cost effectiveness analyses as they rely on the most accurate information available at current prices and do not try to extrapolate those prices into the future. 79
76 5/27/09 S&L Cost Analysis, p. 5.
77 Hartenstein Report, April 20 I0, p. 36.
78 5/27/09 S&L Cost Analysis, p. 7.
79 See, e.g., Cost Manual, p. 2-36, pdf 50.
20

a. Ammonia
Ammonia is injected into the flue gas ahead ofthe SCR catalyst to react with NOx
and convert it to nitrogen gas and water. The Sargent & Lundy cost analyses evaluated ammonia costs of $450/ton and $700/ton.80 Recent BART analyses have used values closer to the lower end of this range. Black & Veatch, an engineering firm that designs SCRs, used an anhydrous ammonia cost of $450/ton in a September 2010 BART analysis for Boardman.8l Sargent & Lundy used an anhydrous ammonia cost of $475/ton in a September 2010 BART analysis for the Navajo Generating Station.82 Thus, in my revised cost analyses, I used $475/ton for the cost of ammonia (Ex. 1, Cell E20).
b. Natural Gas
The temperature ofthe flue gas exiting the wet scrubber is raised to SCR operating temperature by first sending it to a gas-gas heat exchanger and then to a natural gas fired duct burner (Fig. 1). This is typically the most significant operating cost for a tail-end SCR. The Sargent & Lundy cost calculations assume it would take 115 MMBtulhr of natural gas83 to raise the flue gas temr,erature from 550 F to 600 F at a natural gas price of$8.0/MMBtu to $12.0/MMBtu. 4 There are three problems with these assumptions that significantly overestimate reheat cost.
First, steam has important advantages over natural gas including lower cost, no increase in flue gas flow rate from gas combustion byproducts, no moisture condensation on the catalyst, and no risk of re-vaporization of catalyst poisons in the flame of a duct burner. Most tail end SCRs in Europe use steam for reheating.85 Vendors in the Milton R. Young case uniformly recommended the use of a steam coil in place of natural gas fired duct burners. 86 Sargent & Lundy did not evaluate a steam coil. The annual cost of using steam, for example, could be estimated from the amount of steam required to generate a megawatt (MW) of electricity at Leland Olds and the bus bar price per MW for the plant. This information has not been produced by either BEPC or Sargent & Lundy, precluding an independent calculation. However, a typical live steam loss of 2%87 would reduce generating capacity by 0.02x440 = 8.8 MW. Assuming $35/MWh and a 86.5% capacity factor, this amounts to $2.3 million in reheat costs, much lower
80 5/27/09 S&L Cost Analysis, p. 7.
81 Black & Veatch, Portland General Electric Boardman Plant, Best Available Retrofit Technology (BART)/Reasonable Progress Analysis Revision 3: Boardman 2020 Alternative, August 27,2010, Table 22.
82 Sargent & Lundy, Salt River Project Navajo Generating Station - Units 1,2,3, SCR and Baghouse Capital Cost Estimate Report, Revision D, August 17,2010, pdf 58, Table 9-2.
83 5/27/09 S&L Cost Analysis, p. 5 (115 MMBtu/hr).
84 5/27/09 S&L Cost Analysis, pp. 3 (550 F - 600 F), 7 ($8/MMBtu - $12/MMBtu).
851/8/10 EPA Comments, Enclosure I, p. 25.
86 See, e.g., Hartenstein Report, April 20 I0, pp. 34-35,40-43,
87 Hartenstein Report, April 2010, p. 40.
21

than the $7.4 to $11.2 million for natural gas estimated by Sargent & Lundy (Ex. 1, Row 72).
Second, the duct burner firing rate of 115 MMBtulhr assumes the flue gas would be heated from 550 F to 600 F, or by 50 F. This is excessive. Operating experience with numerous tail-end SCRs in Europe over the past 20 years indicates that an increase of 20 to 25 F is adequate. 88 This would lower reheat costs by a factor of2.5. Further, an SCR operating temperature of 525-550 F is sufficient for a tail-end SCR as the flue gas S02 concentrations after the wet scrubber are low, eliminating the concern with deposition of ammonia salts on the catalyst. 89 The natural gas firing rate of 115 MMBtulhr is high compared to an estimate of 66.4 MMBtulhr made by Bums & McDonnell for tail-end SCR on Leland Olds Unit 2.90 The Bums & McDonnell estimate is consistent with European experience. Thus, I use it in my revised cost analysis (Ex. 1, Cell E26).
Third, the assumed price of natural gas price, $8/MMBtu to $12/MMBtu, is excessive and is based on historic price spikes. BART cost effectiveness analyses are based on the best estimate of current costs at the time of the analysis and do not consider future escalation. As cost effectiveness is determined relative to other similar sources, future escalation in gas prices would affect all natural gas users, not just Leland OIds.
The most recent data reported to the Energy Information Agency (ErA) indicates that the cost of natural gas to electric power consumers in North Dakota has ranged from $4.48IMMBtu (October 2010) to $5.37/MMBtu (June 2010).91 As very littl~ natural gas is currently used in North Dakota, a more reasonable estimate for a dedicated supply is the Henry Hub spot price plus transportation cost. The 2010 Henry Hub price of natural gas is $4.37/MMBtu.92 The expected Henry Hub natural gas spot price for 2011 is $4.16/MMBtu, or $0.211MMBtu lower than 2010. The EIA expects the natural gas market to begin to tighten in 2012, with the Henry Hub spot price increasing to an average of$4.58/MMBtu.93 Transportation cost is typically less than $lIMMBtu. Thus, a reasonable estimate for purposes of2010 BART is about $5.5/MMBtu (Ex. 1, Cell E28).
88 Hartenstein Report, April 2010, p. 40.
89 McIlvaine, Next Generation SCR Choices - High-Dust, Low-Dust and Tail-End, FGD & DeNOx Newsletter, No. 369, January 2009; 5/6/08 Cochran (CERAM) Email, p. 2 ("Ammonia should not be injected below the minimum operating temperatures (MOT). Based on the S02 to S03 reported the MOT would be approximately 600 F. For lower sulfur fuels [such as NO lignite] and/or reduced NOx removal performance a lower MOT would be possible. Additionally, brief periods of opemtion below the MOT would be possible without permanent degradation. In no event would any ammonia be allowed to be injected below 530 F for any likely combination of reasonable sulfur and NOx removal parameters."), in 5/8/08 Milton R. Young Additional Information.
90 Bums & McDonnell, Technology Feasibility Analysis and Cost Estimates for Leland aIds Station Unit 1 and 2, Basin Electric Power Cooperative, Final Draft, December 2005, p. 86.
91 EIA, Natural Gas Monthly:http://www.eia.doe.gov/oil_gas/natural_gas/datayublications/natural_gas_monthly/ngm.html.
92 http://tonto.eia.gov/dnav/ng/hist/mgwhhda.htm.
93 http://www.eia.doe.gov/analysis/ and http://www.eia.gov/emeu/steo/pub/contents.html.
22

c. Power
An SCR increases power demand for auxiliary equipment, including the induced draft fans used to overcome the increase in backpressure from the SCR plus electricity to run the ammonia system, dilution air blower, dilution air heaters, and seal air fans. Thus, auxiliary power is the electricity required to run the plant, or electricity not sold.
This cost is estimated by multiplying the electricity demand in kilowatts by the cost of electricity in dollars per megawatt hour (MWh). Sargent & Lundy estimated auxiliary power cost assuming 6,956 kW (Ex. 1, Tab: Power) priced at $50/MWh.94 Cost effectiveness analyses are based on the cost to the owner to generate electricity, or the busbar cost, not market retail rates. The unit cost of electricity used by Sargent & Lundy, $50/MWh, is high for a lignite-fired boiler built near its fuel source. Bums & McDonnell assumed $38/MWh in the 2005 Feasibility Analysis for Leland Olds95 and $35/MWh for Milton R. Young Unit 1.96 I used the value Burns & McDonnell reported for Leland Olds (Ex. 1, Cell E24). The busbar cost for Leland Olds should be provided by BEPC and the power costs revised as necessary.
B.4 Capacity Factor
The capacity factor is the fraction of the available capacity that is actually used. It is calculated as the ratio of the actual electrical output to its full capacity, typically over a year. The emission reductions and variable O&M costs are both directly proportional to the capacity factor. The higher the capacity factor, the larger the emission reductions and the higher the variable O&M costs.
The BART Guidelines indicate that: "in the absence of enforceable limitations, you calculate baseline emissions based upon continuation of past practice.,,97 The Sargent & Lundy analysis calculated the capacity factor assuming the unit would operate at full capacity at all times except during catalyst changeouts. This resulted incapacity factors of 92% to 96%, which are higher than operating experience.
The monthly Clean Air Markets data for Leland Olds Unit 2 indicates that the gross electrical output for the baseline period98 is 3,334,426 MWh. The rated capacit~ of Leland Olds Unit 2 is 440 MW. Thus, the capacity factor is 86.5% (Ex. 1, Cell E38). 9
94 5/27/09 S&L Cost Analysis, p. 7 and Sargent & Lundy Excel Spreadsheets, Power Tab.
95 Bums & McDonnell, Technology Feasibility Analysis and Cost Estimate for Leland Olds Station Unit 1 and 2, Basin Electric Power Cooperative, Final Draft, December 2005, p. 86.
96 Bums & McDonnell, NOx Best Available Control Technology Analysis Study - Supplemental Report for Milton R. Young Station Unit 1, Minnkota Power Cooperative, Inc., November 2009, p. 4-42.
97 70 FR 39167 (July 6, 2005).
98 The baseline period is the highest 24-consecutive month average NOx emission rate during calendar years 2000-2004, or March 2001 - February 2003.
99 Capacity factor = 3,334,426 MWh/[(440)(8760)] = 0.865.
23
This value was used to calculate NOx emission reductions (Ex. 1, Cell E18) and variable O&M Costs (Ex. 1, Cells E69 - E72).
C. NOx EMISSION REDUCTION
The 5/27/09 Sargent & Lundy Cost Analysis calculated cost effectiveness by dividing the "levelized total annual cost," consisting of the sum of annualized capital cost and levelized O&M cost, by the total annual NOx emission reduction of 10,571 ton/yr, from an uncontrolled baseline. The basis of these NOx reductions was not disclosed.
In my calculations, I assume SCR plus ASOFA reduced baseline NOx emissions ofO.67lb/MMBtu IOO to 0.05 Ib/MMBtu (Ex. 1, Cell E18). An SCR outlet NOx emission rate of 0.05 Ib/MMBtu can be readily achieved by SCR plus ASOFA. The 5/27/09 S&L analysis and supporting spreadsheets assumed the combination achieved 0.05 Ib/MMBtu. The SCR was specifically assumed to reduce NOx from an inlet of 0.48 Ib/MMBtu, a level consistent with performance of Leland Olds Unit 2 since installation of ASOFA, to 0.05 Ib/MMBtu or 90% NOx control.
D. COST EFFECTIVENESS SUMMARY
My revisions discussed above and summarized in Exhibit 1 improve the cost effectiveness of SCR plus ASOFA at Leland Olds from the range of $4,170/ton to $5,976/ton in 2009 dollars reported by Sargent & Lundy to $1,954/ton in 2010 dollars (Ex. 1a, Cell E80). The cost effectiveness of SCR alone, after installation of ASOFA, is $2,609/ton (Ex. 1b, Cell E80). My revised cost effectiveness value is within the range of cost effectiveness values reported for other SCR BART determinations10 I and thus is per se cost effective. My estimate is an upper bound as the SCR capital costs are based on a unit capital cost that is much higher than actual experience from numerous installed SCRs. In my opinion, the actual cost effectiveness of SCR alone and SCR plus ASOFA on Leland Old Unit 2 is lower, i.e., more cost effective, than calculated in Exhibit 1.
100 NDDH, BART Detennination for Leland Olds Station Units 1 and 2, p. 24.
\0\ Jim Bridger Units 3 and 4: $2,258; Naughton Unit- 3: $2,830Iton; PGE Boardman: $3,096/ton; Four Comers: $2,515 - $3, I63/ton, San Juan: $1,549/ton to $2,016/ton; Big Stone 1: $825Iton; Hayden Units I and 2: $3,385 - $4,064. Some of these figures also include the installation costs for combustion controls.
24

EXHIBIT 1a COST EFFECTIVENESS ANALYSIS
TAIL-END SCR PLUS ASOFA AT LELAND OLDS UNIT 2
Row & Column Numbers --> E F G H I J
~ Sargent & Lundy Cases
Fox Revised Units Cost I H G F E
INPUT DATA
10 Design Coal Lignite Lignite Lignite Lignite Lignite Lignite 11 SCR Configuration Tail End Tail End Tail End Tail End Tail End Tail End 12 Capacity MW 440 440 440 440 440 440 13 Heat Input MBtu/hr 5,130 5,130 5,130 5,130 5,130 5,130 14 Inlet NOx Emissions Ib/MMBtu 067 048 0.48 0.48 0.48 048 15 Outlet NOx Emissions IblMMBtu 005 16 Control Efficiency % 93 90 90 90 90 90 17 NOx Removed Iblhr 3,181 2,216 2,216 2,216 2,216 2,216 18 NOx Removed tonslyr 12,050 10,517 10,517 10,517 10,517 10,511 19 Ammonia Required Iblhr 1,253 873 873 873 873 873 20 Ammonia Cost $/ton 475 700 450 450 450 450 21 Pressure Drop across catalyst inw.c. 4 4 4 4 4 4 22 Pressure Drop inw.c. 18 18 18 18 18 18 23 Power Consumption kW 6,956 6,956 6,956 6,956 6,956 6,956 24 Power Cost $IMWh 38 50 50 50 50 50
Temperature Rise Across Steam to Flue 25 Gas Reheater F 50 50 50 50 50 50 26 Natural Gas Requirement MMBtu/hr 66 115 115 115 115 115 27 (30 F rise) (50 F rise) (50 F rise) (50 F rise) (50 F rise) (50 F rise) 28 Natural Gas Cost $/MMBtu 55 12.0 12.0 120 8.0 80 29 Unit Capital Cost SCR + SOFA+SI (2009) $/kW 388 388 388 30 Unit Capital Cost SCR + SOFA (2009) $/kW 376 376 376 376 31 Unit Capital Cost ASOFA (2009) $/kW 26 26 26 26 26 26 32 Unit Capital Cost SCR (2009) $/kW 350 350 350 350 33 Unit Catalyst Cost $/m' 7,500 7,500 7,500 7,500 7,500 7,500 34 35 Initial Catalyst Volume m' 440 530 530 530 530 530 36 Coal Cost $/MBtu 1.00 100 1.00 100 100 100 37 Catalyst Cost $ 3,300,000 3,960,000 3,960,000 3,960,000 3,960,000 3,960,000 38 Annual Capacity Factor % 86.5 92.3 92.3 92.3 92.3 962 39 Cost of Outage $lweek 0 3,696,000 3,696,000 3,696,000 3,696,000 3,696,000 40 Outage Duration weeks 0 4 4 4 4 2 41 Catalyst Replacement 24,000 hrs 6 months 6 months 6 months 6 months 12 months 42 Number of Catalyst Layers 3 1 1 1 , 1 43 Future Worth Factor 031 1 1 1 1 1 44 Capital Recovery Factor 008718 0.08718 008718 008718 0.08718 008718 45 Levelized Annual O&M Factor 1 1.19314 119314 1.19314 1.19314 1.19314 46
47 TOTAL CAPITAL COST (2010) 48 49 SCR + ASOFA Capital Cost $ 175,561,000 170,720,000 170,720,000 165,440,000 165,440,000 165,440,000 50 SCR Capital Cost $ 164,121,000 51 S03 Mitigation Capital Cost' $ 0 0 0 0 0 0 52 53 Totallnstatled Capital Cost $ 175,561,000 170,720,000 170,720,000 165,440,000 165,440,000 165,440,000 54 Annual Capital Cost $/yr 15,305,408 14,883,370 14,883,370 14,423,059 14,423,059 14,423,059 55 56
57 FIXED O&M COST 58 59 Operating Labor Cost $/yr $0 $0 $0 $0 $0 $0 60 Maintenance Materials Cost $/yr $527,000 $512,000 $512,000 $496,000 $496,000 $496,000 61 Maintenance Labor Cost $/yr $351,000 $341,000 $341,000 $331,000 $331,000 $331,000 62 Administrative and Support Labor $/yr
I
$0 $0 $0 $0 $0 $0 63 64 Total Fixed O&M Cost $/yr $878,000 $853,000 $853,000 $827,000 $827,000 $827,000 65
I
66
67 VARIABLE O&M COST 68 69 Ammonia Cosl $Iyr 2,255,000 2.471,000 1,589,000 1,589,000 1,589,000 1,655,000 70 Catalyst Cost $/yr 342,000 7,920,000 7,920,000 7,920,000 7,920,000 3,960,000 71 Power Cost $Iyr 2,003,000 2,813,000 2,813,000 2,813,000 2,813,000 2,930,000 72 Gas Penalty $Iyr 2,767,000 11,161,000 11,161,000 11,161,000 7.441,000 7,750,000 73 Outage Penalty $/yr 0 14,784,000 14,784,000 14,784,000 14,784,000 7,392,000 74 Sorbent Injeclion S/yr 0 207,000 207,000 207,000 207,000 207,000 75 76 Total Variable O&M Cost S/yr 7,367,000 39,356,000 38,474,000 38,474,000 34,754,000 23,894,000 77 40,209,000
78 TOTAL O&M COSTS S/yr 8,245,000 47,974,966 46,922,617 46,891,595 42,453,114 29,495,614 79
80 Cost Effectiveness $Iton 1,954 5,977 5,877 5,830 5,408 4,178
3/27/09 S&L Cost AnalysIs, Table 2,5-5 5,976 5,876 5,792 5,372 4,170
NOTES a The sorbent injection cost is included in the unit capital cost of $388/kW b Capital costs adjusted to 2010 dollars using the CEPCI index of October 2010/2009 = 556.2/521.9.

EXHIBIT 1b
COST EFFECTIVENESS ANALYSIS
TAIL-END SCR PLUS ASOFA AT LELAND OLDS UNIT 2
Row & Column Numbers >""''j E F G H I J
+ Sargent & Lundy Cases
Fox Revised Units Cost I H G F E
INPUT DATA
10 Design Coal Lignite Lignite Lignite Lignite Lignite Lignite 11 SCR Configuration Tail End Tail End Tail End Tail End Tail End Tail End 12 Capacity MW 440 440 440 440 440 440 13 Heat Input MBtu/hr 5,130 5,130 5,130 5,130 5,130 5,130 14 Inlet NOx Emissions Ib/MMBtu 0.48 0.48 0.48 0.48 0.48 0.48 15 Outlet NOx Emissions Ib/MMBtu 0,05 16 Control Efficiency % 90 90 90 90 90 90 17 NOx Removed Ib/hr 2,206 2,216 2,216 2,216 2,216 2,216 18 NOx Removed tonslyr 8,357 10,517 10,517 10,517 10,517 10,511 19 Ammonia Required Ib/hr 869 873 873 873 873 873 20 Ammonia Cost $/ton 475 700 450 450 450 450 21 Pressure Drop across catalyst inw.c. 4 4 4 4 4 4 22 Pressure Drop inw.c. 18 18 18 18 18 18 23 Power Consumption kW 6,956 6,956 6,956 6,956 6,956 6,956 24 Power Cost $/MWh 38 50 50 50 50 50
Temperature Rise Across Steam to Flue 25 Gas Reheater F 50 50 50 50 50 50 26 Natural Gas Requirement MMBtu/hr 66 115 115 115 115 115 27 (3D F rise) (50 F rise) (50 F rise) (50 F rise) (50 F rise) (50 F rise) 28 Natural Gas Cost $/MMBtu 5,5 12,0 12,0 120 8,0 80 29 Unit Capital Cost SCR + SOFA+SI $/kW 388 388 388 30 Unit Capital Cost SCR + SOFA $/kW 376 376 376 376 31 Unit Capital Cost ASOFA $/kW 26 26 26 26 26 26 32 Unit Capital Cost SCR $/kW 350 350 350 350 33 Unit Catalyst Cost $/m' 7,500 7,500 7,500 7,500 7,500 7,500 34 35 Initial Catalyst Volume m' 440 530 530 530 530 530 36 Coal Cost $IMBtu 1,00 1,00 1,00 1.00 100 100 37 Catalyst Cost $ 3,300,000 3,960,000 3,960,000 3,960,000 3,960,000 3,960,000 38 Annual Capacity Factor % 86,S 92,3 92,3 92,3 92,3 96,2 39 Cost of Outage $/week 0 3,696,000 3,696,000 3,696,000 3,696,000 3,696,000 40 Outage Duration weeks 0 4 4 4 4 2 41 Catalyst Replacement 24,000 hrs 6 months 6 months 6 months 6 months 12 months 42 Number of Catalyst Layers 3 1 1 1 1 1 43 Future Worth Factor 0,31 1 1 1 1 1 44 Capital Recovery Factor 008718 008718 0,08718 0,08718 0,08718 0,08718 45 Levelized Annual O&M Factor 1 1,19314 1,19314 119314 1,19314 1,19314 46
47 TOTAL CAPITAL COST 48 49 SCR + ASOFA Capital Cost $ 170,720,000 170,720,000 165,440,000 165,440,000 165,440,000 50 SCR Capital Cost $ 164,121,000 51 S03 Mitigation Capital Cost' $ 0 0 0 0 0 0 52 53 Total Installed Capital Cost $ 164,121,000 170,720,000 170,720,000 165,440,000 165,440,000 165,440,000 54 Annual Capital Cost $/yr 14,308,069 14,883,370 14,883,370 14,423,059 14,423,059 14,423,059 55 56
57 FIXED O&M COST 58 59 Operating Labor Cost $/yr $0 $0 $0 $0 $0 $0 60 Maintenance Materials Cost $/yr $492,000 $512,000 $512,000 $496,000 $496,000 $496,000 61 Maintenance Labor Cost $/yr $328,000 $341,000 $341,000 $331,000 $331,000 $331,000 62 Administrative and Support Labor $/yr $0 $0 $0 $0 $0 $0 63 64 Total Fixed O&M Cost $/yr $820,000 $853,000 $853,000 $827,000 $827,000 $827,000 65 66
67 VARIABLE O&M COST 68 69 Ammonia Cost $/yr 1,564,000 2,471,000 1,589,000 1,589,000 1,589,000 1,655,000 70 Catalyst Cost $/yr 342,000 7,920,000 7,920,000 7,920,000 7,920,000 3,960,000 71 Power Cost $/yr 2,003,000 2,813,000 2,813,000 2,813,000 2,813,000 2,930,000 72 Gas Penalty $/yr 2,767,000 11,161,000 11,161,000 11,161,000 7,441,000 7,750,000 73 Outage Penalty $/yr 0 14,784,000 14,784,000 14,784,000 14,784,000 7,392,000 74 Sorbent Injection $/yr 0 207,000 207,000 207,000 207,000 207,000 75 76 Total Variable O&M Cost $/yr 6,676,000 39,356,000 38,474,000 38,474,000 34,754,000 23,894,000 77 40,209,000
78 TOTAL O&M COSTS $/yr 7,496,000 47,974,966 46,922,617 46,891,595 42,453,114 29,495,614 79
80 Cost Effectiveness $Iton 2,609 5,977 5,877 5,830 5,408 4,178
3/27/09 S&L Cost AnalySIS, Table 2,5-5 5,976 5,876 5,792 5,372 4,170
NOTES a The sorbent injection cost is included in the unit capital cost of $3881kW b Capital costs adjusted to 2010 dollars using the CEPCI index of October 2010/2009; 556,2/521,9,
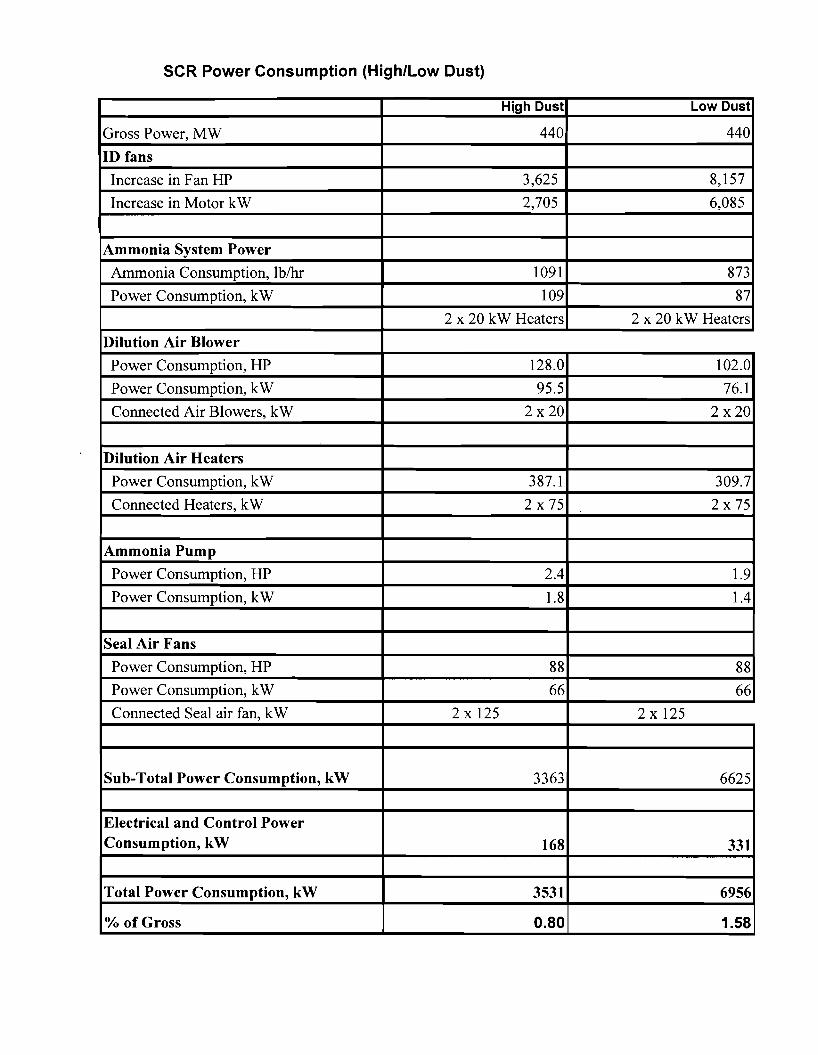
SCR Power Consumption (High/Low Dust)
High Dust Low Dust
Gross Power, MW 440 440
ID fans
Increase in Fan HP 3,625 8,157
Increase in Motor kW 2,705 6,085
Ammonia System Power
Ammonia Consumption, lblhr 1091 873
Power Consumption, kW 109 87
2 x 20 kW Heaters 2 x 20 kW Heaters
Dilution Air Blower
Power Consumption, HP 128.0 102.0
Power Consumption, kW 95.5 76.1
Connected Air Blowers, kW 2 x 20 2 x20
Dilution Air Heaters
Power Consumption, kW 387.1 309.7
Connected Heaters, kW 2 x 75 2 x 75
Ammonia Pump
Power Consumption, HP 2.4 1.9
Power Consumption, kW 1.8 1.4
Seal Air Fans
Power Consumption, HP 88 88
Power Consumption, kW 66 66
Connected Seal air fan, kW 2 x 125 2 x 125
Sub-Total Power Consumption, kW 3363 6625
Electrical and Control Power Consumption, kW 168 331
Total Power Consumption, kW 3531 6956
% of Gross 0.80 1.58