Embed Size (px)
Citation preview

Psychology of Sport and Exercise 7 (2006) 525–553
Review
Twenty years of ‘‘hot hand’’ research: Review and critique
Michael Bar-Elia, Simcha Avugosa, Markus Raabb,�
aDepartment of Business Administration, School of Management, Ben-Gurion University of the Negev, Beer-Sheva, IsraelbInstitute for Movement Sciences and Sport, University of Flensburg, Auf dem Campus 1, D-24943 Flensburg, Germany
Received 2 September 2005; received in revised form 28 February 2006; accepted 1 March 2006
Available online 15 May 2006
Abstract
Objectives: This article systematically reviews the state of the art of the ‘‘hot hand’’ research in sports. Thebelief that successive attempts of an individual player are positively related, as well as the behaviorinfluenced by such a belief, will be investigated.Method: The analysis of experiments, simulations, and archival data from actual sport competitions arestructured in a way that evidence for or against the existence of the hot hand is presented. In addition, keyissues that have been raised over this debate will be highlighted, including their merits and pitfalls.Results: The empirical evidence for the existence of the hot hand is considerably limited. Methodologicaladvancements as well as some experimental results indicate a shift in the debate from the adaptiveness of apotentially faulty belief to an adaptive behavior based partly on the hot hand belief.Conclusions: The potential implications of this review for cognitive theories, empirical studies, and sportpractice may provide a significant leverage point for future research and application.r 2006 Elsevier Ltd. All rights reserved.
Keywords: Decision making; Hot hand; Streaks; Review; Sport
Contents
Introduction . . . . . . . . . . . . . . . . . . . . . . . . . . . . . . . . . . . . . . . . . . . . . . . . . . . . . . . . . . . . . . . . . . . . . . . 526
The preliminary hot hand research. . . . . . . . . . . . . . . . . . . . . . . . . . . . . . . . . . . . . . . . . . . . . . . . . . . . . . . . 535
The origin of the hot hand belief . . . . . . . . . . . . . . . . . . . . . . . . . . . . . . . . . . . . . . . . . . . . . . . . . . . . . . . . . 538
ARTICLE IN PRESS
www.elsevier.com/locate/psychsport
1469-0292/$ - see front matter r 2006 Elsevier Ltd. All rights reserved.
doi:10.1016/j.psychsport.2006.03.001
�Corresponding author.
E-mail address: [email protected] (M. Raab).

The validity of the hot hand belief . . . . . . . . . . . . . . . . . . . . . . . . . . . . . . . . . . . . . . . . . . . . . . . . . . . . . . . . 539
Studies that provide evidence against the existence of the hot hand . . . . . . . . . . . . . . . . . . . . . . . . . . . . . 539
Studies that provide evidence in favor of the hot hand . . . . . . . . . . . . . . . . . . . . . . . . . . . . . . . . . . . . . . 541
The hot hand test statistics . . . . . . . . . . . . . . . . . . . . . . . . . . . . . . . . . . . . . . . . . . . . . . . . . . . . . . . . . . . . . 544
Implications of the hot hand belief . . . . . . . . . . . . . . . . . . . . . . . . . . . . . . . . . . . . . . . . . . . . . . . . . . . . . . . 545
Discussion . . . . . . . . . . . . . . . . . . . . . . . . . . . . . . . . . . . . . . . . . . . . . . . . . . . . . . . . . . . . . . . . . . . . . . . . . 547
Task segregation . . . . . . . . . . . . . . . . . . . . . . . . . . . . . . . . . . . . . . . . . . . . . . . . . . . . . . . . . . . . . . . . . 547
Hot hand definitions . . . . . . . . . . . . . . . . . . . . . . . . . . . . . . . . . . . . . . . . . . . . . . . . . . . . . . . . . . . . . . 548
The cold hand . . . . . . . . . . . . . . . . . . . . . . . . . . . . . . . . . . . . . . . . . . . . . . . . . . . . . . . . . . . . . . . . . . . 549
Evaluation procedure . . . . . . . . . . . . . . . . . . . . . . . . . . . . . . . . . . . . . . . . . . . . . . . . . . . . . . . . . . . . . . 549
Concluding remarks . . . . . . . . . . . . . . . . . . . . . . . . . . . . . . . . . . . . . . . . . . . . . . . . . . . . . . . . . . . . . . . . . . 550
References . . . . . . . . . . . . . . . . . . . . . . . . . . . . . . . . . . . . . . . . . . . . . . . . . . . . . . . . . . . . . . . . . . . . . . . . . 551
Introduction
In sports a widespread belief exists that success breeds success and failure breeds failure. Onemajor example is the ‘‘hot hand’’ or ‘‘streak shooting’’—terms that refer to the belief that theperformance of a player during a particular period is significantly better than could be expectedon the basis of the player’s overall record (Gilovich, Vallone, & Tversky, 1985). In this review wehave summarized the literature pertaining to the popular belief in the hot hand phenomenon insport. We chose to present the more important studies from the last 20 years that have advancedthe debate on this issue. The survey is restricted to research related to sport and exercise behaviorin its broad sense, rather than general physical activity. Studies done in other academic fieldsoutside the sport domain, such as economics (e.g., Hendricks, Patel, & Zeckhauser, 1993) andcognitive science (e.g., Gilden & Wilson, 1995a), were excluded. Still, it is worth noting that thehot hand debate in sport may well influence other domains and provide boundaries for theoriesthat attempt to explain beliefs and behavior in real environments other than sport.In the following sections we first present the original report by Gilovich et al. (1985) that
stimulated the debate on the hot hand issue, and then review both the supportive and the non-supportive reports that followed it, as summarized in Table 1. Within each category, studies arepresented more or less chronologically, so as to follow the development of hot hand research overthe years (studies conducted within the same sport field are presented jointly). The origin of thebelief in the hot hand is also discussed. We next describe the methodological flaws pointed outmostly by statisticians regarding the efficiency of tests used in those studies (see Table 2). Finally,we demonstrate how the belief in the hot hand affects game strategy and betting in sports. Asstated in the literature, there is no one way of writing a review article (see Bem, 1995). However,we believe that organizing the review according to the above categories (i.e., supportive vs. non-supportive studies), as well as demonstrating the methodological and theoretical advantages, mayserve as a leverage point for further research.Our literature review resulted in only two more non-supportive than supportive studies
(13 compared to 11, respectively). However, when one closely examines the results, demonstra-tions of hot hands per se are rare and often weak, due to various reasons: using an unrealisticmodel and questionable data (Larkey, Smith, & Kadane, 1989), setting questionable definitionsfor hot and cold players (Forthofer, 1991), relating streakiness to difficulty of task (Gilden &Wilson, 1995b), combining and analyzing data of all players as a group (Stern, 1995), and otherconstraints related to the kind of sport studied (Frame, Hughson, & Leach, 2003; Klaassen &
ARTICLE IN PRESS
M. Bar-Eli et al. / Psychology of Sport and Exercise 7 (2006) 525–553526

ARTICLE IN PRESSTable
1
Summary
oftheem
piricalresearchandrealdata
examination
Study
Sport
activity
Database
Results
1.1
.S
tudie
sth
at
pro
vide
evid
ence
again
stth
eex
iste
nce
of
the
hot
hand
Gilovichet
al.(1985)
Basketball
Field
goaldata
for9mem
bersofthePhiladelphia
76ersduringthe1980–1981season.
1.Theoutcomes
ofboth
fieldgoalandfree
throw
attem
pts
werelargelyindependentofthe
outcomeofthepreviousattem
pt(s).No
significantpositivecorrelationbetween
successiveshots
wasfound.
2.Thefrequency
ofstreaksin
players’recordsdid
notexceed
thefrequency
expectedbya
binomialmodel
withaconstanthitrate.
3.Playershadnomore
‘‘hot’’or‘‘cold’’nights
(i.e.,fluctuationsin
shootingpercentages
across
games)thanwould
beexpectedby
chance.
4.Players’predictionsoftheirownperform
ance
revealedaconsistentbeliefin
thehothand,but
thesense
ofbeing‘‘hot’’did
notpredicthitsor
misses.
Free-throw
data
for9mem
bersoftheBoston
Celtics
duringthe1980–1981andthe1981–1982
seasons.
Acontrolled
shootingexperim
entwith26
mem
bersofCornell’svarsityteams.
Siwoffet
al.(1988)
Baseball
Allbaseballgames
duringthe1984,1985,1986,
and1987seasons.
Battingaverages
werejust
aboutaslikelyto
be
higher
following‘‘cold’’streaksasfollowing‘‘hot’’
streaks(i.e.,fivegames
over
nomore
thanseven
daysduringwhichtheplayer
batted
atleast.400or
less
than.125,respectively).
TverskyandGilovich(1989a);
See
alsoGilovichet
al.(1985)
Basketball
TverskyandGilovich(1989b)
Basketball
18playersin
39NBA
games
duringthe1987–1988
season(only
successiveshots
thatwerein
close
temporalproxim
ity).
Theresultsdid
notsupport
thelocality
hypothesis
(i.e.,thatthehothandphenomenonoperatesonly
when
successiveshotsare
taken
within
ashorttime
span):Theserialcorrelationswerenegativefor11
players,positivefor6players,andtheoverall
meanwas�.02.Noneofthecorrelationswere
statisticallysignificant.
Gould
(1989)
Baseball
JoeDiM
aggio’s56-gamehittingstreakin
1941.
DiM
aggio’ssequence
ofhitsisbeyondthe
reasonable
expectationsofrandom
models.Still,
thisuniqueachievem
entisattributedto
DiM
aggio’soverallhighsuccessrate.
Adams(1992)
Basketball
83playersin
19NBA
games
(fieldgoalonly).
Thehypothesisregardingatime-dependent‘‘hot
hand’’wasrejected:ThemeanHit-H
ittime
intervalwaslarger
(thoughnotsignificantly)
comparedto
aHit-M
issinterval.
M. Bar-Eli et al. / Psychology of Sport and Exercise 7 (2006) 525–553 527

ARTICLE IN PRESS
Table
1(c
on
tin
ued
)
Study
Sport
activity
Database
Results
Albright(1993a)
Baseball
40‘‘regular’’MajorLeagueBaseballplayers
throughfourseasons,1987–1990.
1.Someplayersexhibited
significantstreakiness
duringagiven
season,butthiswould
be
expectedunder
amodel
ofrandomness.
2.Notasingle
oneoftheseplayersexhibited
significantlystreakybehaviorover
theentire
4-
yearperiod.
Stern
andMorris(1993)
Comment.See
Table
2
Albright(1993b)Rejoinder.
See
Table
2
Frohlich
(1994)
Baseball
AllAmericanandNationalLeagues
no-hitgames
occurringbetween1900and1993.
1.The202observed
no-hitgames
since
1900
could
beadequately
explained
ifoneconsiders
thevariousfactors
affectingthedistributionof
hits/game.
2.Theextraordinary
highnumber
ofno-hitters
in
the1990and1991seasonswasattributed
simply
tochance.
Vergin
(2000)
Baseball
28MajorLeagueBaseball(M
LB)teamsover
the
1996season(28teams�162games¼
4536winsor
losses
per
season).
Winsandlosses
wereshownto
beindependentof
theresultsofpreviousgames
andwinningand
losingstreakswerenolonger
thanwould
be
expectedbychance.
Basketball
29NBA
teamsover
the1996–1997andthe
1997–1998seasons(29teams�82games¼
2378
winsorlosses
per
season).
AlbertandBennett(2001)
Baseball
TheMajorLeagueplayer
ToddZeile’sday-to-day
movingaverageofbattingperform
ancesover
the
firsthalfofthe1999season.
Zeile
exhibited
both
‘‘hot’’and‘‘cold’’
perform
ances,butthepeaksandvalleysobserved
inbattingaveragewould
beduejust
tochance.
Clark
(2003a)
Golf
35professionalgolfersonthe1997and1998PGA
TourandSeniorPGA
Tour(18-holeroundscores
data).
Thoughasignificanttrendwasfoundforplayer’s
parorbetterroundsto
occurtogether
andtheir
aboveparroundsto
occurtogether,theobserved
streakinesswasrelatedto
thedifficultyofgolf
courses
rather
thanto
anyinherenttendency
of
playersto
bestreaky.
Clark
(2003b)
Golf
25LadiesProfessionalGolfers’Association
(LPGA)playersonthe1997and1998Tours
(18-
hole
roundscoresdata).
TheresultsfortheLPGA
Tourreplicatedthe
findingsonthePGA
TourandSeniorPGA
Tour
(Clark,2003a).
M. Bar-Eli et al. / Psychology of Sport and Exercise 7 (2006) 525–553528

ARTICLE IN PRESSKoehlerandConley(2003)
Basketball
23shooters
infourannualNBA
LongDistance
Shootoutcontests,1994–1997(a
totalof56setsof
25shots).
Data
gavenoevidence
forhotnessorsequential
dependencies.
Gula
andRaab(2004)
Comment
KoehlerandConleyfocusedonly
ononeofthe
twoplausible
interpretationsofthehothand
belief.Therunstest
usedin
theirstudyissensitive
enoughto
sequentialdependency
butless
sensitive
indetectingnon-stationarity.
Clark
(2005)
Golf
35professionalgolfersonthe1997PGATour.For
each
player,hole-to-hole
scoreswereanalyzed
over
theentire
yearandwithin
individual
tournaments
(atotalof747tournaments).
1.Significantstreakinessover
theentire
yearwas
foundforonly
threeplayers(oneofthese
playersexhibited
streakinessin
theopposite
direction),whichiswithin
chance
expectations.
2.Noplayer
showed
asignificanttendency
for
streakinessin
individualtournaments.
1.2
.S
tudie
sth
at
pro
vide
support
for
the
exis
tence
of
the
hot
hand
Larkey
etal.(1989)
Basketball
18playersin
39NBA
games
duringthe1987–1988
season(fieldgoalonly).
1.Theresultsprovided
noevidence
forthehot
hand:Halftheplayersexhibited
apositive
serialcorrelation,theother
halfexhibited
a
negativeserialcorrelation,andtheoverall
averagewasessentiallyzero.
2.Usingacontextualapproach,itturned
outthat
VinnieJohnson‘‘theMicrowave’’wasindeeda
streakshooter.
TverskyandGilovich(1989b)
Rejoinder
Basketball
ReanalysisofLarkey
etal.’sdata
on18NBA
playersduringthe1987–1988season.
1.Thestatisticalmodel
usedin
Larkey
etal.’s
studyisunrealistic(since
theassumptionmade
aboutaconstantshootingrate
isfaulty),and
thusleadingto
unjustified
conclusions.
2.Vinnie
Johnsontended
toshootmore
after
a
hitthanamiss,buthischancesofmakinga
shotwerenotbetterfollowingaprevioushit.
3.Vinnie’sshootingrecord
wasmistakenly
coded:hisseven-hitstreaknever
happened.
When
thiserroriscorrected,Vinnie
Johnson
nolonger
standsoutin
theanalysis.
Forthofer(1991)
Basketball
Field
goaldata
of123NBA
playersduringthe
1989–1990season.
Ofthe123playersexamined,therewere17that
could
belabeled
streakshooters
(i.e.,5%
ormore
ofthetotalnumber
ofgames
wereinconsistent
withtheplayer’sseasonfieldgoalpercentage),
withanem
phasisonthreeplayers.
M. Bar-Eli et al. / Psychology of Sport and Exercise 7 (2006) 525–553 529
ARTICLE IN PRESS
Table
1(c
on
tin
ued
)
Study
Sport
activity
Database
Results
Gilden
andWilson(1995b)
Golf
Exp.1:40volunteers.Each
subject
completedone
sessionof300putts.
Most
subjectsshowed
someamountofstreakiness
(25of40hadruns
zscoreso0;i.e.,fewer
runs
wereobserved
thanexpected).
Golf
Exp.2:5volunteers.Each
subject
completedthree
sessionsof300puttsateach
ofthreelevelsof
difficulty(variable
puttingdistance).
Streakshootingwasobserved.However,outcome
sequenceswerestreakiestwhen
thedifficultyofthe
task
matched
totheabilityoftheperform
er(i.e.,
perform
er’shitrate).
Darts
Exp.3:8well-practiced
andhighly
trained
volunteers.Each
subject
completedonesessionof
300throwsateach
ofthreelevelsofdifficulty
(variable
targetssizes).
1.Dart
throwingdid
notgenerate
solidevidence
ofstreakinessper
se.Ofthe24sequences
generated,only
1hadarunszscore
sufficiently
negative,
whichiswithin
chance
expectations.
2.Streakyperform
ance
wasevidentonly
for
interm
ediate-sizetargets.
Golfputtingand
Darts
Exp.4:4volunteers.Each
subject
completed10
blocks,whileablock
consisted
of150trialsofeach
activity.
Only
thecombined
activity(i.e.,themixture
of
both
golfputtinganddart
throwingdata)was
moderately
streaky.
Stern
(1995)
Baseball
40‘‘regular’’MajorLeagueBaseball(M
LB)
playersthroughfourseasons,1987–1990.
Evidence
ofstreakswasfoundwhileplayerswere
analyzedasagrouprather
thanindividually.
Adams(1995)
billiards
Shot-by-shotscoringfor45playersontheMen’s
ProfessionalBilliardsAssociation(M
PBA)nine-
balltournament.A
totalof1464games
were
played
in84matches.
1.Theprobabilityofwinningabest-of-21match
wassignificantlygreaterafter
havingwonthe
first(orfirstandsecond)games
inthematch.
2.Theprobabilityofwinningagamebyrunning
allballswasgreaterafter
havingwonby
runningallballsin
thepreviousgame.
Wardrop(1999)
Basketball
Acontrolled
shootingexperim
entwithamem
ber
oftheUW-M
adisonwomen’svarsityteam,Katie
Voigt(100shots�20sessions¼
2000attem
pts).
Theresultsprovided
statisticallysignificant
evidence
against
thehypothesisofBernoullitrials
withconstant(day-to-day)probabilityofsuccess.
Klaassen
andMagnus(2001)
Tennis
Point-to-pointdata
on4years
ofWim
bledon
men’sandwomen’ssingles,1992–1995,distributed
over
481matches
(atotalof86,298points).
Points
wereneither
independentnoridentically
distributed(iid):winningthepreviouspointhada
positiveeffect
onwinningthecurrentpoint,andat
‘‘im
portant’’points
itwasmore
difficultforthe
server
towin
thepointthanatless
important
points.
Raab(2002)
Volleyball
37,000rowsofsequencesofsuccessfulspikes
and
missesformore
than200playersin
226German
firstnationalvolleyballleaguegames.
Forhalfoftheplayersasignificant
autocorrelationbetweensuccessiveshots
was
found,andwasrelatedto
highbase
rates.
M. Bar-Eli et al. / Psychology of Sport and Exercise 7 (2006) 525–553530

ARTICLE IN PRESSSmith(2003)
Horseshoepitching
64pitchers(32men
and32women)in
the2000
and2001WorldChampionships.
Variationsin
player
perform
anceswithin
games
andacross
games
werefound,whichindicatedthat
successprobabilitieswerenotcompletely
independentofpreviousoutcomes.
Frameet
al.(2003)
Bowling
TheFinalRoundof1994–1998PBA
tournaments.
Thewinnersofeach
gamewonmore
then
50
percentoftheirnextgames,even
thoughthey
were
playingagainst
higher-seeded
bowlers.
Dorsey-Palm
ateer
andSmith
(2004)
Bowling
43ProfessionalBowlers
Association(PBA)players
onthe2002–2003season.
Individualsuccessprobabilitiesformanybowlers
(i.e.,rollingastrike)
wereneither
independentof
previousoutcomes
norconstantacross
games.
1.3
.In
con
clu
sive
stu
die
s
Wardrop(1995)
Basketball
Free-throw
data
for9mem
bersoftheBoston
Celtics
duringthe1980–1981andthe1981–1982
seasons.
1.Analysisofthecollapsedtable
(asopposite
to
separate
analysesofindividualplayers)
gives
statisticallysignificantevidence
insupport
of
thehothandphenomenon:ahitwasmuch
more
likelythanamissto
befollowed
byahit.
2.Theprobabilityofsuccesswasnotconstant:
SeveralCeltics
playersshotsignificantlybetter
ontheirsecondfree
throw.
M. Bar-Eli et al. / Psychology of Sport and Exercise 7 (2006) 525–553 531

ARTICLE IN PRESSTable
2
Summary
ofthestatisticalandmethodologicalobservations
Study
Statisticalexaminationandsimulateddata
Resultsandconclusions
Kaplan(1990)
Theprobabilitythata.300hitterhitssafely
in40
consecutivegames
isconsidered,assumingvarious
number
ofat-bats
per
gameandvariabilityin
pitchers’
ability.
UsingaBernoullimodel
tosearchforhotnessin
rich
contexts
asthegameofbasketballorbaseballisan
oversimplificationthatmaysignificantlydistort
streak
probabilities.
Swartz(1990)
X1�Bernoullið
p1Þ,
Xjj
X1;...;X
j�1�Bernoullið
pjÞ,
where
pj¼Xj�
1
i¼1
wji½r
jXiþ
p1ð1�
r j�=Xj�
1
i¼1
wji,
wji40;and0p
r jp1.
Thechi-square
test
(usedbyTverskyandGilovich
1989a)andtherunstest
(usedalsobyGould
1989)are
notverypowerfulin
distinguishingsm
allchanges
from
thenullhypothesis.
Stern
andMorris(1993)
Comment
ReanalysisofAlbright’sdata
on40full-tim
ebaseball
playersavailable
foreach
of4seasons.
Thelogisticregressionmodel
usedin
Albright’sstudy
hasalm
ost
nopower
todetectstreakhittingatthe
individualplayer
level.
Sim
ulations(10,000replications)ofplayer-seasonswere
conducted,each
seasonconsistingof560independent
battingattem
pts
withprobabilityofsuccessequalto
.280.Threealternatives
totheBernoullimodel
for
batterswerealsoconsidered.
Albright(1993b)
Rejoinder
1.Thenegativebiasin
thelogisticregressionmodel,
whichwasfoundbyStern
andMorris,merely
indicatesthattherewereslightlymore
evidence
of
streakinessthanstabilityacross
allplayer-seasons.
2.Thelogisticregressionmodel
should
notbeable
to
detectvariations,ofthekindproposedbyStern
and
Morris,from
theindependentBernoullimodel.
Albert(1993)
AMarkovsw
itchingmodel
usinga‘‘movingaverage’’
plotisproposed,in
whichaplayer
switches
between
twobattingaverages
(ahotoracold
state)from
game
togame.
Within
agame,
thesuccessiveat-bats
are
independentBernoullitrialswithafixed
success
probability.Themodel
wasfitted
to50American
Leagueregulars
and50‘‘random’’hitters.
Thepeaksandvalleysobserved
inthehitting
perform
ance
ofsomeplayerswould
just
bedueto
chance.
M. Bar-Eli et al. / Psychology of Sport and Exercise 7 (2006) 525–553532

ARTICLE IN PRESSWardrop(1999)
Thedata
are
100Bernoullitrialswithprobabilityof
successequalto
pB.Atsomerandom
point,the
probabilityofsuccessincreasesto
pH,remainsatthat
valueforaspecified
number
oftrialsandthen
returns
toitsoriginalvalue
pB.
1.Noneoftheseven
testsconsidered
inthestudy(i.e.,
therunstest,thetest
offit,theAC2test,theAC3
test,andthe
Sjtests)
possessesmuch
power
unless
thedeparture
from
Bernoullitrialsisfairly
substantial.
2.In
particular,thetest
offitisfoundto
beinferiorto
theother
testsatdetectinganydeparture
from
Bernoullitrials.
3.Whilefew
tests(therunstest,theAC2test,andthe
AC3test)are
goodatdetectingautocorrelation,but
pooratdetectingnon-stationarity—
theother
tests
(the
Sjtests)
exhibited
anopposite
trend.
Foreach
ofthe38non-stationarity
alternatives
discussed,asimulationstudywith1000runs(sequences
of100trials)wasperform
ed.
Thedata
are
100dichotomoustrials.Thefirsttrialisa
Bernoullitrialwithprobabilityofsuccess
pB.After
Lor
more
consecutivesuccesses,theprobabilityofasuccess
ispB+d;
after
Lormore
consecutivefailures,the
probabilityofasuccessis
pB–d;
otherwisethe
probabilityofsuccessis
pB.
Foreach
ofthe36-autocorrlationalternatives
discussed,asimulationstudywith1000runs(sequences
of100trials)wasperform
ed.
Miyoshi(2000)
Sim
ulatedrecordsofshotswerecreated.Each
shotwas
aBernoullitrialandtheprobabilityofsuccessfulshots
wasmanipulatedto
produce
sequencesofhot-hands
shots.Onehundredandtw
enty
differentscenarioswere
considered.
Therunstest
andthestationarity
test
usedbyGilovich
etal.seem
insufficientlysensitive:
both
testsdetected,
onaverage,
only
12%
ofallthehothandsphenomena
inthesimulatedrecords.
Frameet
al.(2003)
Aregim
e-shiftingmodel
inwhichabasketballplayer
hasafixed
probabilityofsw
itchingback
andforth
between‘‘hot’’and‘‘cold’’regim
es(i.e.,success
probabilities).
Therunstest
haslittle
power
todetectnon-stationarity
ofthekinddescribed
bythemodel.
Dorsey-Palm
ateer
and
Smith(2004)
Asimulationmodel
involved
asingle
bowlerwhohad
temporary
hotandcold
spells:Duringevery7games
therewere10-framehotandcold
periodswith
respectivestrikeprobabilitieshigher
orlower
then
the
bowler’sbase
rate.Thesimulatedmodel
wasreplicated
10milliontimes
foreach
ofthreedifferentscenarios.
Thethreetest
statisticsconsidered
inthestudy(i.e.,the
Fisher’sexact
test,thenumber
ofrunstest,andthe
length
ofthelongestrun)are
ineffectiveatdetecting
non-stationarity.
Burns(2004)
Aprogram
thatsimulatedbasketballshootingwas
designed,basedonaMarkovmodeling.Four
parametersweredefined:
b(biasto
givetheballto
Player
X),
h(beliefin
thehothand),
x(shootingability
forPlayer
X),and
y(shootingabilityforPlayer
Y).On
each
trialaplayer
wasselected
totakethenextshot,
withaprobabilityofsuccessequalto
hisshooting
Ofthe4752(48�99)pairsofsimulationruns,only
43
yielded
negativeadvantagescores.Thus,usingstreaks
(i.e.,thehothandbelief)
asanallocationcueisvalid,
since
thisbehaviorachieves
theteam
goalofscoring
more.
M. Bar-Eli et al. / Psychology of Sport and Exercise 7 (2006) 525–553 533

ARTICLE IN PRESS
Table
2(c
on
tin
ued
)
Study
Statisticalexaminationandsimulateddata
Resultsandconclusions
ability.Foreach
parameter
combination,10million
trialsofthehot-handandoftheno-hot-hand
simulationswererun.
Sun(2004)
AMarkovsw
itchingmodel
withsubstantialchanges
in
shootingaccuracy
(ahotoracold
state)wastested
usingGilovichet
al.’sfieldgoaldata
on16NBA
players.Switchingprobabilitywasrandomly
selected
from
(.95and.05)witha50–50percentchance
for
every10shots.
Both
therunstest
andtheMMAC
(Max–Min
Moving
Autocorrelation)statisticsindicatedthattheMarkov
model
wassignificantlybetterapproxim
ationto
the
data
incomparisonto
thesimple
binomialmodel.
Foreach
player,10,000simulationsforboth
the
binomialmodel
andtheMarkovmodel
were
perform
ed.
Thus,thebinomialmodel
isinadequate
toserveasa
norm
ativemodel
tovalidate
thehothand.
M. Bar-Eli et al. / Psychology of Sport and Exercise 7 (2006) 525–553534

Magnus, 2001). Whether sequential dependence between events or the non-stationarity argumentserve as appropriate descriptions of the hot hand phenomenon depend on the norms applied, asdiscussed elsewhere (Burns, 2004; Gula & Raab, 2004; Hales, 1999). So far, we think it is safe tosay that the scientific support for the hot hand is controversial and fairly limited. Still, the belief isstronger than the reality. As Amos Tversky, who initiated the hot hand research, used to say (citedby Gilovich in an online chat, September, 2002), ‘‘I’ve been in a thousand arguments over thistopic, won them all, but convinced no one’’.The question whether the hot hand phenomenon does or does not exist remains for the
meantime unresolved. From the point of view of the sports scientist there is one important aspectthat is worth looking into when judging the relevance of this issue. Saying that there is no hothand not only contradicts spectators’ and players’ perceptions, but it also goes against a wholebody of research (e.g., Bandura, 1997) relating to the role of success and self-efficacy in theenhancement of athletic performance (Bar-Eli & Ritov, 1997; Smith, 2003). Among the diversesources of efficacy information, enactive mastery experiences (i.e., performance accomplishments)are regarded as the most influential source. According to this theory, a reciprocal relationshipbetween efficacy beliefs and performance outcomes is expected. This idea was used to explainsuccessful streaks within athletic contests, which are usually characterized as shifts inmomentum.1 Moreover, when the same actions (routines) are performed under invariantconditions, adjacent performances are expected to be highly correlated. The fact that Gilovich andhis associates (1985) found no evidence for a positive correlation between successive attempts,even under invariant conditions (i.e., free throws in games, or shots taken from fixed positions intraining sessions), could be quite problematic for the theory of self-efficacy.
The preliminary hot hand research
The phenomenon of the hot hand is known to everyone who plays or watches the game ofbasketball. After the player has a run of successful baskets, people tend to believe that he will bemore likely to succeed with the next shot as well. This has a plausible causal explanation: When aplayer feels ‘‘hot’’, his confidence in his ability increases. He becomes relaxed and focused onperforming the shots accurately. So, he ‘‘gets in a groove’’, such that success in further attemptsbecomes more likely (Hales, 1999). As Robert Hooke (1989) expressed it so well:
‘‘In almost every competitive activity in which I’ve ever engaged (baseball, basketball, golf,tennis, even duplicate bridge), a little success generates in me a feeling of confidence which, aslong as it lasts, makes me do better than usual. Even more obviously, a few failures can destroythis confidence, after which for a while I can’t do anything right’’ (p. 35).
Such statements assume that athletes’ success probabilities are affected by some kind ofphysical or psychological state, which, for example in basketball, results in seeing the basket muchwider or being ‘‘in the zone’’. Athletes believe in the hot hand because they have experienced it.
ARTICLE IN PRESS
1Momentum refers to changes in performance based on success or failure in recent events. Terms such as the ‘‘hot
hand’’ and ‘‘streak shooting’’ are common examples of perceived momentum. For further discussion of the relationship
between psychological momentum and (athletic) performance, see Cornelius, Silva, Conroy, and Petersen (1997),
Kerick, Iso-Ahola, and Hatfield (2000), Miller and Weinberg (1991), and Taylor and Demick (1994).
M. Bar-Eli et al. / Psychology of Sport and Exercise 7 (2006) 525–553 535

No one doubts that streaks do occur in sports. Obviously, every now and then a professionalbasketball player may hit a string of nine or ten shots. The key issue in the debate, however, iswhether the observed superior (or inferior) performance really deviates from what could occur bychance. Clearly, even random processes such as coin flipping could occasionally result in longstreaks of heads or tails. So, an ‘‘unusual’’ performance by an athlete or a team may representpure statistical probability, or it could be related to a real ‘‘streakiness’’ mood. Supporters of thehot hand strongly believe that even if one accepts the notion that in the world things are oftenrandom, there are still some moments in time when athletes act well above or below their norm(i.e., their base rate).Recently, the norm for deciding whether the hot hand belief is correct or not has been extended
beyond comparison to chance. For example, Burns (2001, 2004) argued that the hot hand beliefmight serve as an adaptive strategy in situations where base rates are unknown or varied, since itleads teammates to allocate the ball to the player with the higher actual shot rate. In line withBurns, Gula and Raab (2004) argued that the hot hand belief is mistakenly judged as being afallacy due to a scientific norm of randomness, which is less important than the adaptive value ofthe belief in real decisions. Let us start from the beginning to see how this debate evolved to itscurrent status.Research on the hot hand started with Gilovich et al. (1985),2 a paper originally reported in
Cognitive Psychology (this research reappeared with slight changes in an article by Tversky &Gilovich in Chance, 1989a). Gilovich and his colleagues investigated whether the intuitions ofbasketball players and fans concerning a hot hand in shooting have any empirical support inactual basketball statistical data. The study begins with a survey that intends to verify exactlywhat fans believe they are seeing when they say a player has the hot hand. They found that 91% offans agreed that a player has ‘‘a better chance of making a shot after having just made his last twoor three shots than he does after having just missed his last two or three shots’’. On average, thedifferences in hitting probabilities were judged to be nearly 20%; when shooting pairs of freethrows, 68% of fans thought that a player has ‘‘a better chance of making his second shot aftermaking his first shot than after missing his first shot’’; and 84% of fans believed that ‘‘it isimportant to pass the ball to someone who has just made several (two, three, or four) shots in arow’’. Professional basketball players expressed similar beliefs.In the next stage, Gilovich et al. (1985) translated these common beliefs into a statistical
hypothesis that could be tested. They operationally defined ‘‘hot hand’’ using several within-gamemeasures (e.g., analyses of conditional probabilities, run counts, and serial correlations) and onebetween-game measure (a comparison of the observed and expected variability in shootingpercentages across games using the Lexis ratio). This part of the research consisted of three studiesin which Gilovich and his colleagues examined the existence of hot hands using three sets of realdata: shots from the field of professional basketball players during National BasketballAssociation (NBA) games; pairs of free throw shots during NBA games; and data from acontrolled shooting experiment conducted with men and women varsity basketball players.Gilovich and his colleagues (1985) found no evidence of the hot hand phenomenon in any of
their data sets. Looking at personal shot sequences for nine members of the 1980–1981Philadelphia 76ers (a total of 3800 shots across 48 home games), it turned out that players’
ARTICLE IN PRESS
2A manuscript of this study was already submitted in 1983.
M. Bar-Eli et al. / Psychology of Sport and Exercise 7 (2006) 525–553536

probabilities of making a shot were usually somewhat lower after having made shots than afterhaving missed shots, contrary to the hot hand belief. A comparison of the observed and expectednumber of runs of hits and misses in the data for each player, across all games and withinindividual games, also did not support the streak-shooting hypothesis. Moreover, a test ofstationarity (i.e., a test which is sensitive to certain fluctuations in hitting probability over time)indicated that there were no more ‘‘hot’’ or ‘‘cold’’ spells in the players’ hit rate than would beexpected by chance. A parallel analysis of the field goal records of two other NBA teams, the NewJersey Nets and the New York Knicks, provided evidence consistent with the above findings.Shots were also independent during free throw shooting of the Boston Celtics and in an
experiment with Cornell’s varsity teams.3 In comparison with field goal data, both data sets wereconsidered to be ‘‘cleaner’’, since they were unaffected by external factors such as players’ shotselection or defensive pressure of the opponents. Still, none of the statistical tests could reliablydetect hot hands. Finally, Gilovich et al. (1985) demonstrated that intuition in predicting theoutcomes of shots (based on patterns of successes) was faulty, as the outcomes of previous shotsinfluenced Cornell players’ predictions (expressed in the form of a betting game), but not theirperformance.Obviously, Gilovich et al. (1985) did not wish to claim that basketball shooting is a purely
chance process, like coin tossing. There is very little about basketball performance, of course, thatis random. The data merely indicate that the chances of hitting a given shot (i.e., a player’s hitrate) are largely independent of the player’s prior performance. Yet the outcomes of previousshots may well have an effect on a player’s willingness to take the next shot. As a result, a playermay score more points in one period than in another, not because of real changes in hisperformance level (i.e., shooting accuracy), but simply because he shoots more often (Tversky &Gilovich, 1989a).In another study, Tversky and Gilovich (1989b) reported on an additional analysis in a new
data set (which was collected originally by Larkey et al., 1989). They computed for each player theserial correlation for all pairs of successive shots separated at most by one shot of another playeron the same team. The time span between shots is generally less than a minute and a half. Still, theresults did not support the locality hypothesis: Correlations’ overall mean was .02, and none ofthe values was statistically significant.Gilovich et al.’s (1985) basketball shooting research has generated a sizable number of follow-
up studies and further analyses and critiques. Research on the hot hand has been extended beyondthe original sport studied, basketball, to other sports, including baseball (Albert & Bennett, 2001;Albright, 1993a; Frohlich, 1994; Gould, 1989; Siwoff, Hirdt, & Hirdt, 1988; Stern, 1995; Vergin,2000), volleyball (Raab, 2002; Raab, Gula, & Gigerenzer, submitted), golf (Clark, 2003a, b; Clark,2005; Gilden & Wilson, 1995b), tennis (Klaassen & Magnus, 2001), bowling (Dorsey-Palmateer &Smith, 2004; Frame et al., 2003), darts (Gilden & Wilson, 1995b), pocket billiards (Adams, 1995),and horseshoe pitching (Smith, 2003). It has also generated a great deal of interest amongresearchers in other academic fields (such as economics, cognitive science, law, and even religion).
ARTICLE IN PRESS
3Gilovich et al. (1985) reported that only one player out of 26 exhibited a significant positive correlation, which we
might expect just by chance. For a different interpretation of the results obtained in this experiment, see Wardrop
(1998).
M. Bar-Eli et al. / Psychology of Sport and Exercise 7 (2006) 525–553 537

Evidently, the intuition that Gilovich et al. have challenged is strong enough to keep the researchon the topic in motion.
The origin of the hot hand belief
Gilovich et al. (1985) suggested that the consistent belief in the hot hand could be due to amemory bias. If streaks are more memorable than alternations, the observer is likely tooverestimate the correlation between successive shots. However, they favored another possibleexplanation. They attributed the discrepancy between the observed basketball statistics and theintuition of knowledgeable observers to a general misconception of the laws of chance, wherebyeven short random sequences are expected to be representative of the process that generates them.In other words, people often disregard sample size when making judgments and predictions. Thiscognitive bias has been described previously by Tversky and Kahneman (1971, 1974), and isknown as ‘‘the belief in the law of small numbers’’. While watching a random process, peopleusually expect more alternations and fewer long streaks than actually occur, and thus tend to‘‘detect’’ patterns (i.e., streaks) even where none exist (Tversky & Gilovich, 1989a).4 A similarinterpretation relating to people’s inability to perceive randomness was also offered by Falk andKonold (1997). So, in the game of basketball the hot hand fallacy appears to be a purely mistakennotion about the distribution of hits and misses (Gilovich, 2002).Few researchers have questioned Gilovich et al.’s (1985) deductions. Gigerenzer (2000) pointed
out that explaining the gambler’s fallacy (i.e., a streak of events is likely to end; this phenomenonwas first described by Laplace, 1814/1951) and the hot hand fallacy (i.e., a streak should continue)with the same principle raises problems. Yet, both of these opposing phenomena have beenattributed to the ‘‘representativeness’’ heuristic. Amazingly, this one-word explanation accountsfor both A and non-A. Ayton and Fischer (2004) expressed similar observations and proposedalternative accounts for these two opposing expectations. They empirically demonstrated thatsequence recency (i.e., binary sequences with different alternation rates; positive vs. negativerecency) influences subjects’ attributions that human performance or chance generated thesequence. Burns and Corpus (2004) argued that critical to how streaks are interpreted are people’sjudgments about the underlying process generating the events. A manipulation check confirmedBurns and Corpus’s predictions that people are more likely to follow streaks when the mechanismgenerating events is judged to be non-random than when the generating mechanism is judged tobe random.In line with the above arguments, Caruso and Epley (2004) claimed that predictions about the
continuation of a streak depend on perceptions of the agent’s intentions. Thus, the hot handshould emerge in contexts involving intentional agents (i.e., humans) where events are perceivedto be dependent on one another; streaks indicate intentional actions that should continue. Inother contexts involving unintentional agents (i.e., machines), such as the gambler’s fallacy,streaks represent random accidents that are unlikely to continue.
ARTICLE IN PRESS
4Recently, a brain study by Huettel, Mack, and McCarthy (2002) demonstrated that specific areas of the brain are
activated by streaks, and that the strength of the signal is related to the length of the streak.
M. Bar-Eli et al. / Psychology of Sport and Exercise 7 (2006) 525–553538

The validity of the hot hand belief
Studies that provide evidence against the existence of the hot hand
Since Gilovich et al.’s original report was published in 1985, most of the subsequent researchhas continued to consist of statistical tests of actual sports data in an effort to determine if thereare sports where a hot hand can be detected. While most of the research has concentrated oneither finding support or rejecting the existence of the hot hand using archival and simulated datasets (so as to improve methodological concerns), theoretical improvements have been almostneglected, and have not been systematically and experimentally examined (see Burns, 2004 for anexception). Meanwhile, both common interpretations of the hot hand belief, either sequentialdependence between successive attempts or the non-stationarity claim, have been extensivelyexamined, particularly in basketball and baseball.Siwoff et al. (1988) reported their own study of streakiness in the game of baseball for the
1984–1987 seasons. They calculated the batting averages of players in games right after a ‘‘hot’’ ora ‘‘cold’’ streak (defined as a sequence of five games over no more than 7 days during which theplayer batted at least .400 or less than .125, respectively), and compared these batting averages tothe players’ overall record. They found that batting averages were just about as likely to be higherfollowing cold streaks as following hot streaks.Albright (1993a) analyzed streakiness in batting by examining 501 season records of
professional baseball players through four seasons (1987–1990). His analysis used logisticregression to incorporate situational effects on hitting into his model (e.g., pitcher’s Earned RunAverage, pitcher’s handedness, home/away status of the game, and night/day status). Statisticalassociation between outcomes of successive at-bats was tested, while the other extraneous factorswere held constant. Using several years of data, it was also possible to test whether certain playerswere particularly streaky, or if perhaps streakiness tends to be a one-season phenomenon.Albright found that while some batters exhibited streakiness in some seasons (e.g., Dwight Evansin the 1988 season), they did not do so consistently, and the number of runs in the data (sequencesof successful at-bats or unsuccessful at-bats) did not significantly deviate from randomness.Frohlich (1994) reported on similar results for strings of consecutive hits (actually, the incidenceof no-hit games was of interest in this study) in baseball, at the team level.Commenting on Albright’s article (1993a), Stern and Morris (1993) argued that no convincing
evidence of streaks was found in the data, due to the small effect sizes and a bias in logisticregression that offset the small effect. Albert (1993) proposed a Markov switching model, in whicha player switches between two batting averages from game to game. However, such a model didnot lead to the conclusion that streakiness does in fact exist in batting (interested readers shouldrefer to Albright’s (1993b) rejoinder).5 Stern (1995) suggested that evidence of streaks exists inAlbright’s data, if players are analyzed as a group rather than individually.Gould (1989) stated that hitting streaks in baseball do not exist, with a single exception—Joe
DiMaggio’s 56-game hitting streak during the 1941 season. This remarkable record has never
ARTICLE IN PRESS
5Elsewhere, Albert and Williamson (2001) analyzed Javy Lopez’s pattern of hitting across games for the 1998 major
league baseball season, using the Markov switching model. Contrary to the belief that Lopez was streaky during this
season, the model was unable to pick up any significant streakiness.
M. Bar-Eli et al. / Psychology of Sport and Exercise 7 (2006) 525–553 539
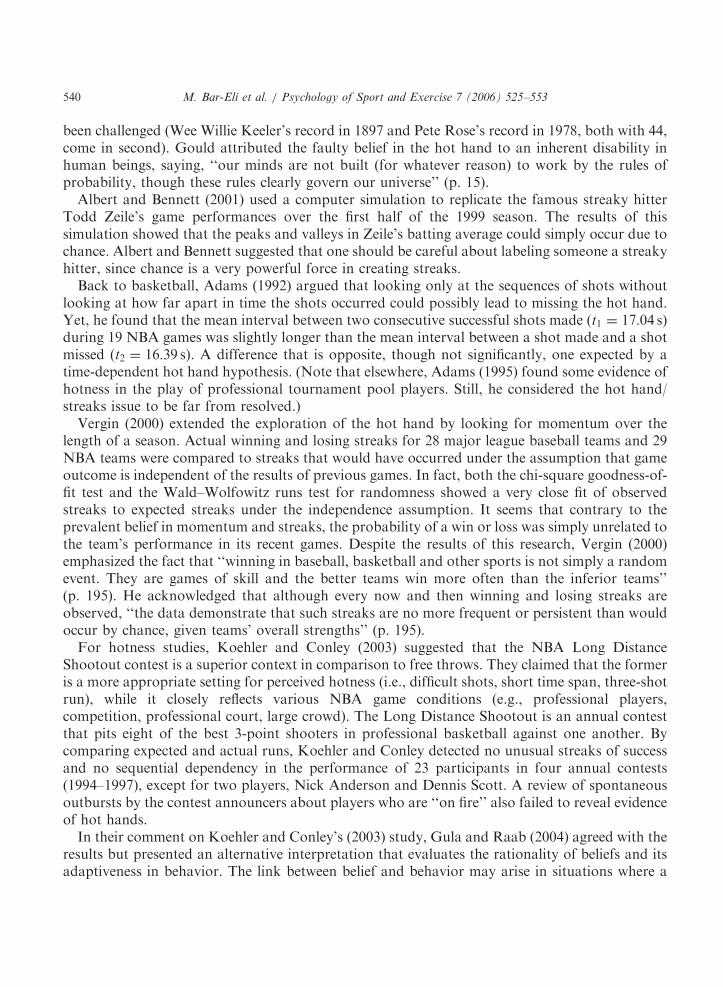
been challenged (Wee Willie Keeler’s record in 1897 and Pete Rose’s record in 1978, both with 44,come in second). Gould attributed the faulty belief in the hot hand to an inherent disability inhuman beings, saying, ‘‘our minds are not built (for whatever reason) to work by the rules ofprobability, though these rules clearly govern our universe’’ (p. 15).Albert and Bennett (2001) used a computer simulation to replicate the famous streaky hitter
Todd Zeile’s game performances over the first half of the 1999 season. The results of thissimulation showed that the peaks and valleys in Zeile’s batting average could simply occur due tochance. Albert and Bennett suggested that one should be careful about labeling someone a streakyhitter, since chance is a very powerful force in creating streaks.Back to basketball, Adams (1992) argued that looking only at the sequences of shots without
looking at how far apart in time the shots occurred could possibly lead to missing the hot hand.Yet, he found that the mean interval between two consecutive successful shots made (t1 ¼ 17:04 s)during 19 NBA games was slightly longer than the mean interval between a shot made and a shotmissed (t2 ¼ 16:39 s). A difference that is opposite, though not significantly, one expected by atime-dependent hot hand hypothesis. (Note that elsewhere, Adams (1995) found some evidence ofhotness in the play of professional tournament pool players. Still, he considered the hot hand/streaks issue to be far from resolved.)Vergin (2000) extended the exploration of the hot hand by looking for momentum over the
length of a season. Actual winning and losing streaks for 28 major league baseball teams and 29NBA teams were compared to streaks that would have occurred under the assumption that gameoutcome is independent of the results of previous games. In fact, both the chi-square goodness-of-fit test and the Wald–Wolfowitz runs test for randomness showed a very close fit of observedstreaks to expected streaks under the independence assumption. It seems that contrary to theprevalent belief in momentum and streaks, the probability of a win or loss was simply unrelated tothe team’s performance in its recent games. Despite the results of this research, Vergin (2000)emphasized the fact that ‘‘winning in baseball, basketball and other sports is not simply a randomevent. They are games of skill and the better teams win more often than the inferior teams’’(p. 195). He acknowledged that although every now and then winning and losing streaks areobserved, ‘‘the data demonstrate that such streaks are no more frequent or persistent than wouldoccur by chance, given teams’ overall strengths’’ (p. 195).For hotness studies, Koehler and Conley (2003) suggested that the NBA Long Distance
Shootout contest is a superior context in comparison to free throws. They claimed that the formeris a more appropriate setting for perceived hotness (i.e., difficult shots, short time span, three-shotrun), while it closely reflects various NBA game conditions (e.g., professional players,competition, professional court, large crowd). The Long Distance Shootout is an annual contestthat pits eight of the best 3-point shooters in professional basketball against one another. Bycomparing expected and actual runs, Koehler and Conley detected no unusual streaks of successand no sequential dependency in the performance of 23 participants in four annual contests(1994–1997), except for two players, Nick Anderson and Dennis Scott. A review of spontaneousoutbursts by the contest announcers about players who are ‘‘on fire’’ also failed to reveal evidenceof hot hands.In their comment on Koehler and Conley’s (2003) study, Gula and Raab (2004) agreed with the
results but presented an alternative interpretation that evaluates the rationality of beliefs and itsadaptiveness in behavior. The link between belief and behavior may arise in situations where a
ARTICLE IN PRESS
M. Bar-Eli et al. / Psychology of Sport and Exercise 7 (2006) 525–553540

faulty belief in the hot hand results in an adaptive behavior. For instance, if base rates areunknown or of a high variability, the perceived hotness of a player may assist other players in thegame in detecting the best shooter. Accordingly, if the value of the belief in the hot hand is beingjudged, than one should distinguish between the cognitive level of the phenomenon (the hot handbelief) and the behavioral level (favoring the hot player). Since Koehler and Conley focused ononly one of the two cognitive level criteria, i.e., the dependency of hits but not on non-stationarity,their results may have quite limited value if practical conclusions regarding behavior are tobe drawn.
Studies that provide evidence in favor of the hot hand
Larkey et al. (1989) challenged Gilovich et al.’s (1985) conclusions and continued to search forthe hot hand. In a new data set they collected, Larkey and his colleagues analyzed the records of18 outstanding players across the 1987–1988 NBA season. The results actually replicated Gilovichet al.’s findings: Half the players exhibited a positive serial correlation between successive shots,while the other half exhibited a negative serial correlation, thus providing no evidence for thehot hand.Larkey et al. (1989) dismissed these results on the grounds of both statistical and conceptual (or
contextual) arguments. They pointed out that extracting individual player sequences of hits andmisses from an actual game is too complicated a task, and that analysis should be restricted to‘‘cognitively manageable chunks of shooting opportunities’’ (p. 24). Therefore, they limitedconsideration to streaks that occurred during a short period within a game (i.e., sequences of 20baskets). Using a descriptive analysis method, it turned out that Detroit’s Vinnie Johnson, ‘‘theMicrowave’’, was indeed a streaky shooter, and hence the hot hand does exist. In their concludingremarks, Larkey and his colleagues rehabilitated the faith in our ability to make proper reasoningand stated that it is OK to believe in the hot hand.Since Larkey et al.’s (1989) argument in favor of the hot hand was based on the performance of
a single player in a single observation (i.e., a run of seven consecutive hits within a 20-shotsequence during the fifth Piston–Laker playoff game), Tversky and Gilovich (1989b) consideredthis conclusion to be hardly convincing. Most importantly, they revealed an error in VinnieJohnson’s shooting record coded by Larkey and his associates (the 7 out of 7 sequence by Johnsonturned out not to have happened!), which caused the whole case for the Microwave to ‘‘go up insmoke’’.Forthofer (1991) used newspaper box scores (i.e., the game summary of shots taken and made
by each player) to examine all NBA players in all games during the 1989–1990 season. Thisdatabase documented the record of 123 men who played in 50 or more games and averaged morethan nine shots per game. Forthofer’s main idea was to identify the most extreme players, andtherefore he classified streak shooters into one of three categories: those with ‘‘hot and coldstreaks’’, those with ‘‘hot hands’’, and those with ‘‘cold hands’’. For a player to be classified as astreak shooter, his record in 5% or more of the total number of games played had to beinconsistent with his season field goal percentage. Eventually, of the 123 players examined, 17players exhibited some form of streakiness, with an emphasis on three players.Wardrop (1998) highly praised Forthofer’s idea, but at the same time criticized his criterion for
labelling the streakiest shooters. Wardrop pointed out that if we eliminate the ‘‘shaky’’ cases in
ARTICLE IN PRESS
M. Bar-Eli et al. / Psychology of Sport and Exercise 7 (2006) 525–553 541

Forthofer’s results, we are left with only 10 players, not 17 who exhibited some form ofstreakiness. He also suggested that the same analysis should be repeated over several years to seewhether the set of players exhibiting streakiness will be fairly constant.In an earlier study, Wardrop (1995) reexamined the free throw data presented by Gilovich et al.
(1985) (i.e., free throw data for nine members of the 1980–1981 and 1981–1982 Boston Celticsteams) and suggested a different interpretation of the data. He showed that if the data areaggregated over players, then fans’ perceptions of hot hand in free throw shooting are correct:Players made a basket 79% of the time after a hit compared to 74% of the time after a miss. Healso showed that the Celtics players, as a group, were better free throw shooters on their secondattempt than on their first attempt. Wardrop considered it difficult to assume that any basketballfan has a separate 2� 2 contingency table for each of the hundreds, if not thousands, of players heor she has seen play. It seems much more reasonable to assume that a fan has a single 2� 2 tablein mind only for the aggregated data. This mental equivalent of Simpson’s paradox (Simpson,1951) could lead to a cognitive statistical illusion that results in ‘‘detecting patterns even wherenone exist’’. In other words, aggregation does not provide any evidence for the existence of the hothand, but merely helps us to understand why the fans believe what they do.Gilden and Wilson (1995b) presented some experimental evidence of streakiness in golf putting
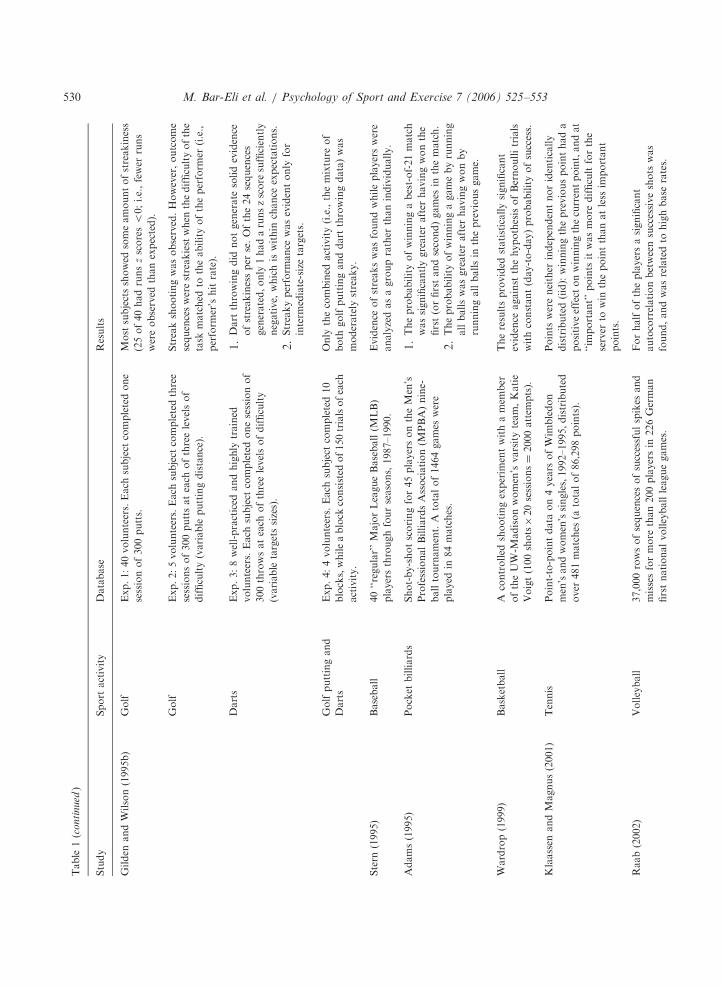
and darts, and showed that streak magnitude is closely associated with task difficulty, i.e.,performer’s hit rate. They also suggested that the time delay between trials could somehow explainthe negative results reported by Gilovich et al. (1985) in the context of free throw shooting. Smith(2003) criticized Gilden and Wilson’s results for their artificiality, explaining that theirexperiments involved volunteers performing 300 repetitions and being paid $5 plus 5 cents perhit. Smith argued that with so many trials and such small payment, no wonder that there weresubstantial fluctuations in the attentiveness of the poorly motivated volunteers.Clark (2003a) investigated the occurrence of streakiness among professional golfers on the
PGA Tour and Senior PGA Tour over a 2-year period. Whether players were examinedindividually or as a group, there was a significant tendency for players’ par or better rounds (i.e.,good performance) to cluster together and also for players’ above par rounds (i.e., poorerperformance) to cluster together. However, an additional analysis showed that the observedstreaks were related to the difficulty of the golf courses rather than to any inherent tendency ofplayers to be streaky. The results for the PGA Tour and Senior PGA Tour were extended later tothe Ladies Professional Golfers’ Association (LPGA) Tour as well (Clark, 2003b). In anotherstudy, Clark (2005) reported on the results of a hole-to-hole scores analysis for the same 35players on the 1997 PGA Tour. For each player, raw scores were converted to par or better andabove par, and were arranged in a 2� 2 contingency table. Whether one is interested instreakiness in individual tournaments or over the entire year, no evidence for a hot hand wasfound. The data on hole-to-hole scores strongly suggested that past performance is not a goodpredictor for future behavior.Klaassen and Magnus (2001) used almost 90,000 points (481 matches) at Wimbledon from 1992
to 1995 to investigate whether points in professional tennis were independent and identicallydistributed (iid). They found that unlike basketball, winning the previous point in tennis had apositive effect on winning the current point, and at ‘‘important’’ points it was more difficult forthe server to win the point than at less important points. Moreover, the stronger the player theweaker were these effects, for both men and women. For example, average players in the men’s
ARTICLE IN PRESS
M. Bar-Eli et al. / Psychology of Sport and Exercise 7 (2006) 525–553542

singles were expected to win approximately 65% of their service points. If the previous point waswon (and if the current point was not the first point in the game), then the probability of winning apoint increased by .3%, reflecting a ‘‘winning mood’’. However, if the previous point was lost, theprobability of winning a point decreased by .5%. At a point of zero importance, the probability ofwinning a point on service increased by .4% compared to a point of average importance. Klaassenand Magnus showed that the divergence from the iid model was so small, it could still provide agood approximation in many practical applications concerning tennis.Then again, the possibility can be raised that in games such as tennis, one cannot determine
whether an unusual performance is due to one player playing exceptionally well or the otherplaying badly, or the combination of the two (Adams, 1995). It is also worth noting that earlierstudies of tennis reported by Richardson, Adler, and Hankes (1988) and Silva, Hardy, and Crace(1988) found only limited support for a momentum effect. For other related aspects ofindependence and identical distribution of points in tennis, see Croucher (1981), Jackson andMosurski (1997), and Magnus and Klaassen (1999a, b, c).Smith (2003) argued that Gilovich et al.’s (1985) basketball data do not control for several
confounding factors (e.g., shot selection, lengthy spells between shots, and strategic adjustments).He found horseshoe pitching data to be much cleaner, since every pitch is made from the samedistance at regular intervals, with intense concentration and no strategy. An analysis of horseshoepitching data from the 2000 and 2001 World Championships indicated that world-class pitchersdo have modest hot and cold spells. Men and women were both somewhat more likely to throw adouble after a double than after a non-double and were also more likely to throw a double aftertwo doubles in the preceding two innings than after two non-doubles. Such variations in players’performances within games and across games provide evidence that success probabilities aresomewhat affected by previous outcomes.Frame et al. (2003) found evidence of hot hands in bowling using data from the Final Round of
1994–1998 Professional Bowlers Association (PBA) tournaments. During these years, the FinalRound involved step-ladder matches in which winners of each game moved on to play againsthigher seeded bowlers in their next games. The results indicated that the winners of each gamewon more than 50% of their subsequent games, even though they were competing against higherseeds. However, these results could be partly attributed to the effort exerted by the lower seedswho had to bowl continuously while the higher seeds were waiting for their turn to play.Dorsey-Palmateer and Smith (2004) examined professional bowling data from the 2002–2003
season, searching for streakiness in performance. Unlike Gilovich et al. (1985), they found that formany bowlers, the probability of rolling a strike (i.e., all 10 pins are knocked down on thebowler’s first throw) was not independent of previous outcomes and the number of strikes rolledvaried more across games than could be expected by chance. For example, most bowlers had ahigher strike proportion after rolling one-to-four consecutive strikes than after rolling one-to-fourconsecutive non-strikes, and this difference became more significant as the number of trialsincreased from one to four.Hales (1999) offered an epistemological observation to the hot hand in sports. In his paper, he
defended the view that hot hands do exist, and that players and spectators are often correct inidentifying them. Hales suggested that any streak or run of success should be considered as a hothand, with no arbitrary restrictions on how rare or improbable it must be. Thus, if MichaelJordan hits 10 free throws in a row, he does have a hot hand, even if statistically this is a
ARTICLE IN PRESS
M. Bar-Eli et al. / Psychology of Sport and Exercise 7 (2006) 525–553 543

conceivable occurrence given his skill as a player and his experience in free throw shooting.Having the hot hands simply represents above-average success runs: people are ‘‘shootingabove their norm, serving better than average, punting deeper than usual, deviating above themean’’ (p. 84).
The hot hand test statistics
Gilovich et al. (1985) stated that in statistical terms, fans’ perceptions of the hot hand exhibitednon-stationarity and serial dependence. They used four different types of statistics to analyze eachplayer’s sequence of hits and misses: the proportion of successful shots, conditioned by the successor failure of the previous shot(s); the first-order correlation coefficient; the number of runs in thedata using the Wald–Wolfowitz runs test; and the number of successful, moderately successful,and less successful series of consecutive shots, in blocks of four. To check stationarity, a chi-square test was performed on successive blocks of four shots.An important question to be asked is whether Gilovich et al.’s (1985) research provides enough
evidence to reject the existence of the hot hand phenomenon in basketball. Is it possible that theirfindings are valid but hot hands still exist? Few researchers decisively argue that the statisticalpower of Gilovich et al.’s analyses may have been insufficient. Kaplan (1990) argued that Tverskyand his associates mistakenly based their conclusions on a Bernoulli model independent, identicaltrials. Using such a model to search for hotness in rich contexts such as the games of basketballand baseball is an oversimplification that may significantly distort streak probabilities. Swartz(1990) illustrated that the statistics used by Gilovich et al. (in particular, the chi-square test) werenot very powerful in distinguishing the null hypothesis (i.e., the non-existence of the hot hand)from some other alternatives.The binomial model (usually referred to as the coin-tossing model) assumes that for each player,
shooting trials are independent, and that the probability of success is constant over trials. Gilovichet al. (1985) focused on independence as the leading argument in opposition to the hot hand beliefin sports. Since the publication of their results, the claim of sequential dependence has beenextensively studied; it seems that researchers do share the notion that consecutive successful shotsare often not positively associated. However, another possible interpretation of this belief suggeststhat players’ performance fluctuates over time and that hit rates are not constant (i.e., the non-stationarity claim; see Gula & Raab, 2004; Hales, 1999; Raab, 2002). For instance, a basketballplayer’s success probability might be 0.5 for 15 trials, then suddenly change to 0.6 for 8 trials, andthen return to 0.5 for the next 15 trials. In such cases, the simple binomial model may not be aproper normative model for evaluating the validity of the hot hand belief.Few researchers strongly believe that streaks do occur, however, both the magnitude of the
phenomenon and statistical tests in use are often so weak that streaks can hardly be detected.Studies by Dorsey-Palmateer and Smith (2004), Miyoshi (2000), and Wardrop (1999), and aworking paper by Frame et al. (2003), all demonstrate that standard hot hand tests are unable todetect non-stationarity and changes in the success probability.Wardrop (1999) addressed the question of whether Bernoulli trials are a suitable model for the
outcomes of successive shots in basketball. He reported on a large simulation study using aspecific model of non-stationarity: The data consisted of a sequence of 100 Bernoulli trials with
ARTICLE IN PRESS
M. Bar-Eli et al. / Psychology of Sport and Exercise 7 (2006) 525–553544

probability of success equal to pB (for example pB ¼ 0:5). At some random point, the athlete getshot and the probability of success increases to a value pH4pB for a specified number of trials (forexample, pH ¼ 0:7 for the duration of 10 trials). Afterwards, the probability of success returns toits original value pB for the remainder of the sequence. Wardrop found that both the runs test andthe test of fit used by Gilovich et al. (1985) had little power to detect departures from Bernoullitrials (i.e., non-stationarity) unless pH was much larger than pB. In fact, he concluded that the testof fit was worthless and hence it should not be used.Frame et al. (2003) presented a model in which a player has a fixed probability of switching
back and forth between ‘‘hot’’ and ‘‘cold’’ regimes.6 They demonstrated that the runs test has littlepower to detect non-stationarity in such a regime-shifting model. Dorsey-Palmateer and Smith(2004) examined the power of several tests (specifically, the Fisher’s exact test, the number of runstest, and the length of the longest run) by using a model in which bowlers had temporary hot andcold spells. They emphasized that test statistics with relatively few observations are often largelyineffective unless extreme violations of the binomial model’s assumptions are present.Miyoshi (2000) used simulations to suggest that the sensitivity of tests used by Gilovich et al.
(1985) depends on four variables: the frequency of hot hand periods in a season, the total numberof hot hand shots in the season, the number of shots in each hot hand period, and the size of theincrease in the probability of success in hot hand periods. He demonstrated that when the valuesof these variables were set realistically, Gilovich et al.’s tests (i.e., the runs test and the test of fit)could detect, on average, only 12% of all the hot hands phenomena in the simulated records.Therefore, Miyoshi urged us not to reject the existence of the hot hand in basketball merely on thebasis of Gilovich et al.’s findings.Hooke (1989) emphasized the inherent difficulty of using statistical methods to study
complicated situations, such as the game of basketball or baseball. According to his own intuition‘‘the alternative hypothesis is not that there is a ‘hot hand’ effect that is the same for everyone,but that the real situation is much more complex’’. Consequently, ‘‘a measure that is appropriatein detecting the effect for one of these types [of hot- hands] may not be very powerful foranother’’ (p. 36). It appears that the issue is much more complicated than Gilovich et al. made itout to be.
Implications of the hot hand belief
One relevant demonstration for the hot hand belief effect is related to betting in sports.Camerer (1989) examined whether perceived hotness affected the point spreads in the sportsbetting market. He found that bets placed on teams with winning streaks were more likely to belosers rather than winners (while losing-streak teams performed better than expected), and thus heconcluded that the basketball market believes in the hot hand even though it does not exist. Thebiases were minor, however, and of marginal statistical significance. In a comment, Brown andSauer (1993) suggested that the changes be documented in both point spreads and team
ARTICLE IN PRESS
6Hot and cold regimes differ from one another in success probability. For example, an athlete might always have a
0.25 probability of switching between a ‘‘hot’’ regime with a 0.6 success probability and a ‘‘cold’’ regime with 0.3 success
probability.
M. Bar-Eli et al. / Psychology of Sport and Exercise 7 (2006) 525–553 545

performance stemming from streaks. Still, their results were inconclusive about whether the hothand is a myth or a firm reality.Another demonstration for the hot hand effect is related to game strategy. Gilovich (1984)
described several general biases and showed how they lead to faulty conclusions in the world ofsports. Some of these biases produce misconceptions, such as the belief in the Sports Illustratedjinx,7 and have no harmful consequences. Other misconceptions may lead to unfortunatedecisions, as in the case of the sophomore slump8 (Taylor & Cuave, 1994) and the belief in the hothand. Acting on the basis of the hot hand belief has several possible implications for how coachesuse their players, how teammates pass the ball during the game, and how willing the players are totake the next shot. Tversky and Gilovich (1989a) pointed out the direct consequences that such afallacy may have on basketball game strategy: ‘‘Passing the ball to the hot player, who is guardedclosely by the opposing team, may be a non-optimal strategy if other players who do not appearhot have a better chance of scoring’’ (p. 21). Thus, like other cognitive illusions, ‘‘the belief in thehot hand could be costly’’ (p. 21). Elsewhere, Gilovich (2002) emphasized that teams win gamesby having their shots taken by their best players from the best positions on the floor, whilepreventing the opponents from doing the same. He doubted whether the erroneous belief that hitstend to be followed by hits and misses by misses could serve such an effort.Burns (2004) presented evidence that under specific circumstances, base rates may well be
inferred from the runs of hits in a player’s performance. In an earlier article, Burns (2001) pointedout that the irrational belief in the hot hand might be an effective, fast, and frugal heuristic fordeciding how to allocate the ball between members of a team (even if shots really are independentevents). Since the number and length of streaks of successive hits is greater for those players with ahigher shooting percentage, it may well serve as a valid cue for detecting the best shooters.Moreover, when the hot hand belief is used for allocation decisions, Burns (2004) calculated anadvantage of about one extra basket per seven or eight games, which may result in winning orlosing a game. However, such an adaptive approach assumes that teammates cannot find the bestplayers without this cue of ‘‘hotness’’. Obviously, better cues do exist, especially when one isspeaking about professional NBA players.Gula and Raab (2004) discussed the relationship between base rates and streaks of hits
perceived as unusual. In light of the above arguments, they recommended that coaches andplayers incorporate both the hot hand information and other available indications (e.g., baserates, strength and weakness of opponent’s defense, trained tactics), so as to increase a team’sprobability of winning. However, whether the hot hand information or the base rate is to be useddepends on the environmental structure. For instance, it is likely that base rates and the hot handare positively correlated. In addition, it seems plausible that the base rate is a good predictor forsuccess in a game. Given that these two pieces of information are ordered by their validity, usingthe highest valid information (cue) could be quite successful. Whether only one piece ofinformation or several cues are needed depends on the cue–cue correlation as well as on the
ARTICLE IN PRESS
7A superstitious belief about athletes or teams having bad luck after their picture appears on the cover of Sports
Illustrated magazine. Such a belief is associated with the failure to recognize regression effects in athletes’ performances.8The term refers to an athlete’s atypically good performance in his rookie year, which is followed by a deterioration in
performance during the subsequent year. Despite the fact that this phenomenon is generally the result of statistical
regression, people tend to believe that factors such as a sophomore jinx or a player being overconfident are responsible
for the poor performance.
M. Bar-Eli et al. / Psychology of Sport and Exercise 7 (2006) 525–553546

cue–criterions correlation, as pointed out elsewhere (see Gigerenzer, Todd, & The ABC ResearchGroup, 1999, for an overview).
Discussion
Task segregation
Basketball and baseball studies dominate the hot hand literature. In comparison withbasketball and baseball, other sports are considered to have more valuable properties fordetecting streakiness in performance. For the present study, the main parameter to distinguishbetween the different sports is related to the individual-player envelope conditions whenperforming the counted task. In basketball, players make their shots from different distances andangles under different defense conditions, and in baseball, batters play against pitchers of differentabilities. In golf, darts, or bowling, some confounding factors related to team play, shot selection,defensive pressure, or other strategic considerations are expected to have almost no influence. It istherefore important to examine whether support for the hot hand was mostly found in the latterkinds of sports, and how significant was the effect.Evidently, grouping and analyzing the studies in Table 1 according to such a criterion (see the
‘‘sport activity’’ column) could hardly lead to a firm conclusion regarding the relationshipbetween the hot hand and the type of sport studied. In some studies, hot hands could not bedetected, even in sports or tasks that are performed in relatively ‘‘pure’’ settings, such as golf(Clark, 2003a, b; Clark, 2005), three point basketball shooting (Koehler & Conley, 2003), freethrow shooting (either in games, or shots taken from fixed positions in a controlled experiment, asreported by Gilovich et al., 1985), and darts (Gilden & Wilson, 1995b). However, it is worthnoting that the strongest support for the hot hand was found in the more ‘‘individually’’performed sports (as opposed to team-sports), namely horseshoe pitching (Smith, 2003), bowling(Dorsey-Palmateer & Smith, 2004), and to a certain extent tennis (Klaassen & Magnus, 2001).Moreover, even if the failure to find hot hands in basketball shooting is attributed to the nature ofthe task being performed (i.e., a closed skill, fine motor task that requires a narrow focus ofattention), such an argument still has no power to explain why evidence for the hot hand from anumber of studies in baseball (Albert & Bennett, 2001; Albright, 1993a; Frohlich, 1994; Siwoffet al., 1988; Vergin, 2000) was also elusive.While reviewing the hot hand literature, we evaluated the quality of the results obtained from
real data and various empirical studies. Several parameters were considered, such as the samplesize (number of participants), the control level of relevant confounding variables, the volume ofdata collected, the power of the statistical methods employed, and most important, thesignificance of the results obtained. High-quality data are no doubt needed, and evidently areseldom found. Among the more well-designed studies we found the non-supportive hot handprominent studies of Gilovich et al. (1985) and Tversky and Gilovich (1989b) in basketball;Albright (1993a), Vergin (2000), and Albert and Bennett (2001) in baseball; and Clark (2003a, b)and Clark (2005) with men and women golfers. On the supportive side, studies by Smith (2003)and Dorsey-Palmateer and Smith (2004) in horseshoe pitching and bowling, respectively,provided strong support for the hot hand, along with the Klaassen and Magnus (2001) study in
ARTICLE IN PRESS
M. Bar-Eli et al. / Psychology of Sport and Exercise 7 (2006) 525–553 547

tennis. It should be pointed out, however, that in the above-mentioned studies all participantswere professional athletes.This review follows the hot hand debate over the years. The gap between belief and reality is
what makes this issue so exciting. People are convinced that the effect exists because they stronglyfeel it, although the majority of well-designed studies could not provide evidence even for a smallsignificant effect. The extreme discrepancy between intuition (or expectations) and statisticalresults from a variety of sports is indeed astonishing. In any case, the hot hand effect size must bemuch smaller than athletes and fans believe. Yet, it is possible that hotness does exist, but specificvariables related to the person performing the task (e.g., level of expertise, level of arousal), thenature of task being performed (e.g., type of sport, level of accuracy needed), or the environmentin which the task is being performed (e.g., competitive atmosphere) interact so as to influence itsdetection. The combination of variables essential for the hot hand to emerge perfectly is still to beexplored, and hence, any progress toward this challenge might be of a great value.
Hot hand definitions
The hot hand body of research has certainly evolved in the last 20 years. Still, the main interesthas been focused on the question of whether hot hands exist or not, based on the same operationaldefinitions of hotness (and measures) proposed in the original study by Gilovich and hiscolleagues. Ninety-one out of 100 basketball fans expressed a belief that a player’s future successdepends on the results of his prior attempts. A statistical description of the hot hand phenomenonusing the term p(hit/hit)4p(hit/miss), usually combined with the runs count test, has become thestandard in hot hand research. The issue has rarely been addressed in a different manner so as toadvance the debate, with Hales’s perspective being an exception.Hales (1999) suggested that the common necessary conditions of having hot hands be rejected,
namely: (a) that a player should perform in a way that ‘‘success breeds success’’; (b) a streak ofsuccess should statistically be unlikely (e.g., Joe DiMaggio’s 56-game hitting streak in 1941); and(c) the number of successes in a row must exceed that predicted by chance. Once no suchproperties were found in real sports’ data, researchers (erroneously) concluded that there are nohot hands and that everyone is wrong in thinking otherwise. Instead, Hales argued that ‘‘being hotdoes not have to do with the fecundity, duration, or even frequency of streaks. It has to do withtheir existence’’ (p. 86). When one believes he has a hot hand, he may well be usually right.Such an epistemological point of view is surely unique and refreshing, though we suspect that
most researchers would not agree with it. However, if one considers the hot hand as not being aserial dependence between trials, an extreme statistical unlikeliness of streaks, or an occurrencewhich is beyond the laws of chance—then how else should it be described and measured? Hales(1999) and other researchers (Gula & Raab, 2004; Raab, 2002) put it simply, saying that a playerhas a hot hand when he is playing better than average. Well, if a streak could end at any time, thenon-stationarity claim, i.e., occasional fluctuations in a player’s hit rate, seems to serve as anadequate description of hotness; however, valid solutions (other than the simple model ofBernoulli trials, as suggested by Sun, 2004) are needed to model it. Moreover, we believe thatfocusing only on the sequential dependence criterion (‘‘an omnipresent effect’’, see Wardrop, 1998)and ignoring the non-stationarity argument (‘‘an occasional effect’’) would result in a non-sufficient definition of hotness, which might distort the nature of the phenomenon.
ARTICLE IN PRESS
M. Bar-Eli et al. / Psychology of Sport and Exercise 7 (2006) 525–553548

Practically, which of the two criteria used depends on the norms applied. From a behavioralpoint of view, the adaptive value of the belief in real decisions is more important than thenormative validity of the belief. Burns (2004) demonstrated that a team’s chances of winning agame were higher if the ball was passed to the ‘‘hot’’ player more often than according to players’base rates, even if such a strategy is based on a faulty belief. Therefore, we suggest that the hothand should be judged neither as being a fallacy nor as an adaptation, but as information to beused together with other cues (e.g., base rates, opponents’ defense abilities) for allocating the ballso as to win games.
The cold hand
The hot hand belief is generally based on the notion that success motivates people, throughraising their self-confidence, to keep doing well or sometimes to even do better. Whetherinvestigating the hot hand, clutch hitting,9 choking,10 or the cold-foot phenomenon, sportsresearch finds the psychological effects noticeably important. Being close to the hot handderivative, we find the cold hand/foot deserves appropriate attention as well.As mentioned earlier in this review, Tversky and Gilovich (1989b) found that a time delay
between shots had no effect on the probability of success for basketball players, and hence, cannotbe blamed for masking the hot hand. Later, Berry and Wood (2004) examined the effect of a time-out interval on the probability of success for field goal kickers on a ‘‘pressure’’ kick (i.e., a kickconsidered to be critical to the outcome of the game), and provided a somewhat differentconclusion. It was assumed that when allowing the kicker enough time (an extra 2min in this case)to think about the importance of his upcoming kick, his probability of success decreases (i.e., icingthe kicker). Using a multi-variable model accounting for different kickers, the distance of the kick,the turf type, indoor/outdoor games, and weather conditions, allowed for better isolation of thepossible effects of pressure and icing. Analyzing all pressure kicks during the 2002 and 2003National Football League (NFL) seasons, Berry and Wood found that icing the kicker hada quite strong negative effect depending upon the distance of the kick, and thus is indeeda successful strategy to be used in games. The effect of other factors examined, including thesecond psychological variable (pressure), was relatively minor. However, one should considerthe significance of the results obtained in the study in light of the small sample size (38) oficing attempts.
Evaluation procedure
Finally, since the outcomes of hot hand studies vary from seemingly support to seeminglynegation of the hot hand phenomenon, we find that evaluation of individual studies is essentialand valuable for future research. This is in comparison with considering an ‘‘overall picture’’ ofthe results obtained (i.e., the combined research results). For example, no hot hands could bedetected in field goal data for nine major players of the Philadelphia 76ers during the 1980–1981season (Gilovich et al., 1985, Study 2), while field goal data of 123 NBA players during the
ARTICLE IN PRESS
9Clutch hitting refers to substantial elevated performance under pressure circumstances.10Choking is defined as performance decrements under pressure circumstances (Baumeister, 1984).
M. Bar-Eli et al. / Psychology of Sport and Exercise 7 (2006) 525–553 549

1989–1990 season indicated that 17 were streak shooters (Forthofer, 1991). Such conflictingresults obtained from the same sport studied (i.e., basketball) and apparently with the same taskperformed (i.e., field goal shooting) raises an essential question regarding the validity of hot handdefinitions applied by the researchers. Combining the results of both studies so as to estimate theeffect size for the hot hand would blur such observations, which are more important to discussthan the overall magnitude of the effect. Even if one considers employing a quantitative procedurethat seems relevant to our discussion (i.e., estimating the effect size for the hot hand over a largenumber of observations), the figures obtained either in one direction or in the opposite, wouldhardly convince us about the existence or non-existence of the hot hand. Following Wardrop’s(1998) suggestions, progress is required in a few important aspects of hot hand research (e.g.,improving modeling processes), rather than focusing on what we label the results. In sum, webelieve that at the present stage of hot hand research the traditional narrative approach (i.e.,listing and describing conflicting research findings) is preferable. The controversy betweennumbers and intuition is yet to be solved, and thus it is suggested that the hot hand should still beregarded as an open question.
Concluding remarks
In this review we have presented the more important studies that investigated the hot hand insports. Our survey included both the empirical research, based on real data, and statisticalexaminations of simulated data. Although the issue has been extensively discussed in the last twodecades, the question of whether success breeds success and failure breeds failure remainsunsolved. Apparently, most of the empirical research supports Gilovich et al.’s (1985) argumentconcerning the non-existence of a relationship between future success and past performance (thesequential dependence claim). This has been strongly evident in professional basketball and in afew other sports. However, simulation studies demonstrate that fluctuations in success rates arepresent (the non-stationarity claim), and that the conventional tests in use are often unable todetect them.In light of the conflicting outcomes of the studies presented in this review, we think a step
further needs to be taken. First, the debate should be shifted from the search for evidence for oragainst the existence of the hot hand to a profound discussion about the norms used bystatisticians, psychologists, and sports people. Such an approach may promote a betterunderstanding of the issue, especially if at first glance conclusions seem to be contradictory.Second, further theoretical progress around the structure of the environment in which a hot handbelief is likely to emerge or change is also needed, as has already been proposed by Burns (2004).An important step forward, then, would be to detect the situational factors that enable us tojudge the value of the belief (a fallacy vs. an adaptive strategy) for decision-making. Finally, aresearch strategy that validates the scientific debate’s importance to real life decisions in sports(such as betting, allocation decisions, etc.) is required. Such a strategy would allow us tobecome prescriptive in this research field for many specific situations, sports, or decision-makingproblems.Koehler and Conley (2003) asserted that no single study could be the last word on this topic. It
may well be that hot hands do exist, but their presence is affected by factors related to the nature
ARTICLE IN PRESS
M. Bar-Eli et al. / Psychology of Sport and Exercise 7 (2006) 525–553550

of the task performed, the level of expertise, or some psychological (or emotional) variable. Ifstreak hitters or shooters do exist, future research should identify the conditions in which theymay emerge. On the other hand, if athletic performance is unconditionally not elevated due topast success, obviously the mental techniques (recommended by sport psychologists) commonlyused in both training and competitions should be reconsidered.
References
Adams, R. M. (1992). The ‘‘hot hand’’ revisited: Successful basketball shooting as a function of intershot interval.
Perceptual and Motor Skills, 74, 934.
Adams, R. M. (1995). Momentum in the performance of professional tournament pocket billiards players. International
Journal of Sport Psychology, 26, 580–587.
Albert, J. (1993). A statistical analysis of hitting streaks in baseball: Comment. Journal of the American Statistical
Association, 88, 1184–1188.
Albert, J., & Bennett, J. (2001). Curve ball: Baseball, statistics, and the role of chance in the game. New York:
Copernicus.
Albert, J., & Williamson, P. (2001). Using model/data simulations to detect streakiness. The American Statistician, 55,
41–50.
Albright, S. C. (1993a). A statistical analysis of hitting streaks in baseball. Journal of the American Statistical
Association, 88, 1175–1183.
Albright, S. C. (1993b). Rejoinder. Journal of the American Statistical Association, 88, 1194–1196.
Ayton, P., & Fischer, I. (2004). The hot hand fallacy and the gambler’s fallacy: Two faces of subjective randomness?.
Memory & Cognition, 32, 1369–1378.
Bandura, A. (1997). Self-efficacy: The exercise of control. New York: Freeman.
Bar-Eli, M., & Ritov, I. (1997). Judgmental heuristics and biases in sport: Theory and preliminary research. In
S. Tiryaki (Ed.), Proceedings of the 1st international symposium of sport psychology (pp. 14–19). Turkey: Mersin.
Baumeister, R. E. (1984). Choking under pressure: Self-consciousness and paradoxical effects of incentives on skillful
performance. Journal of Personality and Social Psychology, 46, 610–620.
Bem, D. J. (1995). Writing a review article for psychological bulletin. Psychological Bulletin, 118, 172–177.
Berry, S., & Wood, C. (2004). The cold-foot effect. Chance, 17, 47–51.
Brown, W. O., & Sauer, R. D. (1993). Does the basketball market believe in the ‘‘hot hand’’? Comment. The American
Economic Review, 83, 1377–1386.
Burns, B. D. (2001). The hot hand in basketball: Fallacy or adaptive thinking? In J. D. Moore, & K. Stenning (Eds.),
Proceedings of the 23rd annual conference of the cognitive science society (pp. 152–157). Edinburgh, Scotland:
Lawrence Erlbaum.
Burns, B. D. (2004). Heuristics as beliefs and as behaviors: The adaptiveness of the ‘‘hot hand’’. Cognitive Psychology,
48, 295–331.
Burns, B. D., & Corpus, B. (2004). Randomness and inductions from streaks: ‘‘Gambler’s fallacy’’ versus ‘‘hot hand’’.
Psychonomic Bulletin and Review, 11, 179–184.
Camerer, C. F. (1989). Does the basketball market believe in the ‘‘hot hand’’? The American Economic Review, 79,
1257–1261.
Caruso, E. M., & Epley, N. (2004). Hot hands and cool machines: Perceived intentionality in the prediction of streaks.
Poster session presented at the 5th annual meeting of the society for personality and social psychology, Austin, TX,
USA.
Clark, R. D. (2003a). Streakiness among professional golfers: Fact or fiction? International Journal of Sport Psychology,
34, 63–79.
Clark, R. D. (2003b). An analysis of streaky performance on the LPGA tour. Perceptual and Motor Skills, 97, 365–370.
Clark, R. D. (2005). Examination of hole-to-hole streakiness on the PGA tour. Perceptual and Motor Skills, 100,
806–814.
ARTICLE IN PRESS
M. Bar-Eli et al. / Psychology of Sport and Exercise 7 (2006) 525–553 551

Cornelius, A., Silva, J. M., Conroy, D. E., & Petersen, G. (1997). The projected performance model: Relating cognitive
and performance antecedents of psychological momentum. Perceptual and Motor Skills, 84, 475–485.
Croucher, J. S. (1981). An analysis of the first 100 years of Wimbledon Tennis Finals. Teaching Statistics, 3, 72–75.
Dorsey-Palmateer, R., & Smith, G. (2004). Bowlers’ hot hands. The American Statistician, 58, 38–45.
Falk, R., & Konold, C. (1997). Making sense of randomness implicit encoding as a basis for judgment. Psychological
Review, 104, 301–318.
Forthofer, R. (1991). Streak shooter—The sequel. Chance, 4, 46–48.
Frame, D., Hughson, E., & Leach, J. C. (2003). Runs, regimes, and rationality: The hot hand strikes back. Working
paper.
Frohlich, C. (1994). Baseball: Pitching no-hitters. Chance, 7, 24–30.
Gigerenzer, G. (2000). Adaptive thinking: Rationality in the real world. New York: Oxford University Press.
Gigerenzer, G., Todd, P., & The ABC Research Group (Eds.). (1999). Simple heuristics that make us smart. Oxford:
Oxford University Press.
Gilden, D. L., & Wilson, S. G. (1995a). On the nature of streaks in signal detection. Cognitive Psychology, 28,
17–64.
Gilden, D. L., & Wilson, S. G. (1995b). Streaks in skilled performance. Psychonomic Bulletin and Review, 2, 260–265.
Gilovich, T. (1984). Judgmental biases in the world of sports. In W. F. Straub, & J. M. Williams (Eds.), Cognitive sport
psychology (pp. 31–41). Lansing, New York: Sport Science Associates.
Gilovich, T. (2002). Transcript from Tom Gilovich hot hand homepage online chat. http://www.hs.ttu.edu/hdfs3390/
hh_gilovich.htm.
Gilovich, T., Vallone, R., & Tversky, A. (1985). The hot hand in basketball: On the misperception of random
sequences. Cognitive Psychology, 17, 295–314.
Gould, S. J. (1989). The streak of streaks. Chance, 2, 10–16.
Gula, B., & Raab, M. (2004). Hot hand belief and hot hand behavior: A comment on Koehler and Conley. Journal of
Sport and Exercise Psychology, 26, 167–170.
Hales, S. (1999). An epistemologist looks at the hot hand in sports. Journal of the Philosophy of Sport, 26, 79–87.
Hendricks, D., Patel, J., & Zeckhauser, R. (1993). Hot hands in mutual funds: Short-run persistence of relative
performance, 1974–1988. The Journal of Finance, 48, 93–130.
Hooke, R. (1989). Basketball, baseball, and the null hypothesis. Chance, 2, 35–37.
Huettel, S. A., Mack, P. B., & McCarthy, G. (2002). Perceiving patterns in random series: Dynamic processing of
sequence in prefrontal cortex. Nature Neuroscience, 5, 485–490.
Jackson, D., & Mosurski, K. (1997). Heavy defeats in tennis: Psychological momentum or random effect. Chance, 10,
27–34.
Kaplan, J. (1990). Letter to the editor: More on the ‘‘hot hand’’, Chance, 3, 6.
Kerick, S. E., Iso-Ahola, S. E., & Hatfield, B. D. (2000). Psychological momentum in target shooting: Cortical,
cognitive-affective, and behavioral responses. Journal of Sport and Exercise Psychology, 22, 1–20.
Klaassen, F. J. G. M., & Magnus, J. R. (2001). Are points in tennis independent and identically distributed? Evidence
from a dynamic binary panel data model. Journal of the American Statistical Association, 96, 500–509.
Koehler, J. J., & Conley, C. A. (2003). The ‘‘hot hand’’ myth in professional basketball. Journal of Sport and Exercise
Psychology, 25, 253–259.
Laplace, P. S. (1951). A philosophical essay on probabilities (Trans. F.W. Truscott and F.L. Emory). New York: Dover
(Original work published 1814).
Larkey, P. D., Smith, R. A., & Kadane, J. B. (1989). It’s okay to believe in the ‘‘hot hand’’. Chance, 2, 22–30.
Magnus, J. R., & Klaassen, F. J. G. M. (1999a). On the advantage of serving first in a tennis set: Four years at
Wimbledon. The Statistician (Journal of the Royal Statistical Society, Ser. D), 48, 247–256.
Magnus, J. R., & Klaassen, F. J. G. M. (1999b). The effect of new balls in tennis: Four years at Wimbledon. The
Statistician (Journal of the Royal Statistical Society, Ser. D), 48, 239–246.
Magnus, J. R., & Klaassen, F. J. G. M. (1999c). The final set in a tennis match: Four years at Wimbledon. Journal of
Applied Statistics, 26, 461–468.
Miller, S., & Weinberg, R. (1991). Perceptions of psychological momentum and their relationship to performance. The
Sport Psychologist, 5, 211–222.
ARTICLE IN PRESS
M. Bar-Eli et al. / Psychology of Sport and Exercise 7 (2006) 525–553552

Miyoshi, H. (2000). Is the ‘‘hot hands’’ phenomenon a misperception of random events? Japanese Psychological
Research, 42, 128–133.
Raab, M. (2002). Hot hand in sports—The belief in hot hand of spectators in volleyball. In M. Koskolou, N. Geladas,
& V. Klissouras (Eds.), ECSS proceedings: Vol. 2. seventh congress of the European Congress of sport sciences
(p. 971). Athens: Trepoleos.
Raab, M., Gula, B., & Gigerenzer, G. (2006). The ecological rationality of the hot hand. Submitted for publication.
Richardson, P. A., Adler, W., & Hankes, D. (1988). Game, set, match: Psychological momentum in tennis. The Sport
Psychologist, 2, 60–76.
Silva, J. M., Hardy, C. J., & Crace, R. K. (1988). Analysis of psychological momentum in intercollegiate tennis. Journal
of Sport and Exercise Psychology, 10, 346–354.
Simpson, E. H. (1951). The interpretation of interaction in contingency tables. Journal of the Royal Statistical Society,
Ser. B, 13, 238–241.
Siwoff, S., Hirdt, S., & Hirdt, P. (1988). The 1988 Elias Baseball Analyst. New York: Collier.
Smith, G. (2003). Horseshoe pitchers’ hot hands. Psychonomic Bulletin & Review, 10, 753–758.
Stern, H. S. (1995). Who’s hot and who’s not: Runs of success and failure in sports. In 1995 Proceedings of the section on
statistics in sports (pp. 26–35). American Statistical Association.
Stern, H. S., & Morris, C. N. (1993). A statistical analysis of hitting streaks in baseball: Comment. Journal of the
American Statistical Association, 88, 1189–1194.
Sun, Y. (2004). Detecting the hot hand: An alternative model. In K. Forbus, D. Gentner, & T. Regier (Eds.),
Proceedings of the 26th annual conference of the cognitive science society (pp. 1279–1284). Chicago, IL: Lawrence
Erlbaum.
Swartz, T. (1990). Letter to the editor: More on the ‘‘hot hand’’. Chance, 3, 6–7.
Taylor, J., & Cuave, K. (1994). The sophomore slump among professional baseball players: Real or imagined?
International Journal of Sport Psychology, 25, 230–238.
Taylor, J., & Demick, A. (1994). A multidimensional model of momentum in sports. Journal of Applied Sport
Psychology, 6, 51–70.
Tversky, A., & Gilovich, T. (1989a). The cold facts about the ‘‘hot hand’’ in basketball. Chance, 2, 16–21.
Tversky, A., & Gilovich, T. (1989b). The ‘‘hot hand’’: Statistical reality or cognitive illusion? Chance, 2, 31–34.
Tversky, A., & Kahneman, D. (1971). Belief in the law of small numbers. Psychological Bulletin, 76, 105–110.
Tversky, A., & Kahneman, D. (1974). Judgment under uncertainty: Heuristics and biases. Science (Washington, D.C.),
185, 1124–1131.
Vergin, R. C. (2000). Winning streaks in sports and the misperception of momentum. Journal of Sport Behavior, 23,
181–197.
Wardrop, R. L. (1995). Simpson’s paradox and the hot hand in basketball. The American Statistician, 49, 24–28.
Wardrop, R. L. (1998). Basketball. In J. Bennett (Ed.), Statistics in sport (pp. 65–82). London: Arnold Publishers.
Wardrop, R. L. (1999). Statistical tests for the hot-hand in basketball in a controlled setting. http://www.stat.wisc.edu/
�wardrop/papers/tr1007.pdf.
ARTICLE IN PRESS
M. Bar-Eli et al. / Psychology of Sport and Exercise 7 (2006) 525–553 553