Embed Size (px)
Citation preview

Journal of Contaminant Hydrology, 7 ( 199 I) 177-217 177 Elsevier Science Publishers B.V., Amsterdam
Review Paper
Laboratory diffusion testing for waste d isposal - A review
Charles D. Shackelford
Department of Civil Engineering, Colorado State University, Fort Collins, CO 80523, U.S.A.
(Received October 25, 1989; revised and accepted September 12, 1990)
ABSTRACT
Shackelford, C.D., 1991. Laboratory diffusion testing for waste disposal - - A review. J, Contain. Hydrol., 7: 177-217.
This paper reviews the state-of-the-art for the measurement in the laboratory of diffusion coefficients of chemical waste constituents in fine-grained soils. The purpose of the review is to present the experimental and analytical methods for determining liquid-phase diffusion coeffi- cients which can be used in practice for the design and evaluation of waste containment barriers.
After the appropriate equations describing mass transport in soil are presented, the practical significance of diffusion coefficients in soil (known as "effective diffusion coefficients") are described. Appropriate analytical solutions required to calculate the effective diffusion coeffi- cient (D*) from the measured laboratory data also are presented for several different initial and boundary conditions. The advantages and disadvantages of each method are noted.
A summary of effective diffusion coefficients from the literature suggests that the major physical factor affecting the value of the measured diffusion coefficient is the degree of saturation of the soil, with D*-values for nonreactive and reactive solutes in saturated soils being as much as 10-20 times higher than the corresponding values in unsaturated soils. Most of the other physical factors only become important in soils which are highly unsaturated. In addition, the diffusive transport rates of reactive solutes subject to reversible sorption reactions can be as much as 5000 times lower than those of nonreactive solutes in saturated soils and from 20 to 630,000 times lower in unsaturated soils.
INTRODUCTION
T h e r e s u l t s o f r e c e n t f ie ld s t u d i e s i n d i c a t e t h a t d i f f u s i o n is a n i m p o r t a n t , i f n o t
d o m i n a n t , t r a n s p o r t p r o c e s s in f i n e - g r a i n e d so i l s (e .g . , G o o d a l l a n d Q u i g l e y ,
* This paper was first presented at the session on "Clays as Containment Barriers" at the 26th Annual Meeting of the Clay Minerals Society, California State University, Sacramento, California, U.S.A., September 25-28, 1989.
0169-7722/91/$03.50 © 1991 - - Elsevier Science Publishers B.V.

178
N O T A T I O N
List of symbols
C.D. SHACKELFORD
A C
C'
co Ct
CT,m
C
D ~
DZ Oh n~ Do n~ erf(z) erfc(z) U~ J J, L L~ m
m 1 , m 2 .
io i~ M~ n
n e
qm Q, R R~ St t
tl/2 T~ Us
X
Z
V
A ),
T
cross-sectional area of soil mass concentration of solute based on volume of solution in soil mass concentration of solute based on total volume of soil initial mass concentration of solute in source solution mass concentration of solute in source solution at time t total, measured mass concentration of mobile (adsorbed plus liquid phase) chemical
species based on volume of solution in soil total mass concentration (adsorbed plus liquid phase) of the chemical species based
on the total volume of soil effective diffusion coefficient apparent (effective) diffusion coefficient hydrodynamic dispersion coefficient mechanical dispersion coefficient free-solution (aqueous) diffusion coefficient effective diffusion coefficient of reactive solute error function of argument z complementary error function of argument z height of source solution mass flux vector diffusive mass flux straight-line, macroscopic distance between two points in soil actual, microscopic or effective distance between two points in soil mass of solute; also, constant in summation series mass of solute initial mass of solute in soil or in source reservoir mass of solute in soil after time t mass of solute in soil at infinite time; equilibrium mass of solute in soil total porosity of soil effective porosity of soil non-zero positive root mass of diffusing solute per cross-sectional area of soil at time t general term representing chemical and/or biological reactions retardation factor degree of saturation of soil time half-life of radioactive tracer diffusive time lag seepage velocity direction of transport argument for erf or erfc vector gradient operator coefficient in analytical solution difference operator rate constant tortuosity factor, (L/Le) 2

LABORATORY DIFFUSION TESTING FOR WASTE DISPOSAL A REVIEW 179
1977; Desaulniers et al., 1981, 1982, 1984, 1986; Crooks and Quigley, 1984; Johnson et al., 1989). These findings can have a significant effect on the design of waste containment facilities since it usually is assumed that advection, not diffusion, governs the transport of contaminants through earthen barriers. As a result, laboratory diffusion testing will become a necessary component of the overall design and evaluation processes associated with waste disposal practice.
After the equations governing the transport of contaminants through porous media are reviewed, the practical significance of diffusion in waste disposal is discussed. Then laboratory methods which can be used to measure liquid-phase diffusion coefficients of chemical species diffusing through fine- grained soils used as waste containment barriers are presented. The laboratory methods reviewed are based on the assumption that the soil is a continuum. Several additional considerations in laboratory diffusion testing are discussed after presentation of the methods.
T R A N S P O R T E Q U A T I O N S
F l u x equa t ions
The mass flux of a chemical species (solute) in a saturated soil under the combined effects of hydraulic and concentration gradients for one-dimension- al transport is given by (see the Notation for symbols used in this paper):
J = n(v se - D h ' O e / a x ) (1)
where J is the mass flux [M L -2 T-~]*; n is the total porosity of the soil (dimensionless); v s is the seepage velocity of the fluid (solvent), usually water [L T- ~ ]; c is the mass concentration of the solute in the liquid phase of the soil [M L-3]; x is the direction of transport [L]; and Dh is the hydrodynamic dispersion coefficient [L 2 T ~]. The hydrodynamic dispersion coefficient accounts for both mechanical dispersion and diffusive dispersion of the solute during transport and can be represented by:
D h = D m + Doz (2)
where Dm is the mechanical dispersion coefficient [L 2 T I]; D o is the free-solu- tion (aqueous) diffusion coefficient of the solute [L 2 T-~]; and z is the dimen- sionless tortuosity factor. Values of D o for most common inorganic chemical species typically range between ~ 7" 10- to to ,-~ 2.0" 10-9 m 2 s- I (Shackelford and Daniel, 199 la). The mechanical dispersion coefficient is a function of the
* M, L and T in brackets [ ] designate dimensions where M is mass, L is length and T is time.

180 C.D. SHACKELFORD
magnitude of vs and accounts for spreading of the solute during transport due to variations in the seepage velocity (Freeze and Cherry, 1979).
The tortuosity factor, ~, is purely geometric and accounts for the increased distance of transport and the more tortuous pathways experienced by solutes migrating through soil. It usually is expressed as follows (Porter et al., 1960; Olsen and Kemper, 1968; Bear, 1972):
r -=- ( L / L e ) 2 (3)
where L is the straight-line, macroscopic distance between two points defining the flow path, and Le is the actual, microscopic or effective distance of flow through the soil between the same two points. Since Le > L for porous media, r < 1. Values of ~ are reported to be in the range from 0.01 to 0.84 for saturated soils and from 0.025 to 0.57 for unsaturated soils (Shackelford and Daniel, 1991a). In some cases, the tortuosity factor has been defined as the reciprocal of eq. 3 and, therefore, will have a value greater than unity (e.g., Wyllie and Spangler, 1952; Bear, 1972; Li and Gregory, 1974).
For typical problems involving low-permeability earthen barriers used for waste containment facilities, mechanical dispersion does not appear to be significant, i.e. Dh ~ D* (Rowe, 1987). In such cases, the total solute flux, assuming coupled flow processes are negligible, becomes:
J = n(v~c - D or'Sc/Sx) (4)
When there is only a concentration gradient, v s and, therefore, D m are zero and eqs. 1 and 4 reduce to the following form of Fick's first law for one-dimen- sional diffusive transport in saturated soil:
JD ~- - - D o r n ' S c / S x (5)
where JD designates the diffusive flux.
Effective diffusion coefficients
There currently are no satisfactory methods for determining independently the tortuosity factor, ~. This problem is circumvented by defining an effective diffusion coefficient, D*, which includes the effect of tortuosity, or:
D* = D0r (6)
When eq. 6 is utilized, the expression for Fick's first law for diffusion in a saturated soil (eq. 5) becomes:
JD = - - D * n ' O c / O x (7)
Several other forms of Fick's law for diffusion in soil have been suggested (e.g., Shackelford and Daniel, 1991a). The most common alternate form of

LABORATORY DIFFUSION TESTING FOR WASTE DISPOSAL A REVIEW 181
Fick's first law is as follows:
JD = - - D * ' O c / O x (8)
where the definition for D* includes the porosity, n (i.e. D* = Dovn ). However, since the porosity, n, of the soil usually can be determined indepen- dently, the definition for D* given by eq. 6 and the expression for Fick's first law given by eq. 7 is assumed to apply in this paper.
Transient equat ions
The transient transport of a chemical species through a representative volume of a saturated soil is given by the continuity equation, or (e.g., Bear and Verruijt, 1987):
~C/Ot - V ' J -t- R -t- 2 C (9)
where C is the total mass concentration (adsorbed plus liquid phase) of the chemical species based on the total volume (solids plus voids) of soil [M L-~]; 2 is a rate constant [T -~ ] used to describe such reactions as radioactive and/or biological decay; and R is a general term representing all other chemical and biological reactions [M L -3 T-~]. The positive signs ( + ) in eq. 9 are used for concentration source terms (e.g., mineral dissolution) whereas the ( - ) signs are used for terms representing concentration sinks (e.g., precipitation).
For many practical applications involving transport of contaminants through relatively thin, low-permeability materials (e.g., fine-grained soil barriers), the material is assumed as homogeneous, isotropic and non- deformable, and transport is assumed to be governed by steady flow of an incompressible fluid. In addition, only linearly reversible sorption reactions typically are included in modeling contaminant transport through fine- grained porous media (i.e. R = 0), and coupled flow process are neglected. If these assumptions are acceptable, eq. 9 reduces to the advection-dispersion equation which, for one dimension (say, the x-direction) can be written as follows (e.g., Freeze and Cherry, 1979):
3e/Ot = (Dh/Rd)'~?2c/Ox 2 -- (vs/Rd) 'Ocfi?x (10)
where R d is the dimensionless retardation factor. The retardation factor represents the relative rate of transport of a nonreactive (nonadsorbed) solute (e.g., C1-) to that of a reactive solute subject to reversible sorption or equi- librium exchange reactions (Freeze and Cherry, 1979). For nonreactive (non- adsorbing) solutes, Ra = 1.
When the seepage velocity is sufficiently low such that mechanical dispersion is negligible, the advection-dispersion equation (eq. 10) effectively reduces to an "advection-diffusion" equation, or:

182 C.D. SHACKELFORD
~c/~ t = ( D * / R d ) ' O 2 c / O x 2 - ( v s / R d ) ' d c / O x (11)
For radioactive tracers, the decay term, 2C, in eq. 9 should be evaluated. The decay term usually can be neglected if the half-life, ill2, of the radioisotope is long relative to the time frame of the study. However, if the half-life is short relative to the time frame of the study, the decay term should be included in the formulation of the transport equations (e.g., Patil et al., 1963). For linear or first-order decay, the decay constant assumes the following form (de Marsily, 1986):
2 = ln (2 ) / f i /2 = 0 .693/ t l /2 (12)
Radioactive tracers with long half-lives typically are selected for laboratory diffusion studies so that the decay term can be neglected without incurring significant error in the test results.
F i c k ' s s e c o n d law
As the seepage velocity is reduced, diffusion becomes more significant relative to advection. In the limit, the seepage velocity approaches zero, and eqs. 10 and 11 reduce to the following expression for Fick's second law for diffusion of solutes in soil:
Oc/Ot = ( D * / R d ) ' O 2 c / O x 2 (13)
T A B L E 1
F o r m s o f F i ck ' s s e c o n d law for d i f fus ion in a s a t u r a t e d soil
De f in i t i on o f D* Def in i t i on o f A d s o r p t i o n F o r m o f F i ck ' s
c o n c e n t r a t i o n s e c o n d law
D o z c n o ~c/~t = D* . 0 2 c/~x 2
c' no Oc'/Ot = D*'O2c'/Ox 2
c yes c~c/Ot = (D*/Rd) .~2c /#x 2
c' yes ~c'/~t = ( D * / R d ) ' t ~ 2 c ' / ~ x 2
D ozn c n o Oc/Ot = (D*/n) 'O 2c/Ox 2
c' no Oc'/Ot = (D*/n) '~2c ' /~x 2
c yes Oc/Ot = (D*/nRo) 'O 2c/ox 2
c' yes Oc'/Ot = (D*/nRd)'O2 c'/Ox 2
c = m a s s c o n c e n t r a t i o n o f so lu t e b a s e d o n v o l u m e o f s o l u t i o n in soil; c ' = m a s s c o n c e n t r a t i o n
o f so lu t e ba sed on to ta l v o l u m e o f soil ( = nc); D * = effective d i f fus ion coefficient; Do = free-
s o l u t i o n ( a q u e o u s ) d i f fus ion coefficient; n = to ta l p o r o s i t y o f soil; t = t ime; x = d i r ec t ion o f
t r a n s p o r t ; z = t o r t u o s i t y fac tor .

LABORATORY DIFFUSION TESTING FOR WASTE DISPOSAL--A REVIEW 183
Several other expressions for Fick's second law of diffusion, summarized in Table 1, exist due to differences in: (1) the definitions of D*; (2) the reference frame for the expression of the solute concentration; and (3) the behavior of the adsorbing solutes during transport relative to that of the nonadsorbing solutes. These differences in the formulation of Fick's second law should be noted carefully since failure to account for them can affect conclusions drawn from test results and/or model studies.
Of particular interest is the ratio D*/Rd which appears as a coefficient terms in eqs. 11 and 12. In some cases (e.g., Li and Gregory, 1974; Gillham et al., 1984; Quigley et al., 1987), this ratio has been combined into a single coeffi- cient as follows:
# c / O t = D*'OZc/ax 2 = Ds'O2c/Ox 2 (14)
where
= Ds = D * / S d (15)
and D* is known as the "apparent diffusion coefficient" whereas Ds is known as "the effective diffusion coefficient of the reactive solute". The result of this substitution is that only one unknown (D* or Ds) must be determined from test results instead of two unknowns (D* and Rd).
The coefficient D* or Ds is a function of the sorption characteristics of the soil, whereas D* is not. Therefore, since different soils have different sorption characteristics, it is meaningless to report a value for D~ or Ds without reporting the associated Rd-value. Also, an error in interpretation on the order of Rd-1 can result if the difference between D*- or Ds-values and D*-values is not recognized (Shackelford and Daniel, 1991a).
Types of diffusion coefficients
There are essentially four different types of diffusion (Robinson and Stokes, 1959; Li and Gregory, 1974; Shackelford, 1988a, 1989; Shackelford and Daniel, 1991 a): (1) self-diffusion; (2) tracer diffusion; (3) salt diffusion; and (4) counter-diffusion or interdiffusion. However, the objective of most waste disposal or containment situations is to isolate potential contaminants from groundwater supplies. With respect to laboratory test conditions, this situation is analogous to the salt diffusion system. In a salt diffusion system, one half-cell is tagged with a salt solution (e.g., a NaC1 solution) whereas a separate half-cell contains only the solvent (e.g., water). When the two half- cells are connected, diffusion of the solutes (e.g., Na + and C1-) occurs from the tagged half-cell to the untagged half-cell until the concentration of the solutes in both half-cells is equal, and the system is in equilibrium.
Two practical examples of salt diffusion systems related to waste disposal

184
Clay Liner
C.D. SHACKELFORD
Aquifer
(a)
Slurry Wall Ground Surface ~ C 1 ) C2
w.r.~r_ I w.'r. , v
C1 " - - ~ C 2 Waste Containment
Area
(b)
Fig. 1. Examples of diffusive transport through clay barriers: (a) clay liner and (b) slurry wall containment (after Gray and Weber, 1984).
or containment are illustrated in Fig. 1. In these cases, the concentrations of the contaminants on the containment side of the barrier typically are higher than the corresponding concentrations on the opposite side of the barrier. As a result, a concentration gradient is established across the barrier, and the contaminants diffuse from the containment side of the barrier to the opposite side of the barrier.
Significance of diffusion in waste disposal
As a result of the above considerations, it is of interest to evaluate when diffusion dominates the transport process. Rowe (1987) concluded that mechanical dispersion was insignificant relative to diffusion for typical

LABORATORY DIFFUSION TESTING FOR WASTE DISPOSAL--A REVIEW 185
problems involving earthen barriers when the fluid flow flux or Darcian velocity is ~< 0.1m yr -1. Gillham et al. (1984) indicate diffusion is dominant when Vs is on the order of 0.005 m yr -~ . For a clay liner, this seepage velocity corresponds to a saturated hydraulic conductivity of 8- 10-l~m s-~ when the porosity of the soil is 0.5 and the hydraulic gradient is one. Since current regulations in the U.S.A. require the saturated hydraulic conductivity of certain clay liners to be ~< 1 • 10-9m s -I, it is evident that diffusion could be a significant, if not dominant, transport process in many waste disposal situations. Also, in the absence of coupled flow processes, the best contain- ment barrier that can be built is one in which diffusion controls the transport of the contaminants (Daniel and Shackelford, 1988; Shackelford, 1988b). Therefore, the need for measuring effective diffusion coefficients of contami- nants in fine-grained soils is apparent.
M E T H O D S O F M E A S U R E M E N T
In general, methods used to measure effective diffusion coefficients of chemical species fall into two broad categories, steady state and transient, corresponding to the type of transport equation used in the analysis for the determination of the D*-values. This section presents some of the more common procedures which have been used to measure effective diffusion coef- ficients.
T h e s t e a d y - s t a t e m e t h o d
The steady-state method for determining D*-values has been used by Husted and Low (1954), Dutt and Low (1962), Olsen et al. (1965), van Schaik and Kemper (1966), van Schaik et al. (1966), Tinker (1969), and Muurinen (1990), among others. A schematic diagram illustrating the steady-state method is presented in Fig. 4a on p. 191. The soil is contained between two reservoirs - - a source reservoir containing the solution of interest (e.g., an actual or simulated leachate) and a collection reservoir from which samples are withdrawn for chemical analysis of specified chemical species. The concen- tration of the chemical species of interest is higher in the source reservoir than it is in the collection reservoir; therefore, a concentration gradient is esta- blished across the soil sample, and eq. 7 can be utilized for determining D* once steady-state conditions have been reached, as follows:
D * = - ( A x / n A c ) J D = - ( L / n A c ) ( A m / A A t ) = - ( L / n A A c ) ( A m / A t ) (16)
where L and A are the length and cross-sectional area of the soil sample, respectively; Ac is the concentration gradient; and Am is the change in mass of the chemical species in an increment of time, At. Since the quantity L / n A A c

186 C.D. SHACKELFORD
in eq. 16 can be measured or set independently of the test, only the change in mass with respect to time, Am/At, is measured during the test.
Since, at steady state,
- A m l / A t = Am2/At = Am/At (17)
where Aml is the decrease in mass of the chemical species in the source reservoir; and Am 2 is the increase in mass of the chemical species in the collection reservoir, either the source reservoir or the collection reservoir could be sampled during the test (Fig. 2a). However, it is best to sample both reservoirs to insure that steady-state conditions have been met through eq. 17.
The use of the difference operators in eqs. 16 and 17 implies that the concentration gradient across the sample is linear. However, due to coupled flow processes, the concentration gradient within the soil sample may be nonlinear, as illustrated in Fig. 2b (e.g., see Dutt and Low, 1962; Kemper and van Schaik, 1966; Quigley et al., 1987). As a result, the D*-values determined using the external (across the clay) concentration gradient may not be the
- - q -
A
L L J C l > C 2 r- - I
C i C 2
i o,,i m
Source i Collection Reservoir | Reservoir
i! ; V 2 V 1 |
(a)
Level
dx
(b)
V = Volume c = Concentration m = Mass (= c x V)
Experimental • Theoretical
(c)
Q t
i i T i ~ T L
Fig. 2. Steady-state method: (a) diffusion-cell (plan or profile); (b) concentration profiles in soil sample; and (c) time-lag method.

LABORATORY DIFFUSION TESTING FOR WASTE DISPOSAL A REVIEW 187
same as those determined using the internal (within the clay) distribution of concentrations (Dutt and Low, 1962; Quigley et al., 1987; Muurinen, 1990).
Advantages and disadvantages of the steady-state method The advantage of the steady-state method is that D* of reactive solutes can
be measured without having to know the value for R d since, by definition, there is no retardation of a solute species at steady state; i.e. R d does not appear in Fick's first law, eq. 7. However, the time required to establish steady-state conditions with reactive (adsorbing) solutes will be longer than that for nonreactive solutes, especially for relatively thick samples. The duration of the test can be shortened by presaturating the exchange complex of the soil with the reactive solute being used in the test.
A disadvantage of the method is that the mass of the chemical species diffusing from the source reservoir must be continuously replenished while the mass of the chemical species diffusing into the collection reservoir is con- tinuously removed in order to maintain a constant concentration gradient (Ac) across the sample and, therefore, to establish and maintain steady-state conditions. Also, the time required to establish steady-state conditions can be excessive, especially for relatively thick samples. As a result, a great deal of attention, care, and time is required in the determination of D*-values using the steady-state method.
Time-lag method
The fact that it requires time to establish steady-state conditions forms the basis for a method, known as the "time-lag method", commonly used to obtain the diffusion coefficient, the permeability constant and the solubility of a gas flowing through a porous membrane (Jost, 1960; Crank, 1975; Comyn, 1985; Rogers, 1985).
In the time-lag method, the soil is initially at zero concentration and the concentration at the face through which the diffusing substance emerges (i.e. c2 in Fig. 2a) is maintained effectively at zero concentration. In this case, the total amount of diffusing substance per cross-sectional area, Q,, which has passed through the soil approaches a steady-state value as t ---, ~ , or (Jost, 1960; Crank, 1975):
Q, = (nD*c~/L)(t - RdL2/6D *) (18)
where
Q, = i J~dt o
(19)

188 C.D. S H A C K E L F O R D
and cl is the concentration in the source reservoir (Fig. 2a), which is maintained at a constant value. Eq. 18 is the equation of a straight line on a plot of Q, vs. time, with an intercept TL on the t-axis given by (Fig. 2c):
T L = R d L 2 / 6 D * (20)
Therefore, D* can be calculated using eq. 20 by plotting Q, vs. time and determining the value for the intercept TL. However, the retardation factor, R d must be known a priori in order to apply eq. 20 to studies involving reactive solutes. This method has been used recently by Muurinen (1990) to measure diffusion coefficients of uranium in compacted sodium bentonite.
Advantage and disadvantage of the time-lag method Less control of the test conditions is required for the time-lag method vs.
the standard steady-state method since steady-state conditions only have to be established, not maintained. However, the retardation factor must be known to use this method for reactive solutes (see eq. 20). Also, the time required to establish steady-state conditions can be excessive, too. For example, the tests performed by Muurinen (1990) required 150-200 days.
Transient methods
In general, transient methods utilize solutions either to eq. 10 or eq. 11 when advective flow is allowed to occur or to Fick's second law (eq. 13) in the absence of advective flow. Several different transient methods have been used to measure effective diffusion coefficients for chemical contaminants (e.g., Olsen et al., 1965; Crooks and Quigley, 1984; Gillham et al., 1984; Rowe et al., 1985, 1988; Shackelford, 1988a; Shackelford et al., 1989; Shackelford and Daniel, 1991a, b). These transient methods can be separated into three categories: (1) column methods; (2) the half-cell method; and (3) reservoir methods.
Column methods
Constant source concentration The "traditional" column test has been used extensively in the study of
mass transport through porous media (e.g., see Freeze and Cherry, 1979). The concept is illustrated in Fig. 3. First, steady-state fluid flow is established through the soil sample. After steady-state fluid flow has been established, the fluid in the influent reservoir (usually water) is changed to a solution with known and constant concentrations (c0's) of particular chemical species. The concentration, c, of a chemical species appearing in the effluent reservoir is measured over time, and the results are plotted in the form of solute break-

LABORATORY DIFFUSION TESTING FOR WASTE DISPOSAL--A REVIEW 189
Porous / ] i i
Plate
Influent With Constant 1 4 [ - - - Concentration of Chemical
Species, c O
(a) I" Effluent: Sampled for
I . - -b , Concentration,c
Experimental • Theoretical - -
B
. Nonreactive •
. ~ o.5-
"° . _ y i J 1 ¢~ 0 I I I
1 , 0 2,0 Pore Volumes of Flow (PV)
Experimental • T h e o r e t i c a l - -
Nonreactive i S o l u t e
~ 0.5 . . . . . . . . . . . . . . . . . . . . . . . . . . . . . . . . . . . . . ,~ ,...
1.0 21.0 Pore Volumes of Flow ( P V )
Fig. 3. Column test with constant source concentration: (a) test set-up; (b) breakthrough curves when D* ,~ Dh; and (c) breakthrough curves when D* ~ D h.
through curves, or relative concentration, C/Co vs. time or pore volumes of flow (PV). A pore volume of flow for a saturated soil is the cumulative volume of flow through the soil sample divided by the volume of the void space in the soil. Typical breakthrough curves for nonadsorbing and adsorbing solutes are shown schematically in Fig. 3b. The spreading effect, or "S" shape, exhibited by the breakthrough curves in Fig. 3 is a result of dispersion of the solute during transport through the soil. Dispersion causes some of the solute to appear ahead of the advective front (dashed lines in Fig. 3b) while the remainder of the solute lags behind the advective front. The ratio of the pore volumes of flow for the reactive solute to the pore volumes of flow of the nonreactive solute at a relative concentration of 0.5 typically is taken as the retardation factor, Rd (Freeze and Cherry, 1979). For example, the value of Rd for the conditions shown in Fig. 3b is 2.0.
Breakthrough curves such as the ones illustrated in Fig. 3 typically are modeled using the following analytical solution to eq. 10 (e.g., Bear, 1972, 1979; Freeze and Cherry, 1979):

190 C.D. S H A C K E L F O R D
coC - ,'W-.', ( .L __+ v., - + exp~-D-~-h) erfc (21)
where L is the length of the soil column; erfc is the complementary error function which, for any argument z, is given by:
erfc(z) = 1 - eft(z) (22)
and eft(z) is the error function of the argument, z, or:
2 f e -~2 d~ (23) eft(z) - x ~ 0
Values of eft(z) and erfc(z) are tabulated in several texts (e.g., Carslaw and Jaeger, 1959; Crank, 1975; Freeze and Cherry, 1979). Alternatively, Abramowitz and Stegun (1972) present several mathematical expressions which can be used to evaluate eft(z).
The initial and boundary conditions upon which eq. 21 is dependent are as follows (Ogata and Banks, 1961; Ogata, 1970; Freeze and Cherry, 1979):
c(x>lO, t = O ) = 0
c(x<~O, t>/O) = Co (24)
c ( x = ~ , t>lO) = 0
The second boundary condition corresponds to that for a semi-infinite medium which would seem to invalidate the use of eq. 21 for modeling breakthrough curves from columns of soil with finite lengths. However, Parlange and Starr (1975) compared eq. 21 and an approximate solution to eq. 10 based on a boundary condition for a finite column and concluded that eq. 21 was an adequate model for analyzing breakthrough curves from laboratory tests using finite columns.
Eq. 21 is utilized by back-calculating values of the hydrodynamic dispersion coefficient, Dh, for given values of C/Co, L, Vs, t and Rd. A nonreac- tive tracer such as CI- typically is used so that R d can be assumed as unity. Once the value of Dh is determined, the effective diffusion coefficient, D*, can be determined using eqs. 2 and 6 provided the value for the mechanical dispersion coefficient, Dm, is known. However, since Dm typically is not known with any degree of certainty, this approach can be difficult in practice.
An alternate approach is to impose very low seepage velocities so that the effects of mechanical dispersion can be considered negligible, and the effective diffusion coefficient can be taken as equal to the hydrodynamic dispersion coefficient, i.e. D* ~ D h . Under these conditions, the breakthrough curves in Fig. 3b will be offset to left as shown in Fig. 3c (e.g., see Biggar and Nielsen,

LABORATORY DIFFUSION TESTING FOR WASTE DISPOSAL--A REVIEW 191
1960; Shackelford, 1988b). For example, Rowe et al. (1988) concluded that diffusion was the dominant mechanism of transport for tests on intact samples of an unweathered clay till when the seepage velocity was between 0.064 and 0.09 m yr- ~. However, care must be exercised in this approach as well since the existence of an "effective porosity, ne", less than the total porosity also can cause an offset in the solute breakthrough curves. Effective porosities on the order of 2-30% of the total porosities have been measured in some compacted clay soils (Horton et al., 1985; Daniel et al., 1989; Liao and Daniel, 1989).
Decreasing source concentration A modified column test using an initial concentration of a chemical species
in the source reservoir which is allowed to decrease with time has been described by Rowe et al. (1988). The concept is illustrated in Fig. 4. The column consists of a source reservoir, a column of soil, and a porous plate use to collect the effluent from the soil. The test begins when the solution containing the chemical species of interest at known, initial concentrations, co, is placed in the source reservoir. As advective and diffusive transport occurs
Hf
+x - ~ L
"; ~-- - - - I Initial Concentration, c o' Source I Which Decreases With
Reservoir ~ T i m e
2'__ '~ ~ la)
Soi l
Effluent: Collected _i and Monitored for Concentra t ion ,cb
Porous P la te
( b )
DURING TEST
L _ - - c o
g~o P L
In Effluent
io .
0 T i m e
Exper imenta l •
T h e o r e t i c a l
Concentration In 0 Soil Pore Water, c
0oj_= i ~ "(c1 i, ~'-= I AFTER TEST
I
Fig. 4. Column test with decreasing source concentration (after Rowe et al., 1988): (a) test set-up; (b) source and effluent concentrations vs. time; and (c) concentration profile in soil.

192 C.D. SHACKELFORD
th rough the soil, the concentrat ions of the specified chemical species decrease with time in the source reservoir and eventually increase with time in the effluent collection system. The results are plotted as concentra t ion vs. time (Fig. 4b), and a semi-analytical solution to the advective-dispersive t ransport equat ion (eq. 10) in the form of the computer program, POLLUTE, is used to fit theoretical curves to the measured data to determine Dh-values. After the test is over, the column is disassembled, the soil is sectioned, and the con- centrat ions of the chemical species are measured as a function of the depth of the soil in the column. Once again, POLLUTE is used to fit a theoretical curve to the measured concentrat ion profile in the soil. The value of D h determined f rom the concentrat ion profile is used as a check on the value Of Dh determined from the variation in source concentrat ion. The theory for the semi-analytical solution upon which POLLUTE is based is presented elsewhere (e.g., Rowe and Booker, 1984, 1985; Rowe et al., 1985).
Rowe et al. (1988) present the results of laboratory tests in which the D*-values of several ions in a weathered clay till soil were measured using the above technique. In their tests, they determined that the advective velocities were sufficiently low such that mechanical dispersion was negligible, and that the porosity of the soil calculated on the basis of the water content gave a reasonable indication of the effective porosity. As a result, Rowe et al. (1988) concluded that the observed Dh-values were the same as the effective diffusion coefficients, D*. A m o n g the reported advantages of the technique are (Rowe et al., 1985, 1988): (1) both D* and R d for retarded solutes can be determined from the results of a single test; (2) the decreasing source concentra t ion more correctly models the field situation than does the constant source concen- tration; and (3) it is easier f rom a practical s tandpoint to allow the source concentra t ion to decrease with time than it is to try to maintain a constant source concentrat ion.
Advantages and disadvantages of column methods Column methods have been used for a relatively long time and, therefore,
one advantage of the co lumn methods is that there is a lot of previous experience. In addit ion, it may be advantageous to use the co lumn method when there is an advective componen t of t ransport (v~) in the field situation.
However, a disadvantage of the co lumn method in diffusion testing is that the effective diffusion coefficient, D*, must be separated f rom the hydro- dynamic dispersion coefficient, Dh; therefore, the mechanical dispersion coeffi- cient, D m , must be known or the seepage velocity must be sufficiently small in the test so that mechanical dispersion can be considered to be nil. Such low seepage velocities typically will require long test durat ions for all but the smallest soil samples. When small soil samples are tested, the representative- ness of the sample to field applications may be questioned. Co lumn tests also

LABORATORY DIFFUSION TESTING FOR WASTE DISPOSAL--A REVIEW 193
require the determination of the existence and magnitude of an effective porosity, no.
H a l f - c e l l m e t h o d
The half-cell method is illustrated in Fig. 5. In the half-cell method, two half-cells of soil are placed together to allow diffusion of solutes to occur via the liquid phase from one half-cell to the other. If both half-cells are tagged with tracers, the situation is analogous to the counter diffusion system, i.e. diffusion occurs in both directions. If only one half-cell is tagged with a tracer, the system is analogous to the salt diffusion system, illustrated in Fig. 5.
In the salt diffusion case, the initial condition is illustrated by the concentra- tion profile in Fig. 5b corresponding to time to. As time progresses, the mass of solute in the tagged half-cell decreases as the solute diffuses into the untagged half-cell. At infinite time ( t 3 in Fig. 5b), the system will be in equilibrium. At intermediate times, a concentration profile within the cell will result (e.g., tl and t2 in Fig. 5b). The effective diffusion coefficient can be determined by disassembling the cell after an elapsed time, t, sectioning the soil in each half-cell, and determining the concentration profiles of the specified solutes. Then theoretical profiles can be fitted to the experimental data by assuming D*-values in an analytical solution to eq. 13. With respect to this procedure, two cases are of interest: (1) the infinite medium; and (2) the finite medium.
If the concentration profile does not reach the ends of the cell, the profile will look like that in Fig. 5c, and the porous medium can be considered to be infinite in extent. One set of initial and boundary conditions for this case is as follows:
c (x ~< O, t = O ) = Co; c (x > O, t = O) =- 0
e ( x = - - ~ , t > O) = c o (25)
e ( x = ~ , t > O ) = 0
and the solution is (Crank, 1975):
c _ l erfc ( v ~ R ~ ) (26) Co 2 2
When the concentration profile reaches the ends of the cell, the concen- tration profile will look like Fig. 5d, and the porous medium can no longer be considered to be infinite in extent. Note that the origin for the x-axis has been re-defined in Fig. 5d. The appropriate initial and boundary conditions for this case are:

194 C.D, SHACKELFORD
BEFORE CONNECTING ( ~1 ) H a l f - C e l l H a l f - C e l l
N N . . . . . . . . . . . . . . .
AFTER CONNECTING
D i r e c t i o n of Di f fus ion
0 ir < L ~:
t 3 = o o > t 2 > t l : P t 0 = 0
P + X
1.0 C/C O
0.5
i1=' X -X 0 +X
1.0 c / c °
0.5
0 I) x 0 X ° L
Exper imenta l • T h e o r e t i c a l - -
Fig. 5. Half-cell method: (a) test set-up; (b) concentration profiles in soil; (c) profile for infinite medium; and (d) profile for finite medium.
c(x<~O, t = O ) = Co; c ( x > O , t = O ) = 0
Oc(x= O, t > O)/Ox = 0 (27)
t~c(x= L, t > O)/Ox = 0
and the solution is (Barrer, 1951; Carslaw and Jaeger, 1959):
c xo ( % Co L + -Trm=l m cos sin (28)
Eq. 28 has been applied to measure strontium and chloride diffusion coeffi- cients in compacted bentonite (e.g., Gillham et al., 1984; Robin et al., 1987).
In some cases, it may be more convenient to determine the total mass of contaminant which has diffused into the untagged half-cell instead of the resulting concentration profile. This is easily accomplished by utilizing Fick's first law (eq. 7) to determine the mass flux into the soil at the interface of the half-cells, and then integrating the flux with respect to the elapsed time to

LABORATORY DIFFUSION TESTING FOR WASTE DISPOSAL A REVIEW 195
determine the total mass, Mr, which has diffused into the soil after time t, or:
M, t
M, = f dm = A f JDdt (29) o o
where A is the cross-sectional area of the soil sample. For the infinite medium case, eq. 26 represents the concentration distri-
bution in the soil, and the diffusive flux into the untagged half-cell is as follows (Barrer, 1951; Jost, 1960):
Jo = -D*n -~x x=0 = 2 ~/ ~ (30)
When eq. 30 is substituted into eq. 29 and rearranged, an explicit expression for D* results, or (Barrer, 1951; Jost, 1960):
D* ( Mt ,]2( rc ~ L2 (M'~2(R'J~ (31) = \~ncoJ \-~dtdt/ = -4-\MoJ \ t /
where c o is the initial, liquid-phase concentration of the contaminant in the tagged half-cell; and M 0 is the initial, total (adsorbed plus liquid phase) mass of the contaminant in the tagged half-cell (i.e. ~ALnRaco).
For a finite medium, the concentration gradient is determined by taking the derivative of eq. 28 with respect to x at x = x 0, and the expression for the total mass of contaminant in the untagged half-cell at an elapsed time t is (Barrer, 1951):
Mr 4 ~ sin2(mrCxo/L)[ ( m2rdD*t'~] M0 - Zr2m=l m2 1 - exp RoL2 j j (32)
where M0 is as defined in eq. 31. After determining M~, eq. 32 can be used to solve for D* iteratively.
Advantages and disadvantages of the half-cell method The half-cell method seems to be the preferred method of soil scientists and,
therefore, there is a lot of data available in the literature on the measurement of effective diffusion coefficients using the half-cell method. In addition, the data from the half-cell method are relatively easy to analyze particularly since the concentration profile is not required.
However, it may be difficult in practice to develop full contact between the two half-cells, especially for relatively large soil specimens. Also, it may be difficult and/or time consuming to saturate unsaturated soil samples, and the boundary condition may not be appropriate for the application of the test results (e.g., use of the soil as a clay liner for the containment of liquid wastes).

196 C.D. SHACKELFORD
Reservoir methods
Double reservoir method A double reservoir method has been described by Rowe et al. (1988). The
set-up is essentially the same as in Fig. 4 except there is no advective flow (v s -- 0) and the porous plate used for effluent collection in Fig. 4 is replaced by a second reservoir as shown in Fig. 6. Also, the contaminant accumulates in the collection reservoir and is sampled, not removed.
The concentration profiles in the source reservoir, soil and collection reservoir as a function of time resulting from the double reservoir method are illustrated in Fig. 6b. The experimental data that result from the test are essentially the same as those for the column method with decreasing source concentration, shown in Fig. 4, and can be analyzed for D*-values using POLLUTE as previously described.
The progression of the concentration profiles in Fig. 6b is of interest in that at time t3, steady-state conditions have been reached. Therefore, the double reservoir method represents the transient conditions which precede the establishment of steady-state condition in the steady-state test.
Hf
+x "-~-- L
H r
Source ~~Reservo i r
~ t e° IsleerC: 'oi n
Initial Concentration, Co, Which Decreases Wilh Time
Effluent: Sampled for Concentration, c b
(a)
• xTi I 0 c 3 c 2
t 2
C 1 C O
t I to= 0
-" Ct
Soi l
Ib Cb
t o < t 1 < t 2 < t 3
(b)
Fig. 6. Double reservoir method: (a) test set-up and (b) concentration profiles.

LABORATORY DIFFUSION TESTING FOR WASTE D I S P O S A L - A REVIEW 197
Advantages and disadvantages of the double reservoir method The advantage of the double reservoir method over the column method is
that Dh = D* since vs = 0. The advantage over the steady-state method is that steady-state conditions do not have to be established and, therefore, the test is easier to perform and the test duration can be reduced. However, since vs = 0, the test duration will be longer than the column method for a similar size of sample. In addition, it may be difficult and/or time consuming to saturate the soil sample prior to the start of the diffusion test.
Single reservoir methods The set-up for the single reservoir methods is the same as the double
reservoir method except the collection reservoir is removed. The single reservoir methods, like the column methods, can be separated into two types based on whether the source concentration is allowed to decrease with time or is maintained at a constant concentration.
Constant source concentration The concentration profiles resulting from a constant concentration of the contaminant in the source reservoir are illus- trated in Fig. 7. The D*-values can be determined by sectioning the soil after an elapsed time, t, determining the resulting concentration profile with depth in the soil, and fitting theoretical curves to the measured data by assuming different D*-values in a solution to eq. 13. Two cases are of interest, viz. the semi-infinite medium case and the finite medium case.
The initial and boundary conditions for the semi-infinite case, illustrated in Fig. 7c, are the same as presented for the column method with a constant source concentration, and the solution is (Carslaw and Jaeger, 1959; Crank, 1975):
c _ e r f c ( ~ ) (33) c o 2
which can be derived from eq. 21 by letting v s equal zero. This equation has been used recently by Idemitsu et al. (1990) to measure the apparent diffusion coefficients, D] (= D*/Rd), of plutonium in compacted bentonite.
For the finite porous medium case (Fig. 7d), the boundary condition at the bot tom of the soil sample (x = L in Fig. 7a) becomes:
Oc/~x = 0 (34)
which essentially states that no flux of contaminant exits the bot tom of the soil sample. In this case, a solution for the resulting concentration distribution in the soil at any time t is (Crank, 1975):
I + cos + 1 C 4 5" ~ (--1)m exp - -
1 (35) Co -- ~ ~";'--0= 2m + 1 4-R~L f J 2-L

198 C.D. SHACKELFORD
Hf
r
÷ x ~ L
r
(a)
Source R e s e r v o i r
S o i l
],l A
Initial Concentration, c , - - W h i c h Remains Constan~
0 t o = 0 Co = 0 I ~:
S o i l /,2 {,3 " Bottom of Soil Sample
r t o < t l < t 2 < t 3 + x
(b )
Exper imenta l • Theore t i ca l
Relative Concentration, c/c O 0 1.0
I • = 0
_=
I, oil Sample
r +x (c )
Relative Concentration, ctc 0 1.0 °
- 0 I •
f _=
Bottom of Soil Sample a
. x (d)
Source Hf R e s e r v o i l
I
S o i l "'L'J_ (e)
Fig. 7. Single reservoir method with constant source concentration: (a) test set-up; (b) concentration profiles in soil; (c) profile for semi-infinite medium; (d) profile for finite medium; and (e) positive x-direction for finite medium case.
where the positive x-direction of the cell is defined in Fig. 7e. Eq. 35 can be used to back-calculate D*-values given the concentration distribution in the soil. As an alternative, the total mass of contaminant in the soil at the end of the test, M,, can be measured and used in the following equation to determine D* (Crank, 1975):
_ _ 8 [ + Moo m=O (2m + 1)=rd exp - 4RdL 2 j (36)
where Moo is the corresponding total mass of the contaminant in the soil at infinite time (i.e. at equilibrium), which is given by:
Moo = ALn Raco (37)
This case also can be analyzed for other initial and boundary conditions using the POLLUTE model previously described.

LABORATORY DIFFUSION TESTING FOR WASTE DISPOSAL--A REVIEW 199
As with the steady-state method, the practical difficulty of maintaining a constant concentration in the source reservoir may result in a labor-intensive and time-consuming experiment. Also, frequent replacement of the contami- nant solution may result in undesirable fluctuations in the diffusive transport into the soil (Rowe et al., 1985). As a result, a decision must be made as to the correct interval to use for replacement of the source solution.
Decreasing source concentration The test set-up for the single reservoir case with a source concentration which decreases with time is illustrated in Fig. 8a. The resulting concentration profiles in the soil as a function of time are shown in Fig. 8b. Like the column method with decreasing source concentration and the double reservoir method, the D*-values can be determined not only from the concentration profile of the contaminant in the soil at the end of test (Fig. 8c and d), but also from the decrease in source concentration with time during the test (Fig. 8e). Again, semi-infinite and finite boundary conditions should be considered as separate cases.
- F
Source Hf Reservoir
_ , _ ~
Initial Concentration, c , _ _ Which Decreases With o
Time
Experimental • (a) T h e o r e t i c a l - -
0 C3 C2 Cl Co
--~;- ~ ; . . . ~ . I I a c t , ~ t o = 0
L ( t 3 S o i l t o < t 1 < t 2 < t 3
t 2 ( b ) +x~ ' Bottom of Soil Sample
0 Concentrat ion In Soil, c 0 b
oil c
3ottom of Soil Sample g
+xl (c)
0 Concentrat ion Irl Soil, c 0 • b - / ~ S o i l c
. Bottom of Soil Sample
(d) + x I,
Source Reservoir c .~ o
~ c • o ~ 0
o (e ) I Time
Fig. 8. Single reservoir method with decreasing source concentration: (a) test set-up; (b) concentration profiles in soil; (c) profile for semi-infinite medium; (d) profile for finite medium; and (e) concentration in source reservoir vs. time.

200 C.D. SHACKELFORD
For the semi-infinite case, the concentration profile has not reached the end of the soil sample (time t~ in Fig. 8b, and Fig. 8c). One set of initial and boundary conditions for this case is as follows (Carslaw and Jaeger, 1959; Crank, 1975):
c(x ~ O, t = 0 ) = Co; c(x > O, t = O) = 0
Oc(x = O, t > O)/Ox = - ( D * R d n / H O . ~ c ( x = 0, t > O)/Ox (38)
c ( x = ~ , t > O ) = 0
where the positive x-direction has been defined with respect to Fig. 8a. An analytical solution for these initial and boundary conditions is (Carslaw and Jaeger, 1959):
Co expL--- - -t- D*Rdl erfc x + ~ (39)
Eq. 39 can be used to back-calculate D*-values given the concentration profile in the soil, i.e. c = f(x); the effective height of the source reservoir (H0; the initial concentration of the contaminant (co); the porosity of the soil (n); the retardation factor of the contaminant (Rd); and the duration of the test (t) (e.g., Desaulniers, 1986).
The change in the contaminant concentration in the source reservoir with time (Fig. 8e) can also be used to determine D*-values for the semi-infinite case simply by setting x = 0 in eq. 39 (e.g., Myrand et al., 1989), or:
c , exp [ ( ~ ) 2 D,Rd ,1 erfc ( ~ ~ ) (40) Co
where c, is the contaminant concentration in the source reservoir as a function of time. Eq. 40 has been presented in a slightly different form by Crank (1975), or:
Mt - (1 + ~) 1 - exp erfc g ~ (41) Moo
where M, is the total mass of solute in the soil at time t, and c~ is a coefficient for the given solute, or (Shackelford, 1988a; Shackelford et al., 1989):
c¢ = Hr /nRdL (42)
From consideration of mass balance, the equilibrium mass, M~, in the soil is related to the initial mass of the contaminant in the source reservoir, M0, as follows:
Moo = [1/(1 + ~¢)]M0 = [1/(1 + c¢)]AHfc o (43)

LABORATORY DIFFUSION TESTING FOR WASTE DISPOSAL--A REVIEW 201
where A is the cross-sectional area of the source reservoir. The ratio M ~ / M o [= 1/(1 + ,)] in eq. 43 is known as the "final fractional uptake, FFU" of the solute by the soil (Crank, 1976; Shackelford, 1988a). For larger arguments of the complementary error function in eq. 40 or eq. 41, the following alternate solution may be required for the analysis (Crank, 1975; Shackelford, 1988a):
co ~ 1 2z 2 + 4z 4 8z 6 + . . . (44)
where
n x/-~oD*t (45) z - - H f
Eq. 44 results from substituting the asymptotic expansion given by Abromowitz and Stegun (1972) for exp (z 2) erfc(z) in eq. 40. Eq. 44 is appro- priate for analysis when z 2 is large, which occurs with very high fractional uptakes of the solute by the soil, e.g., large Rd-values (Crank, 1975).
When z ~> 1.0, eq. 44 reduces to:
c t Hf - ( 4 6 )
C O ? / ~
in which case D* can be solved for directly for a given concentration ratio, Ct/Co"
For the finite porous medium case (tz in Fig. 8b, and Fig. 8d), the second boundary condition in eq. 38 becomes that of eq. 34, and eqs. 39-41 and 44 should not be used to evaluate D*-values. Instead, the D*-values may be determined using POLLUTE with both the concentration profile within the soil at the end of test and the variation in source reservoir concentrations with time. As an alternative to the latter technique, the following analytical solution may be used (Crank, 1975; Shackelford, 1988a; Shackelford et al., 1989):
M, = 1 -- ~ 2~(1 + ~) ( D*q~t '] M~ m=, 1 + ~ + ~2q~ exp ~-~o~--~ ] (47)
where the qm'S in eq. 47 are the non-zero positive roots given by:
tanqm = -- ~qm (48)
Values of qm as a function of ~ and the FFU are given in Crank (1975) and Shackelford (1988a). Usually, the analytical solution converges very rapidly; therefore, only one or two terms are required in the series summation in eq. 47.

202 C.D. SHACKELFORD
Advantages and disadvantages of the single reservoir method Like the double reservoir method, Dh = D* for the single reservoir
methods since Vs = 0. In addition, transport through the soil sample is not required, so the test duration can be reduced over that required for the double reservoir method. Also, the boundary condition between the source reservoir and the soil sample is analogous to the boundary condition in the field between the leachate being contained in the clay barrier (e.g., see Fig. la). However, like the double reservoir and steady-state methods, it may be difficult and/or time consuming to saturate an unsaturated soil sample prior to the start of the diffusion test.
Additional considerations
Saturated vs. unsaturated soils Soils used for waste containment barriers are often unsaturated. This is
particularly true if the barrier is considered to be that portion of a natural soil deposit (e.g., aquiclude, aquitard) or a man-made barrier (e.g., compacted clay liner) between the waste material and the water table. Therefore, mea- surement of specific D*-values for unsaturated soil represents the most realistic approach for actual situations involving containment barriers.
The equations presented thus far for the various methods for measuring D* are equally applicable to tests on unsaturated soils if the volumetric moisture content, 0, is used in place of the porosity, n. The volumetric moisture content is defined by the following relationship:
0 = nSr (49)
where 0 represents the volume of moisture or solution per total volume of soil; and the degree of saturation, Sr, is expressed in decimal form. However, diffusion testing of unsaturated soil also requires that the soil suction be controlled in order to prevent mass flow of the contaminants due to suction gradients. While laboratory diffusion testing of unsaturated soil has been performed in a number of instances (e.g., see tension plate approach used by Klute and Letey, 1958, or the approaches used by Graham-Bryce, 1963, or Conca and Wright, 1990), the experiments generally are more difficult to perform.
In addition to the greater difficulty of performing diffusion tests on un- saturated soils, there are three practical reasons for performing laboratory diffusion tests on saturated soils:
(1) the maximum liquid-phase diffusive flux will occur when the soil barrier is saturated due to the increased cross-sectional area of flow at saturation, all other factors being equal (see eq. 7);
(2) the effective diffusion coeffÉcients of contaminants in unsaturated soils

LABORATORY DIFFUSION TESTING FOR WASTE DISPOSAL--A REVIEW 203
typically are less than those in saturated soils due to the increased tortuosity (lower z-values) of the flow paths in unsaturated soils; and
(3) the suitability of many landfill sites currently is being based on analyses which assume saturated parameters (e.g., saturated hydraulic conductivity).
As a result of the greater degree of conservation and practicality of testing soils that are saturated, diffusion testing in practice likely will be performed routinely only on saturated soils samples.
Saturation methods
Two methods commonly are used to saturate an unsaturated soil in the laboratory: a permeation method and a soaking method. In the permeation method, a relatively high hydraulic gradient is used to force several pore volumes of saturating solution through the soil thereby increasing the degree of saturation of the soil. The advantage of this method is that the hydraulic conductivity of the soil with respect to the saturating solution can be determined once steady-state flow has been established. The disadvantage is that the use of a relatively high hydraulic gradient can cause disturbance to the soil sample due, in part, to particle migration and excessive seepage forces (e.g., Mitchell and Younger, 1967; Olson and Daniel, 1979).
In the soaking method, the soaking solution is allowed to flow, or infiltrate, into the soil under a gradient established partly by gravity and partly by the negative pore water pressures, or suction, in the unsaturated soil. The soil sample can be soaked from one or both ends using a variety of techniques. For example, the soil sample can be immersed totally in soaking solution or, in the reservoir methods, the soaking solution can be introduced into the reservoirs for a short period and removed before the diffusion stage of the test commences. However, these techniques may be time consuming and ineffi- cient since the air is being displaced in a direction opposite to the direction of the infiltrating solution. An alternative technique is to expose only the base of the soil sample to the soaking solution thereby allowing the soaking solution to infiltrate into the soil by capillarity. In this way, air is more readily displaced through the top of the sample. In addition, a vacuum can be applied to the top of the sample to speed the process.
Another method commonly used by geotechnical engineers to saturate soils in shear strength testing of soils is "back-pressure saturation" wherein the sample is exposed to soaking solution under an applied (positive) back pressure (e.g., see Bishop and Henkel, 1962). The applied pressure forces air into solution in accordance with Henry's law and, thus, relatively high degrees of saturation (St /> 95%) usually can be achieved in relatively short periods (~<1 week) using high applied pressures (e.g., ~>410kPa or 60psi). In addition, the soil sometimes is pre-saturated with a gas other than air [e.g.,

204 C.D. SHACKELFORD
carbon dioxide, C 0 2 , which has a higher equilibrium (Henry's law) constant], to increase the efficiency of the procedure. However, if the concentration of air or other gas in solution is excessive due to back pressure, the condition for chemical reactions (e.g., redox, acid-base, carbonate, etc.) occurring within the soil may not be representative of those expected in application of the test results. Therefore, this method is not recommended for diffusion testing.
Finally, in presenting the analytical solutions for determining D*-values, the thickness, L, of the soil is assumed to be fixed and remain constant as the diffusion test proceeds. As a result, soils which swell during soaking will have to be trimmed flush with the cell before the diffusion stage of the test begins so as not to invalidate the analysis for D*. As an alternative, Crank (1975) discusses the modifications required to eq. 36 if the soil is not pre-soaked and swelling is allowed to occur during diffusion.
Sectioning and extracting procedures
Many of the methods for measuring D* require that either the concentra- tion profile of the contaminant or the total amount (mass) of contaminant within the soil be known at the end of the test. As a result, it may be necessary to section the soil into slices at the end of the diffusion test and to extract the contaminant species from the soil for chemical analysis. The sectioning procedure typically involves controlled extrusion of the soil sample from the diffusion cell and slicing the soil into thin sections at selected intervals. For example, Brown et al. (1964) and D. Barraclough and Nye (1979) describe a quick-freeze technique in which half-cells of soil were frozen, and the frozen soil was then extruded from the cells and partitioned into sections up to a thickness of 50 ~tm using a refrigerated microtome. Shackelford (1988a) used a modified load frame to extrude and section kaolinite and a natural smectitic clay soil into slices ,-~2.54mm (0.1 in) in thickness. The soil samples were sliced with either a fishing line or a stainless steel knife or beveled plate. The fishing line worked well for the soft kaolinite samples, but not as well for relatively stiff nonuniform consistency of the natural clay soil. Other sectioning techniques are described by Tinker (1969) and Gillham et al. (1984).
After the soil has been sectioned, the concentrations of contaminants in each slice must be determined. Three methods commonly are used to extract the contaminants from the soil: (1) high-pressure pore water squeeze (HPPWS); (2) chemical extraction; and (3) chemical digestion. The HPPWS technique is similar to a consolidation test in which the pore fluid within the soil slice is forced out under high pressure and analyzed for contaminant concentrations. For example, Crooks and Quigley (1984) used a high-pressure consolidation device to obtain pore water samples by squeezing soil samples
LABORATORY DIFFUSION TESTING FOR WASTE DISPOSAL--A REVIEW 205
under a vertical pressure of 23.5 MPa (3400 psi) for 12 h. Johnson et al. (1989) used a nitrogen source to apply pressures up to 4.1 MPa (600 psi) to remove pore water samples from recovered soil cores. Similar techniques are described elsewhere (e.g., Goodall and Quigley, 1977; Rowe et al., 1988).
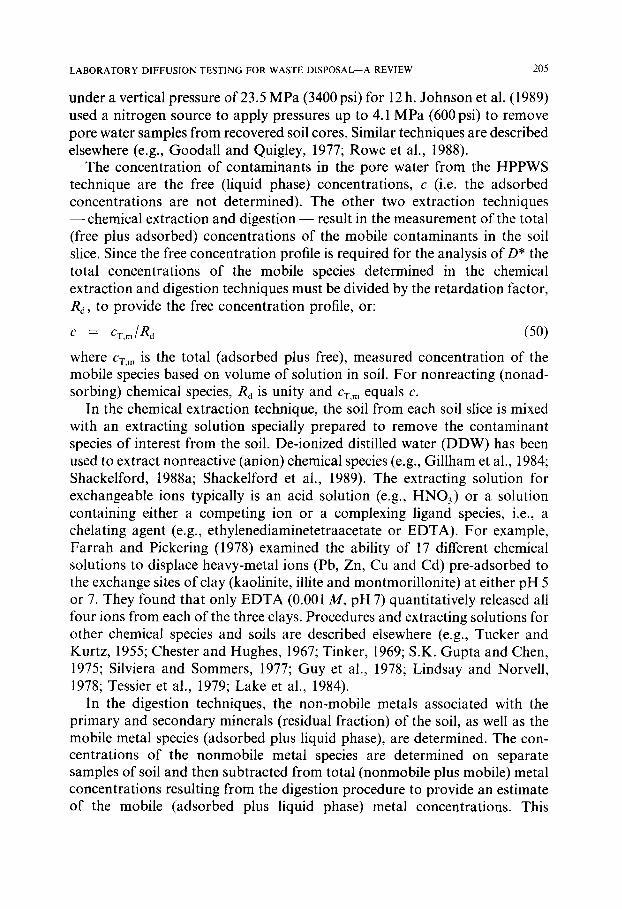
The concentration of contaminants in the pore water from the HPPWS technique are the free (liquid phase) concentrations, c (i.e. the adsorbed concentrations are not determined). The other two extraction techniques - -chemica l extraction and d i g e s t i o n - result in the measurement of the total (free plus adsorbed) concentrations of the mobile contaminants in the soil slice. Since the free concentration profile is required for the analysis of D* the total concentrations of the mobile species determined in the chemical extraction and digestion techniques must be divided by the retardation factor, Ro, to provide the free concentration profile, or:
C = C T , m / R d ( 5 0 )
where c~-m is the total (adsorbed plus free), measured concentration of the mobile species based on volume of solution in soil. For nonreacting (nonad- sorbing) chemical species, R d is unity and CT,m equals c.
In the chemical extraction technique, the soil from each soil slice is mixed with an extracting solution specially prepared to remove the contaminant species of interest from the soil. De-ionized distilled water (DDW) has been used to extract nonreactive (anion) chemical species (e.g., Gillham et al., 1984; Shackelford, 1988a; Shackelford et al., 1989). The extracting solution for exchangeable ions typically is an acid solution (e.g., HNO3) or a solution containing either a competing ion or a complexing ligand species, i.e,, a chelating agent (e.g., ethylenediaminetetraacetate or EDTA). For example, Farrah and Pickering (1978) examined the ability of 17 different chemical solutions to displace heavy-metal ions (Pb, Zn, Cu and Cd) pre-adsorbed to the exchange sites of clay (kaolinite, illite and montmorillonite) at either pH 5 or 7. They found that only EDTA (0.001 M, pH 7) quantitatively released all four ions from each of the three clays. Procedures and extracting solutions for other chemical species and soils are described elsewhere (e.g., Tucker and Kurtz, 1955; Chester and Hughes, 1967; Tinker, 1969; S.K. Gupta and Chen, 1975; Silviera and Sommers, 1977; Guy et al., 1978; Lindsay and Norvell, 1978; Tessier et al., 1979; Lake et al., 1984).
In the digestion techniques, the non-mobile metals associated with the primary and secondary minerals (residual fraction) of the soil, as well as the mobile metal species (adsorbed plus liquid phase), are determined. The con- centrations of the nonmobile metal species are determined on separate samples of soil and then subtracted from total (nonmobile plus mobile) metal concentrations resulting from the digestion procedure to provide an estimate of the mobile (adsorbed plus liquid phase) metal concentrations. This
206 C.D. SHACKELFORD
procedure usually is done by alkaline fusion or dissolution of the soil with mixtures of hydrofluoric acid and some other strong acid, e.g., nitric or perchloric acid (Tessier et al., 1979). Other procedures for digestion are provided in Page et al. (1982) and Greenberg et al. (1985). The results of the study by Tessier et al. (1979), as well as others, illustrate the difficulty of distinguishing between background concentrations and mobile concentra- tions when only total metal analyses are performed. Therefore, it may be difficult, in practice, to utilize digestion techniques to determine contaminant concentration profiles in soils when there is a significantly high background (nonmobile) concentration of the contaminant species in the soil.
As an alternative to sectioning and extraction, Evans and Barber (1964) took autoradiographs using X-ray film to follow the movement of the radio- isotope, 86Rb+, in their diffusion cell apparatus. The advantage of this technique is that the concentration profile can be determined during the diffusion test as well as at the end of the test.
Organic chemicals
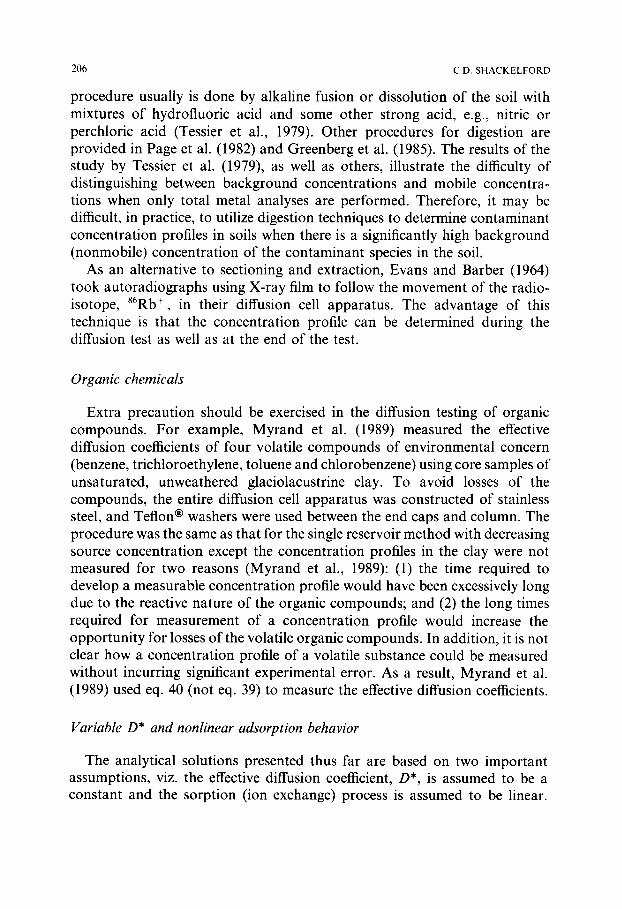
Extra precaution should be exercised in the diffusion testing of organic compounds. For example, Myrand et al. (1989) measured the effective diffusion coefficients of four volatile compounds of environmental concern (benzene, trichloroethylene, toluene and chlorobenzene) using core samples of unsaturated, unweathered glaciolacustrine clay. To avoid losses of the compounds, the entire diffusion cell apparatus was constructed of stainless steel, and Teflon ® washers were used between the end caps and column. The procedure was the same as that for the single reservoir method with decreasing source concentration except the concentration profiles in the clay were not measured for two reasons (Myrand et al., 1989): (1) the time required to develop a measurable concentration profile would have been excessively long due to the reactive nature of the organic compounds; and (2) the long times required for measurement of a concentration profile would increase the opportunity for losses of the volatile organic compounds. In addition, it is not clear how a concentration profile of a volatile substance could be measured without incurring significant experimental error. As a result, Myrand et al. (1989) used eq. 40 (not eq. 39) to measure the effective diffusion coefficients.
Variable D* and nonlinear adsorption behavior
The analytical solutions presented thus far are based on two important assumptions, viz. the effective diffusion coefficient, D*, is assumed to be a constant and the sorption (ion exchange) process is assumed to be linear.

LABORATORY DIFFUSION TESTING FOR WASTE DISPOSAL--A REVIEW 207
However, with respect to diffusion testing for waste disposal, these assumptions may not always be valid.
For example, Shackelford (1988a), Shackelford et al. (1989), and Shackel- ford and Daniel (1991b), measured adsorption isotherms of metal species at concentrations which were more typical of those in actual landfill leachates and found that the adsorption behavior was nonlinear. They found that the existence of the nonlinear adsorption behavior made evaluation of the diffusion test data difficult using analytical solutions.
In general, the existence of a variable D* and/or nonlinear adsorption behavior makes the resulting differential equation nonlinear which usually must be solved by numerical techniques. Such numerical techniques generally are more involved and, therefore, are beyond the scope of this paper. Crank (1975) provides a review of various methods of solution, including numerical methods, for the cases when D* is not constant. Crank (1975) also notes that when methods which assume constant diffusion coefficients are applied to systems in which such an assumption is not valid, a mean value of D* is obtained. In addition, the use of a single, constant value for R d when the adsorption behavior is nonlinear could affect greatly the determination of the free (liquid phase) concentrations, c, in the soil in accordance with eq. 50 (e.g., Shackelford et al., 1989; Shackelford and Daniel, 1991b).
Quality assurance~quality control measures
Several quality assurance/quality control (QA/QC) measures should be performed in diffusion testing. These QA/QC measures should include mass- balance analyses, and pH, electrical conductivity (EC) and temperature measurements. Blank (control) tests, i.e. tests without soil, should be performed to account for losses of chemical species due to the test apparatus. In addition, mass balances of the chemical species used in the diffusion tests should be performed at the end of the test to determine if there is experimental error and/or if chemical reactions (e.g., precipitation) may have occurred during diffusion testing. Such losses could affect significantly the interpre- tation of test data and the resulting determination of D*-values.
In order to evaluate the mass of a given chemical species in the soil, the concentrations of the contaminants in the soil must be measured. If the HPPWS technique is used to determine the concentrations of the metal species in the soil, the resulting concentrations must be multiplied by the retardation factor in accordance with eq. 50 in order to account for the total mass (adsorbed plus liquid phase) of the metal species in the soil. This is not the case for the chemical extraction and digestion techniques. However, inefficient extraction of the metal species can lead to significant errors in mass balance

208 C.D. SHACKELFORD
(e.g., Shackelford, 1988a; Shackelford et al., 1989; Shackelford and Daniel, 1991b).
The pH and temperature of the contaminant solution and soil should be measured since chemical reactions, including ion exchange, are known to be functions of pH and temperature (e.g., Stumm and Morgan, 1981). The EC measurement can provide an indication not only of the ionic strength of the solution but also the transport processes occurring during the soaking and diffusion stages of the test (e.g., Shackelford, 1988a; Shackelford et al., 1989).
SUMMARY OF EFFECTIVE DIFFUSION COEFFICIENTS
Values for D* or D* taken from the results of several studies are presented in Table 2. The data presented in Table 2 should be viewed with caution since an interpretation by the author was required in some cases. For example, the soils used in the diffusion tests performed by Clarke and Graham (1968) actually were unsaturated, but the authors indicated that the moisture tensions were so low that the soils could be considered essentially saturated.
In general, effective diffusion coefficients for anions are higher than those for cations. However, the values for tritium (3H+), which range from 4.5.10-1° to 1.7" 10 -9 m 2 s -l, are within the range of the other values reported for the nonreactive anions. This is to be expected since tritium is considered a nonreactive solute. The effective diffusion coefficients for all other cations generally are lower and cover a much broader range of ~ 1.0"I0 -t6 to
2.5" 10 -9 m 2 s -I . The lower values for cations can be attributed to the effect of adsorption on the cations during transport and to the fact that some of the values reported for cations are actually D*-values, not D*-values.
The values for the effective diffusion coefficients given in Table 2 are summarized in Table 3. Several points of interest should be noted. For instance, the range of D*-values reported for both nonreactive and reactive solutes in saturated soils is essentially the same. However, the D*-values for the reactive solutes in saturated soils can be as much as 5000 times lower than the corresponding D*-values. Therefore, the diffusive transport rates of reactive solutes can be much lower than those for the nonreactive solutes even though the D*-values for both nonreactive and reactive solutes are the same (i.e. D*-values include the effect of R a whereas D*-values do not).
For unsaturated soils, the range of D*-values for reactive solutes is about an order-of-magnitude lower than the corresponding range for the nonreac- tive solutes. However, this relatively small difference may be due to the incorporation of 0 into the definition of D* and/or to the different degrees of saturation (or unsaturation) in the different diffusion tests. Nonetheless, the D*-values in unsaturated soil are 2-40,000 times lower than the corresponding D*-values for the reactive solutes and 20-630,000 times lower than the D*-

TA
BL
E
2
Eff
ecti
ve d
iffu
sio
n c
oeff
icie
nts
for
sele
cted
ch
emic
al s
peci
es
Che
mic
al
Soil
(s)
Sys
tem
of
spec
ies*
i m
easu
rem
ent,
2
(A )
Satu
rate
d so
ils."
36C
I-
sand
H
C
loam
cl
ay
sand
-ben
toni
te
HC
CI-
si
lty
clay
loa
m;
sand
y lo
am
HC
si
lty
clay
C
CC
cl
ay t
ill
CD
C
kaol
init
e S
RD
C
clay
soi
l
Br-
si
lty
clay
loa
m;
sand
y lo
am
HC
so
il c
ores
(fi
eld)
H
C
kaol
init
e S
RD
C
clay
soi
l
3H +
sa
nd-b
ento
nite
H
C
kaol
init
e H
C
mon
tmor
illo
nite
32p
mon
tmor
illo
nite
H
C
kaol
init
e il
lite
si
lt l
oam
cl
ay l
oam
K +
cl
ay t
ill
CD
C
kaol
init
e S
RD
C
clay
soi
l N
a +
silt
y cl
ay
CC
C
clay
till
C
DC
Dif
fusi
on c
oeff
icie
nt
type
fo
rm
valu
e(s)
(1
0 l0
m 2
s
J)
Ref
eren
ce(s
)
self
D
ot
salt
D
O~
coun
ter
Do'C
sa
lt
D0"
r sa
lt
D O
z sa
lt
D0"
r
coun
ter
O0r
co
unte
r D
oz
salt
D
0r
salt
D
0 r
self
D
0r
self
D
0r
salt
D
0r
salt
D
ot
salt
D
(~r
salt
D
oz
5.6
7.1
6.1
7.0-
10
1.6-
4.4
6,1
0
5.7-
6.3
4.4
10
1.5-
4.7
3.7-
6.4
5.0-
7.0
4.8-
9.9
1.0-
18
8.0-
17
5.3
10.9
4.
5-9.
0
0.01
7-0.
12
0.00
28-0
.22
0.00
02-0
.003
4 0.
0050
-0.0
350
0.00
86-0
.040
0
6.3,
3.0
12
18
2.5,
3,5
4.
8, 5
.7
Cla
rke
and
Gra
ham
(19
68)
Gil
lham
et
al.
(198
4)
P.B
. B
arra
clou
gh a
nd T
inke
r (1
981)
C
rook
s an
d Q
uigl
ey (
1984
) R
owe
et a
l. (
1988
) S
hack
elfo
rd (
1988
a)
P.B
. B
arrc
loug
h an
d T
inke
r (1
981)
P.
B~
Bar
racl
ough
and
Tin
ker
(198
2)
Sha
ckel
ford
(19
88a)
Gil
lham
et
al.
(198
4)
Phil
lips
and
Bro
wn
(196
8)
Phil
lips
et
al.
(196
8)
Row
e et
al.
(19
88)
Sha
ckel
ford
(19
88a)
Cro
oks
and
Qui
gley
(19
84)
Row
e et
al.
(19
88)
~4
> 0
7o
>
0 Z
©
m a i <_
r~

TA
BL
E
2 (c
onti
nued
)
Eff
ecti
ve d
iffu
sio
n c
oeff
icie
nts
for
sele
cted
ch
emic
al s
peci
es
Che
mic
al
Soil
(s)
Sys
tem
of
spec
ies*
1
mea
sure
men
t,2
(A)
Satu
rate
d so
ils
(Con
t.):
S6R
b+
kaol
init
e
Ca 2
+
Cd
2+
Cu
2+
Fe 2
+
Fe 3
+
Mn
2+
pu 4+
85Sr
2+
895r
2+
Zn
2 +
C6H
6 T
CE
T
olue
ne
C6H
sCI
HC
si
lt l
oam
cl
ay l
oam
m
ontm
oril
loni
te
kaol
init
e si
lt l
oam
cl
ay l
oam
m
ontm
oril
loni
te
clay
till
C
DC
kaol
init
e S
RD
C
clay
soi
l
kaol
init
e S
RC
C
mon
tmor
illo
nite
mon
tmor
illo
nite
S
RC
C
mon
tmor
illo
nite
S
RC
C
kaol
init
e S
RC
C
bent
onit
e S
RC
C
sand
-ben
toni
te
HC
clay
soi
l S
RD
C
kaol
init
e S
RC
C
kaol
init
e S
RD
C
clay
soi
l
clay
till
S
RD
C
Dif
fusi
on c
oeff
icie
nt
type
fo
rm
valu
e(s)
(1
0 -1
0 m
2 s
-I)
Ref
eren
ce(s
)
self
D
ot
2.4
1.2
0.68
0.
54
coun
ter
Doz
/R d
0.82
0.
61
0.48
0.
39
salt
D
oz
3.8
salt
D
ot
3.2-
7.6
3.0-
10
salt
D
o r / R
d 4.
2 0.
27-0
.95
salt
D
o ~: / R
d 1.
0
salt
D
oz/R
d 0.
16-0
.44
salt
D
oz/R
d 4.
5
salt
D
oz/R
d <
0.00
01-0
.03
salt
D
oz/R
d 5.
0-20
self
D
o~/R
o 0.
I-0.
12
salt
D
oz/ R
d 5.
1 sa
lt
Doz
3.
5-10
1.
5-25
salt
D
oz/R
d O
. I 1
0.
06
0.04
0.
03
Phil
lips
and
Bro
wn
(196
4)
Row
e et
al.
(19
88)
Sha
ckel
ford
(I 9
88a)
Ell
is e
t al
. (1
970a
)
Ell
is e
t al
. (1
970b
)
Ell
is e
t al
. (1
970b
)
Ell
is e
t al
. (1
970a
)
Idem
itsu
et
al.
(199
0)
Gil
lham
et
al.
(198
4)
Mor
t an
d N
ye (
1968
)
Ell
is e
t al
. (1
970a
) S
hack
elfo
rd (
1988
a)
Myr
and
et a
l. (
1989
)

( B)
Uns
atur
ated
soils
:
36C
1-
silt
loa
m
HC
co
unte
r D
0r
0.63
-12
1.0-
11
CI-
sa
ndy
loam
H
C
self
D
orO
4.
1 7.
0 NO
~-
glas
s be
ads
HC
co
unte
r D
oz
15
sand
14
si
lt
13
32p
silt
y cl
ay l
oam
SS
, H
C
self
D
ozO
0.
04-1
.55
86R
b+
clay
; sa
ndy
loam
; si
lt
HC
se
lf
Doz
O
0.05
6-0.
155
loam
H
C
self
D
oz/R
d 0.
064-
0.45
0
1°9C
d2+
silt
loa
m;
loam
H
C
coun
ter
Do
z[R
d 0.
0000
52-0
.000
32
6-SZ
n na
tura
l so
il
HC
se
lf
Do~
/R,I
0.00
6-0.
82
silt
loa
m;
loam
H
C
coun
ter
Dor
/R o
0.00
0018
-0.0
017
silt
loa
m
HC
co
unte
r D
oz/
R d
0.00
0001
si
lt l
oam
H
C
coun
ter
Do
r/R
d O
. I
War
ncke
and
Bar
ber
(197
2a)
War
ncke
and
Bar
ber
(197
2b)
D.
Bar
racl
ough
and
Nye
(19
79)
Rom
kens
and
Bru
ce (
1964
)
D.
Bar
racl
ough
and
Nye
(19
79)
Gra
ham
-Bry
ce (
1963
c)
Pati
l et
al.
(19
63)
Mul
lins
and
Som
mer
s (1
986)
G.N
. G
up
ta a
nd D
eb (
1982
) M
ulli
ns a
nd S
omm
ers
(198
6)
War
ncke
and
Bar
ber
(197
2a,
b)
War
ncke
and
Bar
ber
(197
2a,
b)
,IT
CE
=
tric
hlor
oeth
ylen
e.
"2S
S =
st
eady
sta
te;
CC
C
~ co
lum
n w
ith
cons
tant
sou
rce
conc
entr
atio
n; C
DC
=
colu
mn
wit
h de
crea
sing
sou
rce
conc
entr
atio
n; H
C ~
ha
lf-c
ell;
SR
CC
=
sing
le r
eser
voir
wit
h co
nsta
nt s
ourc
e co
ncen
trat
ion;
SR
DC
=
sing
le r
eser
voir
wit
h de
crea
sing
sou
rce
conc
entr
atio
n.
,-t
v > t'-' I 7o
D'I
.<

212
TABLE 3
C.D. SHACKELFORD
Summary of effective diffusion coefficients
Type of Form of dif- solute fusion coefficient
Range of effective diffusion coefficients (10-1°m 2 s l)
saturated soil unsaturated soil
Nonreactive D* 1.0-18 0.63-15
Reactive D* 0.54-25 0.04-1.55 D~ 0.0001-20 0.000001-0.82
values for the nonreactive solutes. Undoubtedly, the Rd-values for the reactive solutes diffusing in unsaturated soils are much higher than in saturated soils due to the close proximity of the diffusing chemical species to the surface of the soil particle. As a result, the diffusive transport of reactive solutes in unsaturated soils can be significantly reduced relative to that of the nonreac- tive solutes in unsaturated soils.
Overall, the D*-values for both nonreactive and reactive solutes in saturated soils are as much as 10-20 times greater than the corresponding values in unsaturated soils. The lower values for D* for tests performed on unsaturated soils reflect the effects of reduced cross-sectional area for transport, increased tortuosity and increased viscosity of the water (solvent) near the surface of the soil particle. In addition, the diffusive transport rates of reactive solutes in unsaturated soils can be as much as 20-100 times slower than the corresponding rates in saturated soils. These differences in D*- and D~,-values between unsaturated and saturated soils generally are much greater than the differences due to other physical factors; e.g., dry density of the soil, soil pore size and clay content (see Shackelford, 1988a).
The results of this summary suggest that the major factors affecting laboratory measured diffusion coefficients for soils are the degree of saturation of the soil and whether or not the diffusing chemical species is reactive, i.e. is subject to ion-exchange reactions.
SUMMARY AND CONCLUSIONS
In the absence of coupled flow processes, the case of pure diffusive mass transport of a chemical species represents the limiting transport process through an earthen barrier. As a result, the best barrier that can be built is one in which diffusion is the sole transport process (i.e. if coupled flow processes are negligible). The existing evidence suggests that diffusion will be dominant when the seepage velocity is on the order of ~< 0.005 m yr- I. Such low seepage velocities generally are associated with transport through fine-grained (e.g.,

LABORATORY DIFFUSION TESTING FOR WASTE DISPOSAL--A REVIEW 213
clayey) soils. Since fine-grained soils typically are used as waste containment barriers, it is apparent that laboratory diffusion testing will become a necessary component of the overall design and evaluation processes associated with waste disposal practice.
The laboratory methods for determining liquid-phase diffusion coefficients of chemical species diffusing through fine-grained soils were presented. Both steady-state and transient methods were considered. The transient methods include the column method, the half-cell method, the double reservoir method and the single reservoir method. The appropriate analytical solutions required to calculate the diffusion coefficients from the laboratory data also were presented.
The major difference between the column method and the other transient methods is that advective flow is allowed to occur in the column method. In addition, the conditions of the test may vary depending on whether or not the source concentration of the contaminant is allowed to decrease with time, and whether or not the contaminant is allowed to reach the effluent end of the soil. Care must be taken to insure that the appropriate analytical solution is being used for the experimental conditions of the diffusion test.
Two methods for saturating unsaturated soils prior to the start of diffusion testing are described. The permeation method can provide information on the hydraulic conductivity of the soil and typically requires less time than the soaking method. However, the soaking method may model the field situation better and may result in less disturbance to the soil (e.g., due to excessive seepage forces).
Three methods - - high-pressure pore water squeeze (HPPWS), chemical extraction and chemical digestion - - for extracting contaminant species from the soil at the end of diffusion testing were described. Extraction of contami- nants is required whenever the concentration profiles or total mass of the contaminant which has diffused into the soil is desired for effective diffusion coefficient (D*) or mass-balance determinations. The HPPWS technique directly determines the free (liquid phase) concentrations of the contaminants in the soil whereas the chemical extraction and chemical digestion techniques result in the determination of the total (adsorbed plus liquid phase) concen- trations of the contaminants. Whereas the HPPWS technique may be more appropriate for determination of D*-values from soil concentration profiles, the chemical extraction and chemical digestion techniques are probably more suited to determining mass balances. Mass-balance calculations, as well as several other quality assurance/quality control measures, should be performed to help evaluate the validity of the test results. Finally, special precautions should be taken when performing diffusion tests using organic chemicals due to the volatility and adsorption characteristics of many organic chemicals.

214 C.D. SHACKELFORD
The major physical factor affecting the value of measure effective diffusion coefficients is the degree of saturation of the soil, with D*-values for non- reactive and reactive solutes in saturated soils being as much as 10-20 times higher than the corresponding values in unsaturated soils. Most other physical factors only become important in soils which are highly unsaturated. In addition, the diffusive transport rates of reactive solutes subject to reversible sorption reactions can be as much as 5000 times lower than those of nonreactive solutes in saturated soils, and from 20 to 630,000 times lower in unsaturated soils. However, due to a greater degree of conservatism and practicality, laboratory diffusion testing in practice likely will be performed only routinely on saturated soils. As a result, the degree of saturation of the soil should be a primary consideration in application of the results of laboratory diffusion tests to the design and evaluation of waste disposal facilities.
R E F E R E N C E S
Abromowitz, M. and Stegun, I.A., 1972. Handbook of Mathematical Functions. Dover, New York, NY, 1046 pp.
Barraclough, D. and Nye, P.H., 1979. The effect of molecular size on diffusion characteristics in soil. J. Soil Sci., 30: 29-42.
Barraclough, P.B. and Tinker, P.B., 1981. The determination of ionic diffusion coefficients in field soils, I. Diffusion coefficients in sieved soils in relation to water content and bulk density. J. Soil Sci., 32: 225-236.
Barraclough, P.B. and Tinker, P.B., 1982. The determination of ionic diffusion coefficients in field soils, II. Diffusion of bromide ions in undisturbed soil cores. J. Soil Sci., 33: 13-24.
Barrer, R.M., 1951. Diffusion In and Through Solids. Cambridge University Press, Cambridge, 464pp. Bear, J., 1972. Dynamics of Fluids in Porous Media. American Elsevier, New York, NY, 764pp. Bear, J., 1979. Hydraulics of Groundwater. McGraw-Hill, New York, NY, 569pp. Bear, J. and Verruijt, A., 1987. Modeling Groundwater Flow and Pollution. D. Reidel, Dordrecht, 414 pp. Biggar, J.W. and Nielsen, D.R., 1960. Diffusion effects in miscible displacement occurring in saturated and
unsaturated porous materials. J. Geophys. Res., 65(9): 2887-2895. Bishop, A.W. and Henkel, D.J., 1962. The Measurement of Soil Properties in the Triaxial Test. Edward
Arnold, London, 2nd ed., 228 pp. Brown, D.A., Fulton, B.E. and Phillips, R.E., 1964. Ion diffusion, I. A quick-freeze method for the
measurement of ion diffusion in soil and clay systems. Proc. Soil Sci. Soc. Am., 28(5): 628-632. Carslaw, H.S. and Jaeger, J.C., 1959. Conduction of Heat in Solids. Oxford University Press, Oxford, 2nd
ed., 510pp. Chester, R. and Hughes, M.J., 1967. A chemical technique for the separation of ferro-manganese minerals,
carbonate minerals and adsorbed trace metals from pelagic sediments. Chem. Geol., 2: 249-262. Clarke, A.L. and Graham, E.R., 1968. Zinc diffusion and distribution coefficients in soil as affected by soil
texture, zinc concentration and pH. Soil Sci., 105(6): 409-418. Comyn, J., 1985. Introduction to polymer permeability and the mathematics of diffusion. In: J. Comyn
(Editor), Polymer Permeability, Ch. 1. Elsevier Applied Science Publ., London, pp. I-I0. Conca, J.L. and Wright, J., 1990. Diffusion coefficients in gravel under unsaturated conditions. Water
Resour. Res., 26(5): 1055-1066. Crank, J., 1975. The Mathematics of Diffusion. Clarendon Press, Oxford, 2nd ed., 414pp. Crooks, V.E. and Quigley, R.M., 1984. Saline leachate migration through clay: A comparative laboratory
and field investigation. Can. Geotech. J., 21: 349-362.
LABORATORY DIFFUSION TESTING FOR WASTE DISPOSAL--A REVIEW 215
Daniel, D.E. and Shackelford, C.D., 1988. Disposal barriers that release contaminants only by molecular diffusion. Nucl. Chem. Waste Manage., 8: 299-305.
Daniel, D.E., Shackelford, C.D., Liao, W.P. and Liljestrand, H.M., 1989. Rate of flow of leachate through clay soil liners. Geotech. Eng. Cent., Bur. Eng. Res., Univ. of Texas at Austin, Austin, TX 78712, 127 pp.
de Marsily, G., 1986. Quantitative Hydrogeology. Academic Press, Orlando, FL, 440pp. Desaulniers, D.E., 1986. Groundwater origin, geochemistry and solute transport in three major glacial clay
plains in East-Central North America. Ph.D. Dissertation, Department of Earth Sciences, University of Waterloo, Waterloo, Ont. (unpublished).
Desaulniers, D.E., Cherry, J.A. and Fritz, P., 1981. Origin, age and movement of pore water in argillaceous Quatenary deposits at four sites in southwestern Ontario. J. Hydrol., 50: 231-257.
Desaulniers, D.E., Cherry, J.A. and Fritz, P., 1982. Origin, age and movement of pore water in clayey Pleistocene deposits in south central Canada. In: E.C. Perry and C.W. Montgomery (Editors), Isotope Studies in Hydrogeologic Processes, Northern lllinois University Press, Dekalb, IL, pp. 45-55.
Desaulniers, D.E., Cherry, J.A. and GiUham, R.W., 1984. Hydrogeologic analysis of long term solute migration in thick clayey Quaternary deposits. Proc. Int. Symp. on Groundwater Resources Utilization and Contaminant Hydrogeology, Montrral, Qur., May 1984, Int. Assoc. Hydrogeol., II: 349-356.
Desaulniers, D.E., Kaufman, R.S., Cherry, J.A. and Bentley, H.W., 1986. 37C1-35C1 variations in a diffusion-controlled groundwater system. Geochim. Cosmochim. Acta, 50: 1757-1764.
Dutt, G.R. and Low, P.F., 1962. Diffusion of alkali chloride in clay-water systems. Soil Sci., 93: 233-240. Ellis, J.H., Barnhisel, R.I. and Phillips, R.E., 1970a. The diffusion of copper, manganese, and zinc as
affected by concentration, clay mineralogy, and associated anions. Proc. Soil Sci. Soc. Am., 34: 866-870.
Ellis, J.H., Phillips, R.E. and Barnhisel, R.I., 1970b. Diffusion of iron in montmorillonite as determined by X-ray emission. Proc. Soil Sci. Soc. Am., 34: 591-595.
Evans, S.D. and Barber, S.A., 1964. The effect of cation-exchange capacity, clay content, and fixation of rubidium-86 diffusion in soil and kaolinite systems. Proc. Soil Sci. Soc. Am., 28(1): 53-56.
Farrah, H. and Pickering, W.F., 1978. Extraction of heavy metal ions sorbed on clay. Water, Air, Soil Pollut., 9: 491-498.
Freeze, R.A. and Cherry, J.A., 1979. Groundwater. Prentice-Hall, Englewood Cliffs, NJ, 604pp. Gillham, R.W., Robin, M.L.J., Dytynyshyn, D.J. and Johnston, H.M., 1984. Diffusion of nonreactive and
reactive solutes through fine-grained barrier materials. Can. Geotech. J., 21: 541-550. Goodall, D.C. and Quigley, R.M., 1977. Pollutant migration from two sanitary landfill sites near Sarnia,
Ontario. Can. Geotech. J., 14: 223-236. Graham-Bryce, I.J., 1963. Effect of moisture content and soil type on self-diffusion of S6Rb in soils. J. Agric.
Sci., 60: 239-244. Gray, D.H. and Weber, Jr., W.J., 1984. Diffusional transport of hazardous waste leachate across clay
barriers. Proc. 7th Annu. Madison Waste Conf., Sept. 11-12, Univ. Wisconsin, Madison, WI, pp. 373- 389.
Greenberg, A.E., Trussell, R.R., Clerceri, L.S. and Franson, M.A.H., 1985. Standard Methods for the Examination of Water and Wastewater. Am. Public Health Assoc. Water Works Assoc.-Water Pollut. Control Fed., Washington, DC, 16th ed., 1268 pp.
Gupta, G.N. and Deb, D.L., 1982. Interaction of lime and EDTA on the rate of zinc diffusion in acid soil. J. Indian Soc. Soil Sci., 30(4): 455-458.
Gupta, S.K. and Chen, K.Y., 1975. Partitioning of trace metals in selective chemical fractions of nearshore sediments. Environ. Lett., 10(2): 129-158.
Guy, R.D., Chakrabarti, C.L. and McBain, D.C., 1978. An evaluation of extraction techniques for the fractionation of copper and lead in model sediment systems. Water Res., 12: 21-24.
Horton, R., Thompson, M.L. and McBride, J.F., 1985. Estimating transit times of noninteracting pollutants through compacted soil materials. Proc. I 1 th Annu. Solid Waste Res. Symp., April 19-May I, 1985. Cincinnati, OH, EPA/600/9-85/013, pp. 275-282.
Husted, R.F. and Low, P.F., 1954. Ion diffusion in bentonite. Soil Sci., 77(5): 343-353. Idemitsu, K., Ishiguro, K., Yusa, Y., Noriaki, S. and Tsunoda, N., 1990. Plutonium diffusivity in
compacted bentonite. Eng. Geol., 28: 455--462.
216 C.D. SHACKELFORD
Johnson, R.L., Cherry, J.A. and Pankow, J.F., 1989. Diffusive contaminant transport in natural clay: A field example and implications for clay-lined waste disposal sites. Environ. Sci. Technol., 23: 340-349.
Jost, W., 1960. Diffusion in Solids, Liquids, and Gases. Academic Press, New York, NY, 558 pp. Kemper, W.D. and van Schaik, J.C., 1966. Diffusion of salts in clay-water systems. Proc. Soil Sci. Soc.
Am., 30: 534-540. Klute, A. and Letey, J., 1958. The dependence of ionic diffusion on the moisture content of nonadsorbing
porous media. Proc. Soil Sci. Soc. Am., 22: 231-215. Lake, D.L., Kirk, P.W.W. and Lester, J.N., 1984. Fractionation, characterization, and speciation of heavy
metals in sewage sludge and sludge-amended soils: A review. J. Environ. Qual., 13(2): 175-183. Li, Y-H. and Gregory, S., 1974. Diffusion of ions in sea water and in deep-sea sediments. Geochim.
Cosmochim. Acta, 38: 703-714. Liao, W-P. and Daniel, D.E., 1989. Time of travel of contaminants through soil liners. Proc. 12th Annu.
Madison Waste Conference, Madison, Wl, Sept. 20-21, 1989, pp. 367-376. Lindsay, W.L. and Norvell, W.A., 1978. Development ofa DTPA soil test for zinc, iron, manganese, and
copper. J. Soil Sci. Soc. Am., 42: 421428. Mitchell, J.K. and Younger, J.S., 1967. Abnormalities in hydraulic flow through fine-grained soils. In:
Permeability and Capillarity of Soils. Am. Soc. Test. Mater., ASTM STP 417, pp. 106-139. Mott, C.J.B. and Nye, P.H., 1968. Contribution of adsorbed strontium to its self-diffusion in a moisture
saturated soil. Soil Sci., 105(1): 18-23. MuUins, G.L. and Sommer, L.E., 1986. Characterization of cadmium and zinc in four soils treated with
sewage sludge. J. Environ. Qual., 15(4): 382-387. Muurinen, A., 1990. Diffusion of uranium in compacted sodium bentonite. Eng. Geol., 28: 359-367. Myrand, D., Gillham, R.W., Cherry, J.A. and Johnson, R., 1989. Diffusion of volatile organic compounds
in natural clay deposits. Dep. Earth Sci., Univ. of Waterloo, Waterloo, Ont. Ogata, A., 1970. Theory of dispersion in granular medium. U.S. Geol. Surv., Prof. Pap. 411-I. Ogata, A. and Banks, R.B., 1961. A solution of the differential equation of longitudinal dispersion in
porous media. U.S. Geol. Surv., Prof. Pap. 411-A. Olsen, S.R. and Kemper, W.D., 1968. Movement of nutrients to plant roots. Adv. Agron., 20: 91-151. Olsen, S.R., Kemper, W.D. and van Schaik, J.C., 1965. Self-diffusion coefficients of phosphorus in soil
measured by transient and steady-state methods. Proc. Soil Sci. Soc. Am., 29: 154-158. Olson, R.E. and Daniel, D.E., 1979. Measurement of the hydraulic conductivity of fine-grained soils. In:
T.F. Zimmie and C.O. Riggs (Editors), Permeability and Groundwater Contaminant Transport. Am. Soc. Test. Mater., Philadelphia, PA, ASTM STP 746, pp. 18-64.
Page, A.L., Miller, R.H. and Keeney, D.R., 1982. Methods of Soil Analysis, Part 2. Chemical and Microbiological Properties. Soc. Agron., Madison, WI, 2nd ed., 1159 pp.
Parlange, J.Y. and Starr, J.L., 1975. Linear dispersion in finite columns. Proc. Soil Sci. Soc. Am., 39(5): 817-819.
Patil, A.S., King, K.M. and Miller, M.H., 1963. Self-diffusion of rubidium as influenced by soil moisture tension. Can. J. Soil Sci., 43: 44-51.
Phillips, R.E. and Brown, D.A., 1964. Ion diffusion, II. Comparison of apparent self and counter diffusion coefficients. Proc. Soil Sci. Soc. Am., 28: 758-763.
Phillips, R.E. and Brown, D.A., 1968. Self-diffusion of tritiated water in montmorillonite and kaolinite clay. Proc. Soil Sci. Soc. Am., 32: 302-306.
Phillips, R.E., Place, G.A. and Brown, D.A., 1968. Self-diffusion of phosphorus in clays in soils, I. The effect of phosphorous rate. Proc. Soil Sci. Soc. Am., 32: 41-44.
Porter, L.K., Kemper, W.D., Jackson, R.D. and Steward, B.A., 1960. Chloride diffusion in soils as influenced by moisture content. Proc. Soil Sci. Soc. Am., 24(6): 4004-403.
Quigley, R.M., Yanful, E.K. and Fernandex, F., 1987. Ion transfer by diffusion through clayey barriers. In: R.D. Woods (Editor), Geotechnical Practice for Waste Disposal, Am. Soc. Civ. Eng., Spec. Publ. No. 13, pp. 137-158.
Robin, M.J.L., Gillham, R.W. and Oscarson, D.W., 1987. Diffusion of strontium and chloride in compacted clay-based materials. J. Soil Sci. Soc. Am., 51:1102-1108.
Robinson, R.A. and Stokes, R.H., 1959. Electrolyte Solutions. Butterworths, London, 2nd ed., 559pp. Rogers, C.E., 1985. Permeation of gases and vapors in polymers. In: J. Comyn (Editor), Polymer Per-
meability, Ch. 2. Elsevier Applied Science Publ., London, pp. 11-74.

LABORATORY DIFFUSION TESTING FOR WASTE DISPOSAL--A REVIEW 217
Romkens, M.J.M. and Bruce, R.R., 1964. Nitrate diffusivity in relation to moisture content of non-adsorb- ing porous media. Soil Sci., 98: 333-337.
Rowe, R.K., 1987. Pollutant transport through barriers. In: R.D. Woods (Editor), Geotechnical Practice for Waste Disposal. Am. Soc. Civ. Eng., Spec. PuN. No. 13, pp. 159-181.
Rowe, R.K. and Booker, J.R., 1984. The analysis of pollutant migration in a non-homogeneous soil. Geotechnique, 34(4): 601-612.
Rowe, R.K. and Booker, J.R., 1985. I-D pollutant migration in soils of finite depth. Am. Soc. Civ. Eng., Geotech. Eng., 111(4): 479-499.
Rowe, R.K., Caers, C.J. and Crooks, V.E., 1985. Pollutant migration through clay soils, Proc. 1 lth Int. Conf. on Soil Mechanics and Foundation Engineering, San Francisco, CA, pp. 1293-1298.
Rowe, R.K., Caers, CJ . and Barone, F., 1988, Laboratory determination of diffusion and distribution coefficients of contaminants using undisturbed clayey soils. Can. Geotech. J., 25: 108-I 18.
Shackelford, C.D., 1988a. Diffusion of inorganic chemical wastes in compacted clay. Ph.D. Dissertation, Department of Civil Engineering, University of Texas, Austin, TX, 449 pp.
Shackelford, C.D., 1988b. Diffusion as a transport process in fine-grained barrier materials. Geotech. News, 6(2): 24-27.
Shackelford, C.D., 1989. Diffusion of contaminants through waste containment barriers. In: Transporta- tion Research Record 1219. Transport. Res. Board, Nat. Res. Counc., Washington, DC, pp. 169-182.
Shackelford, C.D. and Daniel, D.E., 1991a. Diffusion in saturated soil, I. Background. Am. Soc. Civ. Eng., Geotech. Eng., 117(3) (in press).
Shackelford, C.D. and Daniel, D.E., 1991 b. Diffusion in saturated soil, II. Results for compacted clay. Am. Soc. Civ. Eng., Geotech. Eng., 117(3) (in press).
Shackelford, C.D., Daniel, D.E. and Liljestrand, H.M., 1989. Diffusion in inorganic chemical species in compacted clay soil. J. Contam. Hydrol, 4(3): 441-473.
Silviera, D.J. and Sommers, L.E., 1977. Extractability of copper, zinc, cadmium, and lead in soils incubated with sewage sludge. J. Environ. Qual., 6(1): 7-52.
Stumm, w. and Morgan, J.J., 1981, Aquatic Chemistry. Wiley, New York, NY., 2nd ed., 780pp, Tessier, A., Campbell, P.G.C. and Bisson, M., 1979. Sequential extraction procedure for the speciation of
particulate trace metals. Anal. Chem., 51(7): 844-850. Tinker, P.B., 1969. A steady-state method for determining diffusion coefficients in soil. J. Soil Sci., 20(2):
336-345. Tucker, T.C. and Kurtz, L.T., 1955. A comparison of several chemical methods with the bio-assay
procedure for extracting zinc from soils. Proc. Soil Sci. Soc. Am., 19: 477-481. van Schaik, J.C. and Kemper, W.D., 1966. Chloride diffusion in clay-water systems. Proc. Soil Sci. Soc.
Am., 30: 22-25. van Schaik, J.C., Kemper, W.D, and Olsen, S.R., 1966. Contribution of adsorbed cations to diffusion in
clay-water systems. Proc. Soil Sci. Soc. Am., 30: 17-22. Warncke, D.D. and Barber, S.A., 1972a. Diffusion of zinc in soil. I. The influence of soil moisture. Proc.
Soil Soc. Am., 36: 39-42. Warncke, D.D. and Barber, S.A., 1972b. Diffusion of zinc in soil, 11. The influence of soil bulk density and
its intereaction with soil moisture. Proc. Soil Sci. Soc. Am., 36: 42-46. Wyllie, M.R.J. and Spangler, M.B., 1952. Application of electrical resistivity measurements to problems
of fluid flow in porous media. Bull. Am. Assoc. Geol., 36(2): 359-403.