Embed Size (px)
Citation preview

pwc.co.nz
Review on the likely impact of an uptake in LED road lighting
Energy Efficiency and
Conservation Authority
28 October 2014
PricewaterhouseCoopers, 113-119 The Terrace, PO Box 243, Wellington 6140, New Zealand T: +64 4 462 7000, F: +64 4 462 7001, pwc.co.nz
Terry Collins Energy Efficiency and Conservation Authority Level 8 44 The Terrace Wellington, 6011
28 October 2014
Review on the likely impact of an uptake in LED road lighting
Dear Terry
In accordance with the Contract for Services dated 25 August 2014, we attach our review on the likely
impact of an uptake in LED road lighting.
Please do not hesitate to contact us if you would like to discuss any aspect of this draft report.
Our report should be read in conjunction with the restrictions as outlined at the end of this report.
Kind regards
Richard Forgan Engagement Partner [email protected] T: (64) 4 462 7118

PwC
Table of contents
Executive Summary 2
Overview 4
Participants in an Accelerated Uptake of LED Lighting 5
Impacts of a Move to LED Road Lighting 11
2
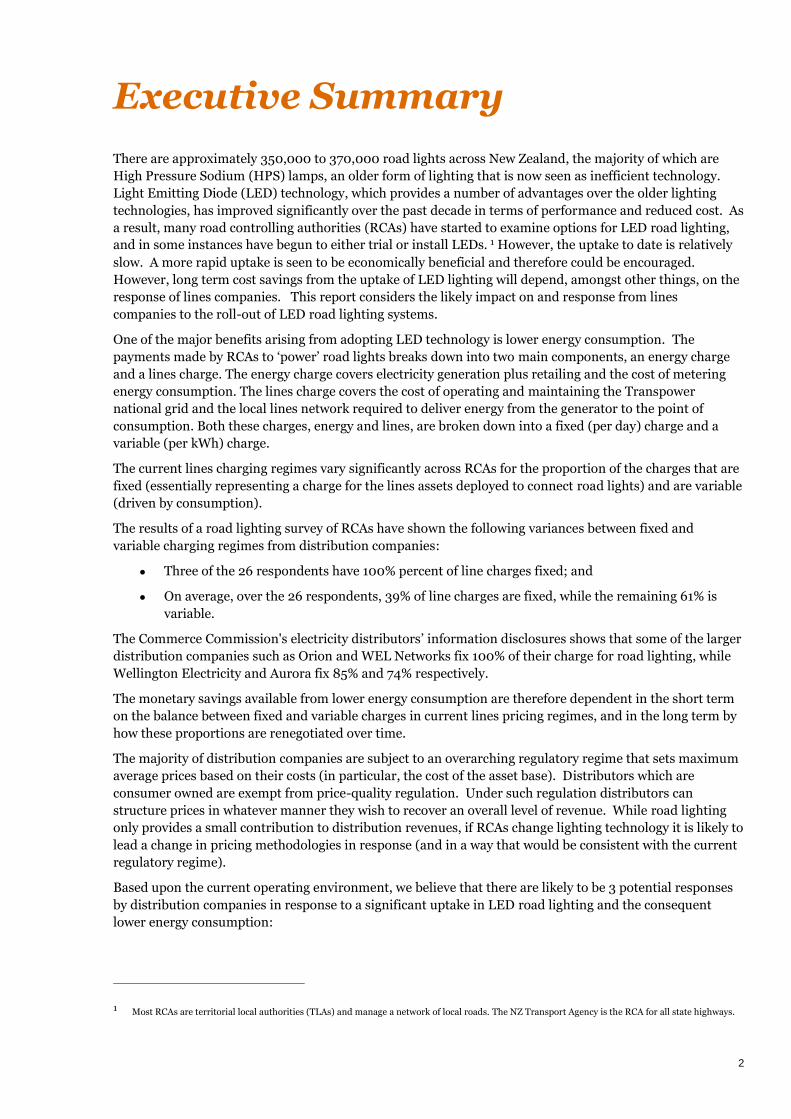
Executive Summary
There are approximately 350,000 to 370,000 road lights across New Zealand, the majority of which are
High Pressure Sodium (HPS) lamps, an older form of lighting that is now seen as inefficient technology.
Light Emitting Diode (LED) technology, which provides a number of advantages over the older lighting
technologies, has improved significantly over the past decade in terms of performance and reduced cost. As
a result, many road controlling authorities (RCAs) have started to examine options for LED road lighting,
and in some instances have begun to either trial or install LEDs. 1 However, the uptake to date is relatively
slow. A more rapid uptake is seen to be economically beneficial and therefore could be encouraged.
However, long term cost savings from the uptake of LED lighting will depend, amongst other things, on the
response of lines companies. This report considers the likely impact on and response from lines
companies to the roll-out of LED road lighting systems.
One of the major benefits arising from adopting LED technology is lower energy consumption. The
payments made by RCAs to ‘power’ road lights breaks down into two main components, an energy charge
and a lines charge. The energy charge covers electricity generation plus retailing and the cost of metering
energy consumption. The lines charge covers the cost of operating and maintaining the Transpower
national grid and the local lines network required to deliver energy from the generator to the point of
consumption. Both these charges, energy and lines, are broken down into a fixed (per day) charge and a
variable (per kWh) charge.
The current lines charging regimes vary significantly across RCAs for the proportion of the charges that are
fixed (essentially representing a charge for the lines assets deployed to connect road lights) and are variable
(driven by consumption).
The results of a road lighting survey of RCAs have shown the following variances between fixed and
variable charging regimes from distribution companies:
Three of the 26 respondents have 100% percent of line charges fixed; and
On average, over the 26 respondents, 39% of line charges are fixed, while the remaining 61% is
variable.
The Commerce Commission's electricity distributors’ information disclosures shows that some of the larger
distribution companies such as Orion and WEL Networks fix 100% of their charge for road lighting, while
Wellington Electricity and Aurora fix 85% and 74% respectively.
The monetary savings available from lower energy consumption are therefore dependent in the short term
on the balance between fixed and variable charges in current lines pricing regimes, and in the long term by
how these proportions are renegotiated over time.
The majority of distribution companies are subject to an overarching regulatory regime that sets maximum
average prices based on their costs (in particular, the cost of the asset base). Distributors which are
consumer owned are exempt from price-quality regulation. Under such regulation distributors can
structure prices in whatever manner they wish to recover an overall level of revenue. While road lighting
only provides a small contribution to distribution revenues, if RCAs change lighting technology it is likely to
lead a change in pricing methodologies in response (and in a way that would be consistent with the current
regulatory regime).
Based upon the current operating environment, we believe that there are likely to be 3 potential responses
by distribution companies in response to a significant uptake in LED road lighting and the consequent
lower energy consumption:
1 Most RCAs are territorial local authorities (TLAs) and manage a network of local roads. The NZ Transport Agency is the RCA for all state highways.
3
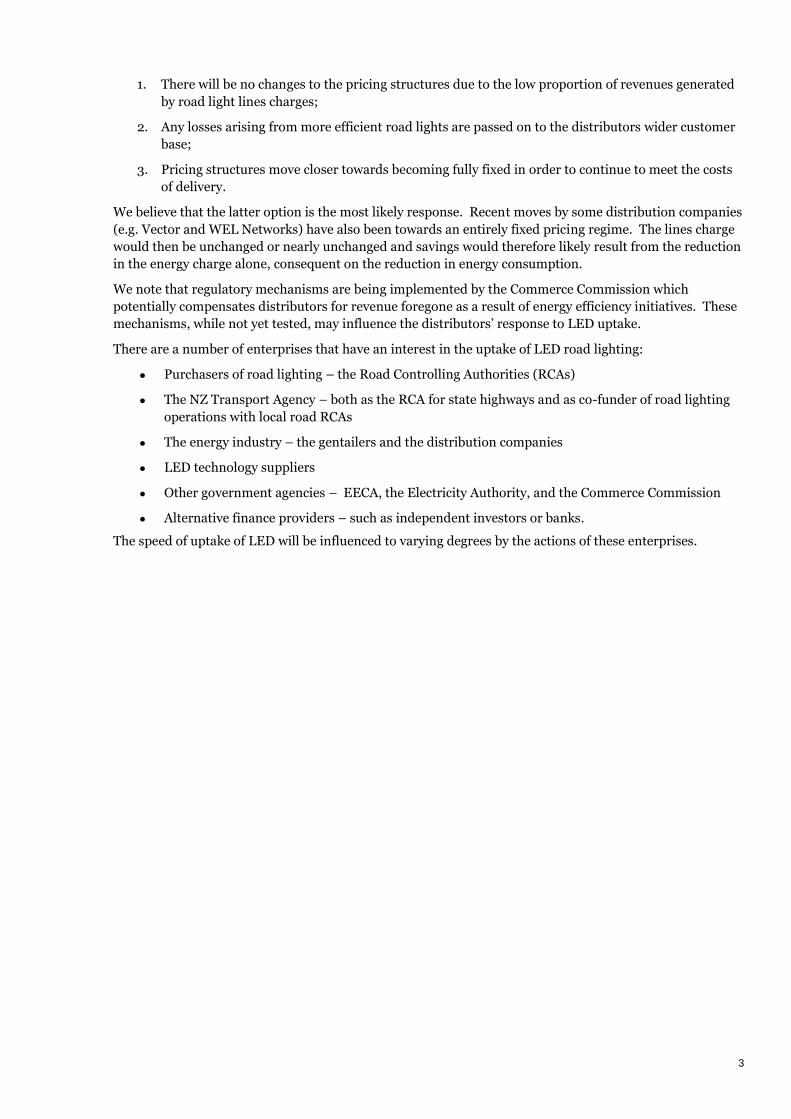
1. There will be no changes to the pricing structures due to the low proportion of revenues generated
by road light lines charges;
2. Any losses arising from more efficient road lights are passed on to the distributors wider customer
base;
3. Pricing structures move closer towards becoming fully fixed in order to continue to meet the costs
of delivery.
We believe that the latter option is the most likely response. Recent moves by some distribution companies
(e.g. Vector and WEL Networks) have also been towards an entirely fixed pricing regime. The lines charge
would then be unchanged or nearly unchanged and savings would therefore likely result from the reduction
in the energy charge alone, consequent on the reduction in energy consumption.
We note that regulatory mechanisms are being implemented by the Commerce Commission which
potentially compensates distributors for revenue foregone as a result of energy efficiency initiatives. These
mechanisms, while not yet tested, may influence the distributors’ response to LED uptake.
There are a number of enterprises that have an interest in the uptake of LED road lighting:
Purchasers of road lighting – the Road Controlling Authorities (RCAs)
The NZ Transport Agency – both as the RCA for state highways and as co-funder of road lighting
operations with local road RCAs
The energy industry – the gentailers and the distribution companies
LED technology suppliers
Other government agencies – EECA, the Electricity Authority, and the Commerce Commission
Alternative finance providers – such as independent investors or banks.
The speed of uptake of LED will be influenced to varying degrees by the actions of these enterprises.

4
Overview
Context The Energy Efficiency and Conservation Authority is looking to examine whether there may be advantages
in accelerating the uptake of Light Emitting Diode (LED) road lighting, and to explore and evaluate the
potential commercial and financial structures that could be used to assist the RCAs to do so.
LED lighting technology has advanced significantly over the past 10 years. LED road lighting is seen to
offer a number of significant advantages over older lighting technology (primarily HPS lighting) including:
Greater energy efficiency
Longer lifetime (resulting in lower maintenance costs)
Lower failure rates
Improving road safety.
LED technology is now able to be supplied at a cost where funding upgrades can be an attractive
opportunity for RCAs. However, funding such a significant upgrade can be costly, and many RCAs may not
be in a position to fund the LED uptake in the short term.
Scope This report examines the current road lighting environment in New Zealand focusing on two specific areas:
A scoping of the potential participants and their role in the uptake of LED road lighting;
An assessment of the potential impact of a move to LED road lights on the current charging
regimes used by lines companies, and the extent of benefits likely to arise from lower energy
consumption.
Approach This report is split into two sections. The first section provides a high-level overview of the potential roles
of participants that may be involved in the LED uptake process. The second section provides a profile of
road lighting in New Zealand, the charging regimes relating to road lighting, and the potential response of
market participants of a move to LED road lighting. To develop this report we have undertaken a
comprehensive review of:
Research and reports on road lighting – both globally and nationally
Existing stakeholder reviews and analysis
Developed RCA business cases relating to road lights
Regulatory documentation and information.
In addition, we have analysed the responses from the recent survey of New Zealand Society of Local
Government Managers (the SOLGM survey) and Commerce Commission disclosure information, and have
held interviews with a number key stakeholders to gain an understanding of their views on LED road light
implementation and the impact it will have on their organisations.
5
Participants in an Accelerated Uptake of LED Lighting
Introduction This section of the report provides a high-level overview of the potential participants that may become
involved in any initiative to accelerate the uptake of LED road lighting. It focuses on:
Purchasers – the Road Controlling Authorities (RCAs)
The NZ Transport Agency (the Transport Agency) – both as the RCA for state highways and as co-
funder of road lighting operations with the local road RCAs
The energy industry – the gentailers and the distribution companies
LED technology suppliers
Other government agencies – EECA, the Electricity Authority, and the Commerce Commission
Alternative finance providers – such as independent investors or banks.
The response of these potential participants will have some bearing on the viability of potential solutions,
and would form part of the basis for the Commercial and Management cases of an indicative business case.
Road Controlling Authorities Profile In New Zealand there are currently 76 RCAs responsible for managing roading assets. The RCAs
predominantly consist of the territorial local authorities (TLAs), the Transport Agency, as well as other
entities including Auckland Transport and the Department of Conservation.
Role RCAs make the capital and operating expenditure decisions relating to road assets – including the
upgrading of road lighting systems. Their role is to manage road transport related assets and issues –
including maintenance, construction and upgrade activities. The Transport Agency manages the state
highway network. TLAs plus a few other entities such as Auckland Transport and the Department of
Conservation manage New Zealand’s local roads. Approximately 94% of all road lights are on local roads.
Almost all local road lighting infrastructure is on urban streets.
Much of the Transport Agency’s state highway road lighting infrastructure, on the other hand, is found on
high traffic volume, high speed roads including motorways. Therefore the Transport Agency’s road lighting
infrastructure is often constructed and operated to a different standard, designed for high traffic volumes
and speeds, compared to most local roads, many of which are low traffic volume and low speed streets.

6
Current Position on LED Road Lighting
The Transport Agency
The Transport Agency sees significant benefit in the implementation of LED road lighting and provides
guidance and assistance around road lighting for local RCAs. The M30 specification document developed
by the Transport Agency, in partnership with local RCAs, is very supportive of LED road lighting for both
local road and state highway lighting.
New roads are generally being lit with LED and the renewal programme is being reviewed with a view to
developing an LED conversion programme.
Local road RCAs
Many local road RCAs have undertaken feasibility studies around the case for LED road lighting. Local
RCAs such as Auckland Transport, Christchurch and Hamilton Cities have invested significant effort in
preparing for a significant road lighting upgrade and consulted with experts. From the studies mentioned
above we can see that the motivations for LED road lighting revolve around the following benefits:
Energy savings;
Maintenance savings; and
Increased safety.
To date there have been 21 trials undertaken by these RCAs, but so far we are yet to see a substantive
investment in an LED road lighting installation in New Zealand. This is due to a number of common
concerns that RCAs have which currently appear to outweigh the benefits. These concerns are
Capital constraints on new investment in lighting;
Variable skills, knowledge, and access to resources and data to inform councils about the potential
benefits of converting to LEDs and how this can be realised;
A lack of coordination and leadership across councils’ upgrade initiatives and business cases, which
results in a duplication of effort and higher procurement costs; and
A perceived lack of transparency around whether/how electricity lines companies pass on savings
to councils.
The NZ Transport Agency
Profile and Role The Transport Agency takes a leadership role for roading issues in New Zealand. The activities of the
various local road RCAs are largely fragmented from one another, but the Transport Agency is in a position
to provide a common view and guidance on issues across all RCAs. The Transport Agency funds
approximately 45%-50% of all local road lighting costs in New Zealand as co-funder with the local RCAs
and funds the full cost of state highway road lighting.
The Transport Agency has strict investment criteria that must be met before it will co-invest with local
RCAs or invest in state highways. Where the Transport Agency is an investor all outputs must be procured
in accordance with procurement procedures approved by the Transport Agency and designed to obtain best
value for money. The Transport Agency therefore plays a significant role in both the process that leads to a
decision by an RCA to invest and in the procurement process required to deliver outputs. It publishes its
investment criteria in the Planning and Investment Knowledge Base and its procurement policy
requirements in the Procurement Manual.
The specification for LED road lighting (M30 - Specification for Road Lighting) referred to above will serve
as the prime source of technical guidance and reference for all RCAs for road lighting.
7
Current Position on LED Road Lighting The Transport Agency sees significant benefit in the implementation of LED road lighting and will work
closely with those RCAs that are looking to implement. Its empowering legislation requires the Transport
Agency to assist and advise RCAs. It is developing a template to assist RCAs to meet Transport Agency
investment criteria, as they prepare their business case perform an economic evaluation of options. The
Transport Agency business case template is aligned with The Treasury’s Better Business Case process.
The Transport Agency sees LEDs as an opportunity to reduce the whole of life cost of road lighting. In many
cases long term costs will be reduced by converting existing road lighting installations to LED before they
reach the end of their useful lives. While it perceives that there are other benefits to road users, such as
increasing safety, they do not see this as the primary reason for RCAs to be considering upgrading to LED
technology.
Energy Industry
Profile In New Zealand management of the supply chain can be separated into two general areas - electricity
generation and retail, and transmission and distribution. Electricity generation is supplied from 5 major
generators (Meridian, Contact Energy, Mighty River Power, Genesis Energy and Trustpower) and 8 smaller
grid-connected generators. There are 24 retail brands across the country, most of which only operate in
specific regions. The national grid for electricity distribution is owned and operated by Transpower, and
local distribution is provided through 29 distribution companies (see Appendix A).
Distribution Companies
There is some merit in examining the profile of the distributors because they use a range of ownership and
governance models. This can have implications for the uptake of LED lighting. The ownership structures
are of particular importance because it can affect the degree to which the interests of a business, its
shareholders, and its customers are aligned.
Table 1 shows distributors’ ownership models. Community electricity trusts are majority owners in most
electricity distributors, though exact shareholding structures may vary. As shareholders, the trusts have
rights to appoint directors to the boards of the companies they own. These trusts can be subject to different
levels of regulation and will potentially have different responses to an LED uptake. This is discussed later
in this report.
Table 1: Distribution company ownership structures
Fully owned by consumer trusts
Buller Electricity, Centralines, Counties Power, Eastland Networks, Electra, MainPower, Marlborough Lines, Network Tasman, Network Waitaki, Northpower, Scanpower, The Lines Company, The Power Company, Top Energy, Waipa Networks, Unison Networks, WEL Networks, Westpower
Fully owned by a co-operative
Electricity Ashburton,
Mixed ownership
Alpine Energy, Horizon Energy, Vector
Fully local government-owned
Aurora Energy, Electricity Invercargill, Orion
Other (including fully privately owned)
Nelson Electricity, OtagoNet Joint Venture, Powerco, Wellington Electricity Lines
8
Roles
Retailers
The majority of the retail electricity market is held by the large generator/retailers (gentailers). The primary involvement of these gentailers is on the retail side, where RCAs usually enter into contractual arrangements for the supply of electricity at a set price/kWh.
Distributors
There are 29 network distribution companies who generally own the cables and electrical hardware up to the light pole – although this can vary in some instances. The primary role of distributors is to maintain their network and connect the road lights to the national grid. For some RCAs, distributors play a greater role in the management of the road lighting.
Current Position on LED Road Lighting We were unable to find any public comments by the retailers or the distributors reflecting their views on LED road lighting. However, because LED lighting is more energy efficient a greater uptake of LED lighting is likely to have adverse effects on revenues, based on existing pricing structures. This may be offset because the streetlights are usually operating in off-peak periods where the retailers are not as price sensitive.
There is evidence to suggest that some of the distribution companies are considering the impacts of LED road lighting on their revenues and are looking to change their pricing methodologies to reflect it. In addition, some distributors appear to be viewing LED road lighting as a potential opportunity to expand their services.
LED Technology Suppliers Profile There are over 30 potential suppliers of luminaires who have approached RCAs with their products, however at present there are three main suppliers into the New Zealand market – AEC, CREE and more recently Betacom. This appears to be largely a result of Auckland Transport (AT) and Christchurch City Council (CCC) developing a list of approved suppliers who are required to meet certain specifications before they will be considered. This list is now being used as a standard for many RCAs and is driving other suppliers to adapt their products to meet these specifications.
Role The suppliers currently fill two roles in the market. While they are supplying and improving the LED technology, they are also providing assistance to RCAs to improve their understanding of the market and potential opportunities. We have noted a number of instances where Phillips, one of the largest producers of LED lighting in the world, have had significant input into reports prepared by, or on behalf of, RCAs.
Current Position on LED Road Lighting The suppliers have a vested interest in the level of implementation of LED technology in New Zealand, and appear to be taking note of the feedback from the RCAs and the Transport Agency. The AT and CCC approved supplier list is influencing the quality and price of the LED products being offered. The prices seem to be decreasing while the quality of product is improving to meet New Zealand specifications.
Government Agencies Profile and Role There are three government agencies that can be involved in the uptake of LED road lighting – EECA, the Commerce Commission, and the Electricity Authority.2
2 Note: MBIE is responsible for setting the policy direction for each of these entities

9
EECA
EECA is the government agency that works to improve energy efficiency across New Zealand. EECA can play a significant role in promoting LED road lights as they are seen to be significantly more energy efficient than the existing technology. EECA’s sees its role as being one which can promote the uptake of LED road lighting, and facilitating potential implementation options across the RCAs
Commerce Commission
The Commerce Commission acts as the economic regulator for the monopoly sectors of the electricity industry, and is tasked with ensuring that the prices charged by distribution companies are fair and reasonable. The second part of this report provides further detail as to how the Commerce Commission performs its regulatory role. The Commerce Commission must promote incentives and avoid imposing disincentives for distributors seeking to invest in energy efficiency initiatives (s 54Q, Part 4 Commerce Act).
Electricity Authority
The Electricity Authority (EA) promotes competition in New Zealand’s electricity industry, and aims to drive efficient operating activities. The EA is the market regulator for the industry and as such, it can have a significant influence on industry behaviours.
Current Position on LED Road Lighting
EECA
EECA sees significant value in the implementation of LED road lighting, both in an economic sense and in resulting in better outcomes for New Zealanders. In a recent briefing to Ministers they confirmed that there is a case for intervention, which has led to this review and the preparation of an indicative business case. They believe that the initial focus for LED technology should be on residential roads where the technology is more mature, and that greater savings may be realised for highways if a mass conversion is delayed for a couple of years.
Commerce Commission and the Electricity Authority
The Commerce Commission and Electricity Authority have no position on LED road lighting, as it falls outside the remit of their core business. However, they may become involved in the event that the response from the electricity industry is inappropriate and fails to align with their regulations and/or principles. As noted above there is an obligation on the Commerce Commission to ensure its regulation of distributors do not disincentivise energy efficiency initiatives.
In this respect, the Commission’s recent draft price control decisions for distributors (to apply from 1 April 2015) include a new energy efficiency incentive allowance which enables distributors to seek additional revenues (above their price caps) to compensate for revenues forgone as a result of energy efficiency initiatives..
Investors / Financing Profile and Role Capital constraints have been recognised as a large impediment in the path of LED road lighting implementation for RCAs. To make this accessible to RCAs there are a range of financing solutions that can allow RCAs to implement LED technology and spread the costs over a longer timeframe. These can come from a range of sources such as:
Banks – who provide financing, or finance lease arrangements
Maintenance contractors – who procure and supply the assets to RCAs as part of their service
contract
Lines Companies - who may procure and supply the assets to RCAs as part of their electricity
supply contract
Public-Private Partnerships (PPPs) – where capital costs are paid by the private sector, with
payment due only when an asset is operating to the requisite standard with the public ownership
rights being preserved.

10
Current Position on LED Road Lighting Both banks and lighting suppliers have expressed an interest into entering into a financing arrangement where they provide the upfront capital to fund individual LED lighting projects for RCAs. Some RCAs may be restricted by their borrowing limits which could prevent these from occurring.
There has been an approach from one distribution company to a RCA to enter into an arrangement where they supply end-to-end road lighting services, which suggests that such an option appears to be a viable option for the distribution companies. We have not seen any information relating to PPPs and cannot assess the viability of this alternative.
11
Impacts of a Move to LED Road Lighting
Introduction The provision of road lighting is the responsibility of local governments and the Transport Agency, but there can be significant variability in the operating and charging regimes across the country. This section examines the current road lighting operating environment across RCAs and assesses the potential impact the uptake of LED road lighting will have on energy consumption and charging, with a particular focus on the impacts for distribution companies. Based on this review, we have provided an assessment of the potential response from market participants to an LED uptake and the impact this will have on benefits.
Profile Road lighting networks can vary significantly for RCAs across New Zealand, and there is a wide range of network sizes, road light types, and the costs structures that the RCAs incur for both energy and distribution. The following section provides a high level profile of the RCAs road lighting infrastructure, and costs incurred in delivering it.
Road Lighting in New Zealand
Components of Road Lighting
Road lighting generally is comprised of five components:
1. Control systems for the supply of electricity to the road lights;
2. Cables that provide electricity to the road lights;
3. Poles that the lights are attached to;
4. Luminaries that house the electrical and electronic systems and supports the lamp; and
5. Lamps that create the light.
In general the cables are owned by local lines companies, and the dedicated road lighting poles, luminaires and lamps are usually owned by the RCAs. There are some exceptions to this where distribution companies may own some of the road lighting assets. For the purpose of this report, our analysis has focused largely on the road light units (poles/fixtures/lamps) rather than the cabling and control systems.
Electricity Supply Chain
The cost to a RCA for powering road lights represents cost elements from both Gentailers and distribution companies, including an expense for the volume of electricity used, as well as for the transmission and distribution of that electricity. The report focuses primarily on issues relating to the retail pricing (energy costs) and distribution costs (line costs).
Quantifying Road Lights
Number of Road Lights in New Zealand
The most recent estimates show that New Zealand has approximately 350,000 to 370,000 road lights. The respondents to the recent SOLGM survey accounted for just under half of these (150,541 lights).
The spread of road lighting assets across RCAs can vary significantly. For example, Auckland Transport is the RCA with the greatest level of ownership with a network of 105,000 lights, while the smallest respondent in the SOLGM survey held only 479. The size of the network can influence the manner and likelihood of a RCA adopting LED road lighting by creating different risk profiles and cost expectations.

12
Lighting Types
The type of road lighting varies across New Zealand, and can even vary significantly within an individual RCA. This is a reflection of legacy issues arising as a result of the budgets and technology available to RCAs as they have undertaken maintenance and renewal programmes over time.
The majority of road lights in New Zealand are HPS lamps but there are many other alternatives in use including Metal Halide, Fluorescent, Mercury Vapour and LED. Figure 1 outlines the proportion of road lights held by RCA respondents by HPS, LED and Other.
Figure 1: Percentage of road lighting assets by type
Source: 2014 SOLGM Survey
HPS lamps constitute more than 75% of the road light assets for almost 80% of respondents. In most instances LEDs make up little or no part of a RCA’s lighting assets.
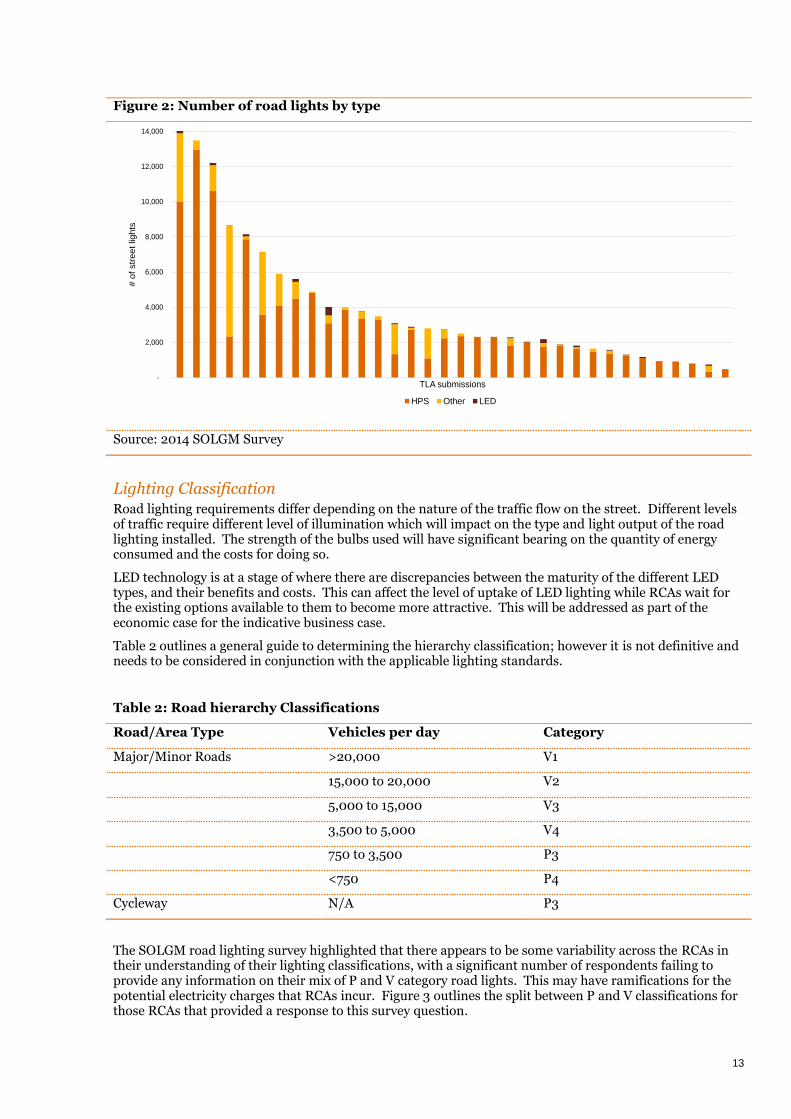
Figure 2 examines the overall number of road lights for each RCA respondent. It highlights that the level of LED uptake is currently extremely low and there are very few examples of significant investment so far in LED technology. While some of the larger RCAs have signalled an intention to move towards LED technology, this has not yet transpired into actual installation. In general, the larger RCAs appear to be more likely to have a mixture of lighting types; however there does not appear to be any correlation between the size of the RCA and the level of adoption of LED technology.
0%
10%
20%
30%
40%
50%
60%
70%
80%
90%
100%
% o
f o
wn
ed
lig
hts
TLA submissions
HPS Other LED
13
Figure 2: Number of road lights by type
Source: 2014 SOLGM Survey
Lighting Classification
Road lighting requirements differ depending on the nature of the traffic flow on the street. Different levels of traffic require different level of illumination which will impact on the type and light output of the road lighting installed. The strength of the bulbs used will have significant bearing on the quantity of energy consumed and the costs for doing so.
LED technology is at a stage of where there are discrepancies between the maturity of the different LED types, and their benefits and costs. This can affect the level of uptake of LED lighting while RCAs wait for the existing options available to them to become more attractive. This will be addressed as part of the economic case for the indicative business case.
Table 2 outlines a general guide to determining the hierarchy classification; however it is not definitive and needs to be considered in conjunction with the applicable lighting standards.
Table 2: Road hierarchy Classifications
Road/Area Type Vehicles per day Category
Major/Minor Roads >20,000 V1
15,000 to 20,000 V2
5,000 to 15,000 V3
3,500 to 5,000 V4
750 to 3,500 P3
<750 P4
Cycleway N/A P3
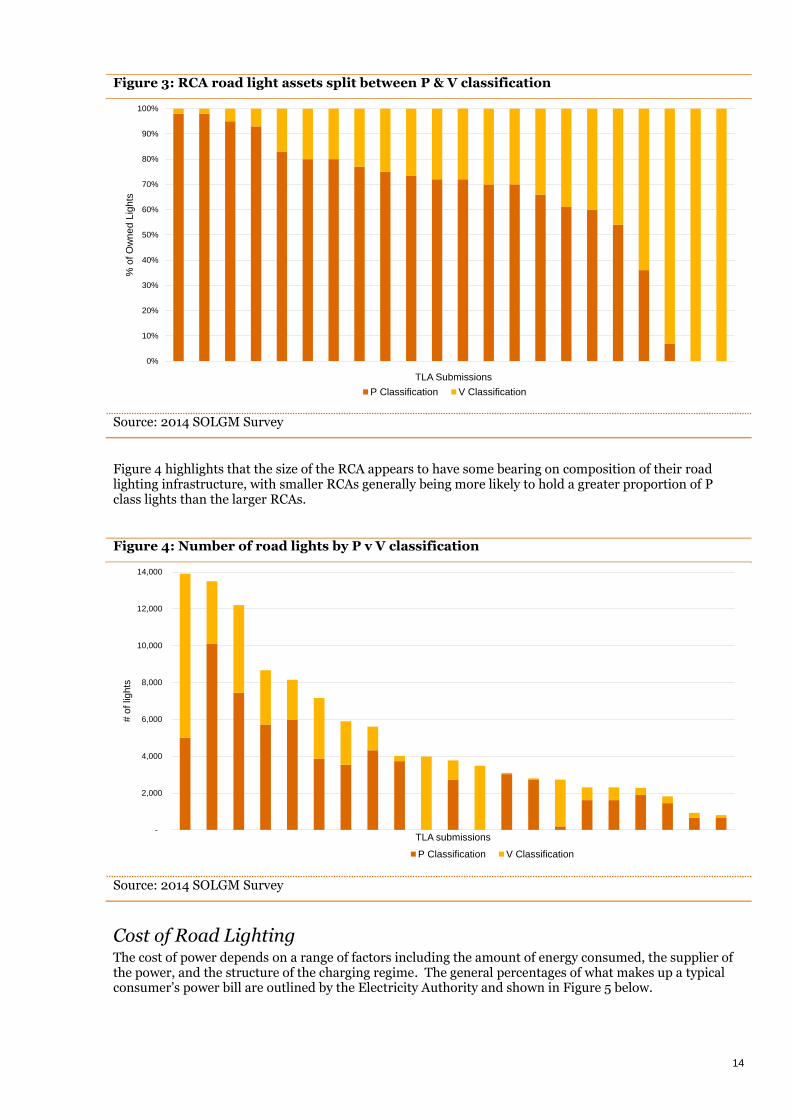
The SOLGM road lighting survey highlighted that there appears to be some variability across the RCAs in their understanding of their lighting classifications, with a significant number of respondents failing to provide any information on their mix of P and V category road lights. This may have ramifications for the potential electricity charges that RCAs incur. Figure 3 outlines the split between P and V classifications for those RCAs that provided a response to this survey question.
-
2,000
4,000
6,000
8,000
10,000
12,000
14,000#
of
str
ee
t lig
hts
TLA submissions
HPS Other LED
14
Figure 3: RCA road light assets split between P & V classification
Source: 2014 SOLGM Survey
Figure 4 highlights that the size of the RCA appears to have some bearing on composition of their road lighting infrastructure, with smaller RCAs generally being more likely to hold a greater proportion of P class lights than the larger RCAs.
Figure 4: Number of road lights by P v V classification
Source: 2014 SOLGM Survey
Cost of Road Lighting The cost of power depends on a range of factors including the amount of energy consumed, the supplier of the power, and the structure of the charging regime. The general percentages of what makes up a typical consumer’s power bill are outlined by the Electricity Authority and shown in Figure 5 below.
0%
10%
20%
30%
40%
50%
60%
70%
80%
90%
100%
% o
f O
wn
ed
Lig
hts
TLA Submissions
P Classification V Classification
-
2,000
4,000
6,000
8,000
10,000
12,000
14,000
# o
f lig
hts
TLA submissions
P Classification V Classification

15
Figure 5: Breakdown of a typical consumers energy bill (excluding GST)
Source: Electricity Authority
The costs for road lighting can differ from the standard power bill that consumers face, because RCAs use power at night time with different demands, and have different arrangements with the suppliers than a ‘typical’ customer. Understanding the profile of electricity costs assists in understanding what the potential impacts LED road lights will have on individual RCAs.
Split between Energy and Lines Charges
The Ministry for Building, Innovation and Enterprise (MBIE) release a Quarterly Survey of Domestic Energy Prices outlining the split of the domestic costs for electricity between the lines costs (transmission and distribution) and the energy costs (including other charges such as metering) by region. While the average split across New Zealand between energy costs and lines costs has been relatively consistent over the past 10 years at around a 60:40 split, as shown in Figure 6, there can be some variability by region ranging from a 50:50 split (Balclutha, Kerikeri) to a 70:30 split (Nelson, Cambridge).
Figure 6: Average split between lines and energy costs for New Zealand consumers
Source: MBIE
Ge
ne
rati
on
Tra
ns
mis
sio
n
Dis
trib
uti
on
Re
tail
Me
teri
ng
Oth
er
0% 10% 20% 30% 40% 50% 60% 70% 80% 90% 100%
Percentage of average bill
0%
10%
20%
30%
40%
50%
60%
70%
Fe
b-0
4
Ma
y-0
4
Au
g-0
4
No
v-0
4
Fe
b-0
5
Ma
y-0
5
Au
g-0
5
No
v-0
5
Feb
-06
Ma
y-0
6
Au
g-0
6
No
v-0
6
Fe
b-0
7
Ma
y-0
7
Au
g-0
7
No
v-0
7
Fe
b-0
8
Ma
y-0
8
Au
g-0
8
No
v-0
8
Fe
b-0
9
Ma
y-0
9
Au
g-0
9
No
v-0
9
Fe
b-1
0
Ma
y-1
0
Au
g-1
0
No
v-1
0
Fe
b-1
1
Ma
y-1
1
Au
g-1
1
No
v-1
1
Fe
b-1
2
Ma
y-1
2
Au
g-1
2
No
v-1
2
Fe
b-1
3
Ma
y-1
3
Aug-1
3
No
v-1
3
Fe
b-1
4
Ma
y-1
4
Energy Costs Distribution Transmission

16
For the RCAs there is a much wider range of splits between the energy and lines costs, as can be seen in Figure 7. Around half of the RCAs who provided a response on the breakdown of their road lighting costs showed lines charges making up 50% of more of their total cost. This is a much different profile to the average domestic split where lines charges almost never constituted more than half of the total energy costs for any region in the past 10 years. There were a number of responses that had 100% of their costs being related to energy only, and while we have included these in the results we believe that this may be due to either the RCAs having insufficient information to adequately split their costs or they are one a fully variable consumption based charge.
Figure 7: Average split between lines and energy costs for road lights
Source: 2014 SOLGM Survey
Figure 7 can be used to identify potential areas of savings resulting from lower energy use. Assuming a conservative efficiency saving of 50% from moving to LED technology, the energy costs would be 50% smaller but the savings on the lines costs will depend on the split between the fixed vs. variable charging methodology. Over time we would expect lines costs to be of a greater proportion of the total costs for road lighting.
Fixed vs. Variable Lines Charges
The split between energy and lines costs provides an understanding of the quantum of the lines costs, but to understand the potential savings from LED road lighting there is a need to understand how the RCA’s lines costs are apportioned to them. Transmission costs relate to Transpower connection charges for using the national grid, which are imposed on a distribution company which will then pass through the costs to the consumer via their pricing methodologies. Distribution costs reflect charges for using the distribution company’s assets, and for non-consumer owned distributors, are subject to price cap regulation (see below).
At present, the distribution companies may charge a RCA a fixed charge, a variable charge, or a mixture between the two. Fixed costs represent an expense that a RCA will incur irrespective of how they decide to manage their lighting network and will not change if lighting becomes more efficient. It is effectively a charge for having access to the distribution network. Variable costs are costs that will change depending on how a specific cost driver changes. In the case of electricity it is usually determined by the estimated quantity/volume of electricity used, but it may also reflect the time of day or season.
The split between fixed and variable charging can have ramifications for the realisable benefits that may be obtained from installing LED lighting. If the RCA is only being charged at a fixed rate, then irrespective of the type of lighting that they elect to use they will still incur the same lines costs. However, a variable rate will allow a RCA to make some efficiency savings on its line costs where the variable charge is linked to the volumes of energy used.
0%
10%
20%
30%
40%
50%
60%
70%
80%
90%
100%
Sp
lit b
etw
ee
n e
ne
rgy a
nd
lin
es c
osts
TLA submissions
Energy costs Lines costs
17
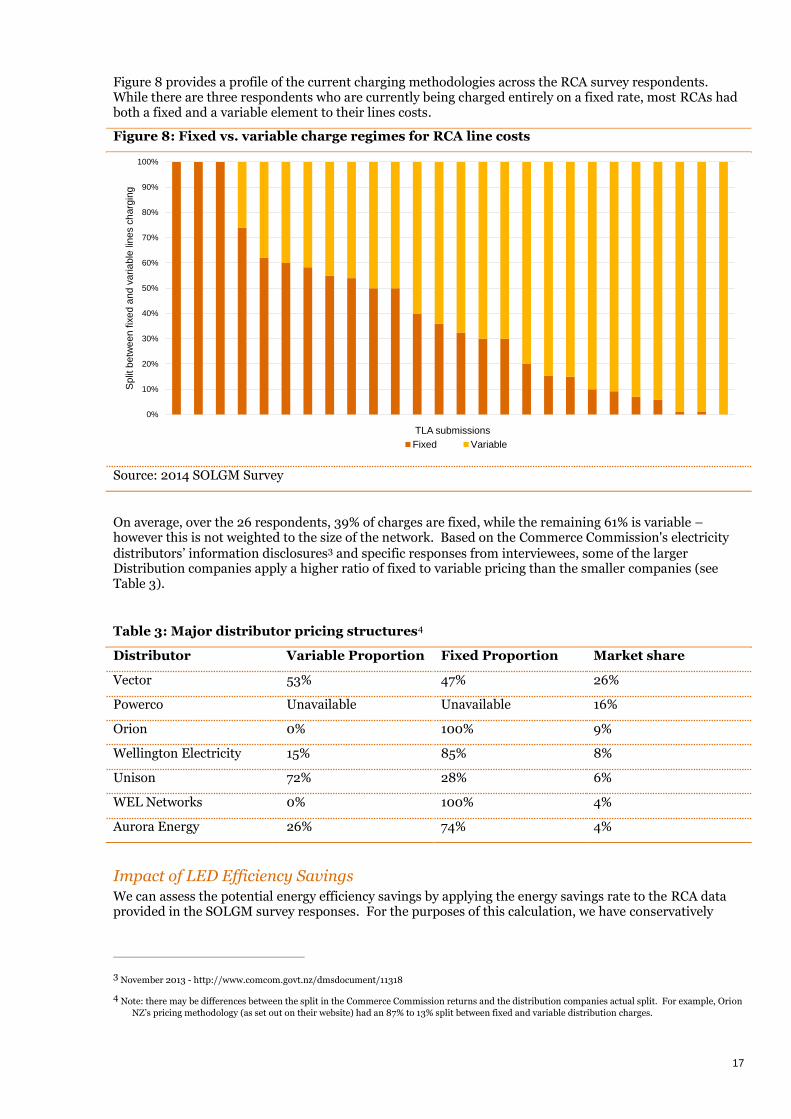
Figure 8 provides a profile of the current charging methodologies across the RCA survey respondents. While there are three respondents who are currently being charged entirely on a fixed rate, most RCAs had both a fixed and a variable element to their lines costs.
Figure 8: Fixed vs. variable charge regimes for RCA line costs
Source: 2014 SOLGM Survey
On average, over the 26 respondents, 39% of charges are fixed, while the remaining 61% is variable – however this is not weighted to the size of the network. Based on the Commerce Commission's electricity distributors’ information disclosures3 and specific responses from interviewees, some of the larger Distribution companies apply a higher ratio of fixed to variable pricing than the smaller companies (see Table 3).
Table 3: Major distributor pricing structures4
Distributor Variable Proportion Fixed Proportion Market share
Vector 53% 47% 26%
Powerco Unavailable Unavailable 16%
Orion 0% 100% 9%
Wellington Electricity 15% 85% 8%
Unison 72% 28% 6%
WEL Networks 0% 100% 4%
Aurora Energy 26% 74% 4%
Impact of LED Efficiency Savings
We can assess the potential energy efficiency savings by applying the energy savings rate to the RCA data provided in the SOLGM survey responses. For the purposes of this calculation, we have conservatively
3 November 2013 - http://www.comcom.govt.nz/dmsdocument/11318
4 Note: there may be differences between the split in the Commerce Commission returns and the distribution companies actual split. For example, Orion
NZ’s pricing methodology (as set out on their website) had an 87% to 13% split between fixed and variable distribution charges.
0%
10%
20%
30%
40%
50%
60%
70%
80%
90%
100%
Sp
lit b
etw
ee
n f
ixe
d a
nd
va
ria
ble
lin
es c
ha
rgin
g
TLA submissions
Fixed Variable
18
assumed energy savings of 50%, which tends to be at the lower end of most estimations of the potential gains.
The data shown Figure 7 has an average split between energy costs and lines costs of 55% and 45% respectively (excluding those RCAs with 100% of costs relating to energy). With the lines costs being 39% fixed and 61% variable the approximate savings would be in the region of 41%. However, this estimate has not been weighted by the size of the respective networks and could differ with a more detailed set of information.
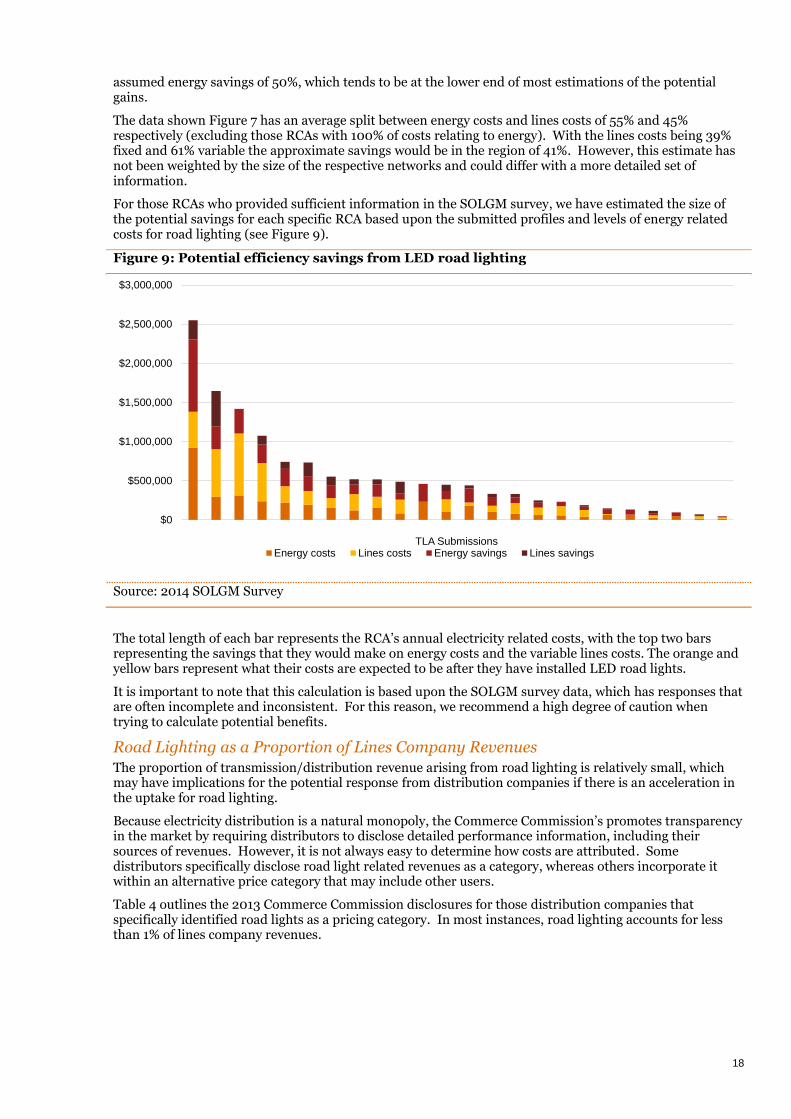
For those RCAs who provided sufficient information in the SOLGM survey, we have estimated the size of the potential savings for each specific RCA based upon the submitted profiles and levels of energy related costs for road lighting (see Figure 9).
Figure 9: Potential efficiency savings from LED road lighting
Source: 2014 SOLGM Survey
The total length of each bar represents the RCA’s annual electricity related costs, with the top two bars representing the savings that they would make on energy costs and the variable lines costs. The orange and yellow bars represent what their costs are expected to be after they have installed LED road lights.
It is important to note that this calculation is based upon the SOLGM survey data, which has responses that are often incomplete and inconsistent. For this reason, we recommend a high degree of caution when trying to calculate potential benefits.
Road Lighting as a Proportion of Lines Company Revenues
The proportion of transmission/distribution revenue arising from road lighting is relatively small, which may have implications for the potential response from distribution companies if there is an acceleration in the uptake for road lighting.
Because electricity distribution is a natural monopoly, the Commerce Commission’s promotes transparency in the market by requiring distributors to disclose detailed performance information, including their sources of revenues. However, it is not always easy to determine how costs are attributed. Some distributors specifically disclose road light related revenues as a category, whereas others incorporate it within an alternative price category that may include other users.
Table 4 outlines the 2013 Commerce Commission disclosures for those distribution companies that specifically identified road lights as a pricing category. In most instances, road lighting accounts for less than 1% of lines company revenues.
$0
$500,000
$1,000,000
$1,500,000
$2,000,000
$2,500,000
$3,000,000
TLA SubmissionsEnergy costs Lines costs Energy savings Lines savings

19
Table 4: Road lighting revenue as a proportion of Lines Company revenues ($000’s)
Company Road light related revenue
Total company revenue
% of total revenue
Aurora Energy Limited $596 $84,229 0.7%
Counties Power Limited $239 $39,923 0.6%
Electra Limited $376 $33,923 1.1%
EA Networks $246 $34,633 0.7%
Horizon Energy Distribution Limited
$259 $30,126 0.9%
MainPower NZ Ltd $307 $45,553 0.7%
Marlborough Lines Ltd $146 $30,167 0.5%
Nelson Electricity Limited $95 $9,517 1.0%
Network Tasman Ltd $259 $37,380 0.7%
Orion NZ Ltd $1,743 $204,641 0.9%
Scanpower Limited $17 $7,522 0.2%
The Lines Company Limited $154 $34,958 0.4%
Waipa Networks Limited $132 $21,626 0.6%
WEL Networks Ltd $1,062 $90,622 1.2%
Westpower Limited $149 $19,448 0.8%
Source: Commerce Commission’s electricity distributors’ information disclosures
Pricing Regimes As noted earlier, the cost of electricity is split between energy and distribution costs, and may be charged on a fixed or variable basis. Within these broad parameters, there are a number of influences on pricing that will have an impact on the level of cost efficiencies obtained from installing LED road lighting.
Electricity Pricing Electricity is generally charged on a volume basis. While occasionally there may be a fixed element included in the overall cost, it is likely to be small. Road lighting is unusual compared to most energy users because the volume is rarely measured through a meter. Instead a manual calculation is typically made to determine the total expected quantity of electricity used. This calculation is relatively simple, and measured using a formula such as:
# of Lights * Load on each light (kW) * Total hours in operation * Price/kWh = Energy Cost.
This approach requires a RCA to maintain a significant level of information regarding their network assets. With the older lighting technology the approach can be very manual, normally managed through spreadsheets, and can be highly susceptible to error which could result inaccurate charging. Depending on the level of technology implemented, LED lighting has the potential to automate this measurement and the greater accuracy could potentially provide additional benefits above the energy efficiency gains.
Lines Pricing The nature of the electricity distribution industry is that Transpower and the distributors are natural monopolies. This means that it is more costly for two suppliers to provide the services than it is for one

20
supplier (i.e. it is cheaper to build and maintain a single network than two networks). As a result the distribution companies face no competition and are therefore subject to economic regulation to promote efficient outcomes in the interests of customers. There are primarily two Government entities that have an influence on the activities of the distributors – the Commerce Commission and the Electricity Authority.
Commerce Commission
The Commerce Commission has two types of regulation that it uses to promote efficient pricing outcomes - information disclosure regulation and price-quality path regulation.
Information disclosure regulation requires all distributors to publish specific information about their businesses in order to create greater transparency. This enables stakeholders to understand if the regulation is working and incentivises distributors to improve their performance. Under this regulation, distributors must publish information such as their prices, financial information, and plans for managing and investing in assets.
Price-quality path regulation applies to a majority of the distributors (it excludes distributors that are community-owned and meet certain criteria), and puts a cap on the maximum average prices that distributors can charge and requires them to deliver services that meet a minimum level of reliability. This regulation enables the Commerce Commission to cap the overall level of revenue that distributors can earn, but does not control how distributors decide to structure their prices across individual or groups of customers.
As noted previously the Commission has a statutory obligation to incentivise, and importantly not create disincentives to initiatives by distributors to promote energy efficiency.
Electricity Authority
The Electricity Authority does not regulate the distributors; however it does have some influence on the pricing structures implemented by distributors. It has developed a set of voluntary pricing principles, designed to encourage the distributors to set their prices in a manner that is economically efficient. These principles influence how prices are set for different customer groups, with the aim to ensure that the costs of distribution (of which the costs of assets are a significant element) are borne by the customers who use them.
Impacts of an Uptake of LED Road Lighting Within the current environment we believe that the implementation of LED road lighting is likely to result
in energy efficiency gains, which should result in lower energy costs as electricity use declines. In addition,
the advanced technology may enable other savings through better management of the lighting assets.
For lines charging we believe that there are likely to be 3 potential responses by distribution companies in
response to a significant uptake in LED road lighting:
1. There will be no changes to the current pricing structures;
2. Any losses arising from more efficient road lights are passed on to the distributors wider customer
base;
3. Pricing structures move closer towards becoming fully fixed in order to continue to meet the costs
of delivery.
We believe that the last option is the most likely response, and recent moves by some companies (e.g.
Vector and WEL Networks) towards a more fixed pricing regime reaffirm this. We note that there are a
number of reasons why distributors are considering ways to increase their proportion of total lines
revenues from fixed charges. The advent of small scale distributed generation (DG) has the potential to
disrupt traditional revenue flows from variable revenues, passing costs from those with DG to those
without. Current regulations including the Low User Fixed Charge Regulations are a barrier to change, and
are under review.

21
No Response Under this scenario, RCAs would receive the benefit of lower energy and lines costs.
Road lighting revenue is a minor proportion of a distributor’s total revenue. As the road lighting becomes more energy efficient the variable element of the lines charging is likely to have very little impact on overall distributor revenue which may result in no response from distribution companies. There are also some distributors who are almost fully owned by their TLAs, which may lead to them electing to not make changes to their pricing methodologies.
There is the potential that there is no response initially from some of the distributors potentially resulting in some short term efficiency gains, but in the medium to long term there are likely to be changes as distribution companies adjust.
Losses are Passed on to Other Customers Under this scenario, RCAs would receive the benefit of lower energy and lines costs.
The expected revenue losses for distributors from LED efficiencies may be recovered through other
customers. If the losses are small then distributors may look at recouping their revenues over their wider
customer base. This will depend on two key factors:
1. How elastic the customers are to price changes – i.e. who are the easiest customers to pass the
additional cost on to without adverse reaction
2. Whether the distributor applies pricing methodologies that are economically efficient.
A recent review of pricing practices for the Electricity Authority highlighted that the current pricing
arrangements are largely in place for historical reasons. Looking to the future, it is becoming more likely
that companies will begin to align their pricing regimes to recover the costs from those that incur them. As
a result, we believe that while there is a chance that this response may have happened previously, it has a
lower probability of happening now and in the future.
Pricing Structures Move Towards Becoming Fully Fixed Under this scenario, RCAs would receive the benefit of lower energy costs, but may only receive benefits of lower lines costs in the short term.
The most likely response from distribution companies is to move towards a more fully fixed pricing
methodology. This fixed price element may not necessary be 100% fixed, as there are some pass through
costs that may need to be apportioned on a more variable basis, but we would expect a significant majority
of the charge to be imposed on a fixed cost basis. This approach is not only consistent with the current
regulatory regime, but is promoted as being best practice based upon the Electricity Authority’s pricing
principles and can be seen to be occurring in the major distribution companies already.
The timing of any response by distributors is uncertain. With many of the current pricing structures being
in place for historical reasons it suggests that some distribution companies are slower to adapt than others.
Despite this, in the medium to long term we believe that the move towards more fixed charges is the most
likely response from distributors, especially if the Electricity Authority decides to engage and communicate
their principles more widely. As a result, the potential efficiency savings to line costs are likely to be
minimal.
22
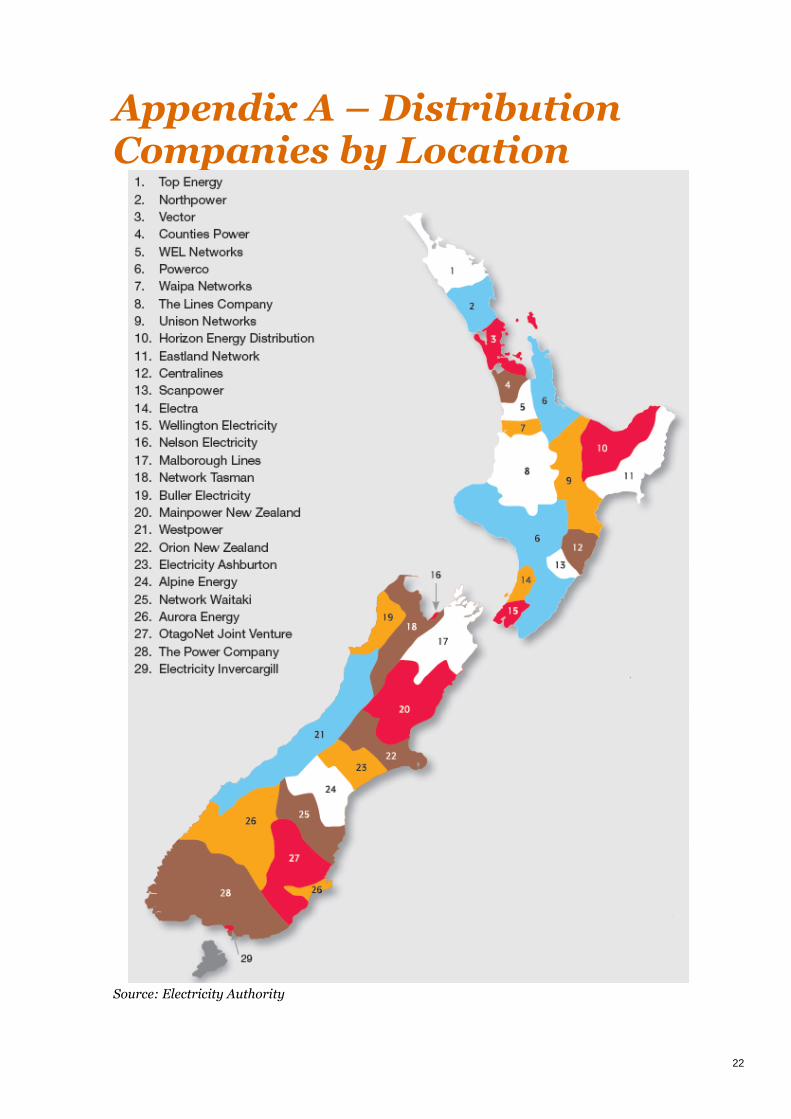
Appendix A – Distribution Companies by Location
Source: Electricity Authority
23
Restrictions This letter has been prepared solely for the purposes stated herein and should not be relied upon for any other purpose. We accept no liability to any party should it be used for any purpose other than that for which it was prepared. To the fullest extent permitted by law, PwC accepts no duty of care to any third party in connection with the provision of this Report and/or any related information or explanation (together, the “Information”). Accordingly, regardless of the form of action, whether in contract, tort (including without limitation, negligence) or otherwise, and to the extent permitted by applicable law, PwC accepts no liability of any kind to any third party and disclaims all responsibility for the consequences of any third party acting or refraining to act in reliance on the Information. We have not independently verified the accuracy of information provided to us, and have not conducted any form of audit in respect of the organisation for which work is completed. Accordingly, we express no opinion on the reliability, accuracy, or completeness of the information provided to us and upon which we have relied. The statements and opinions expressed herein have been made in good faith, and on the basis that all information relied upon is true and accurate in all material respects, and not misleading by reason of omission or otherwise. The statements and opinions expressed in this report are based on information available as at the date of the report. We reserve the right, but will be under no obligation, to review or amend our Report, if any additional information, which was in existence on the date of this report, was not brought to our attention, or subsequently comes to light. This report is issued pursuant to the terms and conditions set out in our contract dated 25 August 2014.