Embed Size (px)
Citation preview

States of Matter & Gas Laws
• Review of the Properties of Solids, Liquids, and Gases
• Kinetic Molecular Theory of Gases• Boyle’s Law, Charles’s Law, Gay-Lussac’s L
aw and the Combined Gas Law
• Dalton’s Law of Partial Pressure, Avogadro’s Law and the Ideal Gas Law
• Phase Changes and Heating and Cooling Curves
• Phase Diagrams

Properties of Solids
1. The particles in a solid are packed closely together.
2. The particles in a solid are held together by strong intermolecular forces of attraction.
3. The particles in a solid vibrate slowly in place.

Properties of Solids
4. Solids have a definite shape and a definite volume.
5. Solids are incompressible.
6. Solids are relatively dense.
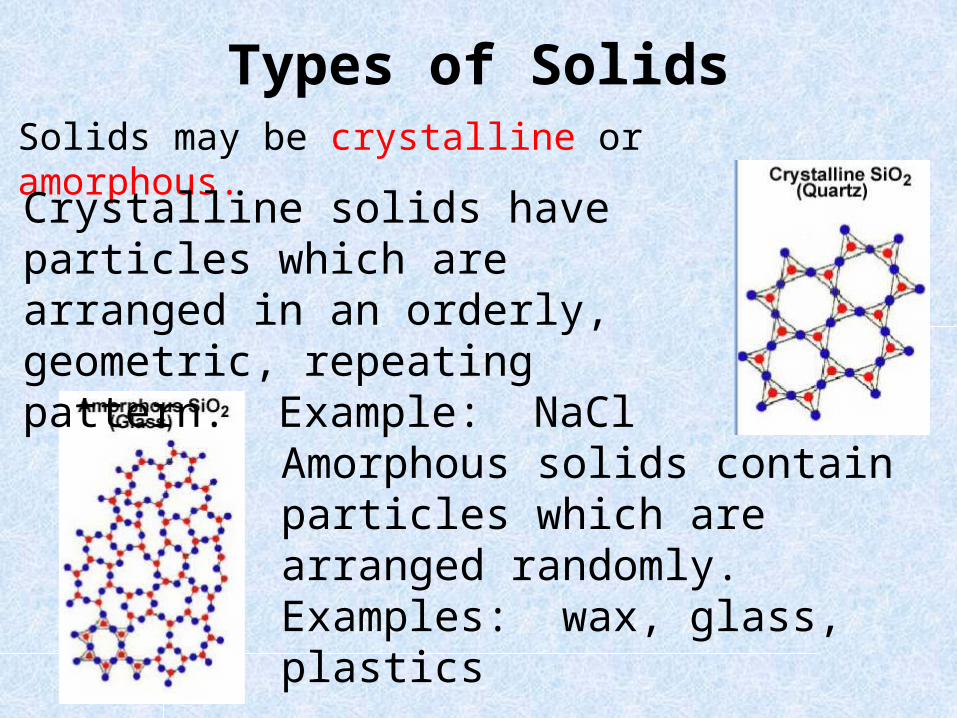
Types of SolidsSolids may be crystalline or amorphous.
Crystalline solids have particles which are arranged in an orderly, geometric, repeating pattern. Example: NaCl
Amorphous solids contain particles which are arranged randomly. Examples: wax, glass, plastics

Properties of Liquids
1. The particles in a liquid are not as close together or arranged as orderly as the particles in a solid.
2. The intermolecular forces of attraction between the particles of a liquid are not as strong as those found in solids.
3. Liquids are fluid. The particles in a liquid are able to slide past each other.
Properties of Liquids
4. Liquids have a definite volume but they do not have a definite shape.
5. Liquids are virtually incompressible.
6. Liquids tend to be more dense than gases but less dense than solids.

Properties of Gases
1. The particles in a gas are far apart .
2. The particles in a gas have very weak intermolecular forces of attraction between them.
3. Gases are fluid. The particles in a gas are free to move in all directions.

Properties of Gases
Diffusion is the movement of gas particles from an area of high concentration to an area of low concentration. Ex. Opening a bottle of perfume, air fresheners.
Effusion is the escape of gas particles through the pores or tiny pinholes in a container. Ex. A balloon deflating over time.

Properties of Gases
4. Gases do not have a definite shape or volume. Gases expand to completely fill any container in which they are enclosed, and they take its shape.
5. Gases are compressible. The volume of a gas may be greatly decreased.
6. Gases have low densities. This is because there are not as many particles in a large space.
The Kinetic Molecular Theory
The kinetic molecular theory is based on the idea that particles of matter are always in motion.
It can be used to explain the properties of solids, liquids, and gases in terms of the energy of particles and the forces that act between them.

The Kinetic Molecular Theory of Gases
The kinetic molecular theory provides a model of what is called an ideal gas.
An ideal gas is an imaginary gas that perfectly fits all the assumptions of the kinetic molecular theory.
Assumptions of The Kinetic – Molecular Theory of Gases
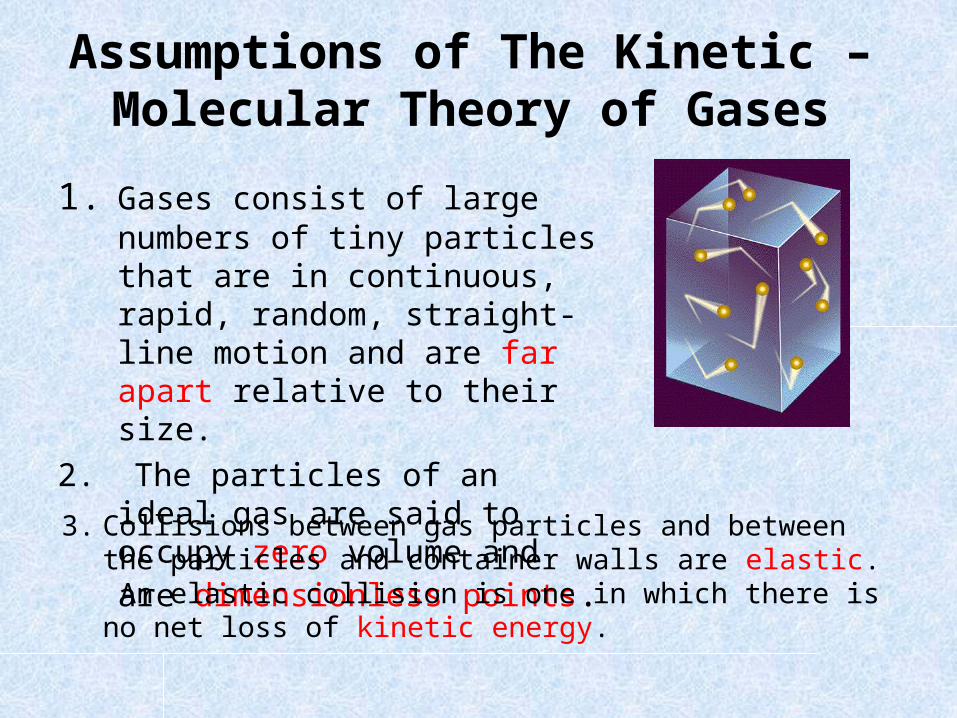
1. Gases consist of large numbers of tiny particles that are in continuous, rapid, random, straight-line motion and are far apart relative to their size.
2. The particles of an ideal gas are said to occupy zero volume and are dimensionless points.
3. Collisions between gas particles and between the particles and container walls are elastic. An elastic collision is one in which there is no net loss of kinetic energy.
Assumptions of The Kinetic – Molecular Theory of Gases
4. There are no forces of attraction or repulsion between the particles of an ideal gas.
Assumptions of The Kinetic Molecular Theory of Gases
5. The Kelvin temperature of a substance is directly proportion to the average kinetic energy of the particles of the substance.
What happens to the kinetic energy of a gas particle as temperature increases?
Kinetic energy increasesdecreases? Kinetic energy decreases

Comparison of Ideal Gases to Real Gases
1. Ideal gas particles have zero volume. Real gas particles occupy a small volume.
2. The particles of an ideal gas do not exert attractive or repulsive forces on each other. Real gas particles experience weak forces of attraction and repulsion between the particles.
3. Real gases can be liquefied and sometimes solidified by cooling and by applying pressure. Ideal gases cannot be liquefied or solidified.
Deviation from Ideal Gas Behavior
Under certain conditions real gases can behave like ideal gases.
These conditions include:High temperatures Low Pressures
Deviation from Ideal Gas Behavior
1. Polar molecules deviate more from ideal gas behavior than nonpolar molecules. This is because the intermolecular forces of attraction are usually stronger in polar molecules.
2. Large molecules deviate more from ideal gas behavior than small diatomic molecules. This is because the particles take up more volume.
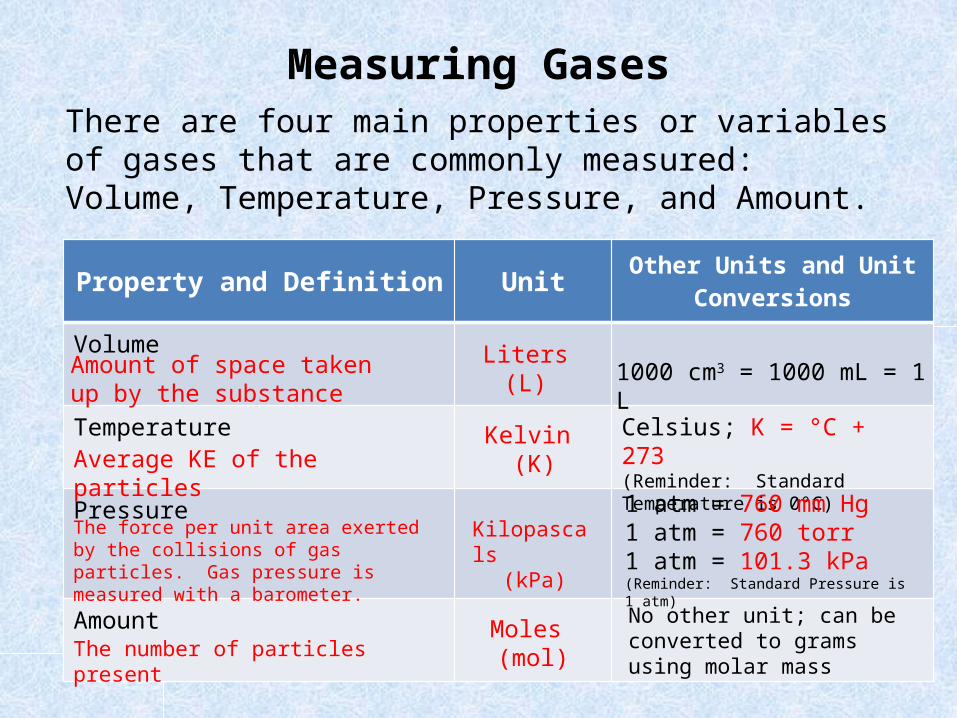
Measuring GasesThere are four main properties or variables of gases that are commonly measured: Volume, Temperature, Pressure, and Amount.
Property and Definition Unit Other Units and Unit Conversions
Volume
Temperature
Pressure
Amount
Amount of space taken up by the substance
Liters (L) 1000 cm3 = 1000 mL = 1
L
Average KE of the particlesKelvin
(K)
Celsius; K = °C + 273(Reminder: Standard Temperature is 0°C)
The force per unit area exerted by the collisions of gas particles. Gas pressure is measured with a barometer.
Kilopascals(kPa)
1 atm = 760 mm Hg1 atm = 760 torr1 atm = 101.3 kPa(Reminder: Standard Pressure is 1 atm)
The number of particles presentMoles (mol)
No other unit; can be converted to grams using molar mass

Boyle’s Law
Robert Boyle (1627-1691), a British physicist and chemist, carefully investigated the compressibility of gases.
Boyle’s Law states that at constant temperature, the volume of a gas varies inversely with pressure.
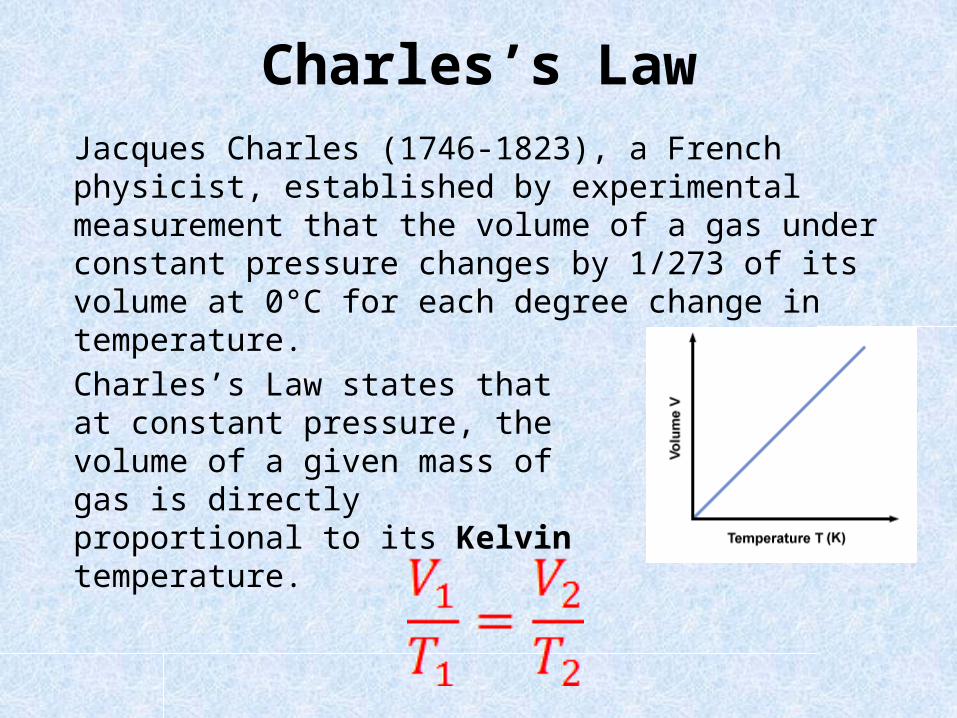
Charles’s LawJacques Charles (1746-1823), a French physicist, established by experimental measurement that the volume of a gas under constant pressure changes by 1/273 of its volume at 0°C for each degree change in temperature.
Charles’s Law states that at constant pressure, the volume of a given mass of gas is directly proportional to its Kelvin temperature.

Gay-Lussac’s LawJ.L. Gay-Lussac (1778-1850), a French chemist and physicist, performed experiments to determine the relationship between the temperature and pressure exerted by a confined gas when volume is held constant.
Gay-Lussac’s Law states that the pressure of a fixed mass of gas is directly proportional to the Kelvin temperature if the volume is kept constant.
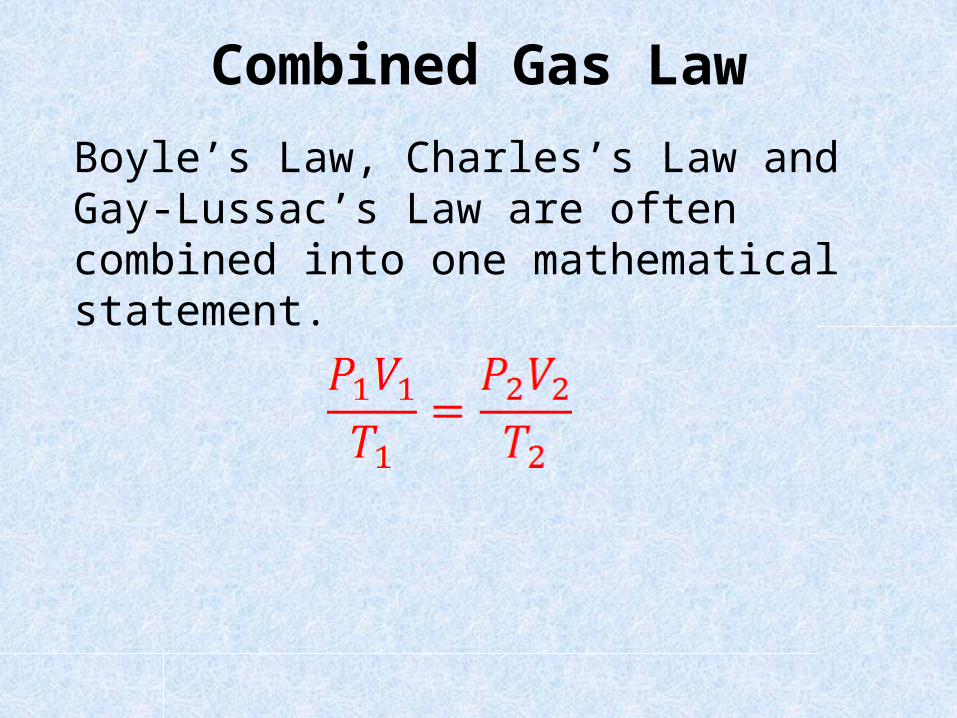
Combined Gas Law
Boyle’s Law, Charles’s Law and Gay-Lussac’s Law are often combined into one mathematical statement.
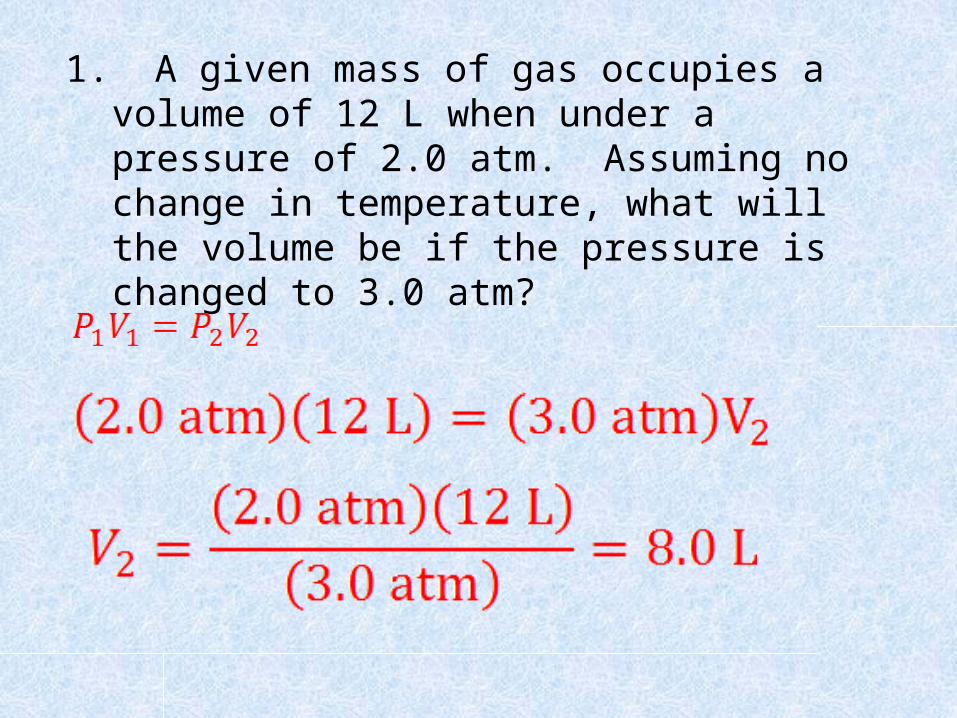
1. A given mass of gas occupies a volume of 12 L when under a pressure of 2.0 atm. Assuming no change in temperature, what will the volume be if the pressure is changed to 3.0 atm?

2. A given mass of gas occupies a volume of 640 mL at 47°C and 650 mm Hg. What will the new temperature be if the volume is decreased to 210 mL and the pressure remains unchanged?

3. A quantity of acetylene in a steel cylinder is under a pressure of 1.2 atm at 27°C. What will be the pressure of the gas if the temperature is increased to 87°C?

4. A given mass of gas occupies a volume of 1.2 L at a temperature of 27°C and a pressure of 1.0 atm. What will the volume be if the temperature is increased to 77°C and the pressure remains unchanged?

5. The volume of a sample of gas is 200. mL at 275 K and 92.1 kPa. What will the new volume of the gas be at 350. K and 98.5 kPa?

6. A sample of nitrogen gas has a pressure of 2.5 atm at a temperature of 25°C. What temperature is required to increase the pressure to 4.0 atm, assuming that the volume is fixed and the amount of gas does not change?
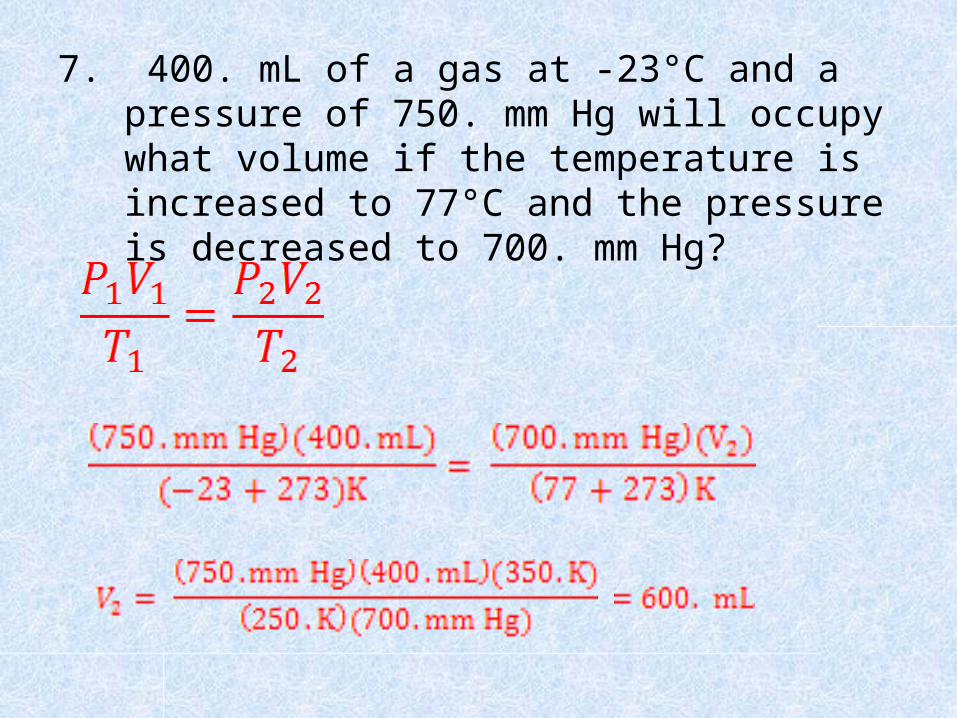
7. 400. mL of a gas at -23°C and a pressure of 750. mm Hg will occupy what volume if the temperature is increased to 77°C and the pressure is decreased to 700. mm Hg?

Dalton’ Law of Partial Pressure
John Dalton (1766-1844), an English chemist and physicist, established that when two or more gases occupy the same container, each acts independently of the other(s) and exerts the same pressure that it would if it were alone in the container.

Dalton’s Law of Partial Pressure
Dalton’s law of partial pressure states that the total pressure exerted by a mixture of gases is equal to the sum of the partial pressures of the individual gases in the mixture (at constant temperature).
Ptotal = P1 + P2 + P3 …
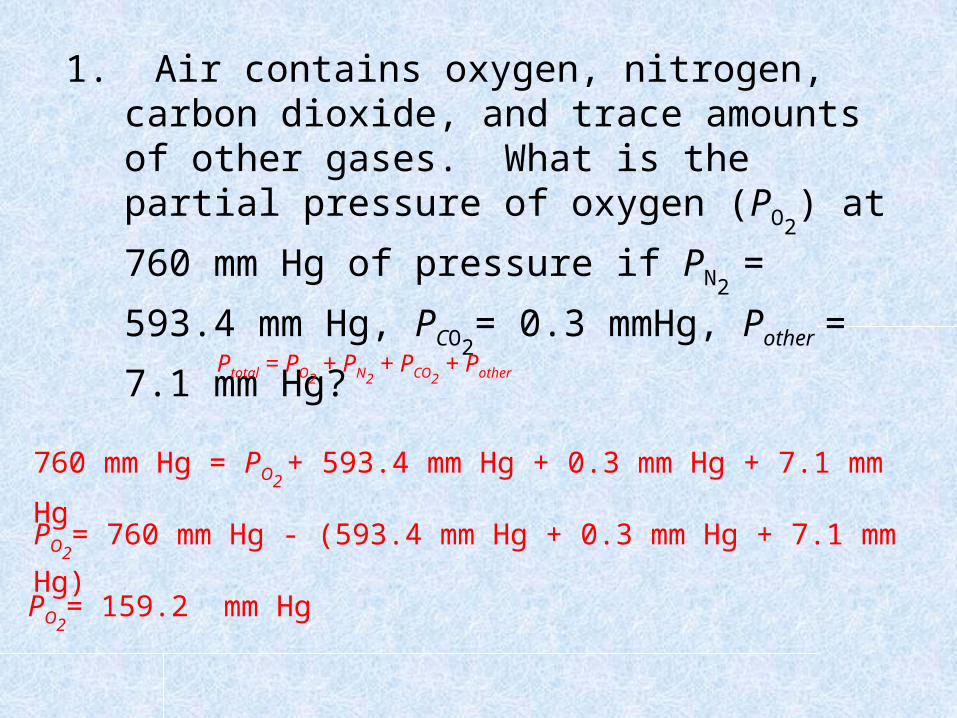
1. Air contains oxygen, nitrogen, carbon dioxide, and trace amounts of other gases. What is the partial pressure of oxygen (PO2
) at 760 mm Hg of pressure if
PN2 = 593.4 mm Hg, PCO2
= 0.3 mmHg,
Pother = 7.1 mm Hg?
760 mm Hg = PO2 + 593.4 mm Hg + 0.3 mm Hg + 7.1 mm
Hg PO2
= 760 mm Hg - (593.4 mm Hg + 0.3 mm Hg + 7.1 mm
Hg)PO2
= 159.2 mm Hg
Ptotal = PO2 + PN2
+ PCO2 + Pother
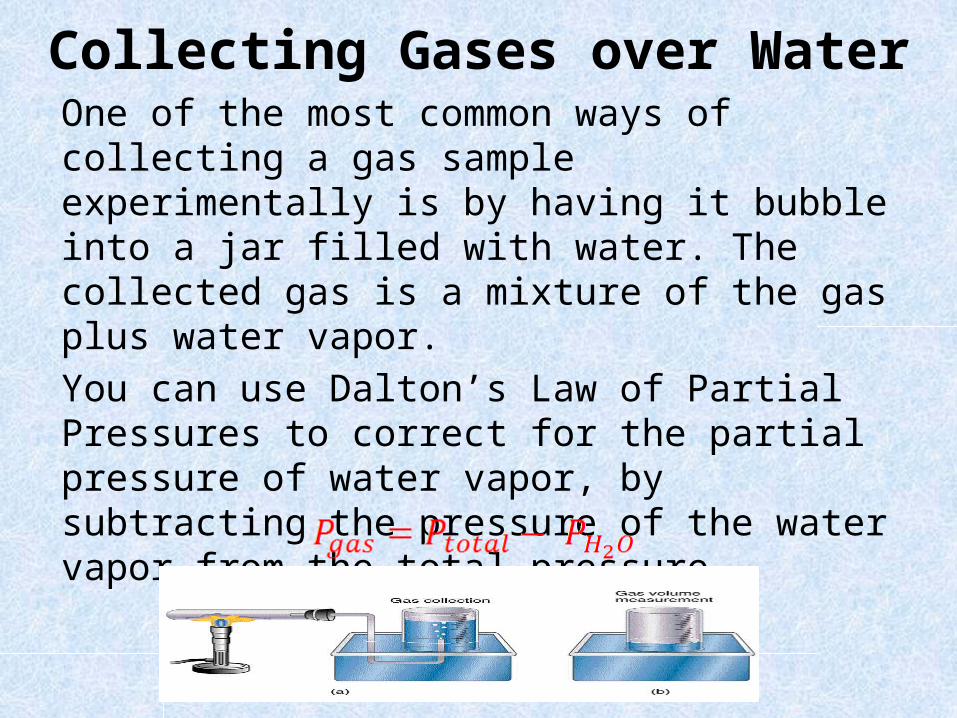
Collecting Gases over WaterOne of the most common ways of collecting a gas sample experimentally is by having it bubble into a jar filled with water. The collected gas is a mixture of the gas plus water vapor. You can use Dalton’s Law of Partial Pressures to correct for the partial pressure of water vapor, by subtracting the pressure of the water vapor from the total pressure.

Collecting Gases over Water
The amount of water vapor present is very sensitive to the temperature.
The warmer the water is, the more water vapor present.
In order to determine the vapor pressure of the dry gas, you will need to know the vapor pressure of the water. This will either be given to you or you will have to use a reference table to find it.

2. 0.750 L of a gas is collected over water at 25.0°C with a total pressure of 747.8 mm Hg. What is the pressure of the dry gas?
Temperature
(°C)
Pressure (mm Hg)
-10 2.1-5 3.20 4.65 6.5
10 7.015 9.220 17.525 23.830 31.8
Pgas =747.8 mm Hg–23.8 mm Hg
Pgas = 724.0 mm Hg

Avogadro’s Law
Avogadro’s Law states that at the same conditions of temperature and pressure, equal volumes of gases contain the same number of particles.
This means that the volume of a gas is directly proportional to the number of moles of the gas.
Remember: At STP, one mole of any gas contains 6.02×10²³ particles and occupies a volume of 22.4 L.
Avogadro’s Law - Example
Two sealed flasks of equal volume are at the same temperature and pressure. The first flask contains hydrogen gas. The second flask contains oxygen gas. 1. Which flask contains the most
particles?
2. Which flask contains the most mass? The flask with the oxygen has the most
mass.
They contain the same number of particles.

The Ideal Gas LawThe ideal gas law equation allows for the quantity of the gas to be considered. The ideal gas law is as follows:
Where: V (Volume) is expressed in Liters (1 L = 1000 mL)
T (Temperature) is expressed in Kelvin (K = °C + 273)
P (Pressure) can be expressed in atm, kPa, mm Hg or torr
R = Ideal or Universal Gas Constant
PV = nRT

The Ideal Gas LawThere are 3 different values for R, depending upon the units for pressure.
If the pressure is given in atm.
If the pressure is given in mm Hg.
If the pressure is given in kPa.
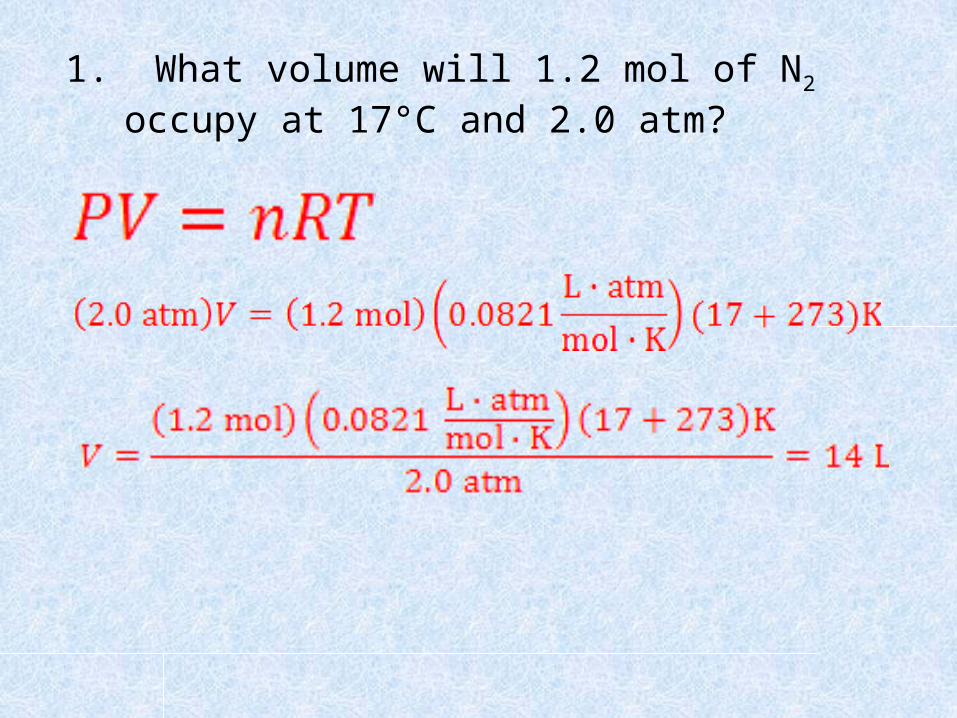
1. What volume will 1.2 mol of N2 occupy at 17°C and 2.0 atm?

2. What pressure in atmospheres, will 0.80 mol of gas in a volume of 2.0 L exert if the temperature is 27°C?
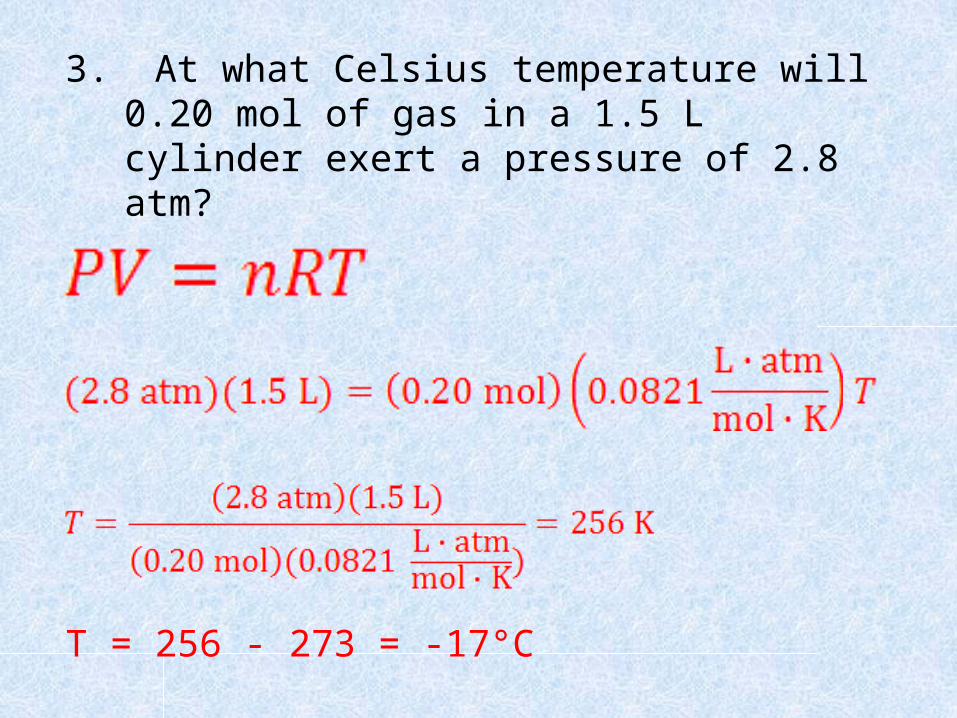
3. At what Celsius temperature will 0.20 mol of gas in a 1.5 L cylinder exert a pressure of 2.8 atm?
T = 256 - 273 = -17°C

4. At 27°C the gas in a 920 mL flask exerts a pressure of 730 mm Hg. How many grams of nitrogen gas are in the flask?

1. Nitrogen gas and hydrogen gas react to produce ammonia.
N2 + 3H2 → 2NH3
What volume of ammonia will be produced at STP if 20.0 g of hydrogen gas react with excess nitrogen gas?
Review Concept
20.0 g H 2×1mol H 2
2.02g H 2
×2mol N H3
3mol H2
×22.4 L N H3
1mol N H3¿148 L N H 3

PhaseChange
Process
Occurs
Example
Phase Changes
solid liquid liquid solid
melting freezing
when a substance reaches its melting point
when a substance reaches its freezing point
Ice cube melting water freezing
melting
freezing

PhaseChange
Process
Occurs
Example
Phase Changes
liquid gas gas liquid
vaporization condensation
when the liquid vapor pressure is
equal to the atmospheric
pressure (boiling)
when a gaseous substance comes into
contact with a cool surface
water boilingwater on the
outside of a cup
through vaporization at the surface of a
liquid (evaporation)
blowing your hair dry
vaporization
condensation

PhaseChange
Process
Occurs
Example
Phase Changes
solid gas gas solid
sublimation deposition
when a substance goes directly from a solid to a gas
when a substance goes directly from a gas to a solid
dry ice and solid air fresheners frost in the freezer
It is important to note that the temperature of a substance does not change during a phase change.
sublimation
deposition

Phase changes (or transitions) occur when a material changes from one phase or state to another. The six most common phase changes are:
Phase Changes
Which of the phase changes represent endothermic processes?Melting, vaporization and sublimation
Which of the phase changes represent exothermic processes?Freezing, condensing, and deposition
A vapor pressure curve can be used to represent the boiling point of a substance at various vapor pressures.
Any point along a vapor pressure curve for a compound represents the boiling point of the substance.
The normal boiling point of a substance occurs when the vapor pressure is equal to 1 atm (760 mmHg, 101.3 kPa).
Vapor Pressure Curves

Vapor Pressure Curves
At what temperature will ethanol boil when the atmospheric pressure is 200 mm Hg?
What vapor pressure would be needed to make water boil at 80°C?
Approximately 48°C
333 torr

If heat is supplied to a substance at a constant rate, a heating curve can be generated.
This is the heating curve for water.
A
B C
D E
F
Heating Curve for Water

A
B C
D E
F
Segment AB: As the ice is heated, the temperature steadily climbs at a constant rate.
Heating Curve for Water

A
B C
D E
F
Segment BC: When the melting point is reached the temperature levels off (the kinetic energy does not change) even though heat energy is still being added. The added energy is being used to convert the ice to water and weaken the intermolecular forces of attraction.
Point B – represents where the ice begins to meltBetween Points B and C – the solid and liquid phases both existPoint C – all of the solid has been converted to a liquid
Heating Curve for Water

Heating Curve for Water
A
B C
D E
F
Segment CD: Once all of the substance is turned into water the temperature once again climbs steadily.

A
B C
D E
F
Segment DE: When the boiling point is reached, the curve once again levels off. The added heat is used to weaken the intermolecular forces of attraction and convert the water to steam.
Point D – represents where the water begins to boilBetween Points D and E – the liquid and gas phases both existPoint E – all of the liquid has been changed into steam
Heating Curve for Water

Segment EF: The temperature of the steam increases steadily as heat is being added.
Heating Curve for Water
A
B C
D E
F

A
B C
D E
F
Segment DE is much longer than segment BC. Why?
The amount of energy required to vaporize a sample of water is much greater than the amount of energy required to melt that same amount of water.
Heating Curve for Water

A
BC
DE
F
Heat removed
Cooling Curve for Water
Segment FE: The kinetic energy is decreasing as energy is being removed and the gas is being cooled.Segment ED: The gas is condensing. The kinetic energy remains the same.
Point E – represents where the gas begins to condenseBetween Points E and D – gas and liquid phase exist in equilibriumPoint D – all of the water has condensed
A
BC
DE
F
Heat removed
Cooling Curve for Water
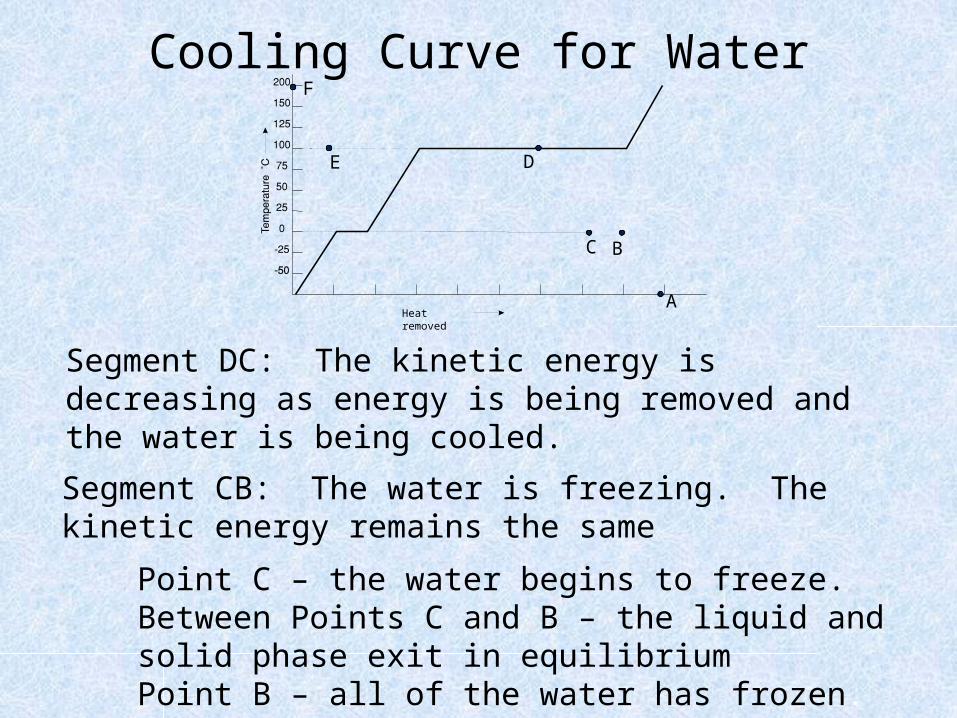
Segment DC: The kinetic energy is decreasing as energy is being removed and the water is being cooled.
Segment CB: The water is freezing. The kinetic energy remains the same
Point C – the water begins to freeze.Between Points C and B – the liquid and solid phase exit in equilibriumPoint B – all of the water has frozen.

A
BC
DE
F
Heat removed
Cooling Curve for Water
Segment BA: The kinetic energy is decreasing as energy is being removed and the ice is being cooled.
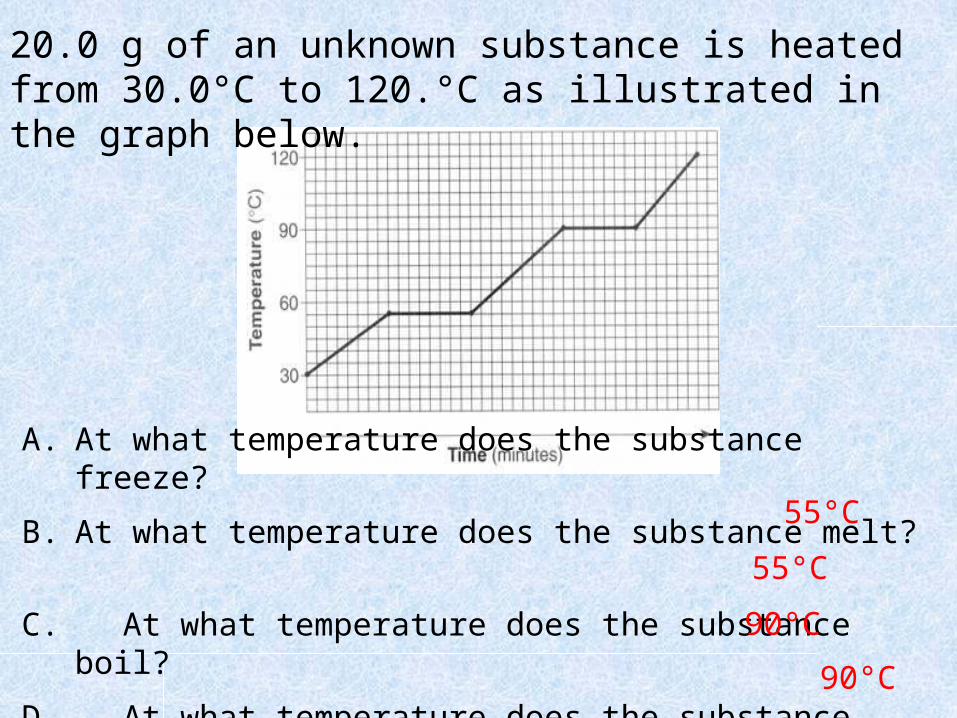
A. At what temperature does the substance freeze?
B. At what temperature does the substance melt?
C. At what temperature does the substance boil?
D. At what temperature does the substance condense?
55°C
90°C
20.0 g of an unknown substance is heated from 30.0°C to 120.°C as illustrated in the graph below.
55°C
90°C
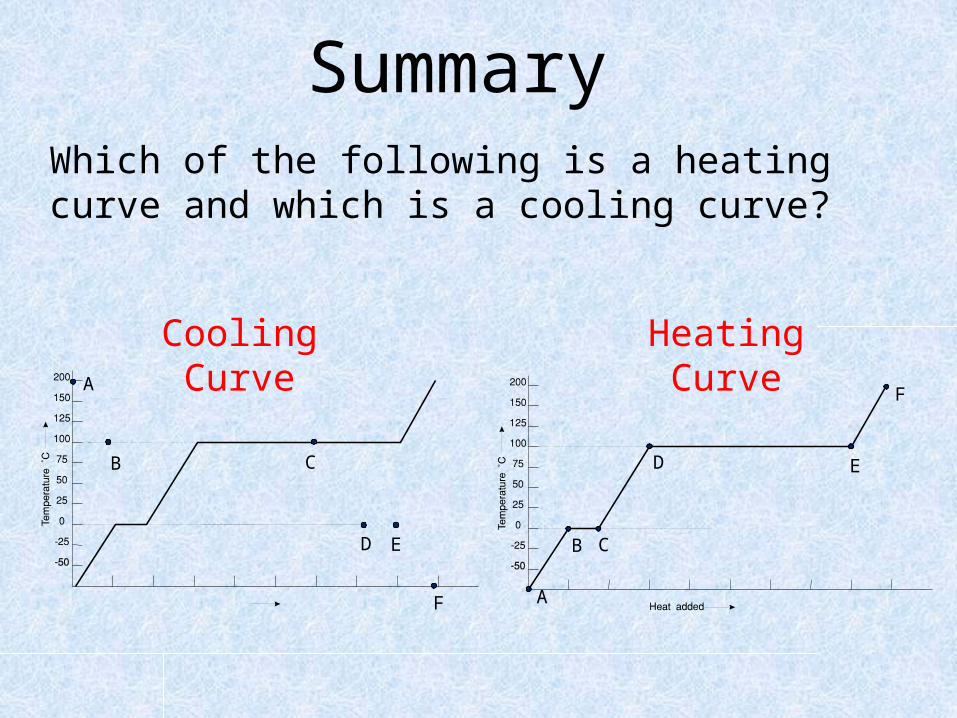
Summary Which of the following is a heating curve and which is a cooling curve?
A
B C
D E
F
F
ED
CB
A
Cooling Curve Heating Curve

What is happening to the phase of water as it goes from
point A to point B
point B to point C
point C to point D
point D to point E
point E to point F
Summary
A
B C
D E
F
ice is heated
ice is melting to water
water is heated
water is vaporizing to steam
steam is heated
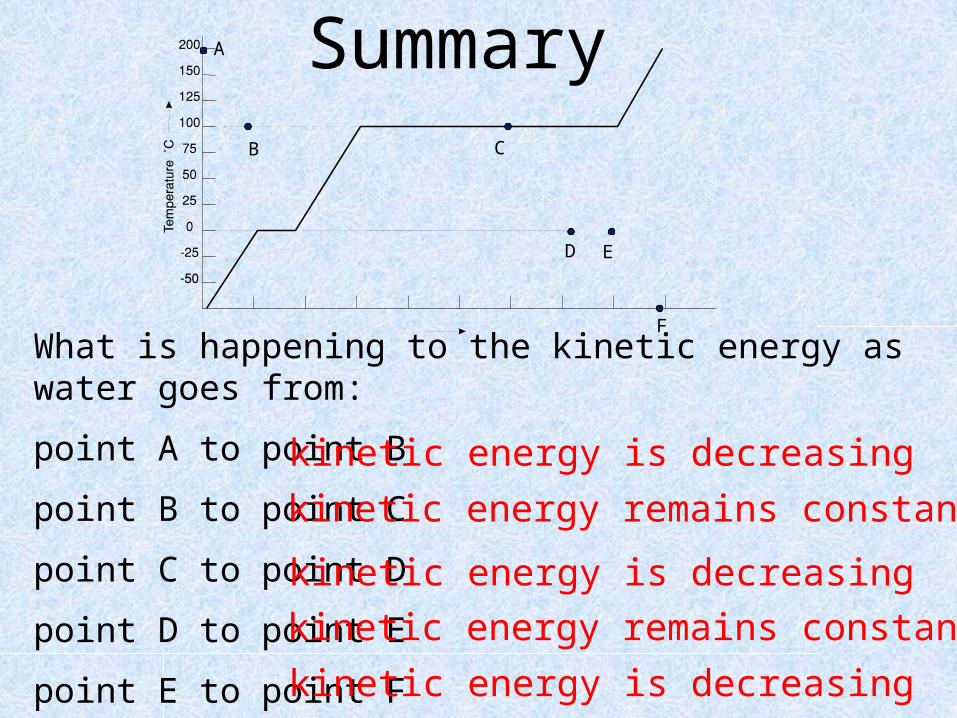
Summary
What is happening to the kinetic energy as water goes from:
point A to point B
point B to point C
point C to point D
point D to point E
point E to point F
F
ED
CB
A
kinetic energy is decreasing
kinetic energy remains constant
kinetic energy is decreasing
kinetic energy remains constant
kinetic energy is decreasing

A phase diagram is a graph of pressure versus temperature that shows the conditions under which the phases of a substance exist.
Phase Diagrams

The triple point indicates the temperature and pressure conditions at which the solid, liquid, and gas forms of the substance can coexist at equilibrium.
Where is the triple point located for water?
At 0.01°C and at 0.006 atm
Interpreting Phase Diagrams
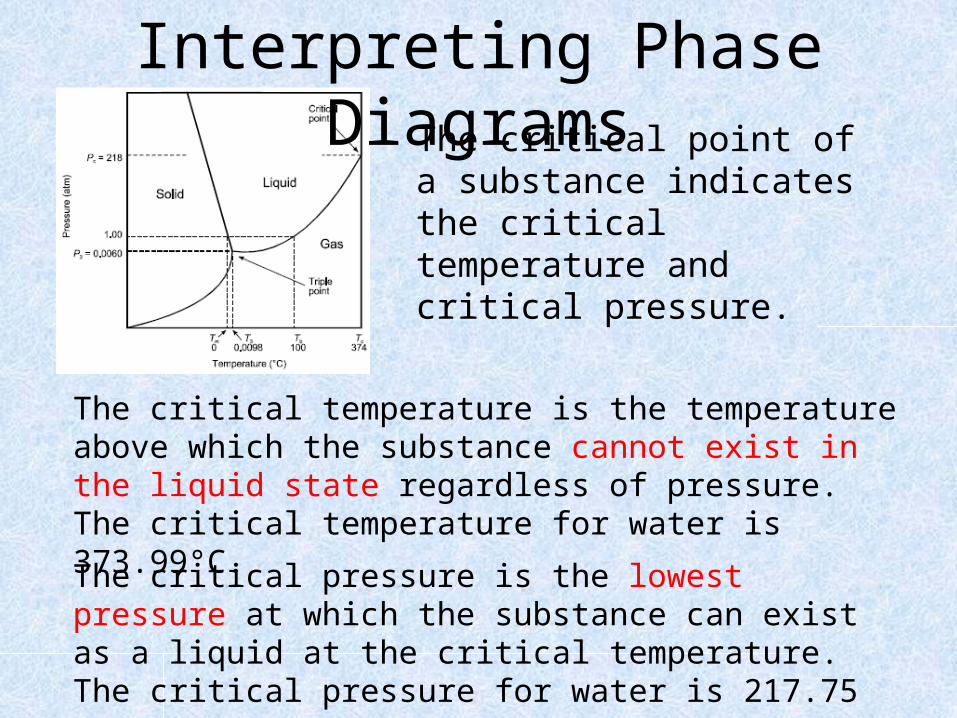
The critical point of a substance indicates the critical temperature and critical pressure.
The critical temperature is the temperature above which the substance cannot exist in the liquid state regardless of pressure. The critical temperature for water is 373.99°C.
The critical pressure is the lowest pressure at which the substance can exist as a liquid at the critical temperature. The critical pressure for water is 217.75 atm.
Interpreting Phase Diagrams

Within what range of pressures will water be a liquid at temperatures above its normal boiling point?
Within 1.0 atm and 217.75 atm
What phase change is occurring as the temperature of ice is increased from -50°C to 50°C at 1 atm of pressure?
Interpreting Phase Diagrams
The ice is melting.
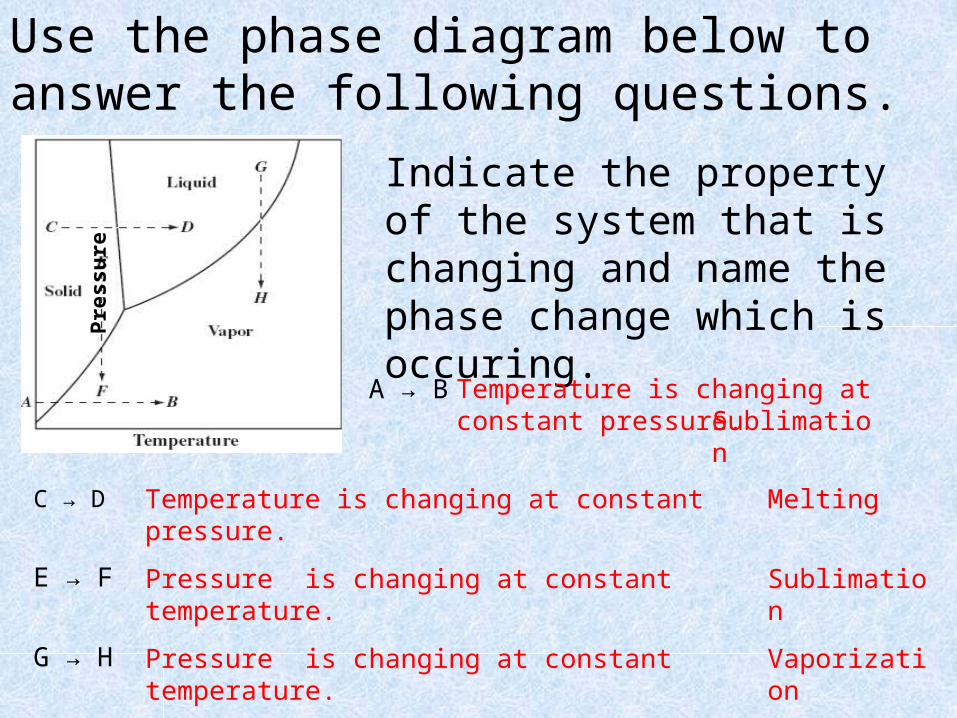
Indicate the property of the system that is changing and name the phase change which is occuring.Pre
ssu
re
A → B Temperature is changing at constant pressure.
Temperature is changing at constant pressure. C → D
E → F
G → H
Pressure is changing at constant temperature.
Pressure is changing at constant temperature.
Sublimation
Melting
Sublimation
Vaporization
Use the phase diagram below to answer the following questions.
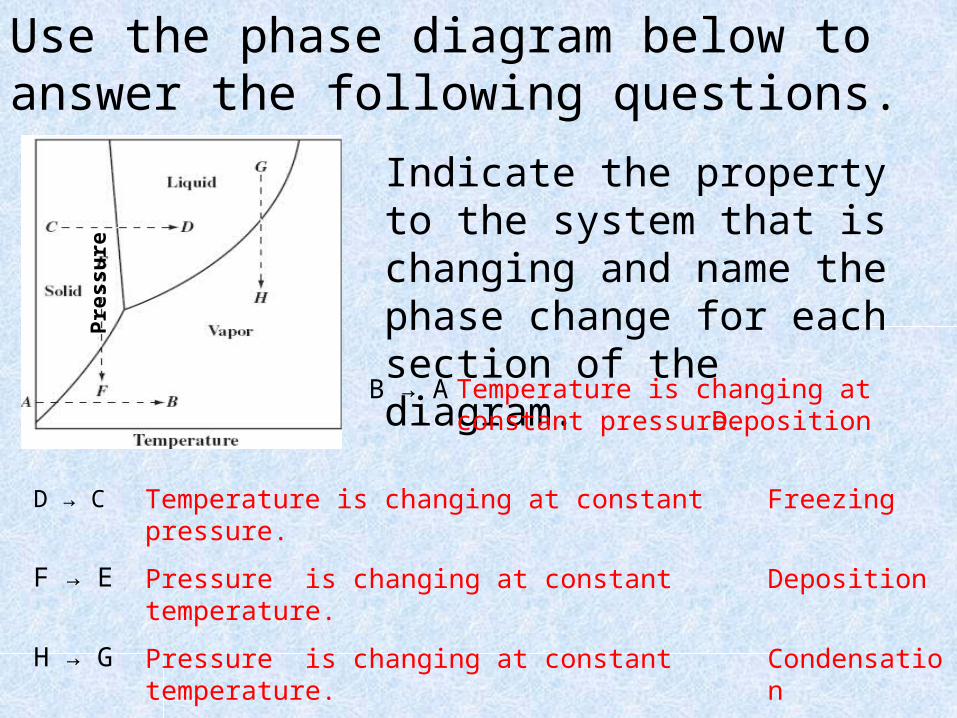
Indicate the property to the system that is changing and name the phase change for each section of the diagram.Pre
ssu
re
B → A Temperature is changing at constant pressure.
Temperature is changing at constant pressure. D → C
F → E
H → G
Pressure is changing at constant temperature.
Pressure is changing at constant temperature.
Deposition
Freezing
Deposition
Condensation
Use the phase diagram below to answer the following questions.

Examples of Phase Diagrams for Water and Carbon Dioxide
Notice that the solid-liquid equilibrium line does not slope the same for both diagrams. What this means is that when pressure is increased, a normal substance will change from a liquid to a solid, but water will change from a solid to a liquid.
This is due to the hydrogen bonding in water. The lattice structure formed by ice causes the solid phase to be less dense than the liquid phase which is why ice floats on water.
Comparing Phase Diagrams

Summary
• The temperature above which the substance cannot exist in the liquid state regardless of pressure.
• Indicates the critical temperature and critical pressure of a substance.
• A graph of pressure versus temperature.
• The lowest pressure at which the substance can exist as a liquid at the critical temperature.
• Indicates the temperature and pressure conditions at which the solid, liquid, and gas forms of the substance can coexist at equilibrium.
phase diagram
triple point
critical point
critical pressure
critical temperature
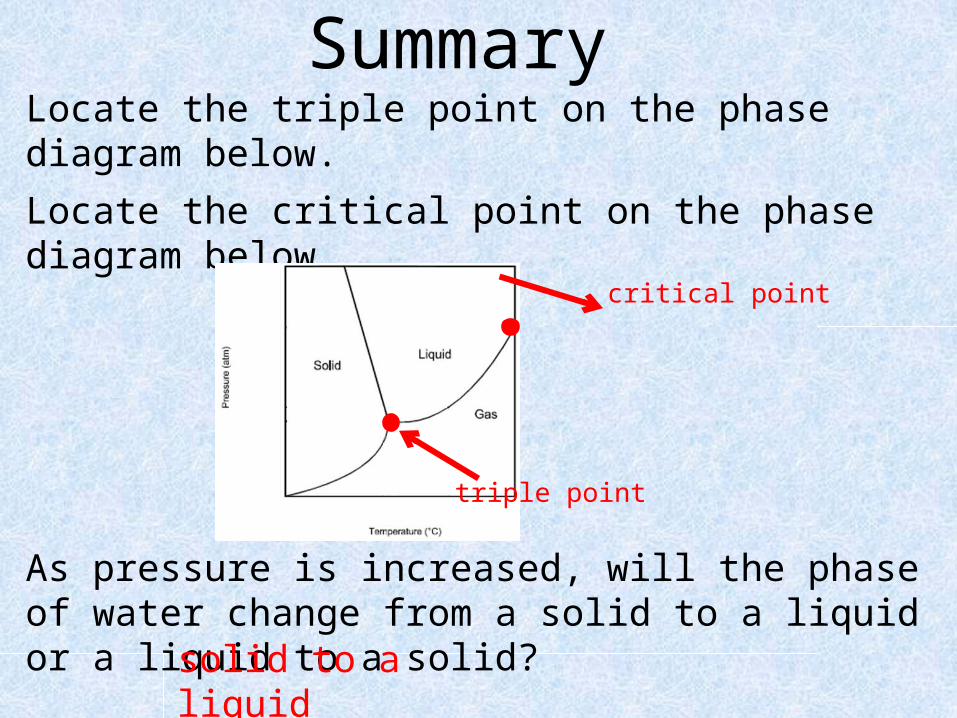
Locate the triple point on the phase diagram below.
Locate the critical point on the phase diagram below.
As pressure is increased, will the phase of water change from a solid to a liquid or a liquid to a solid?
Summary
critical point
triple point
solid to a liquid