Embed Size (px)
Citation preview

Review of the Financial Plan of the City of New York
March 2011
Report 14-2011
New York State Office of the State Comptroller
Thomas P. DiNapoli
Office of the State Deputy Comptroller
for the City of New York Kenneth B. Bleiwas

Additional copies of this report may be obtained from:
Office of the State Comptroller New York City Public Information Office 633 Third Avenue New York, NY 10017 Telephone: (212) 681-4840
Or through the Comptroller’s website at: www.osc.state.ny.us
Please notify the Office of the State Deputy Comptroller at (212) 383-3916 if you wish to have your name removed from our mailing list or if your address has changed.

Contents I. Executive Summary .......................................................................................... 1
II. Economic Trends .............................................................................................. 5
III. Changes Since the July Plan ............................................................................ 9
IV. Impact of the State Budget ............................................................................. 11
V. Program to Eliminate the Gap ...................................................................... 13
VI. Revenue and Expenditure Trends ................................................................. 17
A. Revenue Trends .....................................................................................................18 B. Expenditure Trends ................................................................................................22
VII. Other Issues ..................................................................................................... 31
A. Department of Education ......................................................................................31 B. Health and Hospitals Corporation .........................................................................32 C. New York City’s Credit Rating ............................................................................32 D. New York City Off-Track Betting Corporation ....................................................33


1
I. Executive Summary New York City’s economy is recovering from the recession at a faster pace than the nation and the rest of New York State. Since job losses ended in November 2009, the City has gained 73,400 private sector jobs, or half of the jobs lost in the recession, but public sector job losses are beginning to accelerate. While the unemployment rate has declined from a peak of 10 percent to 8.9 percent, it remains unacceptably high.
Almost all of the City’s private sector industries have experienced job gains over the past year, with the bulk of the new jobs concentrated in professional and business services, education and health care, and leisure and hospitality. The tourism industry continues to expand, and a record 48.7 million visitors came to the City last year —almost 2 million more than the previous record set in 2008. New York City is now the nation’s number one travel destination, and tourists spent an estimated $31 billion.
Wall Street began to add jobs last year, having returned to profitability much faster than had been expected. After losing $53.9 billion during calendar years 2007 and 2008, Wall Street earned a record $61.4 billion in 2009, fueled by low interest rates, proprietary trading, and federal bailouts. In 2010, the securities industry earned $27.6 billion—second only to the record set in 2009. Although cash bonuses paid to securities industry employees in New York City declined by an estimated 8 percent in 2010, overall industry compensation grew by about 6 percent.
The City’s real estate markets are slowly improving. The number of transactions and the sale prices for single-family homes, cooperatives, and condominiums inched higher in 2010, and the commercial real estate market also continues to recover. Rents are slowly rising and the vacancy rate is declining (the New York City metropolitan area has the lowest commercial vacancy rate in the nation). Foreclosures, however, are likely to slow down the recovery in the residential housing market.
During the recession, City fund revenues dropped abruptly—by $2.5 billion in City Fiscal Year (FY) 2009—and then remained depressed in FY 2010. Improving economic conditions permitted the City to raise its revenue forecasts by more than $2 billion over this year and next year. The City’s February 2011 four-year financial plan (the “February Plan”) assumes that City fund revenues will grow by $2.4 billion in FY 2011 and by another $2.5 billion in FY 2012 (see Figure 1).
Despite the good economic news, the City continues to face significant challenges. Federal stimulus aid will expire in FY 2012; the State will likely cut aid to school districts and localities to close its own budget gaps; and costs for pensions and health insurance are projected to grow quickly. Debt service will consume 13.7 percent of City fund revenues by 2015, despite a 10 percent cut to the capital program, and the City will have to resolve a number of complex labor matters.

Office of the State Deputy Comptroller for the City of New York
2
In November 2010, the Mayor cut planned agency spending by $585 million in the current year (FY 2011) and by about $1 billion in subsequent years. These actions, which are reflected in the February Plan, are expected to reduce staffing by 8,264 employees by June 2012, including 5,312 layoffs. The cuts would fall hardest on the City’s schools, which have been instructed to lay off 4,666 teachers.
The City has continued to draw down reserves accumulated during the last economic expansion and, as previously mentioned, has significantly raised its revenue forecasts. (While the City’s revenue estimates are reasonable, they are less conservative than in prior years.) The City also expects to realize nearly $1 billion in debt service savings during fiscal years 2011 and 2012. As a result, the City now projects a surplus of nearly $3.2 billion in FY 2011, which was used to help balance the FY 2012 budget.
These resources enabled the City to replace expiring federal stimulus aid for education with City funds ($853 million) and to absorb the budgetary impact of the Governor’s proposed budget ($1.8 billion).
The Governor has also submitted to the State Legislature the recommendations of the Medicaid Redesign Team, which aim to reduce State Medicaid spending by $2.3 billion. While the budgetary impact on the Health and Hospitals Corporation is less than intial concerns had anticipated, it adds to the Corporation’s already considerable financial challenges.
Although the City drew on its reserves in FY 2011, it increased its pension reserve to $1 billion beginning in FY 2012 to cover the cost of changes in actuarial assumptions, such as lowering the investment earnings assumption, which are under consideration. Although the cost of such changes could exceed the $1 billion annual reserve, the actual cost and the date of implementation have not yet been determined.
After taking into account all of these changes, a budget gap of $600 million remained for FY 2012. To close that gap, the City has proposed that the State partially restore cuts in education aid ($200 million) and revenue sharing ($200 million), and make changes to supplemental retirement benefits for police and firefighter retirees ($200 million). To the extent that these resources do not materialize, the Mayor has directed the agencies to prepare for another round of budget cuts. To help close future budget gaps, which approach $5 billion annually, the Mayor is also asking the State to approve less costly pension benefits for new City employees.
The slowly improving economy and the prudent use of resources accumulated during the last economic expansion permitted the City to absorb the impact of the Governor’s proposed budget and to balance the FY 2012 budget. Although budget risks remain (see Figure 2), the level of risk is manageable given the size of the City’s reserves and its strong commitment to the financial planning process.

3
Figure 1 New York City Financial Plan
(in millions)
FY 2011 FY 2012 FY 2013 FY 2014 FY 2015
REVENUES
Taxes General Property Tax $ 16,847 $ 17,643 $ 18,197 $ 18,632 $19,062 Other Taxes 22,267 23,631 24,320 25,353 26,678 Tax Audit Revenue 868 645 644 651 651 Subtotal: Taxes $ 39,982 $ 41,919 $ 43,161 $ 44,636 $ 46,391 Miscellaneous Revenue 6,161 5,765 5,814 5,880 5,909 Unrestricted Intergovernmental Aid 14 12 12 12 12 Anticipated State Actions - - - 600 600 600 600 Less: Intra-City Revenue (1,871) (1,515) (1,512) (1,512) (1,512) Disallowances Against Categorical Grants (15) (15) (15) (15) (15) Subtotal: City Funds $ 44,271 $ 46,766 $ 48,060 $ 49,601 $ 51,385
Other Categorical Grants 1,315 1,160 1,157 1,154 1,150 Inter-Fund Revenues 559 500 493 493 493 Federal Categorical Grants 8,197 5,937 5,795 5,761 5,761 State Categorical Grants 11,565 11,263 11,286 11,330 11,331
Total Revenues $ 65,907 $ 65,626 $ 66,791 $ 68,339 $ 70,120
EXPENDITURES
Personal Service Salaries and Wages $ 22,124 $ 21,263 $ 21,371 $ 21,598 $ 21,685 Pensions 6,999 8,419 8,566 8,444 8,721 Fringe Benefits 7,664 7,994 8,439 8,959 9,523 Retiree Health Benefits Trust (395) (672) - - - - - - - - - Subtotal: Personal Service $ 36,392 $ 37,004 $ 38,376 $ 39,001 $ 39,929
Other Than Personal Service Medical Assistance $ 4,883 $ 6,141 $ 6,327 $ 6,463 $ 6,643 Public Assistance 1,562 1,526 1,546 1,546 1,546 All Other 1 20,290 19,413 19,934 20,435 20,922 Subtotal: Other Than Personal Service $ 26,735 $ 27,080 $ 27,807 $ 28,444 $ 29,111
General Obligation, Lease and TFA Debt Service 1,2 $ 5,046 $ 5,908 $ 6,672 $ 6,919 $ 7,269 FY 2010 Budget Stabilization & Discretionary Transfers 1 (3,646) - - - - - - - - - - - - FY 2011 Budget Stabilization 2 3,151 (3,151) - - - - - - - - - General Reserve 100 300 300 300 300 Subtotal $ 67,778 $ 67,141 $ 73,155 $ 74,664 $ 76,609 Less: Intra-City Expenses (1,871) (1,515) (1,512) (1,512) (1,512) Total Expenditures $ 65,907 $ 65,626 $ 71,643 $ 73,152 $ 75,097
Gap To Be Closed $ - - - $ - - - $ (4,852) $ (4,813) $ (4,977)
1 Fiscal Year 2010 Budget Stabilization and Discretionary Transfers total $3.646 billion, including General Obligation (GO) transfers of
$2.888 billion, Transitional Finance Authority (TFA) transfers of $371 million, net equity contribution in bond refunding of $4 million and subsidies of $383 million.
2 Fiscal Year 2011 Budget Stabilization total $3.151 billion, including GO of $2.361 billion and TFA of $790 million.

Office of the State Deputy Comptroller for the City of New York
4
Figure 2 OSDC Risk Assessment of the City Financial Plan
(in millions)
Better/(Worse)
FY 2011 FY 2012 FY 2013 FY 2014 FY 2015
Surplus/(Gaps) per February Plan $ - - - $ - - - $ (4,852) $ (4,813) $ (4,977)
State Actions - - - (600) (600) (731) (852)
Uniformed Agency Overtime - - - (150) (150) (150) (150)
Agency Actions - - - (40) (40) (40) (40)
Tax Revenues (200) - - - - - - - - - - - -
Debt Service 50 - - - - - - - - - - - -
OSDC Risk Assessment (150) (790) (790) (921) (1,042)
Remaining Gap to Be Closed per OSDC 3 $ (150) $ (790) $ (5,642) $ (5,734) $ (6,019)
Additional Risks and Offsets
UFT Collective Bargaining 4 $ (898) $ (800) $ (898) $ (900) $ (900)
Wage Increases at Projected Inflation Rate - - - (640) (1,066) (1,471) (1,924)
Pension Fund Investment Earnings - - - - - - 93 179 259
3 The February Plan includes a general reserve of $100 million in FY 2011 and $300 million in each of fiscal
years 2012 through 2015. The Retiree Health Benefits Trust will have $2 billion on deposit even after the City has drawn down $1.1 billion to help balance the budget in fiscal years 2010 through 2012. The City also has established reserves of $1 billion annually beginning in FY 2012 to fund the recommendations of an independent actuarial consultant. Although the cost of such changes could exceed the $1 billion annual reserve, the actual cost and the date of implementation have not yet been determined.
4 The Mayor has rescinded proposed wage increases for teachers and principals for fiscal years 2009 and 2010 to mitigate the loss of State education aid and to help the Department of Education meet its cost-reduction target for FY 2011. Most other municipal workers received 4 percent annual wage increases during the same two-year period. This action freed up $272 million in FY 2010, which could become a liability if a future labor settlement increases wages retroactively.

5
II. Economic Trends Economic conditions have generally improved in recent months. The national economic recovery has regained some momentum, and growth is expected to become more sustainable. Consumer spending has joined continued growth in business spending and in exports as drivers of the expansion. Job growth, however, has been modest; housing remains weak; and volatile energy and commodities prices pose risks. Further fiscal stimulus is unlikely given budgetary and political constraints, and monetary policy will become less accommodative when the Federal Reserve winds down its quantitative easing program.
As shown in Figure 3, real Gross Domestic Product (GDP) rose by 2.9 percent in 2010 after a 2.6 percent decline in 2009 (the worst decline since World War II). Early in the year, growth was driven by inventory rebuilding and business investment (spending on equipment and software grew by 15.3 percent, the largest increase since 1984). Consumer spending, which accounts for two-thirds of the economy, remained modest until the fourth quarter, when spending rose by 4 percent, the fastest rate in four years.
Recently revised employment data show the nation lost 8.8 million jobs during the recession—significantly more than the 8.3 million jobs previously estimated. While the nation has regained only 1.3 million jobs since February 2010, recent declines in initial unemployment insurance claims (which have fallen to the lowest level since mid-2008) may signal stronger job growth to come. Thus far, the pace of job creation has been insufficient to significantly reduce the unemployment rate—which stood at 8.9 percent in February 2011, only 1.2 percentage points lower than its October 2009 peak. Residential real estate markets continue to show weak sales and lower prices, which are also being depressed by the large number of foreclosure properties.
The City’s outlook for the national economy conforms with the February 2011 forecast by IHS Global Insight, which projects that GDP growth will strengthen to 3.2 percent in 2011 and then average 3.1 percent for 2012 through 2015. Consumer spending is expected to grow by 3.2 percent in 2011, but then to slow as monetary policy shifts and recent tax incentives expire. The stronger economy is projected to create an average of 2.3 million jobs annually between 2011 and 2015, with the unemployment rate gradually falling to 6.6 percent by 2015.
National Economic Growth
Source: U.S. Bureau of Economic Analysis
&&&
&
&
&
&
&
&&
2006
2007
2008
2009
2010
2011*
2012*
2013*
2014*
2015*
0
1
2
3
4
5
-1
-2
-3
-4
-5
Per
cent
Cha
nge
GDP Consumer Spending&
* IHS Global Insight forecast
Figure 3

Office of the State Deputy Comptroller for the City of New York
6
During the recession and the subsequent economic recovery, employment in New York City has outperformed the nation and the rest of New York State (see Figure 4). Since job losses ended in November 2009, the City has gained 73,400 private sector jobs, or half of the jobs lost in the recession, although the pace of the recovery slowed in the final months of 2010. The City’s rate of private sector growth through February 2011 (2.4 percent) has exceeded the national (1.4 percent) and State (1.5 percent) rates.
Almost all of the City’s private sector industries have experienced job gains, with the bulk of the new jobs concentrated in professional and business services, education and health care, and leisure and hospitality. Employment in government, however, has declined by 11,900 jobs or 2.1 percent during this period, and further declines are likely as the City and State grapple with budgetary issues. The City’s unemployment rate peaked at 10 percent in September 2009, higher than the rates in both the nation and the State overall. By February 2011, the rate had fallen to 8.9 percent—still higher than the State’s rate but lower than the national rate.
The February Plan assumes that the City will add an average of 40,000 jobs each year during 2011 through 2015, which is a slower rate of growth (1.1 percent) than forecast for the nation (1.9 percent). The pace of job growth forecast by the City is less robust than during the expansions of the 1990s (1.6 percent) or the 2000s (1.4 percent).
Wall Street earned $27.6 billion in 2010, second only to the record profits of $61.4 billion in 2009 (see Figure 5), which were boosted by government bailouts and low interest rates. Strong performance in equity markets and rising mergers and acquisitions activity, coupled with low interest rates, helped fuel profitability. The February Plan reasonably assumes that Wall Street profits will fall back to more normal levels as a result of the potential impact of higher interest rates and financial regulatory reform. The February Plan forecasts that Wall Street profits will total $20 billion in 2011 and then average $12.5 billion annually through 2015.
Wall Street Profits and Bonuses
1995199619971998199920002001200220032004200520062007200820092010*
0
5
10
15
20
25
30
35
Sources: NYS Department of Labor; New York Stock Exchange; Securities Industry and Financial Markets Association; NYC Office of Management and Budget; OSDC analysis
* City forecasts profits for 2011-2015; OSDC estimates bonuses for 2010Note: Profits are for broker/dealer operations of NYSE member firms.
19951996199719981999200020012002200320042005200620072008200920102011*2012*2013*2014*2015*
0
20
40
60
80
-20
-40
-60
Bill
i ons
of
Dol
lars
BonusesProfits
Figure 5
Private Sector Employment
Note: National, State, and City employment levels have been indexed to January 2008, the national employment peak, to show their relative changes during the recession and recovery.
Sources: U.S. Bureau of Labor Statistics; NYS Department of Labor; OSDC analysis
Jan-08
May-08
Sep-08
Jan-09
May-09
Sep-09
Jan-10
May-10
Sep-10
Jan-11
92
93
94
95
96
97
98
99
100
101
Inde
x (J
a nua
ry 2
008
= 1
00)
Figure 4
United States
New York City
Rest of New York State
7
The State Comptroller estimated that overall compensation in the securities industry rose by 6 percent in 2010 even though cash bonuses declined by nearly 8 percent to $20.8 billion, which is about one-third lower than the level in 2007 at the start of the financial crisis. The trends reflect changes in compensation practices in response to regulatory reforms that are designed to reward long-term profitability and discourage excessive risk-taking. While cash bonuses declined, the industry raised base pay and is paying a greater share of bonuses through deferred compensation.
Wall Street has also begun adding jobs. After losing 28,200 jobs between January 2008 and January 2010, the industry has gained 9,700 jobs. The February Plan assumes that the industry will experience modest job gains in 2011 and 2012—around 3,000 jobs annually—but then resume small losses in subsequent years as a result of the impact of higher interest rates and financial regulations on profits.
The level of total wages earned from jobs located in New York City has rebounded, fueled by job growth and Wall Street bonuses. In the first three quarters of 2010, total wages grew by 7.2 percent, compared to the record decline of 10.8 percent for the full year of 2009. The February Plan assumes that total wages paid in the City will rise by 5.2 percent for all of 2010, but that wage gains will slow to 3.3 percent in 2011 and 2.4 percent in 2012 as Wall Street profitability eases.
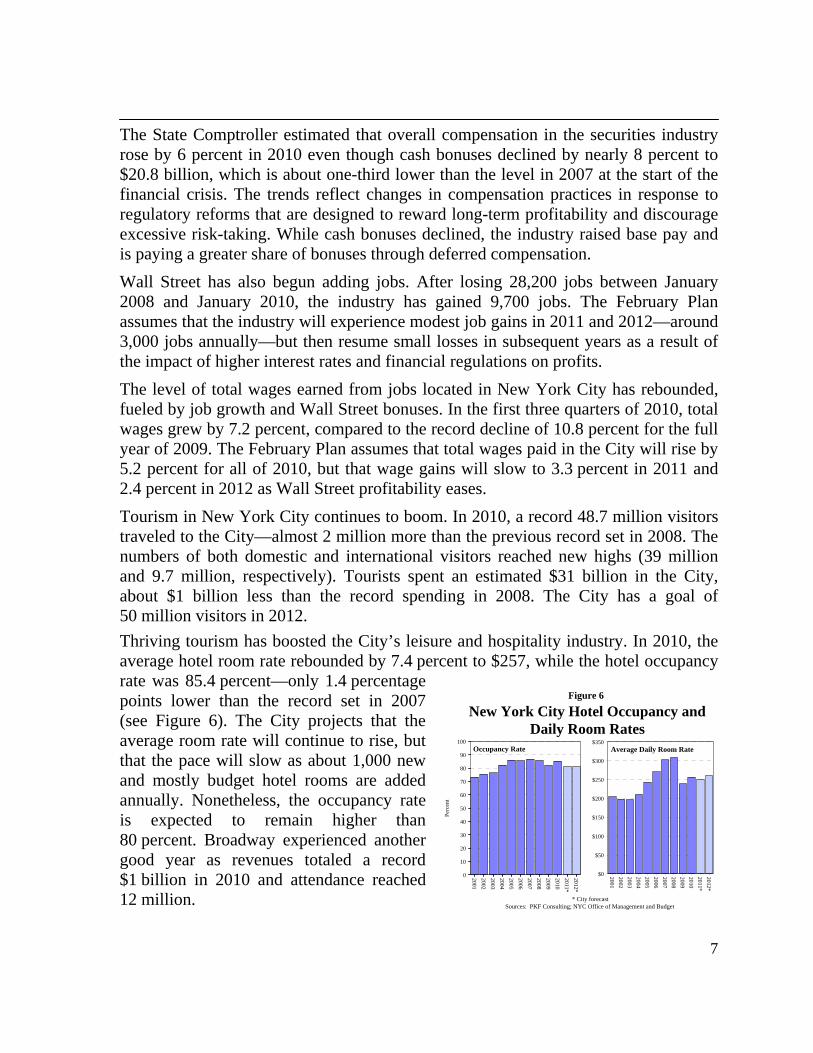
Tourism in New York City continues to boom. In 2010, a record 48.7 million visitors traveled to the City—almost 2 million more than the previous record set in 2008. The numbers of both domestic and international visitors reached new highs (39 million and 9.7 million, respectively). Tourists spent an estimated $31 billion in the City, about $1 billion less than the record spending in 2008. The City has a goal of 50 million visitors in 2012.
Thriving tourism has boosted the City’s leisure and hospitality industry. In 2010, the average hotel room rate rebounded by 7.4 percent to $257, while the hotel occupancy rate was 85.4 percent—only 1.4 percentage points lower than the record set in 2007 (see Figure 6). The City projects that the average room rate will continue to rise, but that the pace will slow as about 1,000 new and mostly budget hotel rooms are added annually. Nonetheless, the occupancy rate is expected to remain higher than 80 percent. Broadway experienced another good year as revenues totaled a record $1 billion in 2010 and attendance reached 12 million.
2001
2002
2003
2004
2005
2006
2007
2008
2009
2010
2011*
2012*
0
10
20
30
40
50
60
70
80
90
100
Perc
ent
* City forecastSources: PKF Consulting; NYC Office of Management and Budget
Figure 6
New York City Hotel Occupancy and Daily Room Rates
2001
2002
2003
2004
2005
2006
2007
2008
2009
2010
2011*
2012*
$0
$50
$100
$150
$200
$250
$300
$350Occupancy Rate Average Daily Room Rate

Office of the State Deputy Comptroller for the City of New York
8
The City’s residential real property market is showing modest improvement. Prudential Douglas Elliman reported that Manhattan apartment sales (including both cooperative and condominium apartments) had increased for four consecutive quarters (compared to one year earlier) before declining by 7.2 percent in the fourth quarter of 2010. The median sales price has increased in the last three quarters—with growth of 4.3 percent in the fourth quarter of 2010. The City estimates that the number of single-family home sales increased by 13 percent in 2010, while the median sales price rose by 3 percent. The City expects that the number of sales will increase by 4 percent in 2011 and 5 percent in 2012, but that the median price will decline by 5 percent in 2011 before a gradual recovery begins.
The City’s commercial real estate market also continues to recover. Cassidy Turley reported that leasing activity exceeded the amount of space coming to market by 5.8 million square feet in Manhattan’s primary office market in 2010—the first annual positive absorption since 2007—which has helped to reduce the vacancy rate to 10.9 percent in the fourth quarter of 2010, from 12.3 percent one year earlier. The average asking rent continued to fall, reaching $58.45 per square foot by the end of 2010, although the pace of decline slowed to 6.9 percent. The February Plan assumes that the vacancy rate will gradually fall to 9.4 percent by 2015, and that the average asking rent will rise to $72.61 per square foot (see Figure 7).
Although the economic recovery appears to be strengthening, many risks remain. The recent surge in oil prices, driven by turmoil in the Middle East, could depress economic activity if prices remain high. Rising commodity prices due to emerging market demand, coupled with higher oil prices, could increase the risk of inflation and cause the Federal Reserve to raise interest rates sooner than in 2012 as is currently expected (several other central banks have already raised rates). More protracted declines in home prices and a continuation of weak job gains could limit the growth in consumption. Ongoing debt problems in the Eurozone as well as fiscal issues in the United States affecting all levels of government could again rattle the financial and credit markets. At the local level, the drafting of regulations to implement federal financial reforms and the merger of the New York Stock Exchange with the Deutsche Boerse may have unexpected impacts on Wall Street profitability, and actions taken by New York State to address its budget gaps could have repercussions for the City’s health and education sector, a previously reliable source of job growth.
Manhattan Commercial Property
1993199419951996199719981999200020012002200320042005200620072008200920102011*2012*2013*2014*2015*
$0
$10
$20
$30
$40
$50
$60
$70
$80
$90
Dol
lars
per
Squ
are
Foo
t
0
2
4
6
8
10
12
14
16
18
Percent
Asking Rents Vacancy Rate
Source: Cushman & Wakefield
Figure 7
* City forecast

9
III. Changes Since the July Plan The July 2010 financial plan projected a balanced budget for FY 2011 and budget gaps of $3.3 billion for FY 2012, $4.1 billion for FY 2013, and $4.8 billion for FY 2014. Since then, the City has raised its tax revenue forecast by about $1 billion annually; drawn down reserves by $1.4 billion in FY 2011; and proposed a gap-closing program that would, if successful, generate $585 million in FY 2011 and about $1.5 billion annually thereafter (see Figure 8). For FY 2011, these resources helped produce a surplus of nearly $3.2 billion. While substantial, this was less than the $3.6 billion surplus that was rolled into FY 2011 from the prior year.
For FY 2012, the aforementioned resources permitted the City to replace most of the State aid that would be lost from the Governor’s proposed budget ($1.4 billion) and all of the expiring federal stimulus funds for education ($853 million), and to close the remaining budget gap. Despite the City’s higher revenue forecasts, the February Plan shows a budget gap of $4.9 billion for FY 2013—larger than forecast in July.
In November 2010, the Mayor proposed agency cuts that would generate about $1 billion annually beginning in FY 2012 and would reduce staffing by 8,264 positions, including 5,312 layoffs. (Most of the staff reductions are concentrated in the Department of Education.) The City also expects to realize nearly $1 billion in debt service savings during fiscal years 2011 and 2012 from lower-than-planned interest rates on variable rate debt obligations, funding shifts, and debt refundings. Although the City drew down reserves in FY 2011, it increased its reserves in subsequent years to $1 billion to fund higher pension contributions that could result from changes in actuarial assumptions that are currently under consideration. Medicaid costs were reduced in fiscal years 2011 and 2014, reflecting additional federal aid and other changes, but rose in fiscal years 2012 and 2013.
In February 2011, the City raised its revenue forecasts by about $1 billion annually, reflecting higher business profits, modest job growth, and a vibrant tourism sector. Real property tax collections are expected to be higher than previously forecast by $200 million in FY 2012, growing to $1.2 billion by FY 2015, based on the tentative property tax roll. The tentative roll showed higher growth in property values than anticipated in the July Plan, especially for commercial and large residential properties.
The February Plan also reflects the potential budgetary impact of the Governor’s proposed budget, which the City estimates would increase the City’s costs by $1.4 billion annually starting in FY 2012. The City allocated additional City funds to mitigate a cut in State education aid, revenue sharing, and mandated health and social service programs.

Office of the State Deputy Comptroller for the City of New York
10
After taking into account all of these changes, a budget gap of $600 million remains for FY 2012. To close the remaining gap, the City has proposed that the State partially restore cuts in education aid ($200 million) and revenue sharing ($200 million), and make changes to supplemental retirement benefits for police and firefighter retirees ($200 million). To help close future budget gaps, the Mayor is also asking the State to approve less costly pension benefits for new City employees.
Figure 8 Financial Plan Reconciliation
February 2011 Plan vs. July 2010 Plan (in millions)
Better/(Worse) FY 2011 FY 2012 FY 2013 FY 2014
Surplus/(Gap) as of July 2010 Plan $ - - - $ (3,257) $ (4,055) $ (4,835)
Revenues Business Tax and Audits 700 238 (13) (78) Sales Tax 366 442 274 108 Real Property Taxes 67 217 501 798 Personal Income Tax (81) 230 162 235 Other Taxes 18 (45) (115) (117) Subtotal 1,070 1,082 809 946 Non-Tax Revenues (51) (73) (27) (10) Total 1,019 1,009 782 936
Reserves Pension Reserve 600 (400) (400) (400) Prior-Years’ Expenses 500 - - - - - - - - - General Reserve 337 - - - - - - - - - Total 1,437 (400) (400) (400)
Gap-Closing Actions Agency Program 585 1,002 917 914 State Actions - - - 600 600 600 Pension Reform - - - - - - - - - 131 Total 585 1,602 1,517 1,645
State Budget Impact (48) (1,386) (1,393) (1,394)
Expenditures Federal Education Aid - - - (853) (853) (853) Health Insurance (3) (62) (125) (199) Medicaid 333 (194) (156) 315 Debt Service 283 680 3 12 Judgments and Claims 50 60 80 100 Other (505) (350) (252) (140) Total 158 (719) (1,303) (765)
Surplus/(Gap) $ 3,151 $ (3,151) $ (4,852) $ (4,813)
Surplus Transfer (3,151) 3,151 Gap as of February 2011 $ - - - $ - - - $ (4,852) $ (4,813)
Sources: NYC Office of Management and Budget; OSDC analysis

11
IV. Impact of the State Budget New York State projects a budget gap of more than $10 billion for the State fiscal year that begins April 1, 2011. To help close the budget gap and to narrow the gaps projected for future years, the Governor has proposed a number of actions, including reductions in aid to schools, aid to local governments, and Medicaid costs. The State Division of the Budget estimates that the Governor’s budget would reduce aid to New York City from the current level by $623 million in FY 2012, while the City estimates the impact at $2.1 billion. The City’s estimate is higher than the State’s mostly because the City’s financial plan had counted on large increases in State aid. Our analysis indicates that the budgetary impact would total $1.8 billion, which the City has mitigated by allocating additional City funds ($1.4 billion), requesting additional education aid ($200 million), and reallocating other resources.
Education Aid The Governor has proposed reducing education aid to New York City by $617 million in FY 2012, but the City had anticipated an increase of $738 million—a net budgetary shortfall of $1.4 billion. The City mitigated the impact by allocating an additional $1 billion of City funds to education, reallocating savings in the Department of Education from health insurance and debt service to educational programs, and by requesting an additional $200 million in State education aid.
The Governor has also proposed placing a statewide annual cap on State support for education capital projects. This proposal would reduce State support for the Department of Education’s capital program by $2 billion over the next three years, a reduction of 57 percent.
Aid and Incentives to Municipalities Last year, the State reduced payments to New York City under the Aid and Incentives to Municipalities (AIM) program by $302 million for FY 2011. Current State law would restore funding in FY 2012, which the City had anticipated in its financial plan, but the Governor has proposed eliminating payments to New York City. Other towns, villages, and cities would have their payments reduced by only 2 percent on the premise that they depend on this aid more than the City does. The Mayor believes the Governor’s proposal is inequitable, and has proposed instead that all municipalities be subject to the same percentage reduction in payments, which would provide the City with an additional $200 million.

Office of the State Deputy Comptroller for the City of New York
12
Medicaid Reform The Governor established a Medicaid Redesign Team (MRT) to recommend changes in the Medicaid program to the State Legislature in order to generate savings of $2.9 billion. The MRT includes representatives from the health care industry, including unions and providers, advocates, and elected officials. The savings target was reduced to $2.3 billion after the State Division of the Budget revised downward its forecast for enrollment and spending growth, and increased its projections for federal reimbursement based on an acceleration of certain payments.
The MRT recommended that the health care industry implement yet-unspecified cost-containment actions ($640 million); a 2 percent across-the-board reduction in provider reimbursement rates ($345 million); a $250,000 cap on medical malpractice awards for pain and suffering ($209 million); long-term care initiatives, including the elimination of spousal refusal to provide financial support for medical services ($188 million); the elimination of statutory growth in reimbursement rates ($186 million); the expansion of managed care to include elderly and disabled enrollees ($157 million); and pharmaceutical savings ($139 million).5 Even though New York City accounts for about two-thirds of statewide Medicaid enrollment, the budgetary impact on the City and the Health and Hospitals Corporation is less than initial concerns had anticpated.
The MRT also endorsed the Governor’s proposal to cap the growth in the Medicaid program to a ten-year rolling average of the medical care component of the Consumer Price Index. In addition, the Governor proposed that the State Legislaure grant the Department of Health the authority to reduce Medicaid utilization and reimbursement rates if the spending cap is exceeded, which has heretofore been a prerogative of the State Legislature.
Mandate Relief The Governor also appointed a task force to study how to make mandated programs more cost-effective. The initial report recommended that the State prohibit new mandates on local governments and school districts unless the State fully funds the mandate or the locality affirmatively votes to comply with the mandate. The task force also recommended that the State create a new pension tier for new employees, which would raise the retirement age, require employees to work longer before they qualify for a pension, increase the employee contribution rate, and eliminate overtime from benefit calculations.
5 The State Division of the Budget estimates that pharmaceutical initiatives will save $182 million, including
$42 million from a 2 percent across-the-board reduction in provider reimbursement rates.

13
V. Program to Eliminate the Gap In November 2010, the Mayor proposed an agency program to help balance the FY 2012 budget and to narrow the out-year gaps. The February Plan includes the agency program and some newly proposed State actions that would, in the aggregate, generate $1.6 billion in FY 2012 and nearly $1.8 billion by FY 2015 (see Figure 9). Since FY 2008, the City’s gap-closing programs have reduced planned spending by more than $5 billion beginning in FY 2012.
Figure 9 Program to Eliminate the Gap
(in millions)
FY 2011 FY 2012 FY 2013 FY 2014 FY 2015Agency Actions
Expense $ 535 $ 892 $ 827 $ 817 $ 815Revenue 50 110 90 97 98
Subtotal 585 1,002 917 914 913
State Actions Education Aid - - - 200 200 200 200Aid and Incentives to Municipalities - - - 200 200 200 200Uniform Variable Supplement Fund - - - 200 200 200 200Pension Reform - - - - - - - - - 131 252
Subtotal - - - 600 600 731 852
Total $ 585 $ 1,602 $ 1,517 $ 1,645 $ 1,765Sources: NYC Office of Management and Budget; OSDC analysis
A. Agency Actions
The February Plan includes the agency program proposed by the Mayor in November 2010, with some minor revisions that were made by the City Council. City agencies will generate $585 million in FY 2011, $1 billion in FY 2012, and about $900 million annually thereafter. Nearly 90 percent of the resources would come from expense reductions, and more than one-third of the program’s value is concentrated in the Department of Education. Overall, agency funding would be reduced by 2 percent from the level proposed in the July 2010 financial plan, and staffing would be reduced by 8,264 positions between fiscal years 2010 and 2012, including 5,312 layoffs (see Figure 10). About $40 million of the anticipated savings has not yet received necessary approvals by the unions, the courts, or the State.
The Department of Education was able to meet its FY 2011 cost reduction target without reducing classroom services by drawing on federal stimulus aid ($159 million), and from a State restoration of aid for special education ($51 million). The Mayor, however, has proposed that the Department of Education meet its FY 2012 target ($350 million) by eliminating 5,398 pedagogical positions, including 4,278 layoffs, which could further increase class sizes.

Office of the State Deputy Comptroller for the City of New York
14
Figure 10 Agency Program
(in millions)
Positions FY 2011 FY 2012
FY 2012 Target as a Percent of Agency City Funding
Department of Education 5,398 $ 220.6 $ 350.0 4.0 % Health and Social Services 513 109.7 135.6 5.9 Uniformed Agencies Police 350 43.1 67.1 1.3 Sanitation 269 25.1 76.0 5.0 Fire 77 7.9 35.9 2.0 Correction 95 4.9 9.9 0.8 Transportation 135 24.7 40.7 8.0 Libraries and Cultural Institutions 597 24.8 28.5 8.0 Citywide Administrative Services - - - 13.6 17.0 7.5 City University of New York 99 9.0 16.2 8.0 Finance 68 6.5 26.1 10.5 Parks 299 (4.9) 35.7 11.6 Procurement Savings - - - - - - 55.5 NA All Other Agencies 364 100.4 107.8 5.3
Total Agency Program 8,264 $ 585.4 $ 1,002.0 4.1 % Sources: NYC Office of Management and Budget; OSDC analysis
Agencies that provide health care and social services would reduce spending by $245 million over the course of this year and next. These agencies would eliminate 513 positions (228 layoffs) and reduce services to children, the homeless, and the poor. Proposed actions include reducing security guards in family shelters, eliminating 2,000 summer youth jobs, and scaling back on homemaking services.
The City’s four uniformed agencies would reduce costs by $189 million in FY 2012 and cut staffing by 791 positions. The Sanitation Department has re-estimated landfill and waste export costs ($50 million); would demote and redeploy 100 supervisors to collection duties; and would allow another 100 supervisory positions to remain vacant after the employees leave City service. The unions have opposed the demotions, which have been delayed for 55 supervisors until the City and the unions agree on whether seniority credits can be transferred. The Police Department intends to use federal funds rather than City funds to pay overtime ($36 million) and would eliminate 350 civilian positions. The Fire Department intends to restrict medical and light duty leave, which would reduce overtime costs ($15 million), and to eliminate 100 uniformed positions that currently perform administrative duties.
The February Plan also eliminates a reserve to offset the impact of inflation on procurement ($55 million); implements a furlough for 641 full-time workers for one week in the Department of Transportation; increases fees for safety and regulatory inspections; lays off 129 employees in the Department of Finance; and reduces aid to libraries and cultural institutions, including 597 layoffs.

15
B. State Actions
The Mayor has proposed a number of actions that require State approval, which would save the City $600 million during fiscal years 2012 and 2013, and even greater amounts in subsequent years. To the extent that these resources do not materialize, agencies will be expected to reduce costs by an equivalent amount.
As previously discussed, the February Plan assumes that the enacted State budget will include $200 million more in education aid for New York City than what was proposed by the Governor for FY 2012. The City could obtain some additional education aid because, in the past, the enacted State budget has included larger amounts of aid than first proposed by the Governor, and because the Governor has proposed awarding $500 million in education aid on a competitive basis. The February Plan also assumes that the enacted State budget will rescind $200 million of the proposed cut in AIM payments, which appears unlikely at this time.
The Mayor has also proposed that the State enact changes in the Variable Supplement Fund (VSF), which provides supplemental retirement benefits to police officers, firefighters, and correction officers. The February Plan assumes that this initiative would save the City $200 million annually beginning in FY 2012. While the VSF is codified in State law, it resulted from negotiations between the City and its unions. The VSF was first negotiated in 1970, and subsequent negotiations resulted in changes that permitted the City to withdraw $177 million to help balance its budget in exchange for fixed payments of $12,000 per retiree. The unions representing these employees believe the City should negotiate with them as it did in the past, rather than seek State legislative changes.
In an effort to hold down the growth in pension contributions, the Mayor has proposed that the State create new pension tiers that would raise the retirement age to 65 for new City civilian employees; increase the employee contribution to 5 percent of salary for each year of service for civilians and teachers; require uniformed employees to serve for at least 25 years to obtain full benefits; rescind a 7 percent tax-deferred annual annuity to teachers and other education employees; and eliminate overtime from benefit calculations for all employees.6 These changes could save the City $131 million in FY 2014, $252 million in FY 2015, and $619 million in FY 2018. The Mayor is also asking the State to rescind the restriction that prevents the City from bargaining with its unions over pension benefits. The restriction, which was enacted in 1973, was adopted in response to concerns about pension costs arising from benefit enhancements that were negotiated at the local level.7
6 The State Constitution prevents the lowering of pension benefits for existing employees, and reductions in
benefits for new City employees require State approval. 7 Report of the Permanent Commission on Employee Pension and Retirement Systems, January 15, 1972.

Office of the State Deputy Comptroller for the City of New York
16

17
VI. Revenue and Expenditure Trends The recent recession hit the City hard, with City fund revenues dropping abruptly by $2.5 billion in FY 2009 and then remaining depressed in FY 2010. The rate of expenditure growth slowed in these years, but spending still outpaced revenues. The budgets were balanced by raising taxes, drawing down reserves accumulated during the last economic expansion, cutting agency budgets, and the receipt of federal stimulus funds. As shown in Figure 11, budget relief from federal stimulus aid is expected to drop precipitously in FY 2012, which will have to be replaced with funding from other sources.
As the economy has improved, revenue growth has strengthened. City fund revenues are projected to grow by 5.7 percent in FY 2011 to $44.3 billion (see Figure 12), which will bring collections above the pre-recession level. Revenues are projected to grow by 5.6 percent in FY 2012, but City-funded expenditures are projected to grow by 11.5 percent. The City intends to balance the FY 2012 budget with $4.4 billion in nonrecurring resources, including $3.2 billion in surplus resources generated in FY 2011.
While expenditure growth is expected to slow during fiscal years 2013 through 2015 (4.1 percent), spending is projected to outpace the growth in revenues (3.2 percent). As a result, the City projects budget gaps of nearly $5 billion annually during these years.
Figure 12
Note: Adjusted for surplus transfers and debt defeasances. Also adjusted for debt service costs for PIT-backed TFA and TSASC bonds.
Sources: NYC Comptroller; NYC Office of Management and Budget; OSDC analysis
2004
2005
2006
2007
2008
2009
2010
2011
2012
2013
2014
2015
Fiscal Year
30
35
40
45
50
55
60
Bill
ions
of
Dol
lars
Revenues
Expenditures
Revenue and Expenditure Trends
Actual City Forecast
Sources: NYC Office of Management and Budget; OSDC analysis
2009
2010
2011*
2012*
2013*
2014*
Fiscal Year
0
0.5
1
1.5
2
2.5
3
Bil
llion
s of
Dol
lars
Figure 11
Federal Stimulus Funds for New York City
* City forecast

Office of the State Deputy Comptroller for the City of New York
18
A. Revenue Trends
The City has significantly raised its revenue forecast since the November Plan. The February Plan assumes that City fund revenues will grow by 5.7 percent in FY 2011, more than double the growth rate in FY 2010 and the highest level of growth since FY 2007 (see Figure 13). As a result, City fund revenues will reach $44.3 billion, which exceeds the level of collections in FY 2008 before the economic downturn.
This marks a rapid rebound from the 5.8 percent decline experienced in FY 2009, and has been driven by stronger tax revenue collections—reflecting both the improvement in the economy as well as tax rate increases. Total tax revenues are now forecast to grow by 7.5 percent in FY 2011 to reach nearly $40 billion, which also exceeds the level before the economic downturn (collections fell by 7.1 percent in FY 2009).
Tax revenue growth is forecast to slow to 4.8 percent in FY 2012 and then average 3.4 percent in fiscal years 2013 to 2015. The slowdown reflects the City’s forecast of a relatively modest economic expansion, which holds down growth in nonproperty tax revenues. As a result, total City fund revenues are projected to grow by 5.6 percent in FY 2012 and by an average of 3.2 percent annually in fiscal years 2013 through 2015.
The City’s revised revenue forecasts reflect a stronger-than-expected economic recovery (including stronger job and income growth and the second-best year on record for Wall Street profits). In addition, stronger real property tax growth (based on the recent tentative property tax roll for FY 2012) helps boost projected real estate tax collections, particularly in the out-years of the financial plan.
While the City’s estimates are not unreasonable, they are significantly less conservative than in prior years. Consequently, the potential for additional revenues is reduced and the potential for future shortfalls is increased.
Details of the City’s revenue trends are discussed below and shown in Figure 14.
1997
1998
1999
2000
2001
2002
2003
2004
2005
2006
2007
2008
2009
2010
2011*
2012*
2013*
2014*
2015*
Fiscal Year
02468
101214161820
-2-4-6-8
Per
cent
Cha
nge
Note: Adjusted for debt service on TFA and tobacco bonds, and the transfer of TSASC revenues.Sources: NYC Comptroller; NYC Office of Management and Budget; OSDC analysis
Figure 13
Annual Changes in City Fund Revenues and Tax Revenues
Total Tax RevenuesCity Fund Revenues
* City forecast

19
Figure 14 City Fund Revenues
(in millions)
Note: Miscellaneous revenues include debt service on tobacco bonds. Sources: NYC Comptroller; NYC Office of Management and Budget; OSDC analysis
1. Business Taxes After declining for three consecutive years, collections from business taxes (including audits) are projected to grow by $859 million in FY 2011, and then grow slowly in subsequent years. Excluding audits, tax collections are projected to increase by 19.1 percent in FY 2011, the first increase in business tax collections since FY 2007 (see Figure 15).
The rebound reflects improvements across both the financial and nonfinancial sectors of the City’s economy. The rebound in Wall Street and commercial banking profitability has been especially strong. Bank tax collections are forecast to rise by 28.4 percent in FY 2011 to $1.2 billion, their highest level ever. While the general corporation tax is forecast to rise by 22.2 percent in FY 2011 to $2.4 billion, collections would remain more than one-fifth below their pre-recession peak.
The growth in business tax collections is forecast to slow to 4.9 percent in FY 2012 and then to an average of 3.1 percent during the rest of the plan period. The slowdown reflects the City’s forecast of lower Wall Street profits (due to rising interest rates and the impact of financial reforms) and a decline in corporate profits for calendar year 2011. As a result of the slowdown in growth, total business tax collections are projected to remain below their pre-recession levels in FY 2015.
FY 2011 FY 2012 Annual Growth FY 2013 FY 2014 FY 2015
Average Three-Year
Growth Rate Taxes
Real Property Tax $ 16,847 $ 17,643 4.7% $ 18,197 $ 18,632 $ 19,062 2.6% Personal Income Tax 7,476 8,170 9.3% 8,435 8,925 9,521 5.2% Sales Tax 5,509 5,797 5.2% 5,939 6,086 6,345 3.1% Business Taxes 5,365 5,630 4.9% 5,762 5,966 6,165 3.1% Real Estate Transaction Taxes 1,212 1,272 5.0% 1,337 1,468 1,676 9.6% Other Taxes 2,705 2,762 2.1% 2,847 2,908 2,971 2.5% Audits 868 645 -25.7% 644 651 651 0.3% Subtotal 39,982 41,919 4.8% 43,161 44,636 46,391 3.4%
Miscellaneous Revenues 4,364 4,324 -0.9% 4,376 4,443 4,472 1.1% Unrestricted Intergovernmental Aid 14 12 -14.3% 12 12 12 0.0% Anticipated State and Federal Aid - - - 600 NA 600 600 600 0.0% Grant Disallowances (15) (15) 0.0% (15) (15) (15) 0.0%
Total $ 44,345 $ 46,840 5.6% $ 48,134 $ 49,676 $ 51,460 3.2%
1997
1998
1999
2000
2001
2002
2003
2004
2005
2006
2007
2008
2009
2010
2011*
2012*
2013*
2014*
2015*
0
1
2
3
4
5
6
7
8
Bil
lions
of
Dol
lars
Sources: NYC Comptroller; NYC Office of Management and Budget
Figure 15
Business Tax Revenues
* City forecast

Office of the State Deputy Comptroller for the City of New York
20
2. Real Property Taxes Real property tax collections are forecast to grow by 4.1 percent in FY 2011. Although the City’s residential and commercial property markets weakened during the recession, collections continued to grow as a result of the phase-in of earlier gains in property values. The phase-in, augmented by mid-year tax rate increases in fiscal years 2003 and 2009, has enabled property tax collections to increase every year since FY 1998 (see Figure 16). Based on stronger property tax values from the FY 2012 tentative tax roll, beginning next year real property tax revenues are forecast to grow at a faster rate than had been projected in July 2010. In FY 2012, revenues are expected to grow by 4.7 percent, and although growth is expected to ease during the final three years of the financial plan period (to an average of 2.6 percent annually), the improvement relative to last July’s forecast generates significant additional revenues by the end of the plan period. The slowdown in the projected rate of growth beginning in FY 2013 reflects the City’s expectation that rising interest rates will increase the capitalization rates used to assess income-producing commercial and large residential properties, thereby limiting growth in market value. If net income for these properties rises faster than interest rates, however, the assessment provisions mandated by State law could increase revenues at a faster rate than the City expects.
3. Real Estate Transaction Taxes Tax collections from real estate transactions are projected to rise by 23.6 percent in FY 2011—the first increase since FY 2007—to reach $1.2 billion. Collections, however, are still about two-thirds lower than the peak reached in FY 2007, when collections totaled nearly $3.3 billion (see Figure 17). The growth reflects a slowly improving commercial real estate market, where the number of commercial transactions, particularly in Manhattan, increased by 17 percent in calendar year 2010 while the value of transactions rose by 50.3 percent. Collections were boosted by the sale of the former Port Authority building at 111 Eighth Avenue to Google for $1.8 billion, which generated more than $40 million in real property transfer taxes.
1997
1998
1999
2000
2001
2002
2003
2004
2005
2006
2007
2008
2009
2010
2011*
2012*
2013*
2014*
2015*
0.0
0.5
1.0
1.5
2.0
2.5
3.0
3.5
Bil
lion
s o f
Dol
lars
Sources: NYC Comptroller; NYC Office of Management and Budget
Figure 17
Real Estate Transaction Tax Revenues
* City forecast
1997
1998
1999
2000
2001
2002
2003
2004
2005
2006
2007
2008
2009
2010
2011*
2012*
2013*
2014*
2015*
4
8
12
16
20
Bil
lio n
s of
Dol
lars
Sources: NYC Comptroller; NYC Office of Management and Budget
Figure 16
Real Property Tax Revenues
* City forecast

21
The City’s residential real estate market has not improved as fast as the commercial market has, and although transactions have risen slightly (helped by the federal home buyer tax credit), additional price declines are anticipated in the February Plan. The Plan assumes that residential transactions will remain weak in FY 2012, reflecting the expiration of the tax credit and rising mortgage rates, and will offset some of the continued growth in tax collections from commercial transactions, holding the overall growth in transaction taxes that year to 5 percent. Over the balance of the financial plan period, an expected rebound in home prices will help lift average annual transaction tax growth to 9.6 percent.
New York City already has the strongest commercial real estate market in the nation, and future prospects are encouraging, given job gains and increased business activity; however, residential home values remain at risk. Data from the S&P/Case-Shiller Home Price Index for the New York City metropolitan area showed small increases in home values in the first part of 2010—but more recently, values are again declining. In December 2010, home values were 2.1 percent lower than one year earlier. Home values are likely to remain depressed by the large inventory of foreclosure properties, which will take an extended period of time for the market to absorb, given the length of the foreclosure process in New York State.
4. Sales Tax Sales tax revenues are forecast to rise by 8.9 percent in FY 2011 to $5.5 billion (see Figure 18). This is only slightly less than the 10.1 percent gain in FY 2010, which was boosted by a tax rate increase. The strong growth this year reflects the record level of tourism and the recovery in consumer spending, especially evident during the recent holiday season.
In FY 2012, the City forecasts that improving economic conditions, along with continued strength in tourism, will boost sales tax collections. The expiration of the temporary federal social security payroll tax reduction, however, is expected to reduce consumption spending, thereby holding growth in sales tax collections to 5.2 percent. During fiscal years 2013 through 2015, the average annual rate of revenue growth is projected to ease to 3.1 percent.
1997
1998
1999
2000
2001
2002
2003
2004
2005
2006
2007
2008
2009
2010
2011*
2012*
2013*
2014*
2015*
0
1
2
3
4
5
6
7
Bill
ions
of
Dol
lars
Sources: NYC Comptroller; NYC Office of Management and Budget
Figure 18
Sales Tax Revenues
* City forecast

Office of the State Deputy Comptroller for the City of New York
22
5. Personal Income Tax Rising employment and wages are forecast to lift personal income tax collections by 9 percent in FY 2011, to nearly $7.5 billion (see Figure 19). This continues the recovery that began in FY 2010, when collections rose by 4.1 percent. The recession and financial crisis had a severe impact on personal income tax collections, with job losses and a decline in Wall Street bonuses in 2008 causing collections to fall by nearly 25 percent in FY 2009.
Despite the strong growth in FY 2011 collections, the City’s forecast is slightly lower than it was at the beginning of the fiscal year, as the extension of the Bush-era federal income tax cuts did not create an incentive for taxpayers to accelerate income into 2010 in order to avoid a tax increase in 2011.
More rapid employment growth, along with wage gains, is expected to fuel growth of 9.3 percent in personal income tax collections during FY 2012. During fiscal years 2013 through 2015, employment and wage gains are expected to stabilize at relatively modest rates (about 1.1 percent and 3.7 percent, respectively), resulting in average annual growth of 5.2 percent in personal income tax collections.
B. Expenditure Trends City-funded expenditures are projected to grow by nearly $5.2 billion in FY 2012, or 11.5 percent (after adjusting for surplus transfers and debt defeasances), which is more than five times the projected local inflation rate (see Figure 20).8 Rising pension contributions ($1.4 billion), Medicaid ($1.3 billion), and salaries ($827 million) account for more than half of the growth.
Pension contributions are projected to rise by more than 20 percent in FY 2012, assuming the implementation of revised actuarial assumptions, such as a reduction in
8 Debt defeasances executed during fiscal years 2007 and 2008, when the City had large surpluses, benefited
FY 2010 by $2.7 billion.
Figure 20
Growth in City-Funded Expenditures
Note: Adjusted for surplus transfers, defeasances, and TSASC. Sources: NYC Comptroller; NYC Office of Management and Budget; OSDC analysis
&
&& &
&
&& & & &
2006
2007
2008
2009
2010
2011*
2012*
2013*
2014*
2015*
Fiscal Year
0123456789
10111213
Per
cent
Expenditures
Inflation&
*City forecast
1997
1998
1999
2000
2001
2002
2003
2004
2005
2006
2007
2008
2009
2010
2011*
2012*
2013*
2014*
2015*
0.0
2.0
4.0
6.0
8.0
10.0
Bil
lion
s of
Dol
lars
Sources: NYC Comptroller; NYC Office of Management and Budget
Figure 19
Personal Income Tax Revenues
* City forecast

23
the investment earnings assumption. The growth in Medicaid reflects the expiration of extraordinary federal stimulus aid provided to states during the recession.
Salary and wage costs are projected to rise by 7.1 percent in FY 2012, reflecting the Mayor’s decision to replace with City funds proposed cuts in State education aid ($1 billion) and the expiring federal stimulus grants for education assistance ($853 million); a two-year wage freeze proposed by the Mayor; and planned staff reductions. As of January 31, 2011, the City-funded workforce had declined by 5,713 employees since the beginning of FY 2011, and the City intends to reduce staffing by another 4,534 employees by the end of FY 2012. Other factors that contribute to the relatively high rate of growth include higher debt service ($548 million) and health insurance costs ($349 million), and a drawdown of reserves in FY 2011.
Figure 21 Estimated City-Funded Expenditures
(Adjusted for Surplus Transfers, TSASC, and Debt Defeasances) (in millions)
Annual Growth
Average
Three-Year Growth Rate FY 2011 FY 2012 FY 2013 FY 2014 FY 2015
Salaries and Wages $ 11,633 $ 12,460 7.1 % $ 12,668 $ 12,916 $ 13,364 2.4 % Pension Contributions 6,834 8,255 20.8 % 8,401 8,280 8,557 1.2 % Medicaid 4,698 6,007 27.9 % 6,192 6,329 6,508 2.7 % Debt Service 4,901 5,449 11.2 % 6,436 6,686 7,040 8.9 % Health Insurance 3,882 4,233 9.0 % 4,632 5,041 5,546 9.4 % Other Fringe Benefits 2,681 2,924 9.1 % 2,981 3,097 3,158 2.6 % Energy 906 947 4.5 % 989 1,010 1,028 2.8 % Judgments and Claims 637 675 6.0 % 705 738 774 4.7 % Public Assistance 561 539 -3.9 % 583 583 583 2.6 % General Reserve 100 300 NA 300 300 300 NA Drawdown Retiree Health Benefits Trust (395) (672) NA - - - - - - - - - NA Prior Year’s Expenses (500) - - - NA - - - - - - - - - NA Other 8,901 8,874 -0.3 % 9,099 9,509 9,579 2.6 %
Total $44,839 $ 49,991 11.5 % $ 52,986 $ 54,489 $ 56,437 4.1 % Notes: Debt service includes bonds issued by TSASC. Sources: NYC Office of Management and Budget; OSDC analysis
The February Plan is based on the trends shown in Figure 21, as discussed below.
1. Collective Bargaining
The City reached labor agreements with all of its major unions for the previous round of collective bargaining (fiscal years 2009 and 2010), with the exception of the United Federation of Teachers (UFT). At the time the February Plan was released, more than 90 percent of the City workforce was working without a contract in the current round (fiscal years 2011 and 2012), and the outcome of collective bargaining negotiations may not be determined for some time.

Office of the State Deputy Comptroller for the City of New York
24
In January 2010, the City reduced its offer of wage increases to the UFT and the Council of School Supervisors and Administrators (CSA) for the previous round of bargaining, from 4 percent annually to 2 percent annually (limited to the first $70,000 of an employee’s salary)—even though the City negotiated 4 percent annual wage increases with other civilian employees. The City used the savings to replace a previously planned cut in funding for educational programs, and to fund unplanned special education costs. In June 2010, the City eliminated the remaining 2 percent in annual raises and used those savings to mitigate a cut in State education aid and to avoid teacher layoffs. These unilateral changes reduced planned spending by $272 million in FY 2010, $626 million in FY 2011, and $900 million annually beginning in FY 2014. At the request of the UFT and the City, the State Public Employment Relations Board (PERB) appointed a mediator and is establishing a fact-finding panel to facilitate negotiations, but a resolution does not appear to be imminent. The recommendations of the panel (which are nonbinding), however, could serve as a framework for a new labor agreement.
The last contract between the City and the Patrolmen’s Benevolent Association (PBA) expired on July 31, 2010. In 1998, the State transferred the responsibility for handling police officer contract disputes from the City’s Office of Collective Bargaining to the PERB. According to State law, any arbitration award made by the PERB for the PBA is binding on both parties. Since then, all of the wage agreements between the City and the PBA have been reached based on PERB awards, with the exception of the most recent contract agreement. That agreement was negotiated by the City and the PBA without PERB mediation, and provided for four annual wage increases of 4 percent, following the pattern set by other uniformed unions.
More recently, the Mayor has called on the municipal unions to self-fund wage increases in the current round with savings from productivity enhancements and from restructuring fringe benefits. If wages for all City employees were to rise at the projected inflation rate without any offsetting savings, costs would increase by $640 million in FY 2012, $1.1 billion in FY 2013, and $1.9 billion by FY 2015.
In addition, the Mayor has called on the State to enact legislation to end State oversight of the City’s civil service system actions; to permit the City and the unions to negotiate changes to employee pension benefits as a part of the collective bargaining process; and to provide managers with greater discretion in recruiting, hiring, training, and developing City employees. Union leaders have expressed their concern that the proposed changes (many of which require changes to State law) would reduce the ability to protect public employees from favoritism, and would allow the City to lower personnel costs by replacing more experienced senior staff with new hires.

25
Figure 22
Sources: NYC Comptroller; NYC Office of Management and Budget; OSDC analysis
* City forecast
2001
2002
2003
2004
2005
2006
2007
2008
2009
2010
2011*
2012*
2013*
2014*
2015*
Fiscal Year
0
1
2
3
4
5
6
7
8
Bill
ions
of
Dol
lars
(City-Funded)Pension Contributions
Reserve for Changes in Actuarial
Assumptions
2. Pension Contributions
City pension contributions averaged $1.4 billion during the 1990s, but grew rapidly beginning in FY 2003 after the State raised benefits and after pension fund investments fell short of expectations (see Figure 22). The February Plan assumes that contributions will reach $8.6 billion by FY 2015, reflecting an annual reserve of $1 billion beginning in FY 2012 for potential changes in actuarial assumptions and recent investment performance (the pension funds fell short of their investment earnings target of 8 percent in five of the past ten years). The estimates also reflect the Mayor’s proposals to reduce retirement benefits to new City employees (for a detailed discussion, see the “Program to Eliminate the Gap” section of this report).
As required by the City Charter, an independent actuarial consultant has been conducting a biennial review of the assumptions and methods used to calculate contributions to the City’s pension funds. The report will be completed shortly and will likely recommend changes to reflect recent trends, such as higher salaries, longer life expectancies, and lower-than-anticipated investment earnings. The overall cost to the City will not be known until the consultant’s report is made public and the City Actuary has an opportunity to make his own recommendations to the boards of trustees of the pension funds, who must approve the changes. While the cost of such changes may exceed the $1 billion annual reserve created by the City for this purpose, the actual cost and the date of implementation have not been determined.
Many public pension systems have reduced or are considering a reduction to their investment earnings assumption, because earnings from the equities market are expected to be lower in the future. The New York State and Local Retirement System (NYSLRS) recently lowered its earnings assumption from 8 percent to 7.5 percent. The City’s five actuarial pension systems currently assume an 8 percent return on investment; any changes would require State approval.
The pension funds have earned more than 17 percent on their investments through March 18, 2011, but the equity markets have become increasingly volatile in response to the current turmoil in the Middle East and the unfolding crisis in Japan. If earnings are maintained through the end of the fiscal year, the City’s pension contributions could be lower by $93 million in FY 2013, $179 million in FY 2014, and $259 million in FY 2015.

Office of the State Deputy Comptroller for the City of New York
26
In May 2007, the Governmental Accounting Standards Board (GASB) issued Statement No. 50 to improve transparency and comparability concerning the financial condition of public pension systems. Statement No. 50 establishes standards for measuring and reporting the funded status of public pension plans.9 The funded status of the City’s five pension systems (which began reporting their funded status using this methodology even before the new GASB requirement was adopted) has declined, on average, from 107.9 percent in FY 2001 to 70.9 percent in FY 2010—which effectively defers an accrued unfunded liability of $42.4 billion to future taxpayers.10
3. Health Insurance
Despite a June 2009 agreement between the City and its unions to reduce the growth in health insurance costs, the February Plan assumes that health insurance costs will rise from $3.3 billion in FY 2010 to $5.5 billion by FY 2015 (see Figure 23), an increase of 66 percent. The City anticipates that insurance premiums for active employees will rise by 9.8 percent in FY 2012 and by 9.5 percent annually thereafter, in line with historical rates of growth.11
4. Uniformed Agencies
The City’s uniformed agencies spent $910 million on overtime in FY 2010, the highest level since the record set after the terrorist attacks of September 11, 2001 (see Figure 24). The Police Department spent $540 million on overtime in FY 2010, and is on track to spend a similar amount in the current year. Although the department is likely to continue this trend, the City has allocated $150 million less for FY 2012 and each succeeding year.
9 The funded status is a ratio of pension assets available to cover the projected cost of pension benefits
accrued for past employee service (on an actuarial basis). 10 The funded status of the New York State and Local Retirement System was 101.5 percent in State fiscal year 2009-
2010.
11 Health insurance premiums for retirees are projected to rise by 8 percent annually.
1998
1999
2000
2001
2002
2003
2004
2005
2006
2007
2008
2009
2010
2011*
2012*
2013*
2014*
2015*
Fiscal Year
0
1
2
3
4
5
Bill
ions
of
Dol
lars
Sources: NYC Comptroller; NYC Office of Management and Budget; OSDC analysis
Figure 23
* City forecast
Health Insurance Costs(City-Funded)
2000
2001
2002
2003
2004
2005
2006
2007
2008
2009
2010
2011*
2012*
Fiscal Year
0
100
200
300
400
500
600
700
800
900
1,000
Mil
lions
of
Dol
lars
Overtime Spending by the Uniformed Agencies
Sources: NYC Office of Management and Budget; OSDC analysis
Figure 24
*City forecast
(Total Funds)

27
Figure 25
Sources: NYC Human Resources Administration; OSDC analysis
Jan -08
Apr -08
Jul-08
Oct -08
Jan-09
Apr -09
Jul-09
Oct -09
Jan -10
Apr -10
Jul -10
Oct -10
Jan -11
2.50
2.55
2.60
2.65
2.70
2.75
2.80
2.85
2.90
2.95
Mill
ions
of
Peo
ple
2006
2007
2008
2009
2010
2011*
2012*
2013*
2014*
2015*
Fiscal Year
3
4
5
6
7
Bil
lion
s o f
Dol
lars
City Funds Federal Stimulus Aid
Enrollment City-Funded ExpendituresMedicaid
* City forecast
The outcome of litigation and proposed cost-saving measures in the Fire Department could increase overtime costs in FY 2012. The Mayor had proposed closing 20 fire companies, but the Mayor and the City Council agreed to rescind the closings for two years. The February Plan assumes that the companies will close effective July 1, 2011. In addition, the Fire Department has moved forward on a proposal to reduce staffing on 60 engines from five firefighters to four, but the firefighters’ union believes that the City does not have the authority to unilaterally eliminate the fifth post and is seeking judicial relief. Also, a federal court recently ruled that the department’s hiring practices are racially discriminatory, and imposed a hiring ban. The department is developing a new firefighter’s exam and expects the ban to be lifted during the summer of 2012, after the new exam is approved by the federal court.
5. Medicaid
Enrollment in the federal Medicaid program reached 2,903,849 people in New York City in January 2011, an increase of 14 percent since January 2008 (see Figure 25). Enrollment is likely to continue to grow, because unemployment remains high and because federal health care reform expands Medicaid eligibility and mandates that most individuals obtain health insurance. Even though State law limits the annual growth in the local share of Medicaid to about 3 percent, the City-funded cost of this program is expected to grow from $5 billion in FY 2010 to $6.5 billion in FY 2015, reflecting the expiration of temporary federal stimulus aid.
In June 2010, the State enacted legislation that calls for a phased-in, five-year takeover of Medicaid administration from the counties and New York City—with completion scheduled for April 2016. The takeover has moved slowly, and the impact on New York City and its employees remains unclear. How the takeover will affect county and City budgets has yet to be resolved, and any change in State reimbursement for administration is subject to approval of the State budget director. The State is currently analyzing local government functions and the costs of Medicaid administration before determining how to transition to State administration. If the takeover were to proceed, under civil service law about 3,100 county and 2,500 City employees who provide Medicaid could be transferred to State employment—a change that could significantly affect union membership and employee compensation.

Office of the State Deputy Comptroller for the City of New York
28
6. Debt Service
City-funded debt service (adjusted for defeasances and surplus transfers12) is projected to reach $6.4 billion by FY 2013 (see Figure 26). This is 31 percent more than projected for FY 2011, despite the Mayor’s proposal to curtail planned capital spending by 10 percent.13 Debt service is expected to continue to grow during the financial plan period and will reach more than $7 billion by FY 2015. At that time, debt service will consume 13.7 percent of City fund revenues, compared with 11.1 percent in FY 2011.
As previously discussed, the City anticipates significant savings on debt during fiscal years 2011 and 2012 as a result of historically low short-term interest rates. Our analysis indicates that, based on current interest rates, debt service could be lower by another $50 million in FY 2011.
The outstanding debt of the City and City-related entities has risen steadily over the past 30 years.14 Debt outstanding grew from $13.4 billion in FY 1980 to $87.1 billion in FY 2010 (see Figure 27), and could exceed $106 billion by FY 2015. The FY 2010 amount equates to about $10,000 per capita, $4,000 higher than ten years earlier.
12 The City used surplus resources in fiscal years 2007 and 2008 to defease debt due in fiscal years 2009 and
2010. These nonrecurring actions reduced debt service by $675 million in FY 2009 and by $2.7 billion in FY 2010. The FY 2011 estimate reflects net savings of $280 million from debt refundings and redemptions.
13 We estimate the Mayor’s proposal would reduce debt service by only $137 million through FY 2015, but cumulative savings could total $800 million by FY 2021.
14 City and City-related debt includes General Obligation (GO) debt, Municipal Water Finance Authority (MWFA) debt, TFA-PIT debt, lease and guaranteed debt, Hudson Yards Infrastructure Corporation (HYIC) debt, TSASC debt, Fiscal Year 2005 Securitization Corporation (FSC) debt, Jay Street Development Corporation (JSDC) debt, and Municipal Assistance Corporation (MAC) debt.
2000
2001
2002
2003
2004
2005
2006
2007
2008
2009
2010
2011*
2012*
2013*
2014*
2015*
Fiscal Year
3
4
5
6
7
8
Bil
lion
s of
Do l
lars
10
11
12
13
14
15
Percentage of C
ity Fund R
evenues
City-Funded Debt Service
Savings Due to Capital Reductions
Percentage of City Fund Revenues
Figure 26
Note: Debt service amounts are adjusted for prepayments and debt defeasances.Sources: NYC Comptroller; NYC Office of Management and Budget; OSDC analysis
* City forecast
Debt Service(City-Funded)
19801981198219831984198519861987198819891990199119921993199419951996199719981999200020012002200320042005200620072008200920102011*2012*2013*2014*2015*
Fiscal Year
0
10
20
30
40
50
60
70
80
90
100
110
Bil
lions
of
Dol
lars
GO TFA MWFA Other
Figure 27
Note: TFA excludes Building Aid Revenue Bonds; “Other” includes lease and guaranteed debt, HYIC, TSASC, FSC, JSDC, and MAC.
Sources: NYC Comptroller; NYC Office of Management and Budget; OSDC analysis
City and City-Related Debt Outstanding
* City forecast

29
7. Public Assistance
The City’s public assistance caseload has grown by 3.6 percent since January 2009 to reach 351,807 recipients in January 2011. Spending has grown more rapidly than the caseload, increasing from $489 million in FY 2009 to $561 million in FY 2011 (about 15 percent). About $30 million of the increase is due to an expansion in rent subsidy programs for homeless people seeking permanent housing. The remaining growth ($42 million) is due to increases in caseload and benefits.
8. Homeless Services
In January 2011, 9,824 families and 8,766 single adults resided in City shelters (see Figure 28). Another 2,000 single adults resided in faith-based shelters; special housing programs for veterans and the long-term homeless; and drop-in centers. Despite City efforts to increase placements in permanent housing, federal support for rent subsidy programs has not kept up with demand. Last year, the annual number of people seeking shelter in the City reached 113,553—the highest number since FY 2002.
9. Judgments and Claims
The City projects that judgments and claims will grow at an average annual rate of 6.5 percent during the financial plan period (see Figure 29). While the City has had success reducing judgments and claims in certain areas (such as medical malpractice at public hospitals, and sidewalk claims), growth continues in other areas, including police actions and roadways.
Sources: NYC Department of Homeless Services; OSDC analysis
Jan -08A
pr -08Jul -08O
ct -08Jan -09A
pr -09Jul -09O
ct -09Jan -10A
pr -10Jul -10O
ct -10Jan -10
7,000
7,500
8,000
8,500
9,000
9,500
10,000
10,500
11,000
Num
ber
of F
amili
es
Jan -08A
pr -08Jul -08O
ct -08Jan -09A
pr -09Jul -09O
ct -09Jan -10A
pr -10Jul -10O
ct -10Jan -10
5,000
5,500
6,000
6,500
7,000
7,500
8,000
8,500
9,000
Num
ber
of P
e opl
e
Families Single Adults
Figure 28
Homeless Shelter Residents
Figure 29
Judgments and Claims
Sources: NYC Comptroller; NYC Office of Management and Budget; OSDC analysis
1996
19971998
1999
2000
20012002
2003
20042005
2006
20072008
2009
2010
2011*2012*
2013*
2014*2015*
Fiscal Year
0
100
200
300
400
500
600
700
800
Mill
ions
of
Dol
lars
*City forecast
(City-Funded)

Office of the State Deputy Comptroller for the City of New York
30
10. Energy Costs
The City’s energy costs nearly doubled from about $400 million in FY 2000 to $800 million by FY 2008, which reflected rising oil and natural gas prices (see Figure 30). Higher charges from utility companies and higher oil prices driven by rising demand from developing nations are expected to raise energy costs to $900 million in FY 2011 and to more than $1 billion by FY 2014. Political unrest in the Middle East could increase these costs faster.
2000
2001
2002
2003
2004
2005
2006
2007
2008
2009
2010
2011*
2012*
2013*
2014*
2015*
Fiscal Year
0
100
200
300
400
500
600
700
800
900
1,000
1,100
Mil
lions
of
Dol
lars
* City forecast
Sources: NYC Comptroller; NYC Office of Management and Budget; U.S. Energy Information Administration; OSDC analysis
Figure 30
Energy Costs(City-Funded)

31
VII. Other Issues The following section discusses the financial condition of certain public entities that have a financial relationship with the City.
A. Department of Education
In 2007, the Governor and the Mayor agreed to increase funding to the City Department of Education as a result of the Campaign for Fiscal Equity (CFE) lawsuit, which claimed that the State did not adequately fund large school districts. The State agreed to increase funding by $3.2 billion over a four-year period and the City agreed to increase funding by $2.2 billion over the same period. The State also agreed to fund half of the Department’s capital program by allowing the Transitional Finance Authority to issue bonds backed by State building aid (up to $9.4 billion in debt outstanding).
City funding for education is projected to reach $13.6 billion by FY 2012, twice the FY 2002 level (see Figure 31). Since FY 2007, City funding will have grown by $4.3 billion, more than twice the amount promised. The increases reflect the City’s commitment under the CFE litigation, and an allocation of nearly $1.9 billion to replace cuts in State education aid ($1 billion) and expiring federal stimulus funds ($853 million).
State funding will have increased by only $1.1 billion—only one-third of the amount promised in 2007—as the State cuts education aid to schools in an effort to balance its budget. The Governor has also proposed placing an annual cap on State support for education capital projects, which would reduce State support to the department’s capital program by $2 billion over the next three years, a reduction of 57 percent.
In November 2010, the Mayor proposed an agency gap-closing program to help balance the FY 2012 budget, which would reduce planned spending at the Department by $350 million. This initiative would reduce staffing by 5,398 teachers between June 2011 and June 2012, but other changes would increase the planned reduction to 6,166 teachers by June 2012, including 4,666 layoffs. The Mayor and the Governor have each proposed legislation that would allow the City to consider performance as a determining criteria if teachers need to be laid off, rather than only considering seniority as is currently the law.
Department of EducationSources of Funding
2002
2003
2004
2005
2006
2007
2008
2009
2010
2011*
2012*
City Fiscal Year
0
2
4
6
8
10
12
14
Bil
lion
s of
Dol
lars
NYC NYS Federal
Figure 31
Sources: NYC Office of Management and Budget; OSDC analysis
* City forecast

Office of the State Deputy Comptroller for the City of New York
32
B. Health and Hospitals Corporation
Over the financial plan period, expenditures at the Health and Hospitals Corporation (HHC) are expected to increase by 10 percent and revenues are expected to increase by 4 percent, resulting in projected gaps of $377 million in FY 2011, $450 million in FY 2012, $636 million in FY 2013, $781 million in FY 2014, and $866 million in FY 2015. To reduce the gaps, the HHC plans to consolidate affiliation contracts, patient care, and administrative functions, and to reduce staff (including layoffs), which could provide savings of $43 million in FY 2011, $164 million in FY 2012, $285 million in FY 2013, and $325 million in each of FY 2014 and FY 2015. The remaining gaps will be closed by implementing unspecified management actions of $250 million during FY 2014 and $450 million during FY 2015, and by drawing down projected cash reserves. The HHC’s projected cash reserves assume the receipt of $500 million in recurring annual supplemental Medicaid payments. These payments are subject to annual federal approval, which the State is expected to obtain for the HHC by the end of the fiscal year. If these funds are delayed, the City could be called upon to provide financial assistance for FY 2012.
These estimates do not reflect the potential impact of changes to the Medicaid program that were recently proposed by the Governor’s Medicaid Redesign Team. These changes, which would reduce reimbursement rates, limit medical malpractice awards, restrict services, and enroll additional patients into managed care, require approval by the State Legislature. The HHC believes that these initiatives could result in a net loss of $118 million and could adversely affect the delivery of services, although it has not assessed the impact of all of the MRT proposals.
C. New York City’s Credit Rating
Yields in the municipal bond markets have increased as concern regarding the fiscal soundness of certain states and localities have led investors to seek alternative investments. The City now assumes it will pay 50 basis points more for long-term debt issued during the first half of FY 2012 when compared to the November Plan.
The City-funded portion of New York City’s capital program is expected to be financed equally through general obligation (GO) and Transitional Finance Authority (TFA) bonds secured by personal income tax, and, if needed, sales tax revenues. The City’s GO credit is rated “AA” by Standard & Poor’s (S&P), “AA” by Fitch Ratings, and “Aa2” by Moody’s Investors Service, while TFA credit is rated higher (“AAA” by S&P, “AAA” by Fitch, and “Aaa” by Moody’s.)15,16
15 The TFA’s subordinate bonds are rated “AAA” by S&P, “AAA” by Fitch, and “Aa1” by Moody’s.

33
The TFA’s credit rating benefits from the strong statutory revenue streams used to secure its bonds, while both the TFA and GO ratings reflect the City’s broad economic base and sound financial planning practices. Although all three rating agencies affirm a stable outlook, the agencies have expressed concern over: the City’s reliance on the volatile sectors of financial services and real estate; a high debt burden by many measures; and rising nondiscretionary costs, including pensions and retiree health care. The agencies also note that the City’s finances could be adversely affected by the State’s uncertain budget situation.
D. New York City Off-Track Betting Corporation
The New York City Off-Track Betting Corporation (OTB) faced years of fiscal distress as its net revenue (after statutory distributions to the racing industry, local governments, and the State) was insufficient to fund operations. The OTB requested State assistance, and in November 2010 the Governor proposed a restructuring of the OTB. The Assembly passed the Governor’s bill, but the Senate proposed instead that all Off-Track Betting corporations statewide be included in any legislative proposal.
Lacking alternative means to cover its operating costs, the OTB ceased operations in December 2010. As a result, approximately 1,300 employees immediately lost their jobs and 900 OTB retirees lost their health benefits. To prevent the loss of benefits, the union representing the retirees, District Council 37, sought an injunction requiring the State and/or the City to fund the retiree health benefits while litigation continues. Although the injunction was denied by the trial court, the Appellate Division of the Supreme Court imposed a restraining order requiring the City to continue funding the cost of these benefits until the court reaches a decision on the union’s appeal. Additionally, the OTB’s closure has negatively affected the racing industry because the industry no longer receives payments from the OTB. Legislative proposals have been made that would bring back off-track betting operations in some form, which would restore subsidies to the racing industry and provide relief to former OTB employees.
16 Both Fitch and Moody’s recalibrated their ratings in April 2010 so that municipal ratings are comparable
with ratings in other sectors. As a result, the City’s GO and TFA ratings were adjusted upward by one notch, though the adjustment does not reflect a change in credit quality.