Embed Size (px)
Citation preview

IMPROVING SPECIAL EDUCATION SERVICES
IN THE PROVIDENCE PUBLIC SCHOOL
DISTRICT
Report of the Strategic Support Team
Of the
Council of the Great City Schools
Submitted to the
Providence Public School District
Summer 2011

Review of Special Education in the Providence Public School District
Council of the Great City Schools Page 2
TABLE OF CONTENTS
Acknowledgements ............................................................................................................... 4
Chapter 1. Overview and Background.................................................................................... 5
Chapter 2. Purpose and Origin of the Project ......................................................................... 7
Chapter 3. Findings and Recommendations ......................................................................... 11
Section A. Identification of Students Eligible To Receive Special Education Services .......................... 11
Referral Practices ...................................................................................................................................................................... 11 Disability Prevalence Rates ................................................................................................................................................... 14 Prevalence by Race and Ethnicity ...................................................................................................................................... 16 English Language Learners .................................................................................................................................................. 22 Evaluation Practices ................................................................................................................................................................ 23 Summary of Positive Observations, Concerns, and Recommendations ............................................................ 26
Section B. Performance of Students with Disabilities .............................................................................. 31 Academic Performance ........................................................................................................................................................... 31 Graduation and Dropout Rates ........................................................................................................................................... 35 Out-of-School Suspensions and Unexcused Absences ................................................................................................ 36 Summary of Positive Observations, Concerns, and Recommendations ............................................................ 39
Section C. Instructional Practices and Support ....................................................................................... 44 Response to Intervention (RTI) ........................................................................................................................................... 44 Data Analysis of Students with Disabilities in Various Educational Settings ................................................ 51 Supporting Instruction in Inclusive Settings ................................................................................................................. 57 Supporting Instruction in Self-Contained Settings .................................................................................................... 60 Instruction for English Language Learners with Disabilities ............................................................................... 63 Placement of Students in Out-of-District Private Schools ....................................................................................... 64 Support for Postsecondary Transition Activities and Services ............................................................................. 64 Summary of Positive Observations, Concerns, and Recommendations ............................................................ 68
Section D. Support for Teaching and Learning ....................................................................................... 87 Special Education Management and Organization ................................................................................................... 87 Staffing Patterns and Usage ................................................................................................................................................. 90 Parental Support and Involvement ................................................................................................................................... 93 Professional Development ..................................................................................................................................................... 95 Use of Technology and Data ................................................................................................................................................. 95 Summary of Observations, Concerns, and Recommendations .............................................................................. 96
Section E. Accountability for Expected Practices and Results .............................................................. 107 Summary of Positive Observations, Concerns, and Recommendations ......................................................... 109
Chapter 4. Summary of Recommendations ........................................................................ 112
A. Recommendation Matrix ................................................................................................................... 112

Review of Special Education in the Providence Public School District
Council of the Great City Schools Page 3
B. Summary of Recommendations .......................................................................................................... 117 Section A. Identification of Students Eligible to Receive Special Education Services ............................. 117 Section B. Student Performance ...................................................................................................................................... 118 Section C. Instructional Practices and Support ........................................................................................................ 119 Section D. Support for Teaching and Learning ......................................................................................................... 124 Section E. Accountability for Expected Practices and Results .......................................................................... 129
Chapter 5. Synopsis and Discussion .................................................................................... 131
Appendices ........................................................................................................................ 134
Appendix A. Valid and Reliable Assessments for Preschool English Language Learners .................. 134
Appendix B. Evidence-Based Predictors for Post-School Employment, Education, and Independent
Living Success ......................................................................................................................................... 136
Appendix C. Staffing Ratios .................................................................................................................... 137
Appendix D. Detroit Public Schools Informational Leaflet .................................................................. 141
Appendix E. Documents Reviewed ......................................................................................................... 143
Appendix F. Team Agenda and Individuals Interviewed ....................................................................... 145
Appendix G. Strategic Support Team ...................................................................................................... 149
Appendix H. About the Council and History of Strategic Support Teams ........................................... 152

Review of Special Education in the Providence Public School District
Council of the Great City Schools Page 4
ACKNOWLEDGEMENTS
The Council of the Great City Schools thanks the many individuals who contributed to
this review of special education programs in the Providence Public School District (PPSD).
Their efforts were critical to our ability to present the district with the best possible proposals
for improving special education and related services in the school system.
First, we thank former Superintendent Tom Brady. It is not easy to ask one’s
colleagues for the kind of review conducted by the Council’s teams. It takes courage and
openness and a real desire for change and improvement. Even as he was planning his
departure, he wanted to ensure that the district had the best possible advice going forward.
Second, we thank the PPSD’s school board, who approved the conducting of this
review. We hope this report meets your expectations and will help improve special education
services across the system.
Third, we thank the members of the school district staff, especially Lisa Vargas Sinapi
and Karen Vasella, the district’s special education directors for elementary and secondary-
level schools. They organized the team’s interviews and provided all the documents and data
we needed in order to do our work. The team received well-organized and thorough
information and the full cooperation of staff during this process. Most people have no idea
how much time is required to organize a review such as this, much less the time to conduct it
and write up the draft and final reports. The details are numerous and time-consuming.
Fourth, the Council thanks the parents, community members, and advocates with
whom we met. They work passionately to support children with disabilities and ensure the
district serves these students in the best possible manner.
Fifth, the Council thanks the Los Angeles Unified School District and the Miami-Dade
County Public Schools for contributing staff members to this effort. The enthusiasm and
generosity of these districts serve as further examples of how the nation’s urban public school
systems are banding together to help each other improve performance for all students.
Finally, I thank Julie Wright Halbert, the Council’s legislative counsel, who facilitated
the work of the team, and Sue Gamm, a nationally known expert in special education, who
worked diligently with Ms. Halbert to prepare the final report. Their work was outstanding, as
always, and critical to the success of this effort. Thank you.
Michael Casserly
Executive Director
Council of the Great City Schools

Review of Special Education in the Providence Public School District
Council of the Great City Schools Page 5
CHAPTER 1. OVERVIEW AND BACKGROUND
At the time of the Council’s site visit, Tom Brady, then superintendent of schools in
Providence, was working to transform the school district into a more open, transparent, and
effective operation for all students, their families, and the greater Providence community. He
and the current interim superintendent, Susan F. Lusi, believe strongly in the potential of the
Providence Public School District (PPSD) to be one of the leading urban school districts in the
nation.
The district’s nine-member mayoral-appointed school board serves for staggered,
three-year terms and governs the school district and hires and evaluates the superintendent.
The mayor of Providence establishes a nominating commission to seek out and screen
potential school board members on an annual basis and recommend candidates to the mayor
for appointment or re-appointment. Upon confirmation by the City Council, three selected
members officially assume office in January of each year. The school board meets twice each
month, once to conduct business and once to convene a workshop on topical issues.1
In 2010-11, the PPSD was the largest school district in Rhode Island, enrolling 23,695
students. This number included 4,460 students who received special education—or about 17.1
percent of the total 6-21 year old student enrollment,2 compared with a rate of 19.7 percent
statewide and 13.4 percent nationwide. The school district has a total enrollment that is 62.8
percent Hispanic, 18.8 percent African American, 9.3 percent White, 5.3 percent Asian, and
3.9 percent multiracial, Native American, and Pacific Islander. Some 89.6 percent of the
district’s students are eligible for a free or reduced-price lunch, and about 14.6 percent are
English language learners (ELL).
The district operates 45 schools, including two that are chartered, and employs some
3,236 individuals, including 1,895 teachers. Providence schools had a general operating
budget of approximately $399 million in 2010-11.
The PPSD has a vision statement calling for the school district to be a national leader
in educating urban youth. To this end, the district’s mission is to prepare all students to
succeed in the nation’s colleges and universities and in their chosen professions. Core values
of respect, equity, excellence, accountability, and appreciation for diversity help to guide the
district’s actions and the realization of its three main districtwide goals:
1 See http://www.providenceschools.org/inside-ppsd/school-board for current update of board changes since the
Council visit. 2 The 17.1 percent rate does not include early childhood students with disabilities. Including these students would
yield a rate of 18.8 percent.

Review of Special Education in the Providence Public School District
Council of the Great City Schools Page 6
1. Increase student achievement
2. Build capacity through an infrastructure of support
3. Strengthen parent and community engagement.
To improve student outcomes and realize core values and commitments, the school
board adopted a strategic-direction policy that articulates a comprehensive curriculum
framework for aligned instruction. The instructional system was developed collaboratively by
central-office support staff members and Providence teachers, who were supported by
consultants from the Charles A. Dana Center at the University of Texas at Austin (math and
science), the University of Connecticut (English language arts), the National Center for
History in the Schools, and World History for Us All.
The Council’s Strategic Support Team working on this review heard consistent
recognition and appreciation of the district’s work on this new curriculum and its alignment
with standards. Although state NECAP assessments show improved outcomes at the
elementary level, the district continues to operate under a corrective action plan designed to
meet adequate yearly progress (AYP) requirements.
During this period of unprecedented challenges for the school district, particularly its
financial challenges, school district leadership requested this review of the school system’s
special education programs in order to improve services regardless of the budgetary
constraints. Everyone involved wanted the best recommendations the Council of the Great
City Schools could devise as a way of improving special education service delivery.

Review of Special Education in the Providence Public School District
Council of the Great City Schools Page 7
CHAPTER 2. PURPOSE AND ORIGIN OF THE PROJECT
Former Providence schools superintendent Tom Brady asked the Council of the Great
City Schools to review the district’s services for students with disabilities and to provide
feedback and recommendations to the Office of Special Education that would help to create
and provide effective and quality programming to support students with disabilities and
students at risk. This review was written to provide feedback to the district in a way that would
assist it in developing a five-year plan to improve outcomes for students with disabilities and
to build capacity of the district to educate Providence students in the least restrictive
environment. At the outset of our work, the district expressed specific objectives for this
project:
To increase student achievement and access to the core curriculum for students with
disabilities.
To improve the provision of social/emotional supports, with an emphasis on the
Behavior Intervention Program, and to recruit and retain qualified staff to work with
students with social and emotional needs.
To implement Response to Intervention (RTI) effectively, including the use of data-
based decision making.
To provide effective professional development for behavior training/social emotional
supports and expansion of RTI to support positive student behavior.
To recruit and retain staff for hard-to-fill staff positions, such as speech pathologists.
To provide effective transition services.
To effectively use the district’s information data system and technology services.
To understanding differences between language acquisition, a learning disability, and a
speech/language impairment, and to understand how these apply in the district for
English Language Learners (ELL) and students with disabilities.
The Work of the Strategic Support Team
The Council assembled a team of experts who have successfully administered and
operated special education programs in other major urban school districts around the country.
These individuals also have firsthand expertise regarding the reauthorization of the Individuals
with Disabilities Education Act (IDEA) and are well versed in federal law and best practices.
The Strategic Support Team (the team) visited the district on April 13-15, 2011 and analyzed
the district’s organizational structure, accountability systems, curriculum and instructional

Review of Special Education in the Providence Public School District
Council of the Great City Schools Page 8
strategies, individualized education program (IEP) implementation, and other features of the
district’s services for students with disabilities. The team briefed the superintendent, school
board president, and senior staff at the end of its visit and presented preliminary findings, and
proposals.
The Strategic Support Team carried out its charge by conducting interviews and focus
groups with district staff members, reviewing numerous documents and reports, analyzing
data, and developing initial recommendations and proposals before finalizing this report. This
approach to providing technical assistance to urban school districts by using senior managers
from other urban school systems across the nation is unique to the Council and its members.
The organization finds this approach to be effective for a number of reasons.
First, it allows superintendent and staff members to work with a diverse set of talented,
successful practitioners from around the country. The teams comprise a pool of expertise that
superintendents may call on for advice or help in implementing the recommendations, meeting
new challenges, and developing alternative solutions.
Second, the recommendations from urban school peers have power because the
individuals who developed them have faced many of the same challenges encountered by the
district requesting the review. No one can say that these individuals do not know what
working in an urban school system is like or that their proposals have not been tested under
the most rigorous conditions.
Third, using senior urban school managers from other urban school communities is
faster and less expensive than retaining large management consulting firms that may have
little to no programmatic experience. The learning curve is rapid, and it would be difficult for
any school system to buy on the open market the level of expertise offered by these teams.
Members of the Strategic Support Team for this project included the following
individuals –
KARLA ESTRADA
Division of Special Education
Los Angeles Unified School District
SUE GAMM, ESQ.
Former Chief of Specialized Services
Chicago Public Schools
WILL GORDILLO Administrative Director
Division of Special Education
Miami-Dade County Public Schools
JULIE WRIGHT HALBERT, ESQ.
Legislative Counsel
Council of the Great City Schools
Contents of This Report
The Strategic Support Team of the Council of the Great City Schools spent many hours
interviewing parents, advocates, related-services personnel, special education teachers,

Review of Special Education in the Providence Public School District
Council of the Great City Schools Page 9
principals, Rhode Island Department of Education (RIDE) staff members, and central-office
administrative leaders with responsibility for both special and general education. The team
also reviewed studies, data, and other special education reports on the PPSD.
Chapter 1 of this report presents a brief overview of the PPSD. Chapter 2 describes the
purposes and origins of this project. Chapter 3 summarizes the findings and recommendations
of the Strategic Support Team. These observations and proposals are divided into five broad
areas:
A. Identification of Students Eligible to Receive Special Education Services
Referral Practices
Disability Prevalence Rates
Prevalence Rates by Race and Ethnicity
English Language Learners
Evaluation Practices
B. Performance of Students with Disabilities
Academic Performance
Graduation and Dropout Rates
Out-of-School Suspension and Unexcused Absences
C. Instructional Practices and Support
Response to Intervention
Data Analysis of Students with Disabilities in Various Educational Settings
Supporting Instruction in Inclusive Settings
Supporting Instruction in Self-Contained Settings
Instruction for English Language Learners with Disabilities
Placement of Students in Out-of-District Placements
Support for Postsecondary Transition Activities and Services
D. Support for Teaching and Learning
Special Education Management and Operations
Staffing Patterns and Usage
Parent Support and Involvement
Professional Development
Use of Technology and Data
E. Accountability for Expected Practices and Results
Each of these sections includes the team’s positive observations, areas of concerns, and
recommendations. Chapter 4 summarizes all of the report’s recommendations, including a
matrix showing various components of each one. Finally, chapter 5 presents a brief synopsis
of the report and the team’s overarching impressions.

Review of Special Education in the Providence Public School District
Council of the Great City Schools Page 10
Appendix A provides information about valid and reliable assessments for preschool
English Language Learners. Appendix B provides a chart showing evidence-based predictors
of post-school employment, education, and independent living success. Appendix C compares
incidence rates and staffing ratios in various city school systems across the country. Appendix
D provides a model for a one-page information sheet for parents developed by the Detroit
Public Schools. Appendix E lists documents reviewed by the team. Appendix F lists
individuals the team interviewed individually or in groups and the team’s working agenda.
Appendix G presents brief biographical sketches of team members. Appendix H presents a
brief description of the Council of the Great City Schools and a list of the Strategic Support
Teams that the Council has fielded over the last 10 years.

Review of Special Education in the Providence Public School District
Council of the Great City Schools Page 11
CHAPTER 3. FINDINGS AND RECOMMENDATIONS
This chapter presents the findings of the Council of the Great City Schools’ Strategic
Support Team and its recommendations for improving special education services in the
Providence public schools. The findings and recommendations are divided into the following
five broad areas:
A. Identification of students eligible to receive special education services
B. Performance of students with disabilities
C. Instructional practices and support
D. Support for teaching and learning
E. Accountability for expected practices and results.
Section A. Identification of Students Eligible to Receive
Special Education Services
This section addresses the district’s referral practices and eligibility decisions for
special education services; local, national and state prevalence rates for special education;
prevalence rates by race and ethnicity; English language learners receiving special education;
and evaluation practices.
Referral Practices
The process of determining whether a student has a disability that requires special
education services begins with a referral for an evaluation. According to material provided by
the district, staff members from the office of special education review and share information
about the referral process and response to intervention (RTI) process with evaluation teams at
the beginning of each school year and with teacher-support teams throughout the year.
In addition, the referral process is reviewed annually with principals, and they are
required to review and sign all referrals before submitting them to the evaluation team.
Reportedly, most principals adhere to this procedure, but many do not review and discuss the
referral with the teacher.
Special education supervisors and other administrators that lead evaluation teams are
required to ensure that referred students have received appropriate instruction and that
referrals are appropriate.

Review of Special Education in the Providence Public School District
Council of the Great City Schools Page 12
Referral Rates over Time
The number of students referred for a special-education evaluation in the Providence
public schools increased from 672 in 2007-08 to 1,169 in 2010-11,3 even though the general
enrollment declined from 24,610 students to 23,543 over the same period. As a result, the rate
of referrals increased from 2.7 to almost 5 percent during this period. (See exhibit 1.)
According to district representatives, many of the referrals were the result of increased early
childhood screening and outreach.
Exhibit 1. Percentage of PPSD Students Referred for a Special Education Evaluation
Relationship Between Referral and Assessment
As exhibit 2 shows, almost all students referred for a special education evaluation were
approved for an assessment. However, the percentage steadily decreased between 2007 and
2011. Between 2009 and 2011, Hispanic students referred for an evaluation were actually
assessed at about 10 percentage points below the rate of all students.
In 2010-11, a larger percentage of Asian, multiracial, and White students referred were
assessed than African American (Black) and Hispanic students. (Data on 2011 do not
represent a full school year.)
3 Data for 2010-11 were not complete at the time of the team’s review.

Review of Special Education in the Providence Public School District
Council of the Great City Schools Page 13
Exhibit 2. Percentage of Students Referred for Evaluation Who Were Approved for
Assessment
Relationship Between Assessment and Eligibility
The experience of the Council’s team indicates that about 80 to 85 percent of students
nationally receiving a special education evaluation are found to have a disability requiring
special education services. As shown in exhibit 3, however, a relatively small percentage of
PPSD students receiving an evaluation are found to be eligible for services. The percentages
are about the same among all race/ethnicities and were strikingly similar in 2011. In 2010, 85
percent of multiracial students assessed were found to be eligible, a much higher percentage
than the 53 percent overall rate, but that percentage appears to be an exception to the longer-
term pattern.
Exhibit 3. Rate of Students Assessed Found Eligible for Services

Review of Special Education in the Providence Public School District
Council of the Great City Schools Page 14
District representatives expressed concern that these data were not accurate because the
student information system does not capture eligibility decisions made over the summer or the
following school year. More information about the district’s use of data to help manage
special education activities is provided in section D, Use of Technology and Data.
The lower-than-expected eligibility determination rates raise a question about the
extent to which school-based teams appropriately screen referred students to determine
whether there is a basis for suspecting that a student has a disability. This activity is important
to avoid an unnecessary evaluation, which is time-consuming and costly. It takes staff and
students away from providing and receiving instructional support, and it is not typically a
pleasant experience for students.
Disability Prevalence Rates
Comparison of PPSD Prevalence Rates to the Nation and State4
As shown in exhibit 4, 17.1 percent of PPSD students ages 6-21 receive special
education services.5 While this percentage is much higher than the national rate of 13.4
percent, it is less than the state’s percentage of 19.7. When looking solely at major disability
categories, however, PPSD has somewhat higher rates in learning disabilities (47.2 percent)
than the state (41.1 percent) or nation (37.8 percent). The same is true for the area of
emotional disturbance (ED), where the percentage of PPSD students identified (13.4 percent)
is larger than the state’s 10.2 percent and more than double the nation’s 6.2 percent.
Exhibit 4. Comparison of Disability Prevalence Rates (PPSD, Rhode Island, and United
States)
4 PPSD data for 2010-11: All U.S. and State data on students with disabilities are from the U.S. Department of
Education, Institute of Education Sciences for 2007-8. Disability area rates for the United States and Rhode
Island are from Data Accountability Center for 2008-9. The disability areas reflect the percentage of each area for
all students with disabilities; the percentage of all students with disabilities is based on total student enrollment. 5 The rate is 18.8 percent when early childhood students with disabilities are included.

Review of Special Education in the Providence Public School District
Council of the Great City Schools Page 15
Also notable is the relatively low percentage of students identified as having autism (3.5
percent) compared to the state (6.1 percent) and nation (5.8 percent). Although the district’s
14.6 percent of students receiving speech/language services is smaller than the nation’s 21.9
percent, it is close to the state’s 15.5 percent.
The district’s proportions of disabilities are closer to those of the state and nation in the
remaining disability areas.
Prevalence Rates over Time
The district recognizes that it has a high percentage of students identified as eligible for
special education services (3 through 21 years of age) and has implemented a number of
strategies over the years to address the needs of students with academic and behavioral
challenges in the general education environment.
As a result, the percentage of students receiving special education services decreased
from 19.7 percent in 2006-07 to 18.8 percent in 2010-11. (See exhibit 5.)
Exhibit 5. Percentage of PPSD Students Receiving Special Education Services Over Time
Percentage of Students with Disability by Grade over Time
When examining the percentage of students with disabilities by grade, one sees lower
rates in the preschool years and a decline in the secondary grades as well.
Between 2007 and 2011, however, the rates were generally lower in 2011 in grades K,
5, 6, 7, and 8 than they were in 2007, and somewhat higher in grades 9, 10, 11, and 12 in 2011
than they were in 2007. (See exhibit 6.)

Review of Special Education in the Providence Public School District
Council of the Great City Schools Page 16
Exhibit 6. Percentage of Students with Disabilities by Grade (2007-2011)
Prevalence by Race and Ethnicity
The Council’s Strategic Support Team also analyzed the likelihood of students of
differing races/ethnicities being identified as needing special education. The metric comprises
two indicators on the federally required state performance plan (SPP). The Rhode Island
Department of Education (RIDE) has identified districts as having disproportionate
representation when they meet the following three criteria:6
A risk ratio of 2.5 or higher or less than 0.40 for two consecutive years
A minimum n size of 10 students
At least a 1 percent difference between the district and national risk.
RIDE applies these criteria to all disability areas as a whole (indicator 9) and to each of
the following disability areas: emotional disturbance (ED), learning disabilities (LD), autism,
intellectual disability, and other health impairment and speech/language (indicator 10).
Although RIDE found that Providence had disproportionate representation in the first three
areas, the state agency found no evidence that the disparity was the result of inappropriate
6 A risk ratio reflects the likelihood that a student from one racial/ethnic group has a disability, compared with
students from other racial/ethnic groups. The national risk reflects the percentage of national school district
students from a racial/ethnic group that have a disability, compared with all students in the racial/ethnic group.

Review of Special Education in the Providence Public School District
Council of the Great City Schools Page 17
identification.7 However, because the disproportionality was significant, the district has been
required to use 15 percent of its Individuals with Disabilities Education Act (IDEA) funds for
early intervening services for students without disabilities to reduce the level of
disproportionality. Disproportionality data and district activities to address this issue are
discussed below.
All Disability Areas
Between 2006 and 2009, White and Native American students were disproportionately
represented in the overall number of students receiving special education in PPSD. However,
the risk ratio for these two groups has steadily decreased: Whites (2.9 to 2.6) and Native
Americans (3.4 to 2.9). Asian students are neither disproportionately represented in special
education nor are over-represented in any particular disability area. (See exhibit 7.)
Exhibit 7. Risk Ratio for All Disability Areas (2006-2009)
The district’s White, Black, Hispanic, and Native American groups are much more
likely to be identified as having a disability than are students from these same groups
nationwide. The greater likelihood for PPSD students relates to the higher percentage
receiving special education in the district. (See exhibit 8.)
7 February 1, 2011 report to the U.S. Department of Education’s Office of Special Education Programs (OSEP).

Review of Special Education in the Providence Public School District
Council of the Great City Schools Page 18
Exhibit 8. Percentage of Students Likely to be Identified as Having a Disability, by
Race/Ethnicity, 2009 PPSD, 20078 Nationwide
Emotional Disturbance
White and Black students are disproportionately represented in the area of emotional
disturbance (ED). The risk ratios for these groups are decreasing, however. Between 2006 and
2009, the percentage of White students identified in the area of ED declined from 7.3 to 6.3,
and the percentage for Black students declined from 6.02 to 5.8. Hispanics, who had a risk
ratio of 2.8 in 2008, were no longer disproportionate in 2009 (2.47).9 (See exhibit 9.)
Exhibit 9. Risk Ratio for the Area of Emotional Disturbance (2006-2009)10
8 2007 is the latest date available for national risk data.
9 The number for the Native American subgroup was too small for calculation.
10 There were not enough Native American students to calculate a risk ratio.

Review of Special Education in the Providence Public School District
Council of the Great City Schools Page 19
PPSD’s White, Black, and Hispanic student groups each are significantly more likely
to be identified as ED than the nation as a whole: White (3.8 percentage points greater than the
nation), Black (3.5 points greater), and Hispanic (1.1 points greater). (See exhibit 10.)
Exhibit 10. Comparison of Percentage of Students Likely to be Identified as ED: 2009
for PPSD and 2007 for Nation
Learning Disabilities
Between 2006 and 2009, the likelihood of being identified as having learning
disabilities (LD) decreased for all racial/ethnic groups in the district. Only Native American
students continue to be disproportionately represented, but the likelihood decreased from 3.1
percent to 2.9 percent. (See exhibit 11.)
Exhibit 11. Risk Ratio for the Area of Learning Disabilities (2006-2009)

Review of Special Education in the Providence Public School District
Council of the Great City Schools Page 20
All four groups are more than 1 percent more likely than their nationwide peers to be
identified as LD: White (5.3 percentage points greater than nation), Black (4.5 points greater),
Hispanic (4.2 points greater), and Native American (7.9 points greater). (See exhibit 12.)
Exhibit 12. Comparison of Percentage of Students Likely to be Identified as LD, 2009
District and 2007 Nation
Autism Spectrum Disorder
Unlike the other areas discussed, the likelihood of being identified as having autism
spectrum disorder (autism) is increasing for White students in the Providence school district
(3.52 percent to 5.78 percent). (See exhibit 13.)
Exhibit 13. Percentage of Students Likely to be Identified as Having Autism Spectrum
Disorder (PPSD 2006-2009)

Review of Special Education in the Providence Public School District
Council of the Great City Schools Page 21
The percentage of White, Black, and Hispanic students in PPSD identified as autistic is
closer to the national percentage than the other areas examined: White (1.39 percentage
points), Black (0.3 points), and Hispanic (no difference). (See exhibit 14.)
Exhibit 14. Comparison of Percentage of Students Recognized as Autistic, District 2009,
Nation 2007.
As indicated above in exhibit 14, PPSD identifies a smaller percentage of students as
having autism (3.5 percent) than the state (6.1 percent) and the nation (5.85 percent).
Consequently, there is a smaller overall difference from the national percentages. However,
the difference in PPSD’s proportion of identified White students is much greater than the
proportion of Black and Hispanic students.
District Activities to Address Disproportionality
PPSD is required to use 15 percent of its IDEA funds for students without disabilities to
reduce its significant racial/ethnic special education disproportionality. This requirement is
based on research showing that early-intervening services in the general education
program can effectively reduce disproportionality. According to information provided by
the district, these funds have been targeted for struggling general-education students,
especially those in the early grades having trouble in math and literacy. To support this
effort, a district early-intervening team provides assistance and professional development
to school-based evaluation teams, administrators, and teacher-support teams to help
develop and implement practices consistent with multi-tiered response-to-intervention
(RTI) processes. Furthermore, a group of special educators in PPSD are providing
intensive reading intervention to general education students. In addition, the special
education office provides professional development for school psychologists and social

Review of Special Education in the Providence Public School District
Council of the Great City Schools Page 22
workers on the implementation of the multi-tiered approach to supporting students with
challenging behaviors.
Although special education administrators collaborate with RIDE on the issue of
disproportionality, it was reported to the team that PPSD general-education representatives
have not participated.
English Language Learners
Of all students in PPSD who are English Language Learners (ELL), 12.4 percent
receive special education services. This percentage is proportionate to the 14.7 percent of
PPSD students who are ELL, and less than the district’s overall disability rate of 18.1 percent.
However, among students with disabilities, a higher percentage of ELL students
receive speech/language services than do all students with disabilities (33.4 to 13.7 percent),
and a higher percentage of ELL students are identified as developmentally delayed (14 to 6.9
percent).
On the other hand, ELL students are represented at a much lower level in the areas of
ED (1.7 to 13.7 percent) and autism (0.2 to 3.4 percent). ELL students with disabilities are
represented in the area of LD at a somewhat smaller rate, compared with all students with
disabilities (40.3 to 45.6 percent). (See exhibit 15.)
Exhibit 15. Representation of ELL Students in the Area of Special Education

Review of Special Education in the Providence Public School District
Council of the Great City Schools Page 23
Evaluation Practices
Early Intervening Team
The early intervening team in PPSD works with school-based evaluation staff
members to provide recommendations, guidance, and training to help them understand and
implement comprehensive assessments to identify students with ED and/or intellectual
disability. This action was taken in response to internal monitoring that found a lack of
comprehensive assessments in some cases. It appears that this approach has been having some
success in that PPSD has significantly reduced racial/ethnic disproportionality in the area of
intellectual disabilities and reduced disproportionality somewhat in the area of ED.
New LD Eligibility Requirements
Since September 1, 2010, Rhode Island school districts have been required to use a
process based on student responses to scientific, research-based interventions (i.e., response to
intervention or RTI) to determine if the student has a disability and is eligible for special
education services. In general, RTI is used to determine if a student has made sufficient
progress after the provision of intensive intervention. By state rule, this process must be used
for middle and high school students beginning September 1, 2011.
During the 2010-2011 school year, the special education office provided training on
RIDE’s eligibility guidance to principals, coaches, and the teaching and learning team.
However, decisions on eligibility must be based on an effective model of RTI delivered
systemically and comprehensively throughout the school district. Otherwise, there is
insufficient data upon which eligibility teams can make their determinations. More
information about the district’s use of RTI and the extent to which it is being effectively
implemented is discussed in section C below.
ELL and Disability
Focus group members expressed concern that school-based personnel were not
sufficiently knowledgeable about the difference between language acquisition for ELLs and
how such acquisition is considered when assessing a possible speech/language impairment
and/or learning disability. Such knowledge is necessary for both special and general educators
who do not have certification or knowledge in English as a Second Language (ESL). In
addition, there is concern in PPSD about a lack of valid and reliable tools for assessing
language acquisition for children three to five years of age.
Another point that may help explain the high percentage of ELL students with
disabilities who are identified as having a speech/language impairment is the fact that, in the
past, ELL students have automatically exited from language-support services after three years,
even though they may not have attained adequate language acquisition skills. Students may
have been provided speech/language services through the special education process to

Review of Special Education in the Providence Public School District
Council of the Great City Schools Page 24
compensate for the effects of this practice. In any case, this policy changed during the 2010-11
school year.
The district’s practice of exiting ELLs with disabilities before they had sufficiently
strong command of English to perform successfully in mainstream classes is, in part, a direct
consequence of RIDE's regulations and guidance. The memorandum on State-Defined
Required English Language Instructional Program Exit Criteria from RIDE's chief of
instructional, assessment, and curriculum and chief of accelerating school performance
requires strict adherence to the three-pronged criteria for exiting ELLs, except for ELLs with
disabilities. The exit criteria for ELLs with disabilities impose a substantially lower threshold
related to English language acquisition and appear to increase the relative weight of the IEP
and the IEP team. The table below compares the two exit criteria:
Exit Criteria for ELLs Exit Criteria for ELLs with Disabilities
1. Student Achievement Cutoff scores:
ACCESS for ELLs: Literacy Composite score of > 4.5
and Comprehension Composite score > 5
OR
NECAP Reading Score > Level 3
1. Student Achievement:
ACCESS for ELLs: Student's overall composite
language proficiency score has not increased
more than 10 percent total over the most recent
three testing cycles
2. Any three of following (other assessments and
teacher recommendations):
Passing grades in all core content classes (report card),
or
ESL/bilingual education teacher recommendation, or
At least two general education core content teacher
recommendations, or
At least three writing samples demonstrating skill not
more than one year below grade level, or
Score on a district reading assessment not more than
one year below grade level as defined by the publisher
or the district
2. Teacher recommendations:
The IEP Team, with input from an
ESL/bilingual education professional,
recommends exit
3. Students in grades 1-12 can exit (students in K are
not eligible for exit) 3. IEP and ELL program participation--
Student has an IEP, and
Student has been continuously enrolled in an
ESL/bilingual education program for more than
five years
The table shows that fewer and lower thresholds on achievement measures need to be
met in order to exit ELLs with disabilities. Only ACCESS scores are reviewed for ELLs with
disabilities whereas NECAP, class grades, writing samples, and reading assessments would be
considered for ELLs without disabilities. Furthermore, the requirement on the ACCESS test
does not involve a cutoff score denoting proficiency but rather ―lack of progress‖ on the

Review of Special Education in the Providence Public School District
Council of the Great City Schools Page 25
assessment. The state criteria for exiting ELLs with disabilities appear predicated on a
student’s making ―no further progress‖ in English language attainment. 11
Although PPSD has improved on RIDE’s requirements, the mandates still do not
include explicit achievement criteria and leave much of the interpretation to the school-based
teams. If staff members are unable to distinguish between learning disabilities and language
acquisition signposts, as reported to the team, the fairly loose criteria may be resulting in the
premature exit from the ELL program of ELLs with disabilities.
The PPSD Office of ELLs creates a list of the ―eligible pool of ELLs with disabilities‖
based on the RIDE criteria described in the table above. The list is sent to the schools to be
reviewed by the school-based teams, which must include at a minimum an ESL/bilingual
education professional and a special education supervisor or special education teacher. In
order to make a recommendation for reclassification, the team reviews not only ACCESS for
ELL data but also formative and summative assessment data and the personal learning plan
(PLP). (See ELL Strategic Support Team recommendations.)
Psychiatric Evaluations
PPSD contracts with two psychiatrists for about $60,000 per year to conduct
evaluations of all students believed to have autism or ED and who need special education
services. Although assessment staff interviewed during focus groups indicated that state
regulations required such assessments, PPSD’s two special education directors expressed their
understanding that such medical evaluations were not required but staff members consider
these evaluations to be best practice and necessary. None of the Council’s team was aware of
any protocol used by other districts that require psychiatric evaluations as part of the
assessment process. Furthermore, the requirement for an additional assessment may add
unnecessary delays to the evaluation process, a process that is discussed below.
Timely Evaluations
The timely completion of evaluations is another important aspect of the special
education process. RIDE monitors this exercise in two ways through its state performance
plan: Indicator 11 measures timely completion of initial evaluations and indicator 12 measures
the extent to which children referred by early intervention agencies prior to age 3 are
evaluated and provided IEP services by their third birthday. Both outcomes have a federally
required target of 100 percent.
11 September 3, 2010 memorandum to district superintendents from Rhode Island Board of Regents, Department
of Elementary and Secondary Education, Chief of Instruction, Assessment, and Curriculum and Chief of
Accelerating School Performance. Subject: State-Defined Required English language Instructional program Exit
Criteria.

Review of Special Education in the Providence Public School District
Council of the Great City Schools Page 26
According to information provided by the district, 71.5 percent of initial evaluations
were completed in a timely manner. However, in its February 1, 2011 submission to the U.S.
Office of Special Education Programs (OSEP), RIDE reported the district as having a higher
performance rate (83.4 percent). In either case, the district’s performance was timelier than the
state’s 88.2 percent. For children referred by Part C agencies, PPSD’s 96 percent timeliness
rate exceeded the state’s 87 percent. For both indicators, the district’s performance improved
from the previous year. (See exhibit 16.)
Exhibit 16. Timely Evaluations (2008-09)
Every quarter, PPSD submits a report to RIDE showing its progress in meeting
indicator 11’s initial evaluation timeliness requirements. Based on its April 5, 2011 report, the
district’s rate for the second quarter (ending December 31, 2010) was 89 percent. The rate for
the third quarter (ending March 30, 2011) was 94 percent. Under the district’s compliance
plan, district special education supervisors and specialists review noncompliant cases each
week, discuss data with teams of qualified professionals, and address relevant issues.
However, for a variety of reasons that will be discussed more fully in section D, the district is
not fully utilizing real-time electronic data and reporting capability to track the issue.
Summary of Positive Observations, Concerns, and Recommendations on
Eligibility to Receive Special Education Services
Identification of Students Eligible to Receive Special Education Services
The following are positive observations, areas of concerns, and recommendations to
improve the identification of students eligible to receive special education services in the
Providence Public School District.

Review of Special Education in the Providence Public School District
Council of the Great City Schools Page 27
Positive Observations
Special Education Administrative Support. Focus group members indicated they believed
the district’s special education administrators did a ―wonderful job‖ helping them manage
the evaluation process.
More Comparable Special Education Rates. The district has recognized its high
percentage of students identified as eligible for special education services and has
implemented a number of strategies to address the needs of students with academic and
behavioral challenges within the general education context. As a result, the percentage of
students receiving special education services decreased from 19.7 percent in 2006-07 to
18.8 percent in 2010-11.
Reduced Disproportionality. PPSD has reduced the extent to which various racial/ethnic
groups of students are disproportionately represented in special education generally and in
the specific areas of intellectual disability, ED, and LD. Furthermore, RIDE has
determined that the district’s disproportionate representation was not the result of
inappropriate identification. Finally, the district identifies ELL students as having
disabilities at rates that are comparable to PPSD’s overall ELL total student population and
the national special education population.
More Timely Evaluation Completion Rates. Although PPSD has not reached the 100
percent target for timely evaluations required by RIDE’s state performance plan, the
district’s timeliness rate has increased for initial evaluations and, at 96 percent, is almost at
the target for children referred by Part C early-intervention agencies.
Evaluation Process Training and Support. The special education office has developed
and implemented specific procedures for evaluation teams to diagnose students having an
intellectual disability and ED, and it has provided professional development on new
regulations for identifying a child with a learning disability. In addition, the special
education office has provided multiple training sessions on providing early intervening
services and on new LD eligibility criteria to special educators, principals, and clinical
staff, e.g., psychologists, social workers, etc. In addition, the special education office is
working with Brown University to provide training on differentiated diagnosis for students
who are ELL. The district’s early-intervening team works with school-based evaluation
teams, providing recommendations, guidance, and training to help them understand and
implement comprehensive assessments to identify students with ED and/or intellectual
disabilities.
Areas of Concern
High Percentage of Students Evaluated Are Not Eligible. The percentage of students
referred for an evaluation to determine eligibility for special education services increased
between 2007 and 2010. Compared to previous years, a greater percentage of referrals are

Review of Special Education in the Providence Public School District
Council of the Great City Schools Page 28
currently not approved for further evaluation than before, and a smaller percentage of
those assessed are found to have a disability that requires special education services.
District staff indicated concern, however, that these data were not accurate because the
PPSD student information system does not capture student eligibility decisions made over
the summer or the following school year. Consequently, the district does not have good
information on this issue.
Comparatively High Special Education Prevalence. A much larger percentage of PPSD
students (17.1 percent for students ages 6-21) are found eligible to receive special
education services than the national average (13.4 percent). Furthermore, a greater
percentage of students are receiving special education in the areas of LD and ED than in
the state and the nation.
Disproportionate Representation Continues. Although PPSD’s overall racial/ethnic
disproportionality rates have decreased over time, they have increased for autism, and the
district continues to have disproportionate representation in the following areas: all special
education (Native American), ED (White and Black), LD (Native American), and autism
(White). Although special education administrators have collaborated with RIDE on the
issue of disproportionality, it was reported to the team that PPSD general education staff
members have not participated. Regardless of the reasons for this lack of participation, it is
essential that the issue of disproportionality and the leadership of efforts to reduce the
impact of disproportionality reside in leadership responsible for general curriculum and
instruction and the district at large. In the absence of such leadership, RTI may continue to
be viewed as a ―pathway to special education.‖
Need for Better Differential Diagnosis. Focus group members expressed concern that
school-based staff members were not sufficiently knowledgeable about the difference
between language acquisition for ELL and how such acquisition affects a possible
speech/language impairment and/or learning disability. Furthermore, there is concern that
students have been determined to have a disability in order to receive speech/language
services to compensate for a lack of English language support. Staff members were also
concerned about the lack of valid and reliable tools for assessing language acquisition for
three- to five-year-old children.
Categorical Psychiatric Evaluation Practice. PPSD contracts with two psychiatrists for
about $60,000 per year to conduct evaluations of all students believed to have autism or
ED and to need special education services, even though this practice is not required by
federal or state law. The Council team is not aware of other districts that employ this
practice.
Insufficient Use of Data to Support Timely Evaluations. Although its performance is
improving, the district has not met the state performance-plan target of 100 percent for
timely initial evaluations for children referred from Part C early intervention agencies.

Review of Special Education in the Providence Public School District
Council of the Great City Schools Page 29
Recommendations
1. Improve consistency and appropriateness of eligibility determinations across the district
and ensure staff members are held accountable for doing so.
a. Identify all disability areas in which it is much more likely (e.g., 1 standard
deviation) that a PPSD student will be found to have a disability than other students
in the nation. Consider working with the National Association of School Psychologists
or another credible organization or consultant (1) to review the district’s current
criteria for all disability areas to ensure that they are sufficiently specific, measurable,
and operational and (2) to advise local assessment teams. As part of this process,
review a sample of recent evaluations that produced special education eligibility
determinations in these areas to (1) identify areas of concern that should be reflected in
the criteria, (2) provide professional development on any revised eligibility standards,
and (3) promote appropriate decision-making. (See section C regarding RTI for
additional recommendations relevant to this issue.)
b. Improve the special education referral and screening process. Review accurate data
to identify any patterns in the referrals that (1) were determined not to be appropriate
for an evaluation and (2) that resulted in evaluations that did not produce an eligibility
determination. Review a variety of student files in both categories reflecting these
trends to identify any part of the referral and screening process that would benefit from
revision. Based on this review and any subsequent procedural revisions, provide
training to principals and relevant staff.
c. Use data to initiate improvement plans for the referral and evaluation process, and
monitor outcomes. Produce accurate quarterly reports showing by school the number
and percentage of students (1) referred for a special education evaluation, (2) screened
to proceed to an evaluation, and (3) determined to be eligible for services, along with
the disability area. Disaggregate the data by school, race/ethnicity, and ELL. For any
school (with a sufficient number of students) in which (1) fewer than 85 percent of
students evaluated were found eligible for services and/or (2) the disability rate is
above a level of expectation established by the district, review the evaluation data with
the relevant school staff to determine how the school’s referral, screening, and
evaluation process could be improved. Based on this determination, involve the
principal in setting expectations for future actions and monitoring their outcome.
Disseminate data through the chief academic officer to relevant PPSD administrators
with responsibility for supporting school instruction and discuss how various
departments can reinforce and support the actions to be taken by the schools.
d. Improve the evaluation process for students who are ELL. With relevant
stakeholders, including the ELL director, research evidence-based practices for
identifying and evaluating students who are ELL with suspected special
education/related services needs to ensure that language acquisition issues are not

Review of Special Education in the Providence Public School District
Council of the Great City Schools Page 30
mistaken for a special education need or mask such a need. As part of this process,
consider the ELL expertise that is available in schools and how it can be accessed to
support this process. Also, consider how schools lacking such expertise can be assisted
in supporting any ELL requiring additional support. Based on this information, initiate
professional development activities to disseminate relevant information. In addition,
see appendix A for information provided to the Council by various ELL experts
regarding the use of valid and reliable tools for assessing language acquisition for
three- to five-year-old ELLs.
e. Revise process for use of psychiatric evaluations. Establish a written protocol
regarding standards to be applied on a case-by-case basis for recommending a
psychiatric evaluation to determine if a student has or continues to have an emotional
disturbance or autism. The protocol should be specific enough so that it produces a
change from the current practice of utilizing a psychiatrist for every evaluation.
Following dissemination and training on the protocol, monitor its application.

Review of Special Education in the Providence Public School District
Council of the Great City Schools Page 31
Section B. Performance of Students with Disabilities
This section addresses the performance of students receiving special education services
with respect to academic performance and their graduation and dropout rates. In addition, the
areas of suspensions and attendance are addressed to see whether students with disabilities
receive out-of-school suspensions or have unexcused absences at inordinate rates, which affect
their ability to be in school and have access to instruction.
Academic Performance
The subsections below describe the reading and mathematics performance on regular
and alternative assessments of students receiving special education services.
Comparison of Academic Performance of PPSD Students with Disabilities to State Targets
The state’s February 1, 2011 annual performance report shows a 12 percent overall
proficient or above rate for students with disabilities in 2009-2010, a level that did not
improve from the previous year. This outcome is 14 percentage points below the state
performance plan (SPP) target of 26 percent. (See exhibit 17.)
Exhibit 17. Percentage of Students with Disabilities Scoring At Least Proficient, 2009-10
Rhode Island established individual grade and content area performance targets. As
shown in the exhibits below, students receiving special education services perform
substantially below SPP targets at all grade levels in both reading and math based on the New
England Common Assessment Program (NECAP). (See exhibits 18 and 19.)

Review of Special Education in the Providence Public School District
Council of the Great City Schools Page 32
Exhibit 18. Reading Performance
Exhibit 19. Math Performance
Comparing the percentage of PPSD students with disabilities who scored proficient or
above to the state proficiency target percentage, the gap was in grade 7 (19 percentage points)
and the smallest gap was in grade 8 (4 percentage points). In math, there was a 19-point
difference at grade 4 and a 5-point difference at grade 11 in 2009-10. PPSD students are closer
to the state target in math than reading at grades 3, 4 and 8, and closer in reading than math at
grades 5, 7 and 11. Their point differential is the same at grade 6. (See exhibit 20.)
Exhibit 20. Percentage Point Differences Between PPSD Students with Disabilities
Scoring At Least Proficient and State Targets by Grade in Reading and Math, 2009-10

Review of Special Education in the Providence Public School District
Council of the Great City Schools Page 33
Scores of Students with Disabilities as They Proceed from Grade to Grade
Although not precise, exhibit 21 below shows the percentage of PPSD students with
disabilities who scored at or above proficient levels as they moved from grade to grade.12
In
reading, a smaller percentage of sixth- and seventh-grade students scored proficient and above
than they had done in third grade. Interestingly, current eighth graders scored at about the
same level across the years, with their highest performance rate in fifth grade (2007). The
degree to which the test is well articulated from grade to grade also affects these numbers.
Exhibit 21. NECAP Reading: Current Grade and Scores (Proficient and Above) for
Prior Grades
Also, in math, a much smaller percentage of students performed at or above proficient
levels in their current grade than they did in prior grades. (See exhibit 22.)
Exhibit 22. NECAP Math: Current Grade and Scores (Proficient and Above) for Prior
Grades
12 These years represent students in prior grades, e.g., for sixth graders in 2010, most would have been in third
grade in 2007, in fourth grade in 2008, and in fifth grade in 2009. Because the scores are grade- and not student-
based, the exhibit gives an approximate and not exact reflection of the progression of student performance across
the years.

Review of Special Education in the Providence Public School District
Council of the Great City Schools Page 34
Alternate Assessments
As is the case with other school districts, PPSD students with the most significant
cognitive disabilities take statewide alternative assessments. As exhibits 23 and 24 show, a
much higher percentage of students with significant cognitive disabilities scored proficient or
above on alternative assessments than they did on the regular assessment. However, the high
performance may reflect the portfolio nature of Rhode Island’s alternative assessment and the
skills of the teachers who administer it.
In reading, a higher percentage of students (above or near 80 percent) in grades 2, 3, 4,
and 6 who took the alternative test scored at or above proficient in 2010 than in previous
years. In the fourth grade, reading performance jumped 62 percentage points to 88 percent, but
fifth grade scores fell by 17 points. (See exhibit 23.)
Exhibit 23. Reading: 2008-2010 Rhode Island Alternate Assessments13
Math data showed even greater improvements in student performance. Proficient and
above rates ranged between 86 percent and 91 percent in grades 2, 3, and 4, indicating
significant increases over the prior year. As with reading, the percentage of fourth graders
13 Years with no reported scores reflect a number of students that does not meet the minimum reporting
requirement. Grades for alternate assessment testing occur during the actual year of instruction whereas NECAP
tests on the prior year's instruction, e.g., grade 3 test reflects grade 2 instruction.

Review of Special Education in the Providence Public School District
Council of the Great City Schools Page 35
meeting this standard jumped 71 percentage points. While fifth graders’ performance did not
decline, it did stay the same as the previous year. (See exhibit 24.)
Exhibit 24. Math: 2008-2010 Rhode Island Alternate Assessment
Graduation and Dropout Rates
The rate of students with disabilities graduating from high school in four years with a
regular diploma increased from 43.2 percent in 2007 to 52.8 percent in 2010, but a large gap
exists between the graduation rates of PPSD students with and without disabilities. Although
the gap decreased by 2.1 percentage points between 2007 and 2010, the percentage of students
with disabilities graduating in 2010 was 18.5 points below their nondisabled peers.
Nevertheless, PPSD was within 6.1 percentage points of the state performance-plan target of
58.9 percent. (The target increases one percentage point each school year.) (See exhibit 25.)
Exhibit 25. Four-Year Graduation Rate: Students With and Without Disabilities

Review of Special Education in the Providence Public School District
Council of the Great City Schools Page 36
The special education dropout rate in 2010 (29.4 percent) decreased from the 2007
level of 33.8 percent. However, between 2007 and 2010, the gap between students with and
without disabilities increased from 8.9 to 10.5 percentage points. Furthermore, the 2010
dropout rate of 29.4 percent was higher than the rates in 2008 (23.1 percent) and 2009 (25.5
percent). Although district data show that the dropout rate in 2010 (29.4 percent) was close to
the 24.7 percent SPP target, RIDE reported that PPSD’s 2009-2010 rate was 34.7 percent, up
from the previous year.14
Although the district’s credit recovery program might help to
increase graduation rates and reduce dropout rates, special education services apparently are
not available for this activity. (See exhibit 26.)
Exhibit 26. Dropout Rate: Students With and Without Disabilities
Out-of-School Suspensions and Unexcused Absences
Access to learning is critical for improved student performance. During the 2009-2010
school year, 75 percent of students receiving special education services received no out-of-
school suspensions (suspension) for a disciplinary infraction, compared to 87.4 percent of their
nondisabled peers.
Exhibit 27 below shows the percentage of students with and without disabilities who
received a suspension by the number of days suspended. Generally, these data show that
students with disabilities are suspended at an increasingly higher rate than their nondisabled
peers as the number of suspended days increases from 1 to 10 days. However, the district
14 The link for accessing Rhode Island’s public reporting information, which details the performance of each
LEA on the targets in the SPP, is: https://www.eride.ri.gov/eride2K5/SPED_PublicReporting/ .

Review of Special Education in the Providence Public School District
Council of the Great City Schools Page 37
suspended only 10 students for more than 10 school days in 2009-10. Two of these students
received special education services and were suspended for 11 cumulative days.
Exhibit 27. Percentage of Students With/Without Disabilities Receiving Out-of-School
Suspensions, by Number of Days, 2009-2010 School Year
Exhibit 28 shows that, although the number of days suspended is not excessively high,
students with disabilities are more likely than their nondisabled peers of being suspended for
more days. For example, they are 8.7 times more likely to be suspended for nine days and
seven times more likely to be suspended for 10 days.
Exhibit 28. Likelihood that Students with Disabilities Were Suspended Compared to
Nondisabled Peers, by Days Suspended, 2009-2010 School Year
Most students with disabilities who receive at least one out-of-school suspension have
a disability in the areas of ED (44.1 percent), LD (29 percent), or other health impairment
(36.8 percent). Only nine total students with autism, developmental delay, or traumatic brain

Review of Special Education in the Providence Public School District
Council of the Great City Schools Page 38
injury were suspended. And no students with a hearing impairment, multiple diagnoses,
orthopedic impairment, or visual impairment were suspended. (See exhibit 29.)
Exhibit 29. Percentage of Students by Disability with One or More Out-of-School
Suspensions, 2009-2010 School Year
PPSD only suspended two students with disabilities for more than 10 days. As a
result, RIDE found that the district did not have a significant discrepancy in the rate of
suspensions and expulsions of greater than 20 days in a school year for students with
disabilities or a discrepancy by race or ethnicity. Thus, PPSD met the SPP targets for
indicators 4A and 4B in these areas.
Unexcused Absences
According to some focus group participants, student absenteeism is one of the biggest
challenges to student performance. Exhibit 30 below shows that students with disabilities do
not have a much higher average number of days of unexcused absences than other PPSD
students (11 and 9 days, respectively). However, such unexcused absences on top of excused
absences affect teaching and learning.

Review of Special Education in the Providence Public School District
Council of the Great City Schools Page 39
Exhibit 30. Students with Disabilities, Average Days of Unexcused Absences
A district representative explained that data in the area of orthopedic impairments,
which indicated an average of 51 days of unexcused absences, reflect only two students. One
had 85 days of unexcused and 0 excused days recorded, and the second student had 17
unexcused and 0 excused absences.15
Summary of Positive Observations, Concerns, and Recommendations on
Student Performance
Performance of Students with Disabilities
The following are positive observations, areas of concerns, and recommendations to
improve the performance of students eligible to receive special education services.
Positive Observations
Alternative Assessment Outcomes. A much higher percentage of students with disabilities
in 2010 scored proficient or above on the alternate assessment than they did on the regular
assessment, and scores are increasing dramatically from the previous year in both reading
and math in almost every grade.
15 District personnel suggested that the data may reflect reporting errors. However, it also reflects the
consequences of irregular monitoring and the need for correction of possibly incorrect data.

Review of Special Education in the Providence Public School District
Council of the Great City Schools Page 40
Graduation Rates. The rate of students with disabilities graduating in four years with a
regular diploma increased between 2007 and 2010, when PPSD was within 6.1 percentage
points of the state performance plan target of 58.9 percent.16
Dropout Rates. The special education dropout rate decreased from 2007 to 2010 (33.8
percent to 29.4 percent). 17
Out-of-School Suspensions. PPSD suspended only 10 students for more than 10 total
school days in 2009-10. Only two of these students received special education services and
they were suspended out-of-school for 11 cumulative days. Furthermore, a total of only
nine students with autism, developmental delay, and traumatic brain injury were
suspended. No students with other disabilities were suspended. These data show that the
district does not rely on out-of schools suspensions as a disciplinary tool for students with
disabilities.
Absences. Students with disabilities did not have a much higher average number of days of
unexcused absences (11 days), compared with all PPSD students (9 days).
Areas of Concern
Academic Performance. RIDE reported that 12 percent of all special education students
scored proficient and above in math and reading combined for the 2009-2010 school year.
No progress was reported from the prior year. This outcome is 14 percentage points below
the SPP overall target of 26 percent. Furthermore, this group performed substantially
below the SPP’s NECAP targets for math and reading at every grade level. Students were
closer to the state target in math than in reading at grades 3, 4, and 8, and closer in reading
than in math at grades 5, 7, and 11. Their point differential was the same at grade 6.
Graduation Rates. Some 52.8 percent of students with disabilities graduated in 2010, 18.5
points below their nondisabled peers. Although PPSD was within 6.1 percentage points of
the SPP’s 58.9 percent target, the target increases one percentage point annually for the
next three years. However, there were discrepancies between district and state reporting of
graduation rates. This issue, as well as the reporting of dropout rates (see below), is
discussed in section D on use of technology and data.
Dropout Rates. Between 2007 and 2010, the gap in the dropout rates between students
with and without disabilities increased from 8.9 to 10.5 percentage points. Furthermore,
district data for 2010 showed a special education dropout rate of 29.4 percent, higher than
the rates in 2008 (23.1 percent) and 2009 (25.5 percent). RIDE, however, reported a higher
16 Inconsistency between PPSD and RIDE graduation rates is discussed under Areas of Concern.
17 Inconsistency between PPSD and RIDE special education dropout reporting is discussed under Areas of
Concern.

Review of Special Education in the Providence Public School District
Council of the Great City Schools Page 41
2010 dropout rate of 34.7 but noted that the rate reflected progress over the previous year.
The district’s credit recovery program could help increase graduation rates and reduce
dropout rates, but focus group participants indicated that special education services were
not available for this activity.
Out-of-School Suspensions. Students with disabilities were suspended at an increasingly
higher rate than their nondisabled peers as the number of suspension days increased from 1
to 10. Most students with disabilities receiving at least one out-of-school suspension had a
disability in the areas of ED (44.1 percent), LD (29 percent), or other health impairment
(36.8 percent). Although the district generally does not suspend these students for more
than 10 cumulative days,18
the percentage of students suspended in the three disability
areas was disconcerting.
a. Unexcused Absences. Students with disabilities did not have unexcused absences at a
much greater rate then other PPSD students (11 and 9 days, respectively), but such
unexcused absences on top of excused absences have a negative impact on learning.
Furthermore, it does not appear that data are used to track and follow up on unexcused
absenteeism as data recording errors were suggested as the reason why one student with
disabilities was reported with 85 days and another with 17 days of unexcused absences.
Neither student had any excused absences. Regular monitoring of such data would have
identified these and other students having excessive absenteeism and enabled appropriate
follow-up action.
Recommendations
2. Increase the number of freshman year students who are “on track” to graduate.19
18 Two students with disabilities were suspended for 11 days; the district report did not identify their disability.
19 In a December 2009 report, What Matters for Staying On-Track and Graduating in Chicago Public Schools: A
Focus on Students with Disabilities, the Consortium on Chicago School Research and the National High School
Center found that freshman year course performance—more than background characteristics such as race,
gender, socioeconomic status, or prior achievement—predicts which students with disabilities are most at risk for
dropping out of high school. Specifically, ―on-track‖ students who accumulate at least five semester-long credits
and fail no more than one core course during their freshman year are three to six times more likely to graduate
than their off-track counterparts. In addition, the report found:
Students with emotional disturbances and students without disabilities who entered high school two or more
years below grade level had the lowest level of course performance of any group studied;
Freshman year course performance is a strong predictor of five-year graduation rates for students with
disabilities and students who entered high school two or more years below grade level. Despite the utility of
absences, grades, course failures and on-track status in predicting graduation rates, the researchers found that,
at each level of course performance, students with disabilities and students who entered high school two or
more years below grade level were less likely to graduate than their nondisabled peers.
Higher absence rates are an important factor explaining why students with disabilities fail more classes and
have lower grades than students without identified disabilities.

Review of Special Education in the Providence Public School District
Council of the Great City Schools Page 42
a. Identify students “not on track.” Initiate a strategy to identify and support all
freshman-year students who are ―not on track‖ to graduate, defining ―not on track‖ as
students entering high school two or more years below grade level:
Use a database to identify freshman-year students who are not likely to accumulate
at least five semester-long credits, likely to fail more than two core courses during
the freshman year, and/or have too high absence rates.
Identify and implement research-based strategies to the extent possible for each
student not on track, e.g., mentoring, research-based interventions, and other
supports likely to reverse the student’s performance trend. Require principals with
high dropout rates (and feeder schools) to work with stakeholder groups to develop
targeted plans. See the National Dropout Prevention Center for Students with
Disabilities at http://www.ndpc-sd.org/ for suggestions on research-based practices.
Ensure that credit recovery assistance is provided for students with disabilities in
order to ensure their access to and success in this district program, along with
special education and other supplemental aids and services.
Ensure that all students taking standard state assessments access high school
courses based on core standards. As discussed in more detail in the next section,
students with disabilities (as well as other students) may require differentiated
instruction to access core curricular areas, but they will continue to have low
performance rates unless content is taught systematically and comprehensively.
b. Identify and support high schools with high dropout rates. Identify high schools with
dropout rates above the state’s targets, and require principals to collaborate with
stakeholder groups to develop targeted plans based on research-based approaches
available through the National Dropout Prevention Center for Students with
Disabilities. In addition, identify feeder schools and involve principals and staff of
these schools to address identified issues proactively.
3. Reduce out-of-school suspensions for students with disabilities. Review data from 2009-
10 and 2010-11 showing students with disabilities with five days or more of out-of-school
or in-school suspensions. Based on this information, join with stakeholders to develop
templates for plans (elementary, middle, and high school) with research-based
interventions grounded in RTI/PBIS principles. Disseminate the data and templates to
relevant district administrators and principals, and require principals to integrate the results
into their overall school planning process. Report and disseminate the suspension data
every month to determine the extent to which school activities are having a positive effect,
and follow up as appropriate. Note that this activity would be relevant also for students
without disabilities.

Review of Special Education in the Providence Public School District
Council of the Great City Schools Page 43
4. Generate and distribute monthly reports on unexcused student absences by school for all
students, including those with disabilities, requiring schools to correct any data that appear
to be in error. Establish criteria for excessive absences (excused and unexcused) that
would require school-based staff to investigate the basis for the absence and provide
interventions, such as mentoring and community-based social service support.
Additional recommendations to address the area of academic performance are provided below
in section C, Instructional Practices and Support.

Review of Special Education in the Providence Public School District
Council of the Great City Schools Page 44
Section C. Instructional Practices and Support
This section focuses on the instruction of students who are performing below grade-
level expectations in reading and math and who have challenging behavior. The discussion
begins with a review of district practices on RTI because of its impact on the appropriateness
of identification practices for special education services and the intense supports available for
all students. Following the discussion of RTI, the section will focus on the various educational
settings in which students with disabilities are educated: (1) classroom instruction in inclusive
general-education settings vs. self-contained settings (including those with autism and
challenging behavior), (2) instructional support for ELLs with disabilities, (3) the education of
students in out-of-district settings, and (4) supports for postsecondary transition activities and
services.
Response to Intervention (RTI)
We begin with a summary of PPSD instructional practices that are designed to improve
the academic performance and social/emotion well being of all students, including those with
disabilities. The knowledge and experience of the Council’s team, along with research, show
that Individuals with Disabilities Education Act (IDEA) provisions have not led to special-
education identification practices that are consistent across the nation, districts, or schools. As
a result, districts and schools may have groups of students with similar characteristics, but
while some groups are receiving special education services, and other groups are not. RTI,
which includes positive-behavior intervention and support (PBIS), is designed to strengthen
general education and produce more appropriate special-education identification, and it is a
critical tool for improving classroom instruction for all students.
Research and Relevance to Determination of Special Education Need
As indicated above, almost half (47 percent) of PPSD students receiving special
education are identified as having LD, an especially high proportion, compared with the
state’s 41 percent and the nation’s 37 percent. Generally, it is estimated that 80 percent of
students are identified as LD based on reading difficulties. However, research indicates that
identifying students with LD (or other disabilities) does not necessarily lead to improvements
in reading, particularly in students nine years of age and above.
Traditional approaches to reading instruction in the early grades have substantially
underestimated the variability among children in terms of their talent and preparation for
reading. Data suggest that many of these youngsters have difficulties reading, not because of a
disability but because they are initially behind and do not receive the home and/or classroom
instruction/supports necessary for foundational language and early reading skills. Furthermore,

Review of Special Education in the Providence Public School District
Council of the Great City Schools Page 45
students having difficulty reading often exhibit challenging behavior as well.20
Research has also shown that it can be difficult to distinguish between (1) internal
child traits that require ongoing support from special education and (2) an inadequate
opportunity or contextual support for learning and behavior. If children having difficulty
reading receive effective instruction early and intensively, they can often make large gains in
general academic achievement. Research has shown that reading failure rates as high as 38-40
percent can be reduced to 6 percent or less. By providing proper early intervention, special
education resources can be deployed intensively to the six percent of struggling readers who
do not respond to instruction successfully. Without early identification and effective
intervention, children with learning disabilities, as well as others with reading difficulties,
need long-term, intensive, and expensive special education services. Similarly, staff can
successfully reduce behavioral disruptions through the use of PBIS.
In light of this research, Rhode Island school districts have been required since
September 1, 2010, to use an RTI process to determine whether a student needs special
education in the area of LD. Middle and high schools must use this process by September 1,
2011. At this point, school districts may no longer use the traditional significant
ability/performance discrepancy criteria or approach to determine eligibility. This new
requirement has significant implications for PPSD. The first of several criteria for LD
essentially is that a student is scoring below proficient on statewide reading and/or math
assessments. If the district does not have an effective, comprehensive, and well-implemented
system of RTI, then it is difficult to determine whether a student’s below-proficient reading
performance is due to inadequate instruction or to a disability.
Providence RTI Framework
According to information provided by the district to the Council’s team, a research-
based, multi-tiered reading intervention model of RTI will be implemented in the fall of 2011:
PPSD is in the process of building a system that will provide student-centered,
data-driven supports and interventions utilizing a problem-solving process…to
determine appropriate levels of support and intervention will include
identification of student-based issues, (specifying both target and actual
performance), identification of supports and interventions developed to
address those issues, measurements designed to evaluate responsiveness, and
the identification of responsible LEA staff.
20 Statement by Dr. Reid Lyon before the House Committee on Education and the Workforce Subcommittee on
Education Reform (2002) at hhs.gov/asl/testify/t020606a.html; Technical Assistance Center on Positive Behavior
Interventions and Support at http://www.pbis.org/apbs2008.html; National Center on Student Progress
Monitoring at
http://www.studentprogress.org/; Minority Students in Special and Gifted Education (2001) at
http://books.nap.edu/openbook.php?record_id=10128&page=15

Review of Special Education in the Providence Public School District
Council of the Great City Schools Page 46
In spite of this projected implementation date, the team received a substantial amount
of written and verbal information about RTI activities that have been implemented, including
universal screening and progress monitoring, tiered intervention, PBIS, and teacher support
teams. In addition, the district has participated in RIDE’s RTI Technical Assistance Project.
The district’s current implementation of RTI is reviewed below.
At present, it appears the district is using universal screening and progress monitoring
tools for reading:
Wireless Generation’s MClass is used to provide early electronic-literacy assessment
through the use of palm pilots that allow input and analysis of Dynamic Indicators of Basic
Early Literacy Skills (DIBELS) benchmarking data for every child in grades K-3. The
system is also used for students in grades four and five who are involved with RTI for
benchmarking and progress monitoring. All administrators have been trained to analyze
this data by school, child, and teacher.
The Group Reading Assessment and Diagnostic Evaluation (GRADE) is used as a
universal screener in reading and is administered three times during the year for all
students in grades 4 through 12, except for students receiving special education and who
are ELL and meet exemption criteria. GRADE results are considered along with other
measures, including NECAP results, to identify students needing tier 2 or tier 3 supports.
Assessments connected with various intervention programs are used ―for placement‖ and
progress monitoring.
Intervention programs, such as Language! and Direct Instruction, are also used and include
progress monitoring data and analysis.
It appears that the district has not yet identified a universal screener for math.
Currently, NECAP math results are used along with program assessments for placement and
progress- monitoring purposes. In the absence of a math screening tool(s), the special
education office, in collaboration with the math department, began to pilot the tool,
Monitoring Basic Skills Progress, at three elementary schools. The use of the tool as a
universal screening device has been challenging, however, since schools chose to begin
implementing it in one grade only.
Written information that provides a description of the district’s three increasingly
intensive tiers in reading at the elementary and secondary levels shows the following elements
(see exhibits 31 and 32):
Exhibit 31. Elementary Level Intervention Parameters
Frequency Duration Instructional Intensity
Tier 1 1-3 times a week 15 to 20 minutes
Whole small-group instruction by classroom teacher.

Review of Special Education in the Providence Public School District
Council of the Great City Schools Page 47
Tier 2 3-5 times a week 20 minutes Targeted lessons from core curriculum.
Tier 3
(> year below grade level)
Daily 30 minutes Alternative small-group curriculum by instructional support personnel, mostly special educators. (Applies to about 30 percent of students).
Exhibit 32. Secondary Level Intervention Parameters
Performance Criteria Instructional Intensity
Tier 1 On or above grade level in reading or mathematics
Instruction in core grade level curriculum in a single period that includes appropriate in-class supports to attain, maintain, and improve grade level performance.
Tier 2 On or near grade level in reading or mathematics but struggling in identified areas
Standards-based, student centered and differentiated instruction that temporarily supplements the core; in addition to above, additional period of targeted intervention to reinforce achievement in core grade-level curriculum.
Tier 3 Two or more grade levels below in reading or mathematics
Instruction temporarily replaces core curriculum; intensive intervention for extended time (two periods or 90 minutes) to accelerate progress so students can access core grade-level curriculum.
Focus Group Concerns
Focus group generally believed that the pieces of RTI are in place in PPSD, but most
agreed that there was no comprehensive framework in place to support a systemwide
approach to RTI for all students, including students with disabilities and ELLs. Other
participants viewed RTI core curriculum, interventions, and progress monitoring as
challenging to implement.
At the elementary-school level, instruction in all three tiers occurs at the same time for
each grade level in order to minimize disruptions and maintain instructional continuity, as
well as to allow for inter-class grade-based homogeneous instructional groupings. Focus
group participants expressed concern that tier 2 interventions at the elementary level were
not being used effectively and that instructional differentiation in the core curriculum was
limited. Furthermore, focus group members were concerned that some schools did not
have sufficient staff to provide tier 3 interventions effectively and that there were no tier 3
math interventions.

Review of Special Education in the Providence Public School District
Council of the Great City Schools Page 48
At both the elementary and high school levels, reading intervention programs were
considered to be successful. Math interventions were also cited as successful at the
secondary level. Some focus group members expressed concern, however, about the status
of some intervention programs for the next school year. Moreover, it was also unclear
whether data exist to show the extent to which students improve their performance as a
result of these interventions.
At some schools, administrators reportedly ask special educators, related-service
providers, and teacher assistants (under teacher supervision) frequently to implement tier 2
interventions and progress monitoring.
Teachers have difficulty documenting the provision of interventions and analyzing data for
progress monitoring because of insufficient professional development.
A valid and reliable screening tool for language acquisition has not been identified for
ELL preschoolers.
It is unclear how the personal learning plans (PLP) used in the district interface with RTI.
PLPs are required for students underachieving in literacy and must be reviewed every four
weeks to analyze student progress on the interventions. Also, there was a perceived lack of
consistency in the development and implementation of plans.
Positive Behavior Intervention and Supports (PBIS)
By all accounts, student misbehavior is a major problem in the schools, especially at
the high school level. In addition to taking significant attention away from instruction, it takes
up much of the principal’s and special education administrators’ time. It was reported to the
Council’s team that special education directors are approached for clinical placements of
students without disabilities, who must be removed for disciplinary reasons when there is
insufficient room in the district to accommodate them.
The special education office has developed a three-tiered and research-based PBIS
model as the behavioral component of RTI in order to proactively meet the needs of students
with challenging behaviors and to help determine if a student has an emotional disturbance
and needs special education services. Staff reported that 19 of 21 elementary schools and all
middle schools have been trained to implement tier 1 schoolwide PBIS. However, staff also
reported that not all of the middle and none of the high schools have the PBIS process in
place. The district does employ behavior coaches, but they are assigned to behavior-
intervention classes designed only for students receiving special education services.
To support PBIS in the district, a leadership team (four psychologists and three social
workers) collaborates with the Sherlock Center at Rhode Island College to:
Provide training for implementation of tiers 1 and 2.

Review of Special Education in the Providence Public School District
Council of the Great City Schools Page 49
Implement ―trainer-of-trainers‖ professional development to increase districtwide PBIS
capacity.
Give guidance and ongoing support to school-based targeted behavior teams, which
include the school psychologist, social worker, nurse, teacher(s), and/or guidance
counselor.
Provide ongoing technical support and data collection/analysis to all district schools using
PBIS. This includes providing support for data collection and reporting of office referrals
and consequences for disciplinary infractions on the electronic School-Wide Information
System (SWIS).
Conduct School Evaluation Surveys, which are research-based assessments of PBIS
implementation at the school level.
Link all PBIS schools through twice-annual meetings to exchange ideas and assess school
needs.
―Serve as the advocacy and communication link for all PBIS schools in the district and
with level administrators.‖
In addition, the leadership team actively engages with the community to communicate
the benefits and function of PBIS by co-presenting with the Providence Teachers Union and
presenting to the Local Parent Advisory Committee for Special Education (LAC), the Parents
Alliance, and to the Providence After School Alliance (PASA). In addition, psychologists and
social workers are developing a PBIS procedural guide and handbook.
Focus Group Concerns
Focus group participants expressed concern that schools were not implementing PBIS with
sufficient fidelity, something the Council’s teams often hear when conducting these
reviews. Although the district has voluminous written information about supporting
positive student behavior and forms (including an excellent classroom management
checklist), the information is not compiled in a single document or on the district’s website
for easy reference.
A major concern of the focus groups involved the lack of an explicit district policy for
PBIS or established expectations for its implementation. This void is leaving too many
teachers without the tools they need for effective classroom management that would lead
to positive student behavior. Some participants also indicated that they believed that some
teachers resist or fail to implement suggestions from psychologists and social workers.
There was also a general perception that classroom management was not a priority for the
district and that professional development was more available for related-services
personnel than for teachers or teacher assistants. Focus group participants also indicated

Review of Special Education in the Providence Public School District
Council of the Great City Schools Page 50
that resistance to PBIS was also evident among some specialists (e.g., art, music, physical
education, health) and part-time staff. Also, there was resistance by some staff members
who prefer to concentrate on negative consequences rather than taking a more proactive,
positive approach through PBIS.
According to focus group participants, one consequence of the lack of systemwide
expectations for PBIS implementation is the lack of a consistent electronic progress-
monitoring tool for behavior. SWIS use is scattered, and there has been active resistance to
it in some schools (mostly middle) where secretaries filed a grievance to challenge the
requirement for them to input of SWIS data. As a result, some schools no longer collect
this information electronically and have gone back to a paper/pencil recording systems that
makes it difficult to aggregate and analyze data on a school, grade, or district level. In
addition, because of the way the SWIS vendor manages the product, the central office does
not have automatic access to the data. Only the schools—not the district—have access to
the data unless the school grants permission to the district to access it.
Although the district has used a nationally recognized consultant to provide training for
staff to address the needs of students with disabilities who have significant behavioral
challenges, the district lacks a common language for the development and use of behavior
intervention plans (BIPs) and for a behavior education program, which is a student
intervention program based on a ―check-in/check-out‖ model. As a result, there is
confusion between the two activities, i.e., the interventions and the behavior programs,
which have different purposes. Training has been provided on the development of
effective functional behavior assessments (FBA) and BIPs, but not all teachers reported
familiarity with their use.
Although there has been a fair amount of professional development provided to school
staff, concern remains that it has not been sufficient due to funding restraints or that,
because it is not mandatory, all necessary school staff do not attend. In addition, there is
concern that the district lacks a systemic approach to providing teachers additional support
when necessary.
Although more elementary and middle schools have tier 1 (schoolwide) and tier 2
interventions for groups or individual students needing targeted assistance, fewer schools
have tier 3 community-based ―wrap around‖ services for students with intensive needs.
Teacher Support Teams
To support RTI practices, the district uses a teacher support team (TST) model where
teachers can receive collaborative support to develop effective strategies for students
experiencing learning and behavioral difficulties in the classroom. According to written
information, principals should head the TST when it includes various school-based educators.
The TST process includes

Review of Special Education in the Providence Public School District
Council of the Great City Schools Page 51
a. A thorough review of the student’s learning problems.
A written intervention plan, which includes (1) recommendations for specific in-school
accommodations/modifications, such as curriculum modification; (2) teaching strategies for use of
support and consultative services; and (3) personnel responsible for implementation.
Monitoring progress of performance and adjustments to instruction based on the results of that
monitoring.
Parental involvement and how parents can support their child.
b. The following concerns were raised about the TST process and its implementation:
The special education office has taken a leading role in the TST process. Because the TST
is mainly staffed my special education teachers and related service personnel, and because
the special education office provides training for TST participants and develops
information and forms, there is a close relationship with RTI, the TST process, and special
education. Teachers view RTI and TST as an avenue to special education services.
TSTs at schools with more supportive leadership have more productive teams than schools
who do not. As with PBIS, there are no systemwide expectations for this process.
For the most part, TST is a before/after school activity, which is a problem when staff
members are unable to participate at these times.
Data Analysis of Students with Disabilities in Various Educational Settings
As is required by federal law, RIDE has established targets in its SPP for the
percentage of students with disabilities ages 6-21 years who receive special education services
in three specified types of educational settings: general education more than 79 percent of the
time; general education less than 40 percent of the time; and in separate schools. The exhibits
below show PPSD’s outcomes in these areas.
Students with Disabilities in General Educational Settings and Separate Schools
The exhibits below provide data on participant rates in various PPSD educational
settings, compared with the state and the nation:
General Education for More than 79 Percent of the Time: PPSD’s rate of 63.2 percent is
higher than the nation’s 59.4 percent but less than the state’s 72.4 percent. The district’s
rate does not meet the state’s standard for this setting.
General Education Between 79 and 40 Percent of the Time: The district’s 4.1 percent
rate and the state’s 8.0 percent rate reflect a much lower use of this educational setting
than the nation’s 20.7 percent. The SPP does not have a performance target in this area.

Review of Special Education in the Providence Public School District
Council of the Great City Schools Page 52
General Education for Less than 40 Percent of the Time: PPSD’s rate of 25.8 percent is
higher than both the state’s rate of 12.8 and nation’s rate of 14.6 percent. The district’s rate
does not meet the state’s standard for this setting.
Separate Schools: PPSD’s rate of 4.8 percent of students in this setting is lower than the
state’s average of 5.1 percent but higher than the nation’s 3.4 percent. Still, the district did
not meet the state’s target of 3.0 percent.
Exhibit 33. Educational Settings 6-21 Years of Age21
Comparison of Educational Setting Placement over Time
The percentage of students receiving special education services in general education
settings more than 79 percent of the time was slightly higher in 2010 (63.2 percent) than in
2007 (62.3 percent). Similarly, students educated in general education less than 40 percent of
the time decreased little more than one percentage point (27.0 to 25.8 percent).
However, the percentage of students educated in general education between 40
percent and 79 percent of the time nearly doubled from 2.4 percent to 4.1 percent over the
period. Finally, the percentage of students in separate schools decreased from 5.0 percent to
4.1 percent. (See exhibit 34.)
21 PPSD and state data are based on RIDE 2010-11 school year and were provided by PPSD; National data are
based on the 2009-10 school year and are provided by Data Accountability Center at
https://www.ideadata.org/arc_toc11.asp#partbLRE.

Review of Special Education in the Providence Public School District
Council of the Great City Schools Page 53
Exhibit 34. Percentage of Students in Various Educational Settings (2006-10)
PPSD Placement Rates by Disability Areas
PPSD data provided to the Council’s team did not show the federally mandated
educational settings by disability area. Instead, the district restricts its analysis to students in
general education or in self-contained classes. In the exhibit below, district data from 2009-10
are compared to the latest available national data from 2005-06.22
(See exhibit 34.)
Other than the area of speech/language, a smaller percentage of PPSD students are in
general education settings than in the US. The disparity is especially significant in the areas of
autism, ED, intellectual disabilities, and students with multiple diagnoses. (See exhibit 35.)
Exhibit 35. Percentage of Students by Disability in General Education, PPSD, 2009-10,
U.S., 2005-06
In addition, other than in the areas of speech/language and multiple diagnoses, a larger
percentage of PPSD students in every disability area are educated in separate classes for most
22 Source is latest available U.S. Department of Education 29
th Annual Report to Congress. Note: Historically, the
percentage of students in less restrictive environments increases by year. Data were combined for students in
general education more than 79 percent of the time and between 40 and 79 percent of the time.

Review of Special Education in the Providence Public School District
Council of the Great City Schools Page 54
of the school day. The disparity is especially apparent in the areas of other health impairment,
ED, and intellectual disability. (See exhibit 36.)
Exhibit 36. Percentage of Students by Disability in Self-Contained Classes, PPSD 2009-
10, U.S. 2005-06
Compared to the nation at large, PPSD educates a larger percentage of students with
ED and multiple diagnoses in separate schools (day and residential). However, the placement
rates are not so different from the nation in other disability areas. Note that it is not clear from
the data whether the rates include students from the Birch Vocational Center, which is also a
separate school. (See exhibit 37.)
Exhibit 37. Percentage of Students by Disability in Special Schools

Review of Special Education in the Providence Public School District
Council of the Great City Schools Page 55
Students with Disabilities by Race/Ethnicity in Various Educational Settings
IDEA requires states to monitor the extent to which school districts have significantly
disproportionate rates of students in various educational settings by race/ethnicity. RIDE uses
risk analyses rates to determine the extent to which district students in each racial/ethnic
subgroup are placed in each educational setting. The exhibits below show RIDE data for
PPSD, compared with the state.
For students receiving special education services who spend at least 80 percent of the
time in the general education setting, PPSD data are not very different from the state’s 66.2
percent figure, although the likelihood for PPSD’s Hispanic students is slightly higher than for
Hispanic students statewide. (See exhibit 38.)
Exhibit 38. Percentage of Special Education Students Who Spend at Least 80 Percent of
Their Time in the General Education Setting, by Race/Ethnicity, in PPSD and in State,
2009
PPSD students in all racial/ethnic groups who receive special education services are
more likely to spend less than 40 percent of the time in the general education setting than
their statewide peers. In 2009, the likelihood decreased for PPSD’s Hispanic students,
increased slightly for White students, and increased to a greater extent for Native Americans.
The likelihood for Black and Asian students remained the same. (See exhibit 39.)

Review of Special Education in the Providence Public School District
Council of the Great City Schools Page 56
Exhibit 39. Percentage of Special Education Students Who Spend Less than 40 Percent
of Their Time in the General Education Setting, by Race/Ethnicity, in PPSD and
Statewide, 2009
The likelihood that White and Black students receiving special education services are
being educated in a separate school has decreased over time. The likelihood continues to be
greatest for White students, however, and Black students have a slightly higher likelihood than
other White and Black students in the state. (See exhibit 40.)
Exhibit 40. Percentage of Special Education Students Who Are Educated in Separate
Schools by Race/Ethnicity, in PPSD and Statewide, 2009 23
23 The number of Asian and Native American students in special schools was too small for the risk analysis.

Review of Special Education in the Providence Public School District
Council of the Great City Schools Page 57
Supporting Instruction in Inclusive Settings
As reported above, only 12 percent of students with disabilities overall scored
proficient and above in math and reading in the 2009-2010 school year, a rate that showed no
progress over the previous year. Some 52.8 percent of students with disabilities graduated in
2010, 18.5 percentage points below their nondisabled peers, and the gap in graduation rates
between students with and without disabilities increased 8.9 points between 2007 and 2010.
To determine how PPSD might better support students with disabilities on these
performance outcomes, the Council’s team looked at the manner of instruction, interventions,
and supports provided to these students in general education classes where the majority (67
percent) of the students receiving special education services spent at least 40 percent of their
time during the school day. Written PPSD materials and focus group participants provided
information pertinent to this topic, which is summarized below.
Differentiating Instruction
For students with disabilities to be successful, it is essential that their instruction be
differentiated so that each student is able to access and master the core curriculum.24
Focus
group members reported varying degrees to which teachers implement differentiated
instruction adequately.
At all grade levels, general education teachers reported having a difficult time instructing
students with different needs. This was especially true at schools having an overall reading
proficiency rate below 35 percent and classes where as many as 40 percent of the students
have an individualized education program (IEP).
Focus group participants reported that differentiation has been more successful at
elementary schools (although it is still a developing skill) than at the high school level,
where it is perceived that ―teachers teach subjects and not students.‖ Implementation has
also been difficult for some teachers at all levels, who do not believe that some students
may need a different approach to instruction.
At the middle school level, principals indicated that there had been professional
development in differentiation, including how to organize classrooms utilizing a math-
workshop model. In addition, principals’ ―walk-through‖ tools address the application of
differentiated instruction training, but overall, most believed that practice was at a 5 on a
10-point scale.
24 Note that differentiated instruction is also needed for students without disabilities, ELL students, and students
receiving special education in separate self-contained classes.

Review of Special Education in the Providence Public School District
Council of the Great City Schools Page 58
General Education Instructional Support
PPSD has several different approaches to supporting students with disabilities who
receive instruction in general education classes for the majority of the school day. These
include the use of intensive resource support; support by special educators, therapists, and/or
trained paraprofessional; and co-teaching.
Support through Special Educator, Therapist, and/or Paraprofessional
Special educators, therapists, and/or trained paraprofessionals provide direct
instruction, instructional support, and other special education instruction and support to
students or groups of students. Speech/language pathologists, for example, focus on providing
extra services in general education classes. Some concerns were expressed, however, that
students requiring ―intensive resource‖ support were not always receiving all that the IEPs
required.
Co-Teaching
The Council’s team received more feedback about the PPSD co-teaching model than
any other model used by special educators and others to support students with disabilities in
general education classes. Under the co-teaching strategy, general and special educators teach
together in the general education class using a variety of models.
At the middle and high school levels, PPSD reported having difficulty hiring special
educators with dual certifications in a content area (particularly math and sciences) to teach
core curricular material in a self-contained setting. To address this situation, a pilot program
was established in which students formerly instructed in separate classes now receive
instruction in the general education class with co-teaching support. This model is in place in at
three of the district’s six middle schools and two of its high schools, and the students attend
general education math, science, social studies, and English, as well as intervention programs.
All teachers in the pilot program received professional development on co-teaching
strategies, including a review of special education regulations, co-teaching models, and
effective implementation and planning. The training was school-based and involved co-
teachers working together to plan and develop a co-teaching environment in the 2010-11
school year. In addition, special education directors and supervisors provided and will
continue to provide in 2011-12 professional development to other special and general
educators on co-teaching models and strategies, and differentiating instruction.
At the high school level, students’ ―teacher of record‖ continues to be the special
educator even though the general educator delivers the content material. The special educator
modifies the content to the level of instruction for students in the ―self-contained classroom.‖
At high schools not participating in the pilot, students continue to receive instruction in their
self-contained classes with 12 to 15 students from special educators not certified in a content
area but who otherwise meet the state’s high qualification standard.

Review of Special Education in the Providence Public School District
Council of the Great City Schools Page 59
The district is expanding its co-teaching approach for the upcoming school year at all
levels. Trained special education specialists will serve as coaches to teams of co-teachers to
provide technical assistance and embedded professional development in order to improve the
extent to which students with disabilities can access the core curriculum. The following bullets
summarize focus group feedback on the district’s co-teaching efforts.
It was apparent that more special educators are providing instruction in general education
classes than in the past and there is a desire by most personnel to see more co-teaching and
supports for co-teaching in place. Also, there is a strong perception among focus group
participants that co-teaching has improved, especially at the elementary level, and while it
is not consistently implemented at a high level across all schools and classes, some good
models are in place. The process is at various stages of development and looks different in
different schools and even within schools. One impressive example, however, involved
fourth grade ELL students where 16 of 24 were able to exit bilingual classes and were
succeeding on grade-level material.
There were concerns about the impact of co-teaching when the two teachers do not ―get
along.‖ For example, some focus group members indicated that some principals have paid
insufficient attention to the pairing process and teacher preferences. At times, there is
tension because of a perception that the general educator is not sufficiently ―sharing‖ the
class. Tension may also arise when special educators lack expertise in a core curricular
area and are not qualified to provide any primary instruction or effective support. The
process appears to work best when special educators are highly qualified in content areas.
For example, it was reported that in a high school chemistry class an exemplary co-
teaching team supported all students, including the large percentage of those with IEPs. In
this case the special educator had significant expertise in chemistry. Teachers expressed a
desire to visit such model classes to see high quality instruction in practice. It was
suggested that recruiting special educators trained in needed content areas—or training
special educators in those areas—would greatly benefit instruction.
Although PPSD provides what appears to be a fair amount of professional development to
support inclusionary practices, there is a universal belief among staff members the team
interviewed that more is needed. Suggested areas of professional development include
differentiation instruction and hands-on application of various co-teaching models.
Focus groups noted these additional challenges to providing effective co-teaching:
A lack of effective models for special educators to support students in general
education classes when co-teaching is not occurring full time. In some cases, a
paraprofessional will support students when the special educator is not available, but
there is little time for sharing information. There is also a concern that all ―IEP
minutes‖ are not always provided.
Classes with more than 30 percent students with IEPs.
Inclusion of students with very different instructional needs.

Review of Special Education in the Providence Public School District
Council of the Great City Schools Page 60
IEP goals that are not aligned with class content.
Challenging behavior of students, including those without disabilities.
The need for materials and supplies, although one principal indicated how such
purchases were prioritized and accomplished.
Finally, although there is weekly common planning time for special and general
educators to focus on standards and sharing instructional practices (including student
modifications and accommodations), many interviewees said that such time is not
consistently available.
Supporting Instruction in Self-Contained Settings
PPSD provides students with special education services in 21 separate self-contained
classes that typically have two to three different grade levels in each class. Programs are
designed for students with autism, severe intellectual disabilities with a possible combination
of medical needs, and seriously challenging behavior.
In General
According to district information, the distribution of self-contained classes across
schools has changed over time. In the past, there were one to two such classrooms in a school
building, each having three to four grade levels. In the past three years, however, elementary-
level self-contained classes are at fewer schools, so each school has at least three classes with
two grades in each. For example, Webster Avenue School has three classes at grades K-1, 2-3
and 4-5. As a result, students do not have to move between elementary schools as they
advance to the next grade. Below is a summary of substantive issues raised by focus group
participants:
It is difficult for teachers to provide their students access to the core curriculum when
covering two grade levels.
Although schools consider enabling students to attend general education classes during the
day, the opportunity is limited by ―full general education classrooms,‖ ―scheduling
conflicts,‖ or a financial inability to add staff for additional support
Some focus group participants were concerned that it was difficult to educate more
students in general education classes because general educators are not trained sufficiently
in addressing behavioral and instructional needs of students who previously had been
educated in self-contained classes.
Students at high schools that are not in the district’s pilot program continue to receive
instruction in self-contained classes with 12 to 15 students from special educators who not
certified in a content area but meet the state’s high qualification standards.

Review of Special Education in the Providence Public School District
Council of the Great City Schools Page 61
―Special education classes‖ are often referred to as ―fundamental‖ at the high school level,
reflecting content that is different from the grade-level standards upon which students with
disabilities who take the NECAP are assessed.
Intensive Interventions for Students with Autism Spectrum Disorder (Autism)
According to some focus group participants, the autism program is well respected.
Hope High School has a self-contained program for students with autism that RIDE
designated as a model. However, 71 percent of PPSD students with autism are educated
outside of general education classes for at least 60 percent of the school day either in a district
or private school setting,25
compared with 50 percent nationwide.
An autism specialist/board certified behavior analyst supervises the autism team,
which includes a behavior analyst (certified in applied behavioral analysis), a social worker, a
speech pathologist, an occupational therapist, a job coach, social coaches, and teacher
assistants. The autism team provides support to students and their teachers in the district’s 10
self-contained classes and consults with school teams educating students in general education
classes in district and local private school settings (for parentally placed students). Also, the
autism team provides in- and out-of-class professional development to special educators and
teacher assistants.
Written information prepared by the district describes various research-based
instructional approaches used to support these students. But, commenting about services
provided to students with autism, focus group members noted the need for more equipment
and supplies, such as weighted vests, and for a larger teacher-substitute pool for absent teacher
assistants.
Intensive Behavioral Interventions
As discussed above, issues involving disruptive behavior of students with and without
disabilities take up a significant amount of teacher and administrative time. The district’s
Behavior Intervention Program is designed to enhance the academic and social/emotional
skills of students with behavior problems that could not be addressed in general education
classes. The program has the following features:
Use of a structured and specific behavioral-point system in all classes.
Personnel that include special educators, teacher assistants, social workers, and behavior
coaches highly trained in crisis prevention and intervention and behavior management
strategies.
25 Twelve percent of PPSD’s students with autism are placed out of district in a private school to receive an
appropriate education.

Review of Special Education in the Providence Public School District
Council of the Great City Schools Page 62
Behavior coaches who perform multiple tasks daily, including observing students and
recommending interventions, addressing crisis situations, leading social groups and
engaging parents, liaising with outside agencies, leading monthly data-review sessions
with teachers, and providing professional development for schools and the district. The
behavioral coaches credit the additional 10 days they work for enabling them to
accomplish all their tasks. They also credit a supportive supervisor, even though the
supervisor is also responsible for schools without the program and is not assigned to all
schools with the program.
Professional development for teachers and staff on the analysis of behavioral data and
support for students with challenging behaviors.
Focus group and special education administrators had a number of major concerns
about the program, however, which involved the lack of a sufficient number of qualified
teachers and teacher assistants and the manner in which they are assigned. For example:
Teacher assistants are placed by seniority and the bidding process, and substitutes are not
available to cover their frequent absences. These issues, which also apply to the autism
program, are discussed further in section D.
Most teachers hired by principals are new to the field.
Some positions are filled through ―forced placements,‖ where PPSD teachers who do not
have jobs are able to select from open positions.
Last school year, the district used American Recovery and Reinvestment Act (ARRA)
funds to support 36 students who had been in out-of-district placements, permitting them to
attend PPSD Behavior Intervention Programs at middle school (1 class) and high school (2
classes). The district also added a vocational component and wraparound services with a
mental health agency. Although this action reduced the cost of private school tuition, the
initiative was not considered fully successful because the monthly training sessions for
teachers in crisis intervention and behavior did not compensate for their lack of experience,
knowledge, and skills with these students. In addition, a reduction in the number of behavior
coaches and social workers—as well as loss of staff to paternity and maternity leave—
weakened staff capability.
Next year, students in the unsuccessful classes will be returning to out-of-district
placements. This plan, however, will reduce the capacity of the Behavior Intervention
Program and provide fewer in-district options for students with disabilities who have the
greatest need for the most intensive behavioral interventions, including some students
transferring from the Rhode Island Training School. The Council’s team was told that the
district was unable to contract with private schools to provide experienced support services in
district schools—a successful model used by other districts—because of union contract issues.

Review of Special Education in the Providence Public School District
Council of the Great City Schools Page 63
Instruction for English Language Learners with Disabilities
The district uses a variety of models to support students who are ELL and also have
IEPs. These models are different for students in grades K-6 and at the middle and high school
levels. ELL students in K-6 receive language support in bilingual or English as a second
language (ESL) classes. An ELL student may receive special education instruction in the
following ways:
Bilingual co-taught class
Bilingual special education self-contained class, or
ESL class with special education resource support.
ESL teachers do not support students with disabilities who are ELL in either general
education or self-contained classes. ESL self-contained classes (at the elementary level) are
not able to provide support that requires self-contained special education or special education
inclusion (two to three hours a day). In these cases, an ELL with disabilities, who is placed in
an ESL class would need to waive his or her ESL language-support services in order to be
placed in a general education or self-contained special education class. However, bilingual
education self-contained classes (at the elementary level) are able to provide support for ELLs
with disabilities through special education resource or bilingual/special education self-
contained classes. ESL self-contained classes can accommodate special education resource
support for ELLs with disabilities, which includes one hour of instruction three times a week.
At the middle and high school levels, ELLs with disabilities may receive ESL and special
education support in a more flexible manner.
ELL students, including those with disabilities, are provided with the reading
intervention Language!. Teachers report that students make good performance gains with this
intervention program. Focus group participants reported, however, that they had the following
additional concerns about instruction for ELLs with disabilities:
The large percentage of students with disabilities in ESL or bilingual classes. The Council
team was told that some ESL teachers will not support ELL students outside of an ESL
class.
Although ELLs with disabilities may be identified for a gifted or talented program through
the use of a nonverbal assessment, teachers provide few if any accommodations.
The district does not have a sufficient number of teachers who are ESL-certified and able
to effectively use strategies to support or scaffold student language development.
However, a number of organizations and the Rhode Island College offer ELL certification,
which involves three classes.

Review of Special Education in the Providence Public School District
Council of the Great City Schools Page 64
Placement of Students in Out-of-District Private Schools
PPSD reported that the percentage of students with disabilities placed in private out-of-
district schools fell from a high of 6.04 percent in 2009-10 to 4.01 percent in 2010-11. Of the
235 students26
PPSD placed in private schools, 52.3 percent (123 students) were identified as
having ED and 13.6 percent (32) had multiple diagnoses.
The remaining 34.0 percent of students (80 students) were identified as having a small
number of other primary disabilities. Because of the difficulties with the district’s expansion
of the Behavior Intervention Program as discussed earlier (pp. 61-62), the district anticipates
that students who were in unsuccessful classes will be placed back in private school settings.
Also, it was reported to the Council’s team that the Student Affairs Office frequently calls for
private placements for students who have violated the code of conduct or need a 45-day
diagnostic placement.
Unlike some other states, Rhode Island does not set rates for private out-of-district
special education facilities. However, by reducing the number of private schools used by the
district, one of PPSD’s special education directors was able to negotiate a reduced rate with
four private schools. Moreover, an additional expense for next school year involves a newly
applied tuition the state will be charging for students attending the School for the Deaf.
Support for Postsecondary Transition Activities and Services
Transition services are intended to better prepare students with disabilities to gain
access to the supports and services necessary for them to reach desired outcomes and become
as independent as possible. The transition planning process is expected to promote
postsecondary school experiences based on student preferences, interests, and abilities.
SPP Indicators
Because of the importance of transition activities and services, states are required by
federal law to monitor two areas as part of the SPP. The indicators and the district’s level of
performance are described below.
Indicator 13–Transition Planning. With a rate of 97 percent, PPSD almost met the
rigorous federal mandate of 100 percent compliance for youth 16 years and above with an
IEP that:
Includes appropriate, measurable postsecondary goals.
26 Note that, at the time of the Council’s team visit, PPSD had 266 students in out-of-district placements. The
number fluctuates depending on the needs of newly enrolled students and changing student needs in PPSD
schools.

Review of Special Education in the Providence Public School District
Council of the Great City Schools Page 65
Is annually updated and based on an age-appropriate transition assessment, transition
services, and courses of study that reasonably enable students to meet postsecondary
goals.
Includes annual IEP goals on the student’s transition services needs.
Has documentation showing the student was invited to the IEP team meeting where
transition was discussed.
Has documentation showing that, if appropriate, a representative of a participating
agency was invited to the meeting (with prior consent of the parent or student who is
18 years of age or older).27
The Council’s team was also informed that the district’s compliance rate in this area was
90.4 percent, which is lower than the reported 97 percent rate. We were unable to reconcile
the discrepancy.
Indicator 14 - Transition Outcomes. According to RIDE’s 2009-10 public reporting,
66.2 percent of youth with IEPs no longer in secondary school and within one year of
leaving high school were enrolled in higher education or some other type of postsecondary
education or training program or were employed. The SPP’s overall target was 75.9
percent. Although data are not yet available, the state’s targets for 2010-11 were:
33 percent enrolled in higher education
67 percent enrolled in higher education or competitively employed
78 percent enrolled in higher education or in some other postsecondary education or
training program, or competitively employed or in some other employment within one
year of leaving high school.28
Overview
Generally, PPSD has a strong system of transition services and activities, evidence of
which is seen in the following highlights:
Through a strong partnership with RIDE and the state’s Office of Rehabilitation Services
(ORS), the agencies fund a consultant who serves as the district’s transition director. The
director is extremely knowledgeable about transition support and provides guidance,
technical assistance, and professional development for special and general educators.
A high school elective transition course is offered to all juniors and seniors to work on
transition services and includes a senior research seminar.
27 RIDE data reflects the public reporting period of July 1, 2009 to June 30, 2010, which was reported in the
Annual Progress Report/SPP to OSEP on February 1, 2011. 28
These outcome targets increase by one percentage point each year.

Review of Special Education in the Providence Public School District
Council of the Great City Schools Page 66
An ORS-funded rehabilitation councilor is in every high school, which is not a common
occurrence nationwide.
There appears to be strong collaboration between the Rhode Island Parent Information
Network and PPSD, which includes parent training on transition services.
State-funded transition personnel provide positive feedback on the district’s collaboration
and support for transition services.
Programmatic Components
This subsection summarizes student access to transition assessments, community-
based work opportunities for secondary school youth with disabilities, support for students
provided at the Birch Vocational Center, and the district’s Transition Academy that is housed
at a private university.
Community-based Work Opportunities
The district does not appear to have a comprehensive transition framework that
articulates expectations for schools to support community-based training and work
opportunities for students with disabilities. Instead, every building appears to act
independently, and some are able to provide better experiences than others. The district and
ORS fund Project WORK, which annually helps 30 ORS-eligible high school students with
disabilities to consider career choices and postsecondary education options. Multiple vendors
and companies are available to provide internships for students during the school day.
However, the program has the following limitations:
Students must be transported by bus, which is difficult to arrange
It was reported to the Council’s team that some students and families fear that payment
for work will negatively impact the receipt of Supplemental Security Income (SSI) or
Social Security Disability Income (SSDI) and they do not fully comprehend the
benefits of the work experience.
Birch Vocational Center
Started about 40 years ago by parents, the Birch Vocational Center provides about 80
students from 14 to 21 years of age with academic, vocational, and social support. Student
enrollment appears to have increased over the last two years. The following summarizes
relevant information about the school:
Students who have intellectual disabilities access the core curriculum ―at a very low level.‖
Reportedly, about half of these students take the regular statewide assessment and others
take an alternate assessment. None of the students graduate with a regular diploma.
Except for one student with a bus pass, all students are transported to school.

Review of Special Education in the Providence Public School District
Council of the Great City Schools Page 67
In addition to special educators and teacher assistants, the school has a full time
speech/language pathologist, an 80 percent occupational therapist, 40 percent physical
therapist, full-time nurse, and a social worker one day per week.
When students turn 18 years of age, the school contacts the Department of Behavioral
Healthcare, Developmental Disabilities and Hospitals (BHDDH) to help the students apply
for agency services and plan post-school support.
Birch operates a federally licensed sheltered workshop and contracts with different
companies for work, such as sorting, bagging, and carting. Students 16 to 21 years of age
are paid for this work. In the past, the school had work programs at community-based
work sites at hospitals and medical centers, but such partnerships ended when mandatory
immunization requirements were instituted. The principal stated that students had
―suffered enough.‖
Students take monthly trips into the community for opportunities to interact with others
and develop social/emotional skills.
The transition director arranged for a knowledgeable transition consultant to provide
research-based recommendations for the school’s and principal’s consideration. The Council
team was told that the school did not take follow-up action. The principal is extremely proud
of his program, reports extensive parental support, and based on the above, appears reluctant
to make changes.
Transition Academy
The district’s Transition Academy, housed at Johnson and Whales University, is for
fifth-year high school students able to be independent in the community. The program, which
provides in-depth vocational opportunities, is for students who have technically "graduated"
but require one more year of transition services. The program is partly funded by ORS. Of 14
students, eight had found employment at the time of the Council’s team visit.29
Transition Planning and Electronic Transition System
Secondary-level special education personnel receive training on transition assessment in order
to support planning of transition services. Also, the special education office purchased a
comprehensive electronic system that supports transition planning, including student
assessments, rubrics, support for writing IEP annual goals, and collecting/reporting data.30
However, the Council’s team was told that there are unresolved issues preventing its use at all
high schools.
29 According to the district’s secondary special education director, by the end of the school year, all students had
employment opportunities or were planning to attend a postsecondary education program. 30
http://www.tensigma.org/products/index.html

Review of Special Education in the Providence Public School District
Council of the Great City Schools Page 68
Summary of Positive Observations, Concerns, and Recommendations on
Instructional Practices and Support
The following summarizes positive observations, areas of concern, and
recommendations to improve instructional practices and support.
Response to Intervention
Positive Observations
RTI Implementation. Although the district does not have a comprehensive framework for
RTI, various pieces of the process are in place for reading. School-based personnel have a
firm awareness of the process and indicate that they are in various stages of
implementation. Universal screening tools are available for reading at the elementary and
secondary levels, and the special education office, in collaboration with the math
department, is piloting a tool for screening and for monitoring progress in math at three
elementary schools. In addition, there appear to be several research-based interventions for
reading that school personnel indicated they are using for students needing various levels
of support. Furthermore, speech/language pathologists plan to develop an RTI approach
for children having difficulty in this area.
PBIS Implementation. A large percentage of elementary and middle schools reported they
are implementing PBIS with some success. The district’s leadership team, in collaboration
with the Sherlock Center, has provided support to schools on PBIS guidance and training
and monitors the fidelity of program implementation. The leadership team has provided
joint training with the union and provides information about PBIS to parent organizations.
In addition, the leadership team is developing a written PBIS guide for the district.
TST Problem Solving. The district uses a Teacher Support Team problem-solving
approach for supporting teachers with students having learning and behavior challenges.
The model is especially successful when principals support the process with their
leadership.
Areas of Concern
PPSD lacks a districtwide policy and comprehensive RTI framework for reading, math,
and behavior that includes expectations for school-based practices at all school levels.
This void has slowed the positive effects that an effective implementation of this model
might have on student performance. Furthermore, if a student does not improve his/her
academic work or behavior, the reason could lie in the appropriateness of instruction and
intervention rather than in the student’s ability per se. This lack of clarity about what is
causing the difficulty has important implications for the application of needed special
education services. Other concerns include—

Review of Special Education in the Providence Public School District
Council of the Great City Schools Page 69
-- inconsistent and nonexistent practices at some elementary, middle and high schools
-- lack of consistent differentiated instruction
-- lack of effective models for scheduling time and personnel for interventions
-- professional development in schools without schoolwide participation
-- progress-monitoring data collection being hindered by personnel resistance, by lack of
tools in math and writing, and by the need for a valid and reliable screening tool for
language acquisition for ELL preschoolers
-- the lack of common language regarding the development of behavior plans and use of
behavioral interventions, such as ―check-in and check-out‖
-- too few schools with tier 3 community-based ―wrap around‖ services for students
needing intensive social/emotional support
-- the lack of clarity on the relationship between personal-learning plans and RTI.
Curriculum and instruction do not have a strong and obviously visible leadership role in
the development and communication of RTI, which requires strong collaboration by
special education and ELL offices. The process has had a strong special education
influence out of necessity, as the state requires that a student’s eligibility for special
education in the area of LD be based, in part, on the student’s response to intervention.31
As a result, the district needed to have an RTI system in place. However, RTI’s special
education influence has had the following negative consequences: It has created (1) a
perception that RTI is a pathway for special education services and has spurred frustration
when the process takes too long to produce an outcome; (2) a perception that the teacher
support team is a special education process rather than an integral problem-solving
component of RTI; and (3) an overreliance on special education teachers, related service
providers, and teacher assistants, which appears to excuse other potential service providers
from participating. Also, this perception was responsible in part for the slow initiation of a
math progress-monitoring tool because RTI was not viewed as a general education
initiative. Moreover, the strong special education leadership and lack of accountability for
PBIS implementation feeds a misperception that classroom management is not a priority
for all students.
Recommendations
5. Develop and implement a comprehensive RTI framework that addresses, at a minimum,
reading, math, and positive student behavior, along with accountability for results.
a. Establish general education leadership with expert support. To reinforce the notion
that the RTI process is based in general education practices (but could also be accessed
by students receiving special education and ELL support), establish a team of
stakeholders that is led by the chief academic officer. Similarly, expand the district’s
31 RTI was required September 1, 2010 for elementary schools and will be required September 1, 2011 in high
schools.

Review of Special Education in the Providence Public School District
Council of the Great City Schools Page 70
PBIS leadership team to include a diverse group of stakeholders, including the three
executive directors, principals, teachers, behavior coaches, etc., to discuss the various
tiers of PBIS, including the social/emotional learning needs of students. Ensure that the
stakeholder and leadership groups meet periodically to ensure that the processes are
aligned and coordinated and that PBIS is seen as a function of the RTI process.
b. Establish RTI/PBIS framework, policies, and procedures. To promote a common
language for implementing RTI and for professional development to support RTI,
develop a written framework, policies, and procedures for both academics and positive
behavior that include the following:
Core curriculum expectations and use of universal design for learning (UDL).32
UDL is based on strategies that enable curricula to be accessed easily by students
with different abilities and needs. It is well integrated into everyday instructional
practices and includes multiple methods of presenting information using multiple
media and other methods of engaging students interest and assessing what students
have learned.
Universal screening and progress-monitoring tools appropriate for elementary,
middle, and high schools.
Three levels of increasingly intensive research-based interventions that will be
available short and long term.
Revised behavior intervention plans (BIP), including research-based components.33
Standards for supporting interventions that are research-based, specific enough to
monitor for fidelity at multiple grade levels, and appropriate for differing content
levels.
32 Through differentiated instruction, teachers instruct students of differing abilities to maximize each student's
growth and individual success by meeting each student where (s)he is and assisting in the learning process. To
differentiate instruction, one must recognize students' varying background knowledge, readiness, language,
preferences in learning, and interests and react responsively. Through a Universal Design for Learning (UDL)
approach, curriculum is initially designed with the needs of all students in mind, so that methods, materials, and
assessment are usable by all. Traditional curricula present a host of barriers that limit students' access to
information and learning where printed text, in particular, is especially problematic for students without a well-
developed ability to see, decode, attend to, or comprehend printed text. A UDL-designed curriculum is innately
flexible and enriched with multiple media, so that alternatives can be accessed whenever appropriate. UDL takes
on the burden of adaptation so that the teacher and/or student does not have to, thereby minimizing barriers and
maximizing access to both information and learning. 33
See information provided by the Center for Effective Collaboration and Practice at
cecp.air.org/fba/problembehavior/main.htm and sample forms at http://www.1edweb.com/fba%20forms.htm.

Review of Special Education in the Providence Public School District
Council of the Great City Schools Page 71
Models for scheduling and using the broadest range of intervention providers.
Parameters for performance-learning plans and teacher-support teams and for how
problem-solving is/will be incorporated into the RTI process.
Guidance (1) on determining how much progress a student should be making when
provided with appropriate research-based interventions and (2) on initiating a
referral for special education services when sufficient progress is not made after
providing the appropriate interventions.
Expectations for the providing and requiring staff participation in RTI professional
development.
Parental involvement and access to information.
Use a cross-functional team of individuals from various departments, along with
elementary, middle, and high school personnel to provide input and feedback on the
initial draft policies and procedures.
c. Identify the core information that various staff members need about RTI/PBIS, and
develop a comprehensive and differentiated professional development program that:
Uses multiple formats (e.g., videos, webinars, PowerPoint, narrative text) and
presentation models (e.g., school-based, small groups, etc.) that are differentiated,
based on current levels of staff knowledge and skills
Uses cross-functional teams with individuals who directly support schools in order
to provide primary training to the broadest spectrum of administrative and
instructional staff, so they can help provide direct support, mentoring, coaching, and
technical assistance to principals and teachers.
Ensure that all trainers are knowledgeable and effective presenters. Provide
professional development so that all staff members who need training receive it and
are able to demonstrate its use.
Consider mandating training and providing a certificate of demonstrated
performance.
Modify walk-through protocols to include the standards, monitor the extent to
which school practices conform to the guidance, and initiate technical assistance,
professional development, coaching, and mentoring as necessary to improve
practices.
d. Collect, analyze, report, and follow up on student behavior-related data. Determine
how the School-Wide Information System (SWIS) and other data systems can be

Review of Special Education in the Providence Public School District
Council of the Great City Schools Page 72
modified to ensure access systemwide and are capable of yielding user-friendly reports
to relevant staff in order to promote analysis and follow-up action.
e. Identify demonstration-schools and exemplary staff. Identify schools that have
implemented various aspects of the RTI framework for other schools to visit and
emulate. Identify staff members who reflect these standards and who could provide
training to their peers
f. Monitor implementation and effectiveness. Modify walk-through protocols and
checklists to reflect core practices and monitor the extent to which school practices
conform to the guidance. For PBIS, incorporate Special Education Technology (SET)
standards and supplement them for RTI’s academic practices.
Instruction in General Education Classes with Supplementary Aids and Services
Positive Observations
Improved Educational Setting Data. The Council’s team heard generally positive
comments about the district’s movement toward implementing inclusive instructional
education for students with disabilities. PPSD has taken steps to increase the
percentage of students educated in general education settings for a greater part of the
day and to reduce the extent to which they are educated outside of the district in
private, separate schools.
A higher percentage of PPSD students with disabilities are educated in general
education classes at least 80 percent of the time, compared with the nation. This
rate has been increasing slowly since 2007. Similarly, the percentage of students
educated in general education less than 40 percent of the time has decreased
somewhat.
A smaller percentage of PPSD students with disabilities are educated in separate
schools, compared with statewide rates.
Less Disparate Educational Setting Rates by Race/Ethnicity. PPSD data on educational
setting are not very different by race/ethnicity from the state’s figure that 66.2 percent of
students getting special education services are placed in the general education setting at
least 80 percent of the time. Also, the likelihood of being placed in separate classes has
decreased over time for Hispanic, White, and Black students.

Review of Special Education in the Providence Public School District
Council of the Great City Schools Page 73
Awareness of Differentiated Instruction. District personnel are generally aware of the
need to differentiate instruction for students with disabilities, particularly at the elementary
and middle school levels. Some good models appear to be in place.34
Inclusive Preschool Initiative. To provide preschoolers with disabilities an inclusive
educational setting, the district has an initiative that enrolls nondisabled peers using a
lottery system to diversify classrooms.
Expansion of Co-Teaching. The district is expanding its co-teaching approach for the
upcoming school year at all levels. Trained special education specialists will serve as
coaches and provide embedded professional development during in-class instruction.
Some good models of co-teaching are already in place. Generally, focus group members
supported inclusive educational opportunities for students receiving special education
services. In addition, special education directors and supervisors have provided and will
continue to provide professional development to special and general educators in 2011-12
in the area of co-training, focusing on teaching models and strategies and differentiating
instruction.
Pilot Middle and High School Inclusion Initiative. The district initiated pilot programs
that enabled students previously educated in self-contained classes to attend general
education classes with the support of a special education teacher in order to compensate
for the lack of teachers with expertise in core content areas. All teachers in the pilot
program received professional development involving school-based working sessions for
co-teachers to plan and develop an appropriate co-teaching environment.
Areas of Concern
Failure to Meet SPP Targets. PPSD has not met the state’s targets for educating students
with disabilities in the two SPP general education setting categories (at least 80 percent of
the time and less than 40 percent of the time) described earlier. And it has not met targets
for educating students in separate schools.
A much smaller percentage of the district’s students with autism, ED, intellectual
disabilities, and multiple diagnoses are educated in general education classes for at
least 80 percent of the time than in the nation.
Other than in the areas of speech/language and multiple diagnoses, a larger
percentage of PPSD students in every disability area are educated in separate
classes for most of the school day than in the nation. The disparity is especially
apparent in areas of other health impairment, ED, and intellectual disability.
34 Note that differentiated instruction is also needed for students without disabilities, ELL students, and students
receiving special education in separate self-contained classes.

Review of Special Education in the Providence Public School District
Council of the Great City Schools Page 74
Compared with the nation, PPSD places a larger percentage of students who have
ED and multiple diagnoses in separate schools (day and residential).
Comparatively Low General Education Settings Rates. The district has very few students
with disabilities who are in general education between 40 percent and 79 percent of the
time. Although the percentage has nearly doubled between 2006 and 2010 (2.4 to 4.1
percent), it is a far smaller rate than the nation’s 21 percent. Therefore, students are either
in general education for at least 80 percent or less than 40 percent of the day, with very
little presence in the middle range.
Educational Settings Disparity by Race/Ethnicity. When examining PPSD students by
race/ethnicity who receive instruction in separate classes or schools, we find that:
District students of all ethnic/racial groups are more likely to receive special
education services in separate classes than their state peers. Between 2006 and
2010, the likelihood increased slightly among Whites and to a greater extent
among Native Americans.
Among students placed in separate schools, White students continue to have a
high likelihood and Black students a slightly higher likelihood of such placement.
Inconsistent Use of Differentiated Instruction. Although it is essential for instruction to
be differentiated for students with disabilities in order for them to successfully access core
curriculum in general education classes, the practice is not being implemented effectively
and consistently in every school and class. Concerns include classes in which the
percentage of students with disabilities exceeds 30 percent and resistance by some
teachers, especially at the high school level.
Lack of Expected Practices for Inclusive General Education Instruction. The district
does not appear to have expected or model practices for educating students with
disabilities in general education classes that would drive professional development and
accountability. If students are not provided adequate support in general education, there
may be more pressure to place students in separate classes and schools.
Lack of Special Educators with High Degree of Content-Area Expertise. By and large,
special educators do not have the knowledge and expertise to be the primary instructor in
core content areas, a situation that affects students in general education, in self-contained
classes, and at the separate Birch Vocational Center.
Inconsistently Effective Co-Teaching. A variety of concerns were raised that affect the
quality of co-teaching, including inconsistent and effective implementation, ineffective
partnering and role designation for special and general educators, irrelevant IEP goals, lack
of interaction and planning opportunities between educators and teacher assistants, and
inadequate access to needed materials and supplies.

Review of Special Education in the Providence Public School District
Council of the Great City Schools Page 75
High School Inclusion Challenges. At the high school level, special educators continue to
be students’ teacher of record, even when the students are receiving instruction in general
education classes. The educational setting of these students was unclear: it was alternately
referred to as ―self-contained‖ and ―co-taught‖ in general education. Furthermore, separate
special education classes continue to be labeled as ―fundamental,‖ and because instruction
is not based on the core curriculum, students taking regular assessments do not receive
relevant and aligned instruction, and the courses do not lead to a regular high school
diploma.
Recommendations
6. Establish a bold vision of PPSD as an inclusive school district that provides students with
disabilities with the supplementary aids and services they need to meet Rhode Island’s
Common Core Standards. Establish and implement a written vision, school board policy,
and framework in order to support PPSD’s transformation to a model district that actively
works toward providing a growing number of students with disabilities consistent and
beneficial access to instruction in general education classes for the majority of the day,
Steps include the following:
a. Establish a visible and collaborative general education presence to lead the
implementation of a new board policy and initiative. Given the clear and convincing
evidence of the benefits of educating students with disabilities in general education
settings, it is important that efforts to increase the percentage of students educated in
this setting become a systemwide priority and that the superintendent and chief
academic officer provide leadership on behalf of this priority, with meaningful support
from special education and ELL staff. Ensure that the policy includes a district
commitment to provide students with disabilities, including those who are ELL, with
general classroom experiences with appropriate supplementary aids and services to
allow students to be successful. In addition, emphasize the placement of students with
disabilities in their home schools (or school they would attend if not disabled) to the
maximum extent possible. Communicate this vision widely to all constituents, along
with the process that will be used to support students. Charge a diverse group of
stakeholders (including general, special, bilingual, and gifted/talented educators and
those with a working knowledge of research-based inclusive practices) with
implementing the board’s vision and policy.
b. Incorporate the academic and behavioral progress of students with disabilities and
the implementation of effective programs on their behalf into the evaluations of
principals and senior instructional staff in the central office.
c. Design and implement the infrastructure needed to execute PPSD’s inclusive school
vision and policy; establish school-based plans for implementation. Based on the
issues summarized in this report and others known to stakeholders, develop measurable
research-based standards and goals in the following areas:

Review of Special Education in the Providence Public School District
Council of the Great City Schools Page 76
Differentiated instruction for students with varying abilities in reading, math, and
cognition.
Goals for decreasing the percentage of students with disabilities in general
education classes performing substantially below peers in reading and math and
with measures of ―substantially below peers.‖
Expected supports for students with disabilities, including ELLs in general
education (or bilingual/ESL) classes involving (1) special educator instruction and
paraprofessional support inside and outside classes for short periods of time, (2) the
amount of co-teaching for varying parts of the day, and (3) varying amounts of
instruction outside the class using flexible groupings of students. Articulate key
measures for such models, including teacher collaboration, flexible inter- and intra-
class groupings, active learning, and student needs for study/organization skills.
Expected implementation of RTI/PBIS and social skills curricula and
programming.
Incorporation of tiers 2 and 3 intervention goals into IEPs as necessary in order to
significantly improve performance.
Effective scheduling of classes (with models for block scheduling and scheduling
of general education classes for students with IEPs before others), and expectations
for common planning time and information sharing between special/general
educators and paraprofessionals.
Effective pairing of co-teaching personnel, including taking into account desires of
personnel involved.
Clarification of roles of classroom and subject-area teachers, resource teachers,
special educators, and paraprofessionals.
Adequate materials and supplies.
Consider the proposals and information from the following three documents, which the
Council’s team has provided to the PPSD special education directors under separate
cover:
―New Teacher Teams to Support Integrated Comprehensive Services.” Frattura, E.
and Capper, C. (2007), Teaching Exceptional Children, Vol. 39, No. 4, pp.16-27,
(2007)
―Planning Differentiated, Multicultural Instruction for Secondary Inclusive
Classrooms.” Van Garderen, D. and Whittaker, C. (2006), Teaching Exceptional
Children, Vol. 38, No. 3, pp. 12-20.

Review of Special Education in the Providence Public School District
Council of the Great City Schools Page 77
―Students with Severe Disabilities and Best Practice.” From Frattura, E. and
Capper, C. (2007), Leading for Social Justice: Transforming Schools for All
Learners, Providing Access to High-Quality Teaching and Learning, Chapter 9:
Students Who Significantly Challenge Our Teaching.
Visit classes in the district that reflect the desired goals and standards set by the board
and the cross-functional team, and discuss with staff what has worked well, what their
challenges have been, and what suggestions they have.
d. Expand instruction in general education between 40 and 79 percent of the time for
students currently in more restrictive settings. Analyze the district’s low number of
students receiving instruction in general education between 40 and 79 percent of the
time and how scheduling and staff support may have to change in order to educate in
this less restrictive setting more students who are currently in self-contained classes.
Based on this analysis, incorporate planning into the other components of
Recommendation 6.
e. Build on the differentiated professional development in RTI/PBIS to impart the
knowledge necessary to implement PPSD’s framework and standards for inclusive
instruction. Identify the core information that various staff members need to:
Coordinate and build on the professional development provided in RTI/PBIS, using
multiple formats (e.g., video, Webinar, PowerPoint, narrative text) and presentation
models (e.g., school-based, small groups).
Use cross-functional teams involving individuals who directly support schools to
provide primary training to the broadest spectrum of administrative and
instructional staff, so they can help provide direct support, mentoring, coaching,
and technical assistance to principals and teachers.
Ensure that all trainers are knowledgeable and effective presenters. Implement
professional development so staff members who need training receive it and are
able to demonstrate its use.
Consider mandated training and implementing a certificate of demonstrated
performance.
Modify walk-through protocols to include the standards, monitor the extent to
which school practices conform to the guidance, and initiate such supports as
technical assistance, professional development, coaching, and mentoring to
improve practices.
f. Establish a timely communication and feedback process to share solutions to
implementation barriers. Several problem areas are likely to require a targeted group
of knowledgeable people to resolve implementation issues as they arise. For example,

Review of Special Education in the Providence Public School District
Council of the Great City Schools Page 78
schools often have difficulty providing services with existing staff and would benefit
from feedback from individuals able to analyze the situation, give meaningful
suggestions, and recommend different staffing arrangements.
g. Use a school-based process for planning the framework’s implementation. Provide a
template that includes the core components necessary to support successful inclusive
practices: school-based planning, professional development, data gathering, and
review, and support for plan implementation. Integrate the plan with the school-based
RTI process described previously and with school improvement plans.
h. Initiate school-based targets, monitoring, and support. Collect and analyze data by
school on students newly placed in general educational settings by the various
disability categories monitored by the state. Establish targets for each school that
would enable the district as a whole to meet or exceed state performance targets, and
distribute reports showing school performance against these targets to district and
school-based administrators. (Base personnel evaluations, in part, on progress on these
targets.) Follow up and provide technical assistance as appropriate when outcomes fail
to meet reasonable expectations. (Additional recommendations are provided under
section E, Accountability.)
i. Identify schools with general education classes having more than 30-40 percent of
students with disabilities and analyze causes for the large percentages and explore
possible ways to decrease the impact. For example, if the large percentage is due to the
clustering of students in special programs at a particular school, then the district may
want to look at how services might be reallocated so these students can be supported in
the school they would normally attend if not disabled.35
j. Document how PPSD will accomplish the above. Identify staff accountability, roles
and responsibilities, time frames, and demonstrable outcomes.
Instruction in Self-Contained and Private Settings
Positive Observations
Redistribution of Self-Contained Classes. The district’s redistribution of self-contained
classes to fewer schools enables some students to stay at the same school for their
elementary grades and in classes with fewer grade levels.
35 See article sent to district staff under separate cover for additional information on this topic: Students with
Severe Disabilities and Best Practices, from Frattura, E. and Capper, C. (2007), Leading for Social Justices:
Transforming Schools for All Learners, Providing Access to High-Quality Teaching and Learning, Chapter 9:
Students Who Significantly Challenge Our Teaching.

Review of Special Education in the Providence Public School District
Council of the Great City Schools Page 79
Model High-Quality Instruction for Students with Autism. The autism program appears
to be well respected and is supported by a team of individuals with knowledge and
expertise in this area. RIDE designated Hope High School’s class as a model site.
Structured Behavior Intervention Program. The district has a structured separate-class
model for providing support to students with challenging behavior. Coaches, as well as a
team of multidisciplinary personnel, are available to provide supports to teachers and
students. The provision of an additional 10 days per year provides coaches with more time
to collaborate and plan. Staff members receive professional development on how to
analyze behavioral data and support students with challenging behaviors.
Reduction of Private School Placements and Tuition Rates The percentage of students
with disabilities placed in private out-of-district schools fell from 6.0 percent in 2009-10
to 4.0 percent in 2010-11. By reducing the number of private schools used by the district,
the special education director was able to negotiate a reduced rate with four private
schools.
Areas of Concern
Reliance on Self-Contained Classes. It is extremely difficult to provide students with
disabilities access to grade-level core curriculum when the class includes students in more
than one grade. Furthermore, the lack of special educators with content-area expertise
makes it difficult to conduct effective instruction. Students in middle and high schools who
are not participating in the pilot inclusion program continue to be educated in separate
classes. In addition, administrative concerns, such as general education classes at capacity,
scheduling conflicts, and insufficient staff support sometimes hinder the inclusion of more
students with disabilities in general education classes.
Additional Support Needs for Students with Autism. Although focus group participants
expressed concerns about the need for additional equipment and supplies, such as
weighted vests and a pool of substitute teacher assistants, the team noted that a much
larger proportion of PPSD students with autism were educated outside of general
education classes for more than 60 percent of the day (71 percent), compared with their
peers nationwide (50 percent).
Additional Support for Students with Intensive Social/Emotional Needs. Numerous
concerns were raised regarding the challenging behavior of students, including those
without disabilities. At PPSD, only 23 percent of students with emotional disturbance are
in general education classes for at least 40 percent of the time, compared to 56 percent
nationwide. To the extent that students with behavioral issues are not supported
successfully within general education, more are placed in self-contained settings. And
when they are not supported successfully within this setting, more are considered for
private placements. In this respect, serious personnel issues—lack of sufficiently trained
teachers and teacher assistants, union assignment practices, and lack of teacher-assistant

Review of Special Education in the Providence Public School District
Council of the Great City Schools Page 80
substitutes--hinder the addition of more Behavior Intervention Program classes for
students returning from private out-of-district clinical placements. Although a supportive
supervisor works with the Behavior Intervention Program, the individual is responsible for
schools that do not have this program and also is not assigned to all schools with the
program.
Return of Students to Private Schools. Students in the district’s Behavior Intervention
Program in secondary schools with unsuccessful outcomes will be returning next year to
out-of-district private schools. This will weaken the district’s capacity to educate students
with challenging behavior. According to focus group members, the district’s ability to
contract with private schools to provide support in district schools--a successful model
used by other districts--is not an option because of union contract issues.
Recommendations
7. Reduce reliance on educating students with disabilities in self-contained and separate
school settings; improve performance of students remaining in these settings.
a. Collect and analyze data about students currently educated in self-contained and
separate school settings, such as the school they would attend if not disabled; their
performance levels in reading, math, and behavior; and other information relevant to
the supports they would need if educated in general education classes for greater
periods of time. (Investigate whether the district’s data on separate schools include
students from the Birch Vocational Center.)
b. Identify characteristics of students in order to plan for less restrictive settings.
Identify the characteristics of students who could attend their local school or school of
choice and the supports they would require to do so. Address current administrative
barriers to more inclusive instruction, such as ―full classes,‖ scheduling, etc., bringing
issues to the superintendent’s cabinet when necessary. Through the IEP process,
consider implementation on an individualized basis in midyear 2011-12 and/or
September 2012.
c. Use a consultant for advice about educating more students with autism within
general education classes. Consider using a consultant who has significant experience
with the successful education of students with autism who are in general education for
a greater portion of the day, and follow up on specific recommendations. To prepare
for such consultation, gather data on students’ attendance-area schools, ages, school
grades, academic performance, social/emotional and language skills, equipment and
supply needs, etc.
d. For students with significant behavior challenges, implement improved
social/emotional supports at each school and address the personnel issues affecting
the Behavior Intervention Program. It is essential that more students be educated
successfully in general education classes in order for the district to have the capacity to

Review of Special Education in the Providence Public School District
Council of the Great City Schools Page 81
support those with the most intensive needs. Identify any schools with an unusually
large number of students being referred to separate settings or to separate schools. In
both circumstances, consider the strength of current PBIS efforts at tiers 2 and 3 and
need for improvement. It is anticipated that recommendation 5 regarding PBIS and
social/emotional support will improve school capacity.
Improve the Behavior Intervention Program. Section D below addresses personnel
issues related to the provision of substitutes for paraprofessionals, assignment of
highly skilled special education teachers and paraprofessionals, and administrative
support. In addition, consider asking the district’s consultant, Dr. Diana Browning
Wright, to review the Behavior Intervention Program’s current structure and make
recommendations, including training for behavior coaches and teachers, to
implement evidence-based behavioral strategies for tier 2 and 3 interventions.
Investigate private school interest in collaborating with the district to provide
supports to students in PPSD schools and, if there is sufficient interest, identify and
address any contractual barriers to such collaboration. The district should
aggressively pursue this course of action to support students with significant
social/emotional issues.36
e. Eliminate “fundamental” courses. Review current secondary courses and their
descriptions to ensure that students with disabilities who take the regular NECAP
assessments are not given separate ―fundamental‖ courses. These students should have
access to core curricular standards–with accommodations–if they are to have any
chance of improving performance on assessments. Recommendations 5 and 6 provide
additional information on supporting students with disabilities taking classes aligned
with the core curriculum.
In addition to personnel issues discussed above, section D addresses strategies for
increasing the number of special education teachers who are highly qualified and
knowledgeable in core curricular areas.
English Language Learners with Disabilities
Positive Observations
Support for ELLs with Disabilities. Teachers reported that ELLs, including those with
disabilities, are benefiting from the reading intervention Language!
36 The School District of Philadelphia has used this model.

Review of Special Education in the Providence Public School District
Council of the Great City Schools Page 82
Areas of Concern
Need for Additional Support for ELLs with Disabilities. ESL teachers do not support
students with disabilities who are also ELL in either regular general education or non-ESL
self-contained classes. For an ELL student to receive special education services in another
setting, the parent must waive the student’s right to receive language support. Concerns
include a disproportionately high number of students with IEPs in some ESL and bilingual
classes; resistance to providing accommodations to students in the gifted or talented
program; and an insufficient number of ESL-certified teachers to support or scaffold
student language development.
Recommendations
8. Identify and provide more flexible models to support the education of ELLs with
disabilities. Establish a working group with staff members from general education, ELL,
special education, gifted and talented, research and accountability, and schools to review
research-based practices on language acquisition and on providing language support to
students with disabilities (without a waiver) in a manner that would enable them to be
successfully educated in classes they would attend if not disabled. As part of this process,
consider how bilingual/ESL staff can help improve the effectiveness of monolingual staff
to provide instruction and services to ELLs with disabilities and share information through
professional development, technical assistance, co-teaching, etc. In addition, consider how
special and general education teachers who are not ESL-certified and paraprofessionals
can receive training on effective strategies to support or scaffold student language
development. Based on the results of this work, (1) establish relevant board policy, (2)
include relevant activities in school-based planning in RTI and inclusive education
guidance, and (3) implement professional development activities, revised walk-through
protocols, etc. Also, consider any data changes necessary in REG (the district’s student
information system) to support differing service models for ELL students. [See ELL
Report prepared by the Council of the Great City Schools in conjunction with this report.]
Postsecondary Transitional Activities and Services
Positive Observations
Almost Met SPP Indicator 13. With a rate of 97 percent, the district almost met the
rigorous federal mandate of 100 percent compliance for youth 16 years and above with an
IEP that met several compliance standards.
Strong Partnerships with Agencies and Parent Organizations. Generally, PPSD has a
strong system of transition services and activities, as reflected by a strong partnership with
RIDE and ORS, a grant-funded transition director, an ORS Councilor in every high school,
a high school elective transition course, and strong collaboration with the Rhode Island
Parent Information Network. The district/ORS-funded Project WORK annually helps 30

Review of Special Education in the Providence Public School District
Council of the Great City Schools Page 83
ORS-eligible high school students with disabilities to consider career choices,
postsecondary education options, and internships.
Birch Vocational Center Post-School Support. Birch Vocational Center personnel
provide liaison between agencies, students, and families to provide post-school support.
Transition Academy Outcomes. Eight of the 14 fifth-year high school students attending
the district’s university-based Transition Academy had found employment at the time of
the Council team’s visit.
Electronic Transition Planning. The district has purchased a comprehensive electronic
support system for transition planning that is ready for installation.37
Areas of Concern
Generally, youth with disabilities do not succeed as well as nondisabled peers in
postsecondary education and training, employment, living arrangements, and community
participation. For example, 30 percent of people with disabilities report being employed full or
part time, compared with 70 percent of those without disabilities. People with disabilities are
three times more likely to live in poverty and have an annual household income below
$15,000 (26 percent versus 9 percent for people without disabilities). And 34 percent say they
are satisfied with life, compared with 61 percent of individuals without disabilities.38
In addition, youth with intellectual disabilities exiting high school represent the only
disability category not experiencing earnings above minimum wage. Data from the national
vocational rehabilitation database show that youth with intellectual disabilities who
participated in some type of postsecondary education were 26 percent more likely to leave
vocational rehabilitation services with a paid job than peers who had not participated in
postsecondary education. Further, their weekly income was 73 percent higher. 39
In light of the above, there are a variety of concerns about the extent to which PPSD is
preparing students with disabilities for post-school life:
Minimal Access to Community-based Training. The district lacks a systemic
transition framework that reflects expectations for supporting community-based
training and work opportunities for students with disabilities. Instead, every building
appears to act independently, and some are able to provide better experiences than
others. For youth with disabilities, however, research shows that work experience
37 http://www.tensigma.org/products/index.html
38 2004 National Organization of Disability/Harris Survey of Americans with Disabilities at
http://www.nod.org/research_publications/nod_harris_survey/ 39
2004 National Longitudinal Study, Postsecondary Education and Employment Options for Students with
Intellectual Disabilities at http://tacesoutheast.org/webinars/2011/020311/ppt/ppt020311_files/outline/index.html.

Review of Special Education in the Providence Public School District
Council of the Great City Schools Page 84
during high school helps them get jobs at higher wages after they graduate.40
Secondary school students with disabilities, who worked for pay outside the home in
the year before exiting school and/or participated in a work-study program at school,
have a better chance for employment in their post school years than if they had not
participated in such activities.41
Given the importance of this finding, SPP’s indicator
14 measures transition outcomes for youth with IEPs who are no longer in secondary
school and who are within one year of exiting high school, looking at their
participation in higher education, training, and/or employment. RIDE reported that the
district’s overall rate was 66.2 percent in 2009-10, while the state target was 75.9
percent.42
Project WORK Limitations. Concerns about Project WORK include the need for
students to be transported by bus rather than another vehicle and student
nonparticipation because of fear that their being paid for work will negatively impact
SSI or SSDI funds. Students and their families do not fully comprehend the benefits
they might receive from this work experience.
Birch Vocational Center Limitations. Almost all of the district’s students identified as
having an intellectual disability at the secondary level attend Birch Vocational Center,
a well-staffed school for students with disabilities. Concerns about the school’s
provision of instruction and transitional activities and services for students—half of
whom reportedly participate in the regular statewide assessment—include (1) access to
the curriculum ―at a very low level,‖ (2) no expectation that students graduate with a
regular diploma, (3) the fact that only one student takes public transportation to school,
(4) access only to a sheltered workshop experience, (5) an attitude that immunizations
required for hospital and medical center worksites would be harmful to students, and
(6) limited interaction with the community. There appears to be no real desire to
change the situation.
Transition Academy Limitations. The successful university-based Transition
Academy is limited to just 14 students.
Limited Use of Electronic Transition System. Due to unresolved problems, the
district’s impressive electronic transition system has not been downloaded for use in
40 National Collaborative on Workforce and Disability/Youth, Hot topic: Work-Based Learning, 2003 Volume 2
41 Changes over Time in the Early Postschool Outcomes of Youth with Disabilities: A Report of Findings from
the National Longitudinal Transition Study (NLTS) and the NLTS2. 42
Although not yet reported, the state’s target for the first year of the outcome’s application in 2010-11 is: 33%
in higher education; 67 percent in higher education or competitively employed, and 78 percent in higher
education or in some other postsecondary education or training program, or competitively employed or in some
other employment within one year of leaving high school. These outcome targets increase by one percentage
point each year.

Review of Special Education in the Providence Public School District
Council of the Great City Schools Page 85
every high school. This system could help PPSD to meet its 100 percent target for
indicator 13 and improve transition outcomes for students.
Inconsistent Data. The Council’s team was informed that the district’s compliance rate
for indicator 13 (meeting IEP transition-compliance standards) was 90.4 percent,
which is lower than the RIDE reported rate of 97 percent. This issue will be addressed
below under section D on the use of technology and data.
Recommendations
9. Develop a districtwide, comprehensive, and coordinated vision for transition services;
plan to implement this vision. To provide a research-based system of transition services
and activities, review current activities to determine the extent to which they align with the
16 evidence-based predictors of post-school employment, and success in independent
living, found in the correlational study published by the National Secondary Transition
Technical Assistance Center43
and the National Center for Workforce Development
website.44
(See appendix A: Evidence-Based Predictors of Post-School Employment,
Education, and Independent Living Success for a description of these predicators, which
include the domains of education, employment and independent living.) Conduct this
review with appropriate school-to-careers personnel, and identify and address any gaps. In
addition:
a. Ensure the Birch Vocational Center operates consistently with research-based
practices. As part of the review above, and with the involvement of Birch parents and
staff, conduct a comprehensive analysis of the Birch Vocational Center to determine
the extent to which the program is aligned with accepted research sources. Also, obtain
information on the school’s budget and per pupil cost. Based on the results, prioritize
any programmatic components that require change, and develop a cost-neutral
implementation plan that includes an aggressive time frame.
b. Expand community-based supportive work and employment. Develop a working
group of diverse stakeholders (including business, community, state agencies, special
education personnel, staff from high schools, and the Birch Vocational Center) to
review district practices in community-based work and employment, and establish
measurable standards for school-based practices at every high school. As part of this
process, identify and address barriers, including access to transportation for Project
WORK, and steps to be taken that would enable students to engage successfully in this
43 National Secondary Transition Technical Assistance Center. (2010). Evidence-Based Practices and
Predicators in Secondary Transition: What We Know and What We Still Need to Know. Charlotte, NC: Author.
Retrieved from www.nsttac.org/ebp/ExecsummaryPPs.pdf 44
http://www.ncwd-youth.info/ksa/competency-05

Review of Special Education in the Providence Public School District
Council of the Great City Schools Page 86
activity. For example, engage and educate students/parents about the benefits of work
experiences and how any payment for work may (or may not) impact federal benefits.
c. Research the need and possibilities for expanding the Transition Academy. Identify
how many students might benefit from enrollment in the Transition Academy.
Assuming the number is more than 14, share the information with partner agencies and
Johnson and Wales University to identify ways to meet this need.
d. Ensure Electronic Transition System Is Fully Implemented. Resolve outstanding
issues with implementing the new electronic data system and, ensure that it is put into
place at all district schools.

Review of Special Education in the Providence Public School District
Council of the Great City Schools Page 87
Section D. Support for Teaching and Learning
This section addresses various ways in which PPSD provides support for the teaching
and learning of students with disabilities. It focuses on the following areas: special education
management and organization, staffing patterns and usage, parent support and involvement,
professional development, and use of technology and data.
Special Education Management and Organization
About 4.5 years ago, the new chief academic officer moved the special education unit
from a stand-alone office to become part of the district’s teaching and learning team. This
change is credited with enabling special education to be part of the decision-making process
about standards, curriculum, and programming throughout PPSD. It has also helped students
with disabilities participate in education reform and gain greater access to core curriculum. As
indicated from information provided by the district: [T]he voice of special education is
definitely at the table now, always advocating for the needs and benefits of students with
disabilities.
Directors of Special Education
Two directors provide special education leadership: One is responsible for elementary-
level schools (including preschool programs) and the second is responsible for secondary-level
schools (middle and high). In addition, they have some similar and some different
programmatic responsibilities. A full-time secretary assists each director. Both directors have
the following responsibilities relevant to elementary or secondary schools:
Coordinate and supervise the quality of special education programming and services
Establish and monitor procedures on child outreach, screening, eligibility, assessment,
IEPs and services for students with disabilities
Ensure IEPS are implemented with appropriate accommodations and modifications to
meet the diverse needs of students with disabilities
Supervise behavior intervention programs
Oversee placement and instruction in private schools
Recruit special education and clinical personnel
Hire and train teacher assistants
Coordinate professional development
Oversee Medicaid billing
Coordinate alternate assessments
Monitor special education supervisors, specialists, and related service providers
Serve as members of the district’s teaching/learning team and elementary/secondary
level team
Serve at the elementary school level as the supervisor of four schools and at the
secondary level the supervisor of two high schools.

Review of Special Education in the Providence Public School District
Council of the Great City Schools Page 88
Special Education Supervisors
The eight special education supervisors are primarily responsible for overseeing
special education programs at an average of 4.6 schools each (ranging from one to seven). The
supervisors assist with the monitoring, development, and implementation of quality special
education programming and services, including co-teaching programming, related services
providers, IEP development, and specialized programs (e.g., BIP, autism, etc.), as well as
compliance with special education laws and regulations. An individual secretary assists each
of the supervisors.
Elementary-level directors lead evaluation teams and chair meetings to determine
student eligibility for services, develop initial IEPs, make disciplinary manifestation
determinations, and review referrals for special education evaluations and appropriate follow-
up. As discussed below, secondary-level directors will no longer carry out this function in
September 2011, when it will be taken over by school-based teacher leaders.
As members of PPSD’s teaching and learning team, the role of the supervisors has
expanded from one focused mostly on compliance to one that now includes instruction. They
work closely with curriculum supervisors by participating in curriculum
writing/implementation, school learning-walks to enhance teacher quality and instruction, and
grade-level principal and leadership meetings. In addition, supervisors have programmatic
responsibilities at each grade level (e.g., alternate assessments) and at the district level (e.g.,
electronic IEP). (See exhibits 41 and 42.)
Exhibit 41. Elementary-Level Organization
Elementary Director – Directly supports four elementary schools
TST, PBIS, bullying and harassment procedures, early intervening disproportionality team, technology
department liaison, census data, parent local advisory committee
Fo
ur
Su
per
vis
ors
Seven Schools
Parent liaison and
Local
Advisory Committee
OTs, PTs
ED placements
Behavior programs
Physical restraint
training
Cab vouchers
Six Schools
Speech therapists
Audiology
RTI technical
assistance
Compliance
One School
Preschool teams and preschool
programming
Early Care/Education Community
PreK creative curriculum.net
Early intervention transition
Bilingual team
Assistive technology
Child outreach, coordinator,
screening
Alternate assessment
Six Schools
Medicaid
Psychologists
Easy IEP
Elementary interpreters
Four intervention/special education specialists paired with supervisors; act under director’s
supervision

Review of Special Education in the Providence Public School District
Council of the Great City Schools Page 89
Exhibit 42. Secondary-Level Organization
Intervention/Special Education Specialists
Two years ago, the district employed 25 diagnostic-prescriptive teachers at the pre-
kindergarten to grade 12 levels who completed formal education evaluations, attended IEP
meetings, and assisted in the development of IEPs. All 25 positions were eliminated and 11
special education specialist positions were created to provide support, professional
development, and training in RTI and special education. Specifically, these individuals support
the teacher support-team process, including differentiated instruction, co-teaching, transition,
and compliance. Of the 11 specialists, eight are paired with special education supervisors and
work under the direction of the special education directors, and three of the specialists work in
the area of preschool and perform duties more like those of the previous diagnostic-
prescriptive teachers. The school district contracted with a facilitator during the past two years
to provide professional development to the specialists to assist them in the areas of coaching,
co-teaching, differentiating instruction, and IEP development.
Elementary-Level Specialists (1) participate in IEP meetings as the LEA
representative; and (2) provide training to psychologists, social workers, and special
educators on case management activities, e.g., inputting data in the evaluation log;
conducting formal educational testing; and assisting with progress monitoring. They
also provide embedded professional development in the area of co-teaching strategies
and models, provide formal professional development to all teachers, and evaluate
team members and teacher assistants at the elementary level on such topics as learning
disabilities identification and effective strategies for working with students with
disabilities. The elementary schools do not have assistant principals or other
administrative staff, as the middle/high school teacher-leaders do.
Secondary Director- directly supports two high schools
Autism team, transition, vision services, budget, 504, interim middle school
Fo
ur
Su
per
vis
ors
Four Schools
IEP training – basic II
Inclusion, intensive
resource, self-
contained programs
Child care workers
TST
Transition
Easy IEP
Local Advisory
Comm.
Social Workers
Five Schools
Vision/mobility
Placements
Procedural manual
Local Advisory Comm.
TST
Transition team
Inclusion Co-teach team
Three Schools
ESY
Local Advisory Comm.
TST
Home instruction
Psychiatric
appointments
Five Schools and
Transition Academy
Alternate assessments
Procedural manual
Community Fair
504
ESY
Adapted physical
education
Four intervention/special education specialists paired with supervisors; act under director’s
supervision

Review of Special Education in the Providence Public School District
Council of the Great City Schools Page 90
Secondary-Level Specialists (1) provide educational testing of students referred to
ORS, taking the PSAT/SAT, and needing updated testing for colleges; (2) administer
the Transition Profile Inventory (TPI) for transition planning purposes; (3) complete
the SPP indicator 14 transition outcomes-data survey; and (4) participate in case
management activities. Because there are special education teacher-leaders at middle
and high schools, the specialists do not participate in IEP meetings.
Middle/High School Special Education Teacher-Leaders
Teacher-leaders meet regularly with principals and other teacher-leaders to discuss
areas of support for teachers and students. During common planning time, they meet with
content-area teachers to develop lessons plans across the curriculum. The leaders also meet
with special educators to review IEPs, discuss failure and attendance rates, and develop
intervention plans for individual students. They are also available to coach teachers in their
schools.
During the summer of 2011, professional development will be provided to team
leaders on how to conduct effective evaluation team meetings and manifestation-
determination/IEP meetings. By chairing these meetings beginning in September 2011, the
special education supervisors will have more time to support and provide feedback to teachers
working in general education settings, promoting increased use of this setting and providing
support for self-contained classes.
Case Management by Psychologists, Social Workers, and Special Education Teachers
School psychologists and social workers serve as case managers for new referrals to
special education evaluations and for reevaluations in their assigned schools. They schedule
and coordinate evaluation reviews and eligibility meetings, complete needed assessments,
document the evaluation process on required forms, and enter information on evaluation logs.
Also, special educators act as case managers by scheduling annual IEP reviews and
reevaluations with assistance from psychologists and special education specialists.
Staffing Patterns and Usage
Teaching and learning for students receiving special education services is affected by
school-district staffing patterns and usage. The Urban Special Education Leadership
Collaborative (Collaborative) is a network of special and general education leaders who work
together to improve outcomes for students with disabilities in urban schools. The
Collaborative collected data45
in 2010 to provide a general understanding of urban school
district staffing levels. The survey does not give precise comparisons and the results should be
used with caution. District data are not uniform (e.g., including or excluding contractual
45 The data are supplemented by information collected by the Council of Great City Schools.

Review of Special Education in the Providence Public School District
Council of the Great City Schools Page 91
personnel), and reflect varying levels of private and public placements outside a district. The
data, which have been supplemented by information collected by the Council of the Great City
Schools during special education reviews, are useful in better understanding staffing ratios.
Teachers and Teacher Assistants
As shown by exhibit 43 below, PPSD has an overall average of 13 students with
disabilities for every special education teacher and teacher assistant. For special educators, the
average is two students less than the average of 15 for all districts, ranking Providence as 17th
among the 44 urban districts participating in the survey. For each teacher assistant, the average
is three students less than the average of 16 for all districts, ranking Providence 14th
among the
44 reporting districts.
Exhibit 43. Average Number of Students with Disabilities for Each Special Educator and
Teacher Assistant46
Areas of Comparison Special Educators Teacher Assistants
Number of PPSD Staff 340 339
PPSD Student w/IEP-to-Staff Ratios 13:1 13:1
All District Average Ratios 15:1 16:1
Range of All District Ratios 7–37:1 7–56:1
PPSD Ranking Among Districts47
17th of 44 districts 14th of 44 districts
RIDE no longer has a provision that regulates maximum class-size ratios for students
receiving special education services. The district considers each school’s staffing levels based
on the number and needs of projected students. Disagreements, including those between
special education administrators and principals, are resolved through the collection of
additional information that involves the chief academic officer. The Council’s team received
the following feedback on the process for hiring and use of special educators and teacher
assistants.
One major issue that received significant attention was the lack of criterion-based
assignments for teachers or teacher assistants. As discussed above in the section on the
Behavior Intervention Program, the procedure for filling vacant positions with teachers
who do not currently have a teaching position causes significant problems in terms of
getting teachers with the expertise and skills necessary to teach students with
significant disabilities. Furthermore, if a teacher assistant position is open and filled
without a bid, another assistant can ―bump‖ into the position midyear. As a result,
personnel change frequently. Many of these changes require retraining staff and
46 2010 Urban Special Education Leadership Collaborative staffing survey, supplemented by data from the
Council of Great City Schools. 47
Ranking begins with districts having a low average number of students to one staff person.

Review of Special Education in the Providence Public School District
Council of the Great City Schools Page 92
periods of adjustment for students who do not respond well to change. One case was
reported where the assistant spoke a different language than did the assigned students.
The team was told that the Teacher Assistants Union is currently grieving the special
education office’s contract with an agency providing skilled behavior technicians.
There appears to be a culture of using teacher assistants for off-duty assignments that
take them away from supporting instruction, such as bathroom duty, etc.
Child care workers who are certified nursing assistants provide toileting assistance
while teacher assistants provide instructional support to students.
Although teacher assistants are paid to receive seven hours of the district’s professional
development, there was a universal concern that they require more training in order to
be effective. The Council was told that classes are offered between December and
May, and many are full. Focus group participants indicated that last year the training
was more targeted for teacher assistants. There was concern that training was
inconsistent in supporting students with autism, but interviewees claimed that when
training was provided, teacher-assistant support improved.
Teacher assistants are not allowed to be bus monitors, and monitors are not permitted
to assist students needing physical restraint. In such cases, both a teacher assistant and
a bus monitor must ride the bus. Reportedly, in some cases the teacher assistant must
leave work early to ride a bus that serves two schools.
Related Service Providers
Staffing ratios and district data on the district’s related-services personnel are summarized
below and in exhibit 44:
Speech/Language. One pathologist for an average 111 students, which is slightly
above the average of 1:125, ranking Providence 25th
of the 43 reporting districts.
Psychologists. One psychologist for an average 159 students, which is also slightly
above the average of 1:181, ranking Providence 25th
of the 36 reporting districts.
Social Workers. One social worker for an average 127 students, which is far greater
than the average of 1:283, ranking Providence 14th
of the 27 reporting districts.
Occupational Therapists. One occupational therapist for an average 388 students,
which is also greater than the average of 1:427, ranking Providence 9th
of the 42
reporting districts. The union contract caps the caseload for occupational therapists as
33 students, which may explain the district’s ratio in this area.

Review of Special Education in the Providence Public School District
Council of the Great City Schools Page 93
Physical Therapists. One physical therapist for an average 991 students, which is
substantially greater than the average of 1:1144, ranking Providence 20th
of 42
reporting districts.
Exhibit 44. Ratios of Students with Disabilities to Staff for Related Service Providers
Related Service Areas Speech/
Language Psychology
Social
Work OT PT
Number of PPSD Staff 35 28 35 11.5 4.5
PPSD Student w/IEP-to-Staff
Ratio 111:1 159:1 127:1 388:1 991:1
All District Average Ratio 125:1 181:1 283:1 427:1 1144:1
Range of All District Ratios 26–341:1 31–337:1 26–673:1 64–1685:1 128–2941:1
PPSD Ranking Among
Districts48
25th of 43 25th of 36 14th of 27 9th of 42 20th of 42
Two staff members in each of the following areas serve as leaders: psychologists,
social workers, and speech therapists. The ―leads‖ work with the directors to develop research-
based professional development in each field and solve various problems. They also help
create schedules, develop caseloads, and order supplies. These ―leads‖ are directly supervised
by the two special education directors.
The only area in which the Council’s team heard concerns about related services
involved speech/language services. Although recruiting bilingual personnel is particularly
difficult, there were still concerns about the shortage of speech/language pathologists for both
English- and Spanish-speaking students. According to focus group participants, State
complaints filed against PPSD mostly involve speech/language services resulting from these
shortages. Rhode Island does not set maximum caseloads and they can be as high as 70 or 80
students.
Parental Support and Involvement
IDEA requires parental collaboration and inclusion in IEP planning for children
receiving special education and related services. Indicator 8 of the SPP involves district results
on a Parent Involvement Survey. With the survey, the state measures the percentage of parents
with a child receiving special education service who report that schools supported their
involvement in improving services for children with disabilities. The state’s target for the
2009-10 school year was a relatively low 38.9 percent. According to RIDE’s SPP report for
the district, these data are only reported as a state aggregate score.
48 Ranking begins with districts having a low average number of students to one staff person.

Review of Special Education in the Providence Public School District
Council of the Great City Schools Page 94
The district’s mechanism for parent collaboration is the state-mandatory Providence
Local Advisory Committee (LAC), which meets at least four times a year. About half the LAC
is composed of parents and the other half includes teachers, school administrators, and related-
service providers. The group is led by two parents and two special education administrators
who plan meetings on a variety of subjects, including IEP planning and the continuum of
services, federal and state special education requirements, and RTI/PBIS (with which parents
expressed confusion). Social networking between parents and professionals is encouraged, and
time is available at the end of each meeting for parents to seek resolution of their concerns.
Sample concerns from parents included missing speech services and long-term absences of
teacher assistants with no coverage.
The following feedback was provided about the LAC and the district’s involvement
with parents:
Parents interviewed indicated that the district does a good job getting information out
to parents. A positive reflection of the special education office’s collaboration with
parents is the absence of due process hearings and effective use of mediation to resolve
concerns.
Over the last three years the LAC’s membership has increased, but focus group
participants stated that it has been difficult to find parent leadership. Staff collaborate
with the RI Parent Information Network (RIPEN) to provide an eight-week parent
leadership program to address this issue.
While the superintendent asked every principal to identify a parent who would
represent the school at meetings and act as a liaison between the LAC and the
parent/teacher organization, attendance is inconsistent. Attendance by the three district
principals who are to represent the district and share information with grade-level peers
is also spotty. Reportedly, teacher participation decreased when compensation for their
attendance ceased.
Some parents expressed the desire for greater school-parent communication and
opportunities for parents to receive assistance and to learn about the special education
process and about what special education means for a child’s future. In addition, while
parents who are ELL are given headphones during LAC meetings to hear information
in Spanish, concerns were expressed that IEPs were not translated sufficiently into
Spanish and language interpreters were not always available for IEP meetings.49
49 In a letter dated September 4, 2007, the federal Office of Special Education Programs (OSEP) indicated that
districts are not required to translate IEPs into a parent’s native language. However, OSEP indicated that, for
parents who read in their native language, providing them with written translations of the IEP documents may be
one way for a school district to demonstrate that the parent has been fully informed of the child’s educational
program.

Review of Special Education in the Providence Public School District
Council of the Great City Schools Page 95
Although the district’s website provides information about administrators that parents
may contact about concerns, feedback from parents indicated that they are sometimes
not clear about whom to approach, and when they do try to make contact,
responsiveness varies despite a district a 24-hour return-call policy.
Professional Development
In addition to the features of the district’s professional development discussed above,
the following provides an overview of this area.
Special education and the teaching and learning unit collaborate on providing
professional development opportunities for teachers to improve instruction. A minimum
number of professional development hours (ranging from 20 to 80) are required, based on
position title. Teachers and teacher assistants are paid to attend the training.
PPSD publishes a catalog of workshops for all teachers by category, which teachers
select through My Learning Plan. However, focus group members shared the concern that
classes fill up quickly, so some teachers are prevented from accessing required professional
development.
The special education office also supports leadership training for district teaching and
learning teams and principals twice monthly. In addition to general topics focused on the core
curriculum, analyzing and understanding data, and creating school-based effective
professional-learning communities, information is provided on special education and ELL
regulations and on instructional strategies. Learning-walks and book readings also support
these activities.
Moreover, specific workshops are provided to support special educators in literacy,
math, and science instruction and in implementing grade-level standards and curriculum.
Workshop topics include literacy, science, and math training, as well as other areas, e.g.,
analyzing student data, IEP development, alternate assessments, developing functional
behavior assessments, implementing a three-tier approach to behavioral interventions, and
understanding and meeting the needs of students with autism spectrum disorder.
Use of Technology and Data
The district’s technology infrastructure is old and is cumbersome to operate. Examples
include old computers that are slow to open Microsoft and other software files and emails, and
insufficient access to printers and ink, etc. Although there are fiscal limitations and there has
been poor planning, the district has a three-year technology plan (July 1, 2010 to June 30,
2013) to improve access to effective technology.
The district’s electronic IEP process, EasyIEP, provides an effective way to produce
IEPs, but data migration issues have prevented staff members from using the data, maintaining
compliance reporting, and using other benefits of the program. For example:

Review of Special Education in the Providence Public School District
Council of the Great City Schools Page 96
Special education office secretaries and evaluation team members input a variety of
special education data into REG, the district’s proprietary student information system,
which should be able to migrate data electronically, but does not. This problem stems
from initial difficulties in setting up the electronic IEP system several years ago and
the inability to correct data migration issues. The input of data that are not migrated
creates an environment for inaccurate data.
It is time-consuming for PPSD to prepare essential data reports from REG, such as
those requested by the Council’s team. It is also difficult to provide school-based
reports on state performance indicators. Furthermore, reports on eligibility rates for
students referred in one school year cannot be accurately calculated because the REG
system is unable to produce data for evaluations completed the following school year.
This problem may also impact state assessment reporting for students who have exited
from special education and/or ELL programs for at least two years.
Although the district does receive various compliance documents that special
education specialists and administrators review with school-based staff, the real-time
compliance functions of Easy IEP (such as electronic notifications of upcoming
evaluations, IEP meetings, etc.) are unavailable, but they would help improve the
district’s timeliness rates in these areas.
Special education records are copied and maintained at the central office, resulting in
unnecessary costs and personnel effort. Focus group participants indicated that when
students transfer between schools, it could take three to four weeks to obtain records.
Focus group participants also raised concerns about delays in downloading assistive
technology software required for students. District policy permits only instructional
technology personnel to input software. This may take several weeks. Some special education
personnel, however, believe they have the knowledge to accomplish this task more promptly.
This issue may also be affecting the downloading of the district’s electronic transition
planning system.
Summary of Observations, Concerns, and Recommendations on Support
for Teaching and Learning
The following are positive observations, areas of concerns, and recommendations to improve
support for teaching and learning.

Review of Special Education in the Providence Public School District
Council of the Great City Schools Page 97
Special Education Management and Operations
Positive Observations
Knowledgeable and Collaborative Staff. Special education directors and their staff are
viewed as knowledgeable and helpful to schools and parents and as working
cooperatively with other teaching and learning administrators.
Well-staffed Administrative Support. Nine administrators (including two directors)
and 11 ―quasi-administrative‖ specialists support the district’s 45 regular and charter
schools, a relatively small administrator to school ratio.
Lead Related-Services Staff. The special education administrative unit uses a system
of ―lead‖ personnel in the areas of psychologists, social workers, and speech/language
pathologists who serve as mentors and who assist directors in designing professional
development and support their administrative functions.
Areas of Concern
Administrators Are Not Organized for Maximum Effectiveness. Although the special
education office enjoys a relatively small administrator to school ratio, the
administrators are not organized in a highly effective manner.
Director Positions. The two special education directors have similar functions at the
elementary and secondary levels. This seeming division of responsibility, however,
eliminates any economy of scale otherwise available. For example, both directors have
responsibility for establishing procedures for maintaining compliance with federal and
state special education rules. Furthermore, they each have districtwide responsibilities
for some content areas but rely on supervisors and specialists over whom they have no
supervisory authority. In addition, they each have responsibility for supporting
individual schools.
Supervisors and Specialists. In addition, some supervisors have responsibility for
districtwide programmatic areas but lack the ability to oversee the execution of their
programs. For example, a supervisor supports the Behavior Intervention Program but is
assigned to some schools that do not have these programs and is not assigned to
schools that do. Furthermore, the extent to which this supervisor is able to coordinate
with the behavior coaches is affected by other responsibilities that require going
through two directors. According to interviewees, despite the small overall
administrative ratio, supervisors reportedly work reactively and in ―crisis mode.‖
Lead Psychologists, Social Workers, and Speech/Language Pathologists. None of the
lead personnel have any reduced caseloads to support their work.

Review of Special Education in the Providence Public School District
Council of the Great City Schools Page 98
Secretaries. The special education department has a surprisingly large number of
secretaries. The department recommended reductions in the past, but the union
opposed them. In addition, changes to their roles have elicited grievances, e.g., filing
student records, inputting SWIS discipline data, etc.
Human Resource Responsibilities. Special education administrators conduct all
screening interviews for teacher assistant positions. In other districts, this function is
typically performed by Human Resources.
Recommendations
10. Reorganize the special education office in the following ways:50
a. Employ one director for special education and support services. Although focus
group participants provided positive comments about the two special education
directors, the district’s size does not justify having two different leaders in this area.
Instead, one voice in special education and support services will provide more
consistency and accountability and will eliminate previously overlapping
responsibilities. The director should have responsibility for the overall management
and operation of special education, providing leadership to managers and collaborating
with PPSD education-related administrators. (1 administrative assistant)
b. Establish manager positions51
to assist the director in the administration and
operation of the office. Instead of layering districtwide and grade-level programmatic
responsibilities on top of direct support to schools, consider establishing the following
manager positions:
Programmatic manager to provide leadership in the areas of behavior (including
PBIS, behavior coaches, behavior intervention programs), physical restraint
training, autism teams, and alternative assessments. (1 administrative assistant for
this and next three managers)
Clinical and other support manager to provide support for all related-service
personnel, assistive technology, vision/mobility, adapted physical education,
scheduling, psychiatric evaluations, etc.
Data support manager to coordinate electronic IEP processes and develop on-
demand data reports.
50 It is anticipated that these changes would be budget neutral. Also, the recommendations are offered with
recognition that they present details that would likely be modified, based on further review and consideration. 51
The term manager is used here generically and does not refer to a particular position level. Consequently, there
may be more appropriate titles or classifications for these positions.

Review of Special Education in the Providence Public School District
Council of the Great City Schools Page 99
Business operations manager to provide support on the budget, Medicaid billing,
taxi vouchers, private school billing, etc.
Elementary-level manager to (1) support teaching and learning’s direction for
RTI/PBIS and provide direction for inclusive educational services, (2) carry out
program quality reviews, (3) coordinate extended school year and home
instruction, (4) support preschool and child-find activities, (5) coordinate
professional development activities for elementary schools, (6) liaise with the
Local Advisory Committee, (7) support human resource activities, and (8) attend
teaching and learning and grade-level meetings. (1 administrative assistant for
manager and coordinators)
Secondary-level manager. Same as above but support transition activities (instead
of early childhood activities). The current transition coordinator would report to
this manager. (1 administrative assistant for manager and coordinators)
Preschool manager to provide support for preschoolers with disabilities, including
curriculum development, teaching strategies, mandates from RIDE, child outreach
screening, working with the pre-k community, transition to kindergarten, early
interventions, and coordinating with the 24 pre-k classrooms and three pre-k teams.
Lead psychologists, social workers and speech/language pathologists. Investigate
the possibility of reducing the caseloads of the two leads in each area to support
their effectiveness. (1 administrative assistant)
Include for one or more of these managers the responsibility for developing the
procedures necessary for implementing federal and state compliance activities. As
discussed in recommendation 11, transfer to Human Resources the responsibility for
recruiting and screening teacher assistants.
c. Redefine the specialist position as a coordinator (or other title) to directly support
schools that are under the supervision of the elementary- or secondary-level
manager. Coordinators would directly support schools and teachers in all areas for
which the elementary- and secondary-level managers are responsible. In addition, the
coordinators would support the work of other programmatic managers in their
respective schools. Assign five coordinators to the elementary schools and four to the
middle and high schools. The additional support at the elementary level would assist
coordinators in being the district’s representatives at IEP meetings until individuals in
the elementary schools can be identified to carry out this function. In the meantime,
provide sufficient training to elementary school related-service personnel and special
educators to conduct these meetings pursuant to federal and state requirements.
d. Provide sufficient professional development for personnel to enable them to carry
out their responsibilities.

Review of Special Education in the Providence Public School District
Council of the Great City Schools Page 100
Staffing Patterns and Usage
Positive Observations
PPSD staffing ratios for special educators and teacher assistants is in the top half of
urban school districts responding to the survey conducted by the Urban Special
Education Leadership Collaborative and supplemented by the Council of Great City
Schools. Further, ratios for speech/language pathologists, social workers, and physical
therapists appear to be around the middle ranking of all reporting districts.
The Teacher Assistants Union funds professional development for its staff and
expressed a willingness to collaborate with the district in providing more access to this
needed activity.
Areas of Concern
The district employs as many teacher assistants as it does special educators. Teacher
assistants are frequently asked to accept assignments that are not related to their job
responsibilities supporting students with disabilities. Further, the lack of substitutes for
teacher assistants affects instruction when they are absent, especially for long periods
of time. When teacher assistants are needed to restrain a student on a bus,
transportation schedules may require them to leave school early. The prohibition
against using teacher assistants as bus monitors or training and enabling bus monitors
to properly restrain students blocks effective use of resources.
Due to the lack of criterion-based hiring for teachers and teacher assistants, more
professional development and support are required than would otherwise be necessary.
Furthermore, the impact of teacher assistant bumping midyear has an unnecessarily
negative impact on students who need skilled and consistent support. In addition, the
required differentiation of personnel between childcare workers and teacher assistants
is neither programmatically nor fiscally effective.
There is a significant need to expand professional development for teacher assistants so
that they are more effective at supporting students. The short period of time for
training unnecessarily limits access to such expanded development.
The district ratio of student-to-occupational therapists appears to be in the top fifth of
all reporting districts.52
However, although the ratio for speech/language pathologists
appears to be about average for reporting districts, we are concerned that there are too
few, including bilingual staff, as evidenced by the number of complaints filed with the
state on this issue.
52 As noted previously, this ratio is a union contract issue that may need to be addressed.

Review of Special Education in the Providence Public School District
Council of the Great City Schools Page 101
The Council’s team was also concerned about the lack of content-certified special
educators; the lack of substitutes for teacher assistants who are absent (sometimes for
months at a time); and ESL teachers not supporting an ELL student with disabilities in
a class not designated as ESL.
Recommendations
11. Establish the following procedures and practices designed to enhance the expertise of
personnel involved in the instruction of students with disabilities:
a. With university collaboration and exemplary core-content teachers, aggressively
provide professional development to special education teachers who do not have
necessary core curriculum knowledge and skills.
b. Review the proportion of personnel hired as special education teachers and teacher
assistants; review use of occupational therapists. With a representative group of
principals, consider effective models for using more special educators and fewer
teacher assistants in a budget neutral way. In addition, review the use of occupational
therapists and whether the current ratios are necessary to meet the needs of students.
c. Establish criteria-based hiring practices for special educators and teacher assistants.
As soon as possible, implement criteria-based hiring for teachers and teacher
assistants. As part of this process, determine if there is any way to address the
seniority-based filling of positions without having to hire previously employed
teachers who are now without jobs. Also, take steps to end the practice of midyear job
shifting, given the negative effect this practice has on students, particularly those with
significant disabilities. In particular, establish hiring criteria for teachers and teacher
assistants working with students who have intensive needs (e.g., autism,
social/emotional, communication, hearing, vision, etc.).
d. Ensure the appropriate and effective use of teacher assistants. Issue a reminder to
principals that teacher assistants should not be asked to leave instructional duties to
perform clerical or other nonrelated instructional activities, and investigate any
noncompliance the practice might involve.
e. Aggressively explore the use of substitutes for absent teacher assistants. The use of
substitutes would require discussion with the union because the current requirement
indicates that once teacher assistants work 60 days they become a long-term substitute,
which entitles them to benefits.
f. Expect the Human Resources office to engage in expanded recruitment, screening,
and hiring in the area of special education and related services. Set expectations for
Human Resources to expand advertising for and recruitment of teacher assistants so
that there is a large enough applicant pool to fill all positions at the beginning of the
year. Interview and screen individuals applying to become teacher assistants, and

Review of Special Education in the Providence Public School District
Council of the Great City Schools Page 102
increase support for recruiting and hiring special education teachers certified in core
content areas and bilingual staff members with expertise in challenging behavior,
speech/language pathology, and multiple languages.
g. Explore the use of “virtual” speech/language therapy when the need exceeds
capacity.
h. Pursue more flexible work rules, including:
Job descriptions that enable teacher assistants to fulfill various childcare worker
duties that do not require specific educational requirements, e.g., changing diapers,
and that enable child care workers to provide incidental supplementary
instructional support to students.
More flexible job descriptions that support changing needs, e.g., asking secretaries
to input SWIS behavior data on-line; expecting an ESL teacher’s duties to include
supporting an ELL student in a class that is not designated as ESL, etc.
Enabling teacher assistants to serve as bus monitors and/or enabling bus monitors
to be trained to appropriately restrain a student.
i. Increase professional development opportunities for teacher assistants. Collaborate
with the union to provide more training for teacher assistants, including comprehensive
initial training before the school year and again midyear for new hires as needed and
for assistants involved with students having significant needs. Training should include
strategies for supporting co-teaching and core PBIS principles and strategies.
Parental Support and Involvement
Positive Observations
It appears the district provides good information to parents. There is an absence of due
process hearings and use of mediation to resolve concerns. A strong relationship with
the RI Parent Information Network provides a means of increasing parent LAC
leadership.
The district supports an active LAC, with leadership that takes its role seriously. The
LAC is striving to expand parental involvement and knowledge about activities that
would benefit their child’s performance. Real-time translation of meetings into Spanish
provides meaningful access for parents who are ELL.
The special education department has a robust website with information about the
special education process, as well as separate pages on child outreach, early childhood
special education, individualized education plans, dispute resolution,
disproportionality, related services, helpful links, and special education contacts.

Review of Special Education in the Providence Public School District
Council of the Great City Schools Page 103
Areas of Concern
There is inconsistent attendance at LAC meetings by designated grade-level principal
representatives and parents acting as school liaisons. Teacher participation has also
decreased because they are no longer compensated for attending.
The team had a number of concerns about the need for expanded opportunities for
parent/school/district communications, school contact information to resolve problems,
inconsistent administrator or school-based responsiveness, consideration of IEPs
translated into Spanish, and language interpreters for IEP meetings.
Recommendations
12. Reinforce PPSD’s efforts to promote effective parent involvement in the education of
their children with disabilities by considering the following:
a. To support consistent grade-level attendance at LAC meetings by principals and
special educators, rotate volunteer principal/teacher involvement, with the
understanding that the responsible individual will arrange for a substitute if unable
to attend a meeting. As part of this process, the superintendent and chief academic
officer would stress the importance of this activity and why their participation and
sharing of information is beneficial to parents and their children.
b. Share with the LAC leadership the feedback that sessions might be best grouped or
organized around relevant grade levels. While the meetings might continue to address
parents at all grade levels, it may be appropriate to divide some presentations and
discussions into specific preschool, elementary, middle, and high school categories to
make them more relevant and attractive to parents and stakeholders.
c. Consider the benefits of possibly translating IEPs into Spanish and providing
Spanish language translators for IEP meetings upon request. Establish procedures
for notifying appropriate staff about meeting these requests.
d. Establish a LAC subgroup to discuss ways to improve communication between
parents and schools, including sharing information about special education
requirements, identification of school-based contacts, etc. Consider one-page parent
information sheets that would be available in schools and other convenient locations,
such as the ones recently developed by the Detroit Public Schools. See appendix D for
an example.
e. Investigate whether it is possible to obtain from RIDE the district’s non-reported
percentage of parents with a child receiving special education services who were
asked about their involvement in the IEPs.

Review of Special Education in the Providence Public School District
Council of the Great City Schools Page 104
Professional Development
Positive Observations
The special education and teaching and learning offices collaborate to provide
professional development opportunities for teachers to improve instruction. Teachers
are paid to attend a minimum number of hours of professional development, which
range from 20 to 80 hours depending on job title. Also, the special education office
supports leadership training twice each month for the district’s teaching and learning
teams and principals. Training is supplemented by learning-walks and shared book
reading.
Workshops designed for special educators and teacher assistants cover a variety of
topics relevant to the instruction of students with disabilities.
Areas of Concern
Focus group participants indicated that professional development classes fill up
quickly. As a result, staff members do not have sufficient opportunity to access
required professional development.
Although significant professional development has been offered, concerns remain
about performance in the following areas: (1) consistency in making special education
eligibility determinations, (2) differentiating academic difficulties due to a language
acquisition problem or to a disability, (3) knowledge of core-curriculum content, (4)
effective RTI/PBIS practices, (5) differentiated instruction, (6) effective support of
students with disabilities (including ELLs) in general education and separate settings,
and (7) reducing challenging student behavior.
Recommendations
13. Based on the recommendations on professional development included in this report,
have the PPSD leadership team consider how professional development could be better
organized and mandated to accomplish desired goals. As part of this process, consider
the district’s capacity and need for training using electronic means (such as webinars,
videos and assessments), as well as coaching and mentoring to ensure that all staff have
access to quality professional development, internalize information, and use what they
learn. Especially important is identifying ways that special educators can learn core
content information in a practical and user-friendly manner.

Review of Special Education in the Providence Public School District
Council of the Great City Schools Page 105
Use of Technology and Data
Positive Observations
Special education and technology representatives from the district have met with the
data vendor to initiate the migration of data from EasyIEP to REG and fully realize the
compliance reporting capabilities of the district’s electronic IEP system.
Planning is underway to enhance the district’s technology system.
Areas of Concern
The district’s old technology system is difficult to navigate and to use productively.
PPSD’s electronic IEP system is not being fully utilized:
There are difficulties migrating data from Easy IEP to REG. As a result, there is
double entry of data, which leads to human entry errors and cost inefficiencies.
Because EasyIEP data reporting has not been fully utilized, it is extremely difficult and
time consuming for PPSD to prepare special reports, as well as timely, essential, and
accurate routine reports, e.g., percentage of referred students who are eligible for
special education services, accurate dropout and graduation rates, and accurate
transition compliance rates.53
Various compliance functions of Easy IEP (such as notification of upcoming
evaluations, IEP meetings, etc.) have not been fully utilized. (This issue may also
affect state assessment reporting of students who have exited from special education
and/or ELL programs for at least two years.)
Maintaining special education records at the central office results in unnecessary costs
and personnel effort.
The office of technology’s control over the downloading of all software results in
delays in providing students access to assistive and other technology.
Recommendations
14. Improve the way PPSD uses technology to support staff and students receiving special
education services.
a. Improve electronic IEP reporting. Follow up on the district’s discussions with its
vendor about implementing plans for migrating data between Easy IEP and REG and
53 See discussion in section B regarding RIDE and district graduation and dropout rates and section C regarding
transition compliance rate reporting discrepancies.
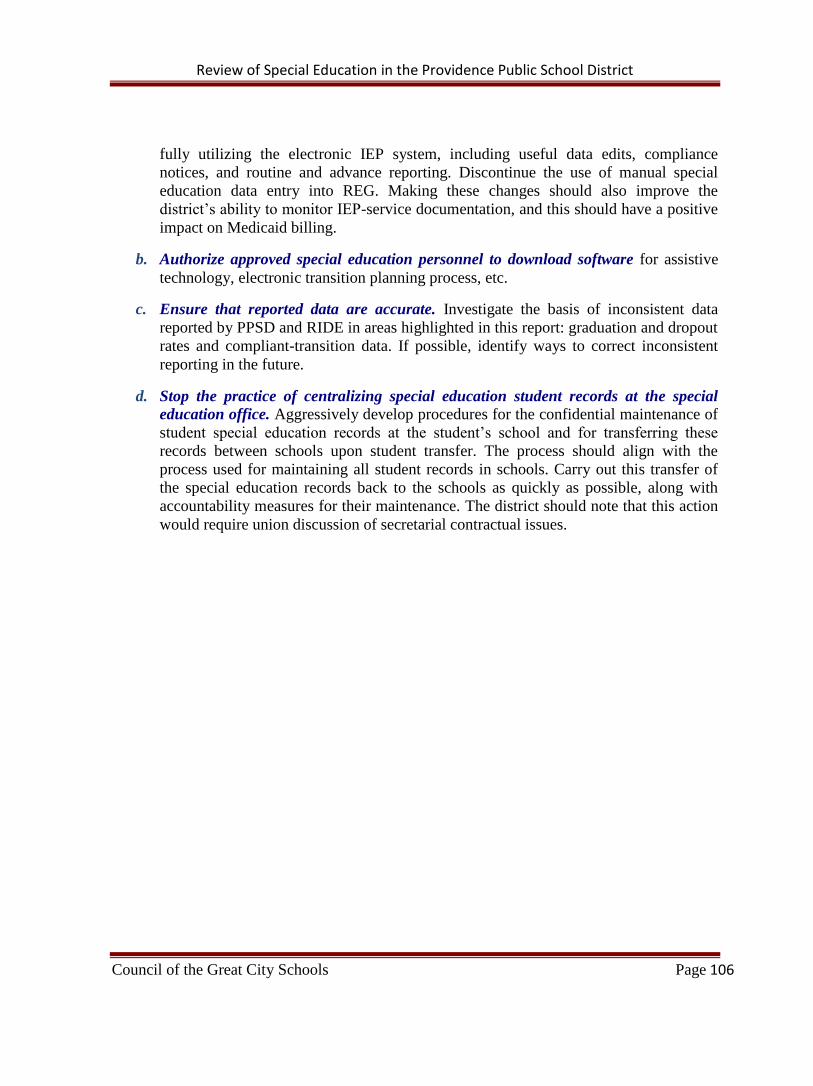
Review of Special Education in the Providence Public School District
Council of the Great City Schools Page 106
fully utilizing the electronic IEP system, including useful data edits, compliance
notices, and routine and advance reporting. Discontinue the use of manual special
education data entry into REG. Making these changes should also improve the
district’s ability to monitor IEP-service documentation, and this should have a positive
impact on Medicaid billing.
b. Authorize approved special education personnel to download software for assistive
technology, electronic transition planning process, etc.
c. Ensure that reported data are accurate. Investigate the basis of inconsistent data
reported by PPSD and RIDE in areas highlighted in this report: graduation and dropout
rates and compliant-transition data. If possible, identify ways to correct inconsistent
reporting in the future.
d. Stop the practice of centralizing special education student records at the special
education office. Aggressively develop procedures for the confidential maintenance of
student special education records at the student’s school and for transferring these
records between schools upon student transfer. The process should align with the
process used for maintaining all student records in schools. Carry out this transfer of
the special education records back to the schools as quickly as possible, along with
accountability measures for their maintenance. The district should note that this action
would require union discussion of secretarial contractual issues.

Review of Special Education in the Providence Public School District
Council of the Great City Schools Page 107
Section E. Accountability for Expected Practices and Results
Finally, the Council’s team reviewed the systems that PPSD has in place (1) to hold
central office and school-based personnel accountable for the administration and operation of
special education services, and (2) to implement practices designed to improve the
performance of underachieving students through RTI and PBIS. The following summarizes
the team’s observations and recommendations on this issue.
In the 2010-11 school year, PPSD implemented a Principal Performance Metric, which
measures a variety of student-performance indicators for all students and achievement
gap data in reading and math between various subgroups, including students with and
without IEPs. The Metric also sets targets to reduce the gaps through 2014-15. It was
reported to the team that, as a result of this action, principals were more carefully
analyzing data for students receiving special education services and were discussing
instructional supports, such as curricular accommodations and inclusive instruction.
The Metric, however, does not address other performance indicators relevant to
students with IEPs, such as those included in the state performance indicators. For
example, the Metric could not be used to address RIDE’s determination that the district
needs assistance on timely evaluations of school-aged students and children
transitioning from Part C early intervention programs by three years of age.
The district has a culture in which principals and other personnel rely heavily on
special education directors, supervisors, and specialists to administer school-based
activities. Principals are not required to account for a variety of special education
processes conducted at their schools, such as completing evaluations promptly and
appropriately. Instead, principals view this as a supervisor’s duty. The district has
begun to move responsibilities to the school level by shifting various functions from
supervisors to teacher leaders at the middle and secondary levels.
Although school walk-throughs address RTI interventions, they do not address
effective co-teaching and other research-based models for educating students with
disabilities, including those who are ELL.
The district’s current system for conducting teacher evaluation will be replaced by a
system that will be phased in over the next three years. The system must meet state
standards requiring 51 percent of the assessment to be based student achievement data.
In 2006, PPSD commissioned a report from the Public Consulting Group’s Center for
Resource Management (CRM) to examine the district’s provision of special education
instruction and support. According to the RIDE Office of Special Population’s January 2007
School Support System Report and Support Plan for the Providence School Department, many
of CRM’s findings were echoed in the state report. Similarly, many of CRM’s findings are
reflected in this report.

Review of Special Education in the Providence Public School District
Council of the Great City Schools Page 108
The CRM Report had two stated goals: to provide a comprehensive analysis of the
outcomes by students with disabilities and to determine the extent to which these students are
developing the reading skills necessary for academic success. The report emphasized the
district’s need to:
[C]reate an accountability structure for program effectiveness and student outcomes
with clear lines of authority and responsibility
Develop a unified system that collaboratively addresses the needs of all students in
order to provide effective instructional supports and to maximize the use of staff and
resources.
CRM recommendations included the following strategies for promoting improvement:
Facilitate RTI, and emphasize that the initial leadership role taken on by special
education needs in fact to be a general education initiative with collaborative input
from special education.
Address consistency issues in the provision of services across schools.
Establishing a research-based co-teaching model.
Co-train general and special education teachers in the use of accommodations,
modifications, and behavior interventions;
Continue to emphasize professional development related to differentiating instruction.
Provide research-based behavior programs/interventions at the middle and high school
levels.
Improve transition services at the high school level.
Define the roles of supervisors and principals, including redefining/clarifying the special
education supervisor’s role to support school staff to be more integrated with school level
efforts. Also, clarify the principal’s role in supervising instruction and improving
outcomes.
The RIDE report noted several aspects of these recommendations that were apparent during
their review, such as the use of PBIS, professional development on differentiated instruction,
and integrated professional development for general and special educators. In addition, the
district has begun to implement RTI, including the use of universal screening, research-based
interventions, and progress monitoring.
Also, the offices of special education, in partnership with research, planning, and
accountability, developed an internal Special Education Report for the Providence School
Board in October 2009. The task of the report was to answer three questions:

Review of Special Education in the Providence Public School District
Council of the Great City Schools Page 109
What special education services are available to Providence students?
What students are receiving special education services?
To what extent are special education services aligned and in compliance with
regulations, policies, and procedures articulated by the federal and state government?
The report was very thorough and contained a significant amount of data and analysis,
although it lacked a detailed discussion of issues and an action plan.
Summary of Positive Observations, Concerns, and Recommendations on
Accountability for Expected Practices and Results
The following are positive observations, areas of concerns, and recommendations for
improved accountability for expected practices and results.
Positive Observations
PPSD’s recently implemented Principal Performance Metrics include academic gaps
between students with and without IEPs, thus focusing on the performance of students
receiving special education and on instructional elements that supports their success.
Several recommendations made in 2006 from an outside special education evaluation
have begun to be implemented, and the district’s offices of special education and
research, planning, and accountability reflected a sophisticated understanding of the
district’s operation and relevant data pertaining to instruction.
Areas of Concern
Although PPSD has begun to step up accountability at the school level for the
performance of students with disabilities, the 2006 CRM recommendation for the
creation of an accountability structure for program effectiveness and student outcomes
with clear lines of authority and responsibility has not been fully addressed.
The district does not have clear expectations for principals’ responsibility for the
administration and operation of special education, including core practice areas that
support student academic and social/emotional performance.
Systemwide planning lacks core research-based practices that support inclusive
education with supplementary aids and services, positive behavior for students with
challenging behavior, state performance indicators, and targets and measurement
components. In addition, walk-through protocols lack indicators to guide staff to
identify and provide feedback on such research-based practices as effective co-

Review of Special Education in the Providence Public School District
Council of the Great City Schools Page 110
teaching and other instructional models. And the professional development system is
not differentiated and based on an analysis of what individual teachers need to become
more effective or on districtwide special education goals and priorities.
Recommendations
15. Enhance PPSD’s system of accountability by incorporating core measurable
expectations, including those for RTI/PBIS, inclusive instruction, outcome indicators
required by the SPP, etc. Establish, communicate, support, and monitor clear
expectations and ―non-negotiables,‖ establishing clear lines of accountability and
responsibility across departments, aligning them with relevant guidance documents.
Require schools to incorporate effective activities into their school improvement plans
(e.g., walk-throughs and professional development), and incorporate them into
administrator, principal, teacher, teacher assistant, and related-service personnel
evaluations. Establish school-based targets for meeting these expectations that would
enable the district to meet or exceed all state performance targets. Expect executive
directors to review, monitor, and support activities to meet targets, with collaborative
support from the special education office.
16. Communicate clear expectations for principal accountability for the administration and
operation of special education at the school level. Establish clear oral and written
communications to principals and their executive directors on principal accountability for
special education operations and administration. To support this process, provide
principals with the professional development and supports they need (1) to provide
leadership for educating students with disabilities in general education classes with
needed supplementary aids and services, (2) to ensure that students in separate classes
have access to the core curriculum and positive behavior supports, (3) and to set up
systems for appropriate eligibility determinations, IEPs and services, manifestation-
determinations, etc. To this end, provide sufficient training to new executive directors
and principals before or soon after they begin their tenure.
17. Establish a process whereby the core measurable outcomes referred to in
recommendation 15 are actively reviewed and acted upon. Following the oft-quoted
saying that what gets measured gets done, regularly gather relevant stakeholders to
review data and identify actions that need to be taken when the reviews indicate
necessary follow-up action. Stakeholders would include relevant executive directors and
principals, special/general education, and other relevant administrators. Such meetings
should rotate reviews on the such data elements for students with and without IEPs as (1)
graduation rates (at beginning of year) (2) dropout rates (periodically when data are
available); (3) credits earned, failures, and ―D‖ grades; (4) unexcused absences; (5)
suspensions (in-school and out-of-school by race/ethnicity) and office referrals; (6) use of
PBIS and RTI; (7) referrals for special education evaluations and percentage of students
found eligible by disability area; and (8) SPP performance indicators. The Baltimore City
Public Schools has been using this process successfully and, as a result, principal

Review of Special Education in the Providence Public School District
Council of the Great City Schools Page 111
accountability in this area has become a reality. A copy of relevant information has been
forwarded to district personnel for appropriate follow-up.

Review of Special Education in the Providence Public School District
Council of the Great City Schools Page 112
CHAPTER 4. SUMMARY OF RECOMMENDATIONS
A. Recommendation Matrix
The exhibit below annotates the recommendations from the previous chapter in table
form corresponding with their functional categories. The subsequent section of this chapter
presents a summary of the recommendations.
Recommendations
Acc
ou
nta
bili
ty
Stan
dar
ds/
Po
licy
Sch
oo
l Pla
ns
Trai
nin
g
Dat
a/Te
chn
olo
gy
Cro
ss-R
efer
ence
Section A. Identification of Students Eligible to Receive Special Education Services
1. Improve consistency and appropriateness of eligibility determinations across the
district. a. Identify disability areas in which PPSD students are identified at higher levels
than other students in nation. Consider consultant to review current criteria.
Review sample of recent evaluations to identify concerns.
x x x x 4
b. Improve special education referral and screening process. Review accurate data
to identify any patterns, and review student files reflecting trends. x x
c. Use data to initiate improvement plans for referral/evaluation process and
monitor outcomes; produce accurate quarterly referral reports and identify
outliers. With principal, develop plans, and through CAO, disseminate data to
relevant administrators to support school activities.
x x x x x 17
d. Improve special education referral/evaluation process for students who are ELL
with evidence-based practices. x x
e. Revise process for use of psychiatric evaluation, with written protocol, training,
and monitoring of implementation. x x x
Section B. Student Performance
2. Increase number of freshman year students “on track” to graduate. a. Identify students ―not on track,‖ i.e., students entering high school two or more
years below grade level. Use research-based strategies to plan improvement,
provide students with disabilities support for credit recovery assistance, and
provide them access to high school courses based on core standards.
x x x x x 17
b. Identify and support high schools with high dropout rates, require school-based
targeted/research-based plans, and involve feeder schools. x x x x x 17
3. Reduce out-of-school suspensions for students with disabilities. Identify students
with disabilities (and nondisabled) having five or more days of out-of-school or in-
school suspensions. Use model template based on RTI/PBIS for school-based
planning plan and monthly report/disseminate data for follow-up.
x x x 17

Review of Special Education in the Providence Public School District
Council of the Great City Schools Page 113
Recommendations
Acc
ou
nta
bili
ty
Stan
dar
ds/
Po
licy
Sch
oo
l Pla
ns
Trai
nin
g
Dat
a/Te
chn
olo
gy
Cro
ss-R
efer
ence
4. Create and distribute a monthly report on unexcused student absences by school, requiring schools to correct any data that appear to be reported in error. Have
schools and the central office investigate/ correct erroneous data and follow up on
excessive absences
x x x 17
Section C. Instructional Practices and Support
Response to Intervention
5. Develop and implement comprehensive RTI framework, policies, and procedures to address reading, math,
positive student behavior, and accountability for results. a. Establish general education leadership with expert support for RTI and PBIS. x b. Establish RTI/PBIS framework, policies, and procedures to promote a common
language for the implementation. x x 6f
c. Provide differentiated professional development to impart knowledge necessary
to implement PPSD’s framework and standards. x
d. Identify the core information that various staff persons need regarding RTI/PBIS
in order to develop/implement comprehensive and differentiated professional
development.
x x
e. Collect, analyze, report, and follow up on student behavior-related data. x f. Identify demonstration schools and exemplary staff to lead training. x g. Monitor implementation and effectiveness. x x 17
Instruction in General Education Classes with Supplementary Aids and Services
6. Establish a bold vision of PPSD as an inclusive school district that provides students with disabilities with the
supplementary aids and services they need to meet Rhode Island’s Common Core Standards. a. Establish a visible general education presence with broad collaboration to lead
initiative. x
b. Design and implement the infrastructure needed to execute PPSD’s inclusive
school vision and policy, including research-based standards. x x
c. Expand instruction in general education setting 40-79 percent of the time for
students currently in more restrictive settings; incorporate components in
recommendation 6 planning.
x x
d. Build on RTI/PBIS differentiated professional development for RTI to impart
knowledge necessary to implement PPSD’s framework/standards for inclusive
instruction, emphasizing core information that various personnel need to know.
x
e. Establish a timely communication and feedback process to share solutions to
barriers to carrying out programs. x
f. With model template, use school-based process for planning implementation of
the framework. x 5b

Review of Special Education in the Providence Public School District
Council of the Great City Schools Page 114
Recommendations
Acc
ou
nta
bili
ty
Stan
dar
ds/
Po
licy
Sch
oo
l Pla
ns
Trai
nin
g
Dat
a/Te
chn
olo
gy
Cro
ss-R
efer
ence
g. Collect and analyze data by school for students newly placed in general
educational settings by the various categories monitored by the state. Establish
school-based targets with follow-up using technical assistance/support.
x x 17
h. Document how PPSD will accomplish the above. x
Self-Contained and Private Settings
7. Reduce reliance on educating students with disabilities in self-contained and separate school settings; improve
performance of students remaining in these settings.
a. Collect and analyze data about students currently educated in self-contained and
separate school settings. x
b. Identify characteristics of students to plan for less restrictive settings. x c. Identify characteristics of students who could potentially attend their local area
school/school of choice, supports needed, barriers anticipated. Individualize
consideration through IEP process.
x x
d. Use a consultant for advice about educating more students with autism within
general education classes, gathering relevant data for consideration. x
e. For students with significant behavior challenges, implement improved
social/emotional supports at each school and address personnel issues impacting
the Behavior Intervention Program.
x x 13
f. Eliminate ―fundamental‖ courses. x 13
Instruction for English Language Learners with Disabilities
8. Identify and provide more flexible models to support the education of ELLs with
disabilities. Establish relevant board policy; include this policy in RTI and in key
information for inclusive education guidance. Integrate activities into school plans;
implement professional development. Make any data changes necessary in REG to
support different service models for ELL students. Consider how non ESL-certified
special/general educators and paraprofessionals can learn effective strategies.
x x x x x 5 & 6
Support for Postsecondary Transitional Activities and Services
9. Develop a districtwide, comprehensive, and coordinated vision for transition services; plan to implement this
vision using the National Secondary Transition Technical Assistance Center’s 16 evidence-based predictors of
post-school employment and independent living success. a. Ensure Birch Vocational Center operates consistently with research-based
practices. x x x x x
b. Expand community-based supportive work and employment. x x x x x c. Research the need and possibilities for expanding the Transition Academy. x x d. Ensure the electronic transition system is fully implemented. x x
Section D. Support for Teaching and Learning
Special Education Management and Operations

Review of Special Education in the Providence Public School District
Council of the Great City Schools Page 115
Recommendations
Acc
ou
nta
bili
ty
Stan
dar
ds/
Po
licy
Sch
oo
l Pla
ns
Trai
nin
g
Dat
a/Te
chn
olo
gy
Cro
ss-R
efer
ence
10. Reorganize special education office in light of recommendations specified in the
report. x x 11f
Staffing Patterns and Usage
11. Establish the following procedures and practices designed to enhance the expertise of personnel involved in
the instruction of students with disabilities:
a. With university collaboration and exemplary core content teachers, aggressively
provide professional development to special educators who do not have
necessary core curriculum knowledge and skills.
x
b. Review the proportion of personnel hired as special education teachers and
teacher assistants; review use of occupational therapists. x x
c. Establish criteria-based hiring practices for special educators and teacher
assistants; to extent possible, end practice of midyear job shifting. x
d. Ensure the appropriate and effective use of teacher assistants. x x e. Aggressively explore the use of substitutes for absent teacher assistants. x f. Expect Human Resources to engage in expanded recruitment, screening and
hiring in the area of special education and related services. x x
g. Explore use of ―virtual‖ speech/language therapy when need exceeds capacity. x h. Pursue more flexible work rules, including (1) collapsing childcare worker and
teacher assistant duties, (2) job descriptions that take into account changing
needs and (3) training bus monitors to use physical restraint.
x
i. Increase professional development opportunities for teacher assistants. x
Parent Support and Involvement
12. Reinforce PPSD’s actions to promote effective parental involvement with the education of their children with
disabilities by considering the following a. To support consistent attendance of grade-level principals and special educators
at LAC meetings, rotate volunteer principal/teacher involvement, with an
understanding that the responsible individual will arrange for a substitute if
unable to attend a meeting.
x
b. Share with the LAC leadership parental feedback that session groupings
relevant to grade levels would be useful.
c. Address ways to translate IEPs into Spanish and provide Spanish language
translators for IEP meetings upon request x
d. Recommend creation of an LAC subgroup to discuss possible ways to improve
parent/school communication, including sharing information about special
education requirements, identification of school-based contacts, etc.; and
consider one-page parent information sheets on different topics.
e. Investigate if it is possible to obtain from RIDE the district’s nonreported
Indictor 8 (parent satisfaction). If so, set in-district targets for improved
performance.
x 17
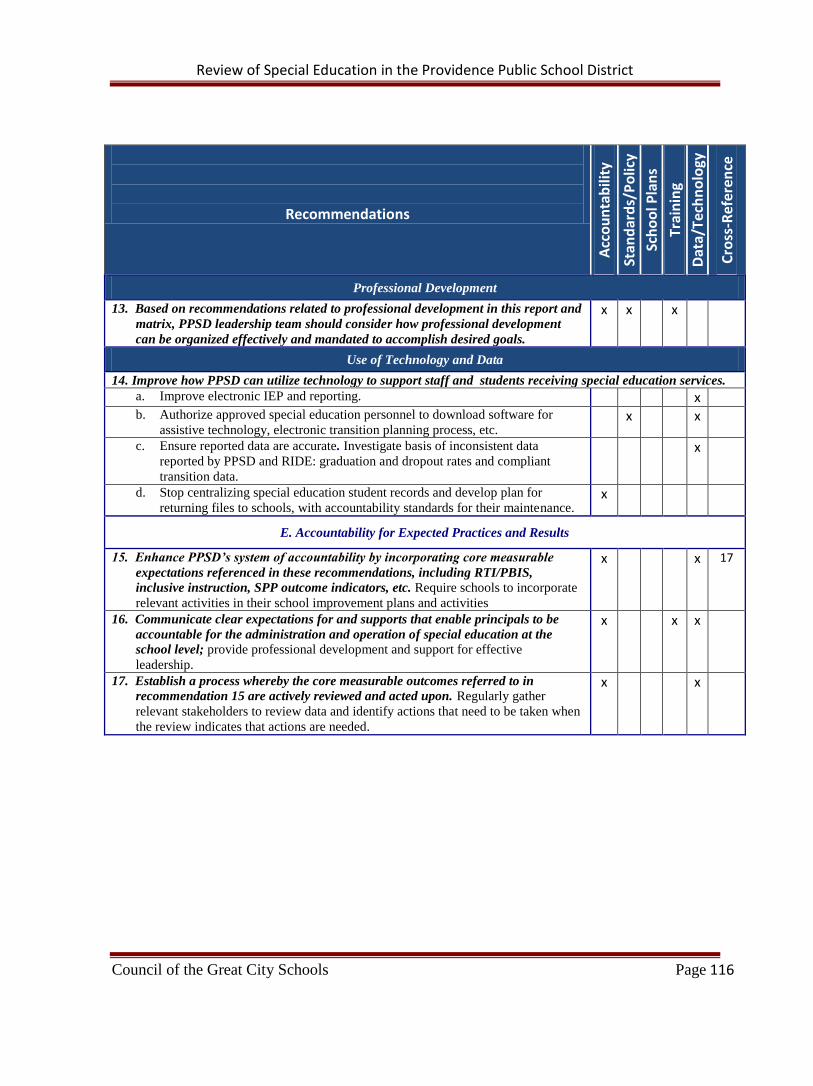
Review of Special Education in the Providence Public School District
Council of the Great City Schools Page 116
Recommendations
Acc
ou
nta
bili
ty
Stan
dar
ds/
Po
licy
Sch
oo
l Pla
ns
Trai
nin
g
Dat
a/Te
chn
olo
gy
Cro
ss-R
efer
ence
Professional Development
13. Based on recommendations related to professional development in this report and
matrix, PPSD leadership team should consider how professional development
can be organized effectively and mandated to accomplish desired goals.
x x x
Use of Technology and Data
14. Improve how PPSD can utilize technology to support staff and students receiving special education services. a. Improve electronic IEP and reporting. x b. Authorize approved special education personnel to download software for
assistive technology, electronic transition planning process, etc. x x
c. Ensure reported data are accurate. Investigate basis of inconsistent data
reported by PPSD and RIDE: graduation and dropout rates and compliant
transition data.
x
d. Stop centralizing special education student records and develop plan for
returning files to schools, with accountability standards for their maintenance. x
E. Accountability for Expected Practices and Results
15. Enhance PPSD’s system of accountability by incorporating core measurable
expectations referenced in these recommendations, including RTI/PBIS,
inclusive instruction, SPP outcome indicators, etc. Require schools to incorporate
relevant activities in their school improvement plans and activities
x x 17
16. Communicate clear expectations for and supports that enable principals to be
accountable for the administration and operation of special education at the
school level; provide professional development and support for effective
leadership.
x x x
17. Establish a process whereby the core measurable outcomes referred to in
recommendation 15 are actively reviewed and acted upon. Regularly gather
relevant stakeholders to review data and identify actions that need to be taken when
the review indicates that actions are needed.
x x

Review of Special Education in the Providence Public School District
Council of the Great City Schools Page 117
B. Summary of Recommendations
The following is a summary of the recommendations prepared by the Strategic Support
Team of the Council of the Great City Schools for the Providence Public School District.
Section A. Identification of Students Eligible to Receive Special Education
Services
Recommendations
1. Improve consistency and appropriateness of eligibility determinations across the district
and ensure staff members are held accountable for doing so.
a. Identify all disability areas in which it is much more likely (e.g., one standard
deviation) that a PPSD student will be found to have a disability than other students
in the nation. Consider working with the National Association of School Psychologists
or another credible group or consultant (1) to review the district’s current criteria for
all disability areas and (2) to ensure that they are sufficiently specific, measurable, and
operational to advise local assessment teams. As part of this process, review a sample
of recent evaluations that produced special education eligibility determinations in these
areas to (1) identify areas of concern that should be reflected in the criteria, (2) provide
professional development on any revised eligibility standards, and (3) promote
appropriate decision-making. (See Section C on RTI for additional recommendations
in this area.)
b. Improve the special education referral and screening process. Review accurate data
to identify any patterns in the referrals that (1) were determined not to be appropriate
for an evaluation and that (2) resulted in evaluations that did not produce an eligibility
determination. Review a variety of student files in both categories reflecting these
trends to identify any part of the referral and screening process that would benefit from
revision. Based on this review and any subsequent procedural revisions, provide
training to principals and relevant staff.
c. Use data to initiate improvement plans for the referral and evaluation process and
monitor outcomes. Produce accurate quarterly reports showing the number and
percentage of students (1) referred for a special education evaluation, (2) screened to
proceed to an evaluation, and (3) determined to be eligible for services, also with the
disability area. Disaggregate the data by school, race/ethnicity, and ELL. For any
school (with a sufficient number of students) where (1) fewer than 85 percent of
students who were evaluated were found eligible for services and/or (2) the disability
area rate is above a level of expectation established by the district, review the
evaluation data with the relevant school staff to determine how the school’s referral,
screening, and evaluation process could be improved. Based on this determination,
involve the principal in setting expectations for future actions and monitoring their

Review of Special Education in the Providence Public School District
Council of the Great City Schools Page 118
outcome. Disseminate data through the chief academic officer to relevant PPSD
administrators with responsibility for supporting school instruction and discuss how
various departments can reinforce and support the actions to be taken by the schools.
d. Improve the evaluation process for students who are ELL. With relevant
stakeholders, including the ELL director, research evidence-based practices for
identifying and evaluating students who are ELL with suspected special
education/related services needs to ensure that language acquisition issues are not
mistaken for a special education need or mask such a need. As part of this process,
consider the expertise that is available in schools and how it can be accessed to support
this process. Also, consider how schools lacking such expertise can be assisted to
support any ELL requiring additional support. Based on this information, initiate
professional development activities to disseminate relevant information.
e. Revise process for use of psychiatric evaluations. Establish a written protocol
regarding standards that may be applied on a case-by-case basis for recommending a
psychiatric evaluation to determine if a student has or continues to have an emotional
disturbance or autism. The protocol should be specific enough so that it produces a
change from current practice of utilizing a psychiatrist for every evaluation. Following
dissemination and training on the protocol, monitor its application for usage.
Section B. Student Performance
2. Increase the number of freshman-year students who are “on track” to graduate.
a. Identify students “not on track.” Initiate a strategy to identify and support all
freshman-year students who are ―not on track‖ to graduate, defining ―not on track‖ as
students entering high school two or more years below grade level.
b. Identify and support high schools with high dropout rates. Identify high schools with
dropout rates above the state’s dropout targets and require principals to collaborate
with stakeholder groups to develop targeted plans, based on research-based approaches
available through the National Dropout Prevention Center for Students with
Disabilities. In addition, identify feeder schools and involve principals and staff of
these schools to address identified issues proactively.
3. Reduce out-of-school suspensions for students with disabilities. Review data from
2009-10 and 20010-11 showing students with disabilities with five days or more of out-of-
school or in-school suspensions. Based on this information, join with stakeholders to
develop templates for plans (elementary, middle and high school) with research-based
interventions grounded in RTI/PBIS principles. Disseminate the data and templates to
relevant district administrators and principals, and require principals to integrate the results
into their overall school planning process. Report and disseminate the suspension data
every month to determine the extent to which school activities are having a positive effect

Review of Special Education in the Providence Public School District
Council of the Great City Schools Page 119
and follow-up as appropriate. Note that this activity would be relevant also for students
without disabilities.
4. Generate and distribute monthly reports on unexcused student absences by school for
all students, including those with disabilities, requiring schools to correct any data that
appear to be in error. Establish criteria for excessive absences (excused and unexcused)
that would require school-based staff to investigate the basis of the absence and provide
interventions, such as mentoring and community-based social service support.
Section C. Instructional Practices and Support
Response to Intervention
5. Develop and implement a comprehensive RTI framework that addresses at a
minimum reading, math, and positive student behavior, along with accountability for
results.
a. Establish general education leadership with expert support. To reinforce the notion
that the RTI process is based in general education practices (but could also be accessed
by students receiving special education and ELL support), establish a team of
stakeholders that is led by the chief academic officer. Similarly, expand the district’s
PBIS leadership team to include a diverse group of stakeholders, including the three
executive directors, principals, teachers, behavior coaches, etc., to discuss the various
tiers of PBIS, including addressing the social/emotional learning needs of students.
Ensure that the stakeholder and leadership groups meet periodically to ensure that the
processes are aligned and coordinated and that PBIS is seen as a function of the RTI
process.
b. Establish RTI/PBIS framework, policies, and procedures. To promote a common
language for implementing RTI and for professional development to support RTI,
develop a written framework, policies and procedures for both academics and positive
behavior.
c. Identify the core information that various staff persons need about RTI/PBIS, and
develop a comprehensive and differentiated professional development program. Use
multiple formats, cross-functional teams to support schools, and walk-through
protocols based on established standards to provide technical assistance, professional
development, coaching, and mentoring as necessary to improve practices.
d. Collect, analyze, report, and follow-up on student behavior-related data. Determine
how School-Wide Information System (SWIS) and any other data systems can be
modified to ensure access systemwide and are capable of yielding user-friendly reports
to relevant staff to facilitate analysis and follow-up action.
e. Identify demonstration schools and exemplary staff. Identify schools that have
implemented various aspects of the RTI framework for other schools to visit. Identify

Review of Special Education in the Providence Public School District
Council of the Great City Schools Page 120
staff members who reflect these standards and who could provide training to their
peers;
f. Monitor implementation and effectiveness. Modify walk through protocols and
checklists to reflect the core practices and monitor the extent to which school practices
conform to the guidance. For PBIS, incorporate Special Education Technology (SET)
standards and supplement them for RTI’s academic practices.
Instruction in General Education Classes with Supplementary Aids and Services
6. Establish a bold vision of PPSD as an inclusive school district that provides students
with disabilities with the supplementary aids and services they need to meet Rhode
Island’s Common Core Standards. Establish and implement a written vision, school
board policy, and framework to support PPSD’s transformation to a model district that
actively works toward providing a growing number of students with disabilities consistent
and beneficial access to instruction in general education classes for the majority of the day
with appropriate supports. Steps include the following:
a. Establish a visible and collaborative general education presence to lead the
implementation of a new board policy and initiative. Given the clear and convincing
evidence of the benefits of educating students with disabilities in the general education
setting, it is important that efforts to increase the percentage of students educated in
this setting become a systemwide priority and that the superintendent and chief
academic officer provide leadership behalf of this priority, with meaningful support
from special education and ELL.
b. Incorporate the academic and behavioral progress of students with disabilities and
the implementation of effective programs on their behalf into evaluations of
principals and senior instructional staff in the central office.
c. Design and implement the infrastructure needed to execute PPSD’s inclusive school
vision and policy; establish school-based plans for implementation. Based on the
issues summarized in this report and others known to stakeholders, develop measurable
research-based standards in specified areas.
d. Expand instruction in general education between 40 and 79 percent of the time for
students currently in more restrictive settings. Analyze the district’s low number of
students receiving instruction in general education between 40 and 79 percent of the
time, and determine how scheduling and staff support may have to change in order to
educate more students in this less restrictive setting who are currently in self-contained
classes. Based on this analysis, incorporate planning into the other components of
recommendation 6.
e. Build on the differentiated professional development for RTI/PBIS to impart the
knowledge necessary to implement PPSD’s framework and standards for inclusive

Review of Special Education in the Providence Public School District
Council of the Great City Schools Page 121
instruction. To support the district’s framework and process, identify core information
that various staff persons need and use specified strategies.
f. Establish a timely communication and feedback process to share resolutions to
implementation barriers. Several areas are likely to require a targeted group of
knowledgeable people to resolve implementation issues as they arise.
Use a school-based process for planning the framework’s implementation. Provide a
template that includes the core components necessary to support successful inclusive
practices: school-based planning, professional development, data gathering and review,
and support for implementation of the plan. Integrate the plan with the school-based RTI
planning described earlier and with school improvement plans.
g. Initiate school-based targets, monitoring and support. Collect and analyze data by
school on students newly placed in general educational settings by the various
categories monitored by the state. Establish targets for each school that would enable
the district as a whole to meet or exceed state performance targets, and distribute
reports showing school performance against these targets to district and school-based
administrators. Base personnel evaluations, in part, on progress on these targets.
h. Identify schools with general education classes having more than 30-40 percent
students with disabilities and analyze causes for the large percentages and explore
possible ways of decreasing the impact. For example, if the large percentage is due to
the clustering of students in special programs at a particular school, then the district
may want to reallocate those services so students could be supported in the school they
would have normally attended if not disabled.54
i. Document how PPSD will accomplish the above. Identify staff accountability, roles
and responsibilities, time frames, and demonstrable outcomes.
Self-Contained and Private Settings
7. Reduce reliance on educating students with disabilities in self-contained and separate
school settings; improve performance of students remaining in these settings.
a. Collect and analyze data about students currently educated in self-contained and
separate school settings, such as the school they would attend if not disabled; their
performance levels in reading, math, and behavior; and other information relevant to
54 See article that was sent to district staff under separate cover for additional information on this topic: Students
with Severe Disabilities and Best Practices, from Frattura, E. and Capper, C. (2007), Leading for Social Justices:
Transforming Schools for All Learners, Providing Access to High-Quality Teaching and Learning, Chapter 9:
Students Who Significantly Challenge Our Teaching.

Review of Special Education in the Providence Public School District
Council of the Great City Schools Page 122
the supports they would need if educated in general education classes for greater
periods of time. Investigate if the district’s data for separate schools includes students
from the separate Birch Vocational Center.
b. Identify characteristics of students in order to plan for less restrictive settings.
Identify the characteristics of students who could attend their local or school of choice
and the supports they would require to do so. Address current administrative barriers to
more inclusive instruction, such as ―full classes,‖ scheduling, etc., bringing issues to
the superintendent’s cabinet when necessary. Through the IEP process, consider
implementation on an individualized basis in midyear 2011-12 and/or September 2012.
c. Use a consultant for advice about educating more students with autism within
general education classes. Consider using a consultant who has significant experience
with the successful education of students with autism who are in general education for
a greater portion of the day and follow up on specific recommendations. To prepare for
such consultation, gather data on students’ attendance area schools, ages, school
grades, academic performance, social/emotional and language skills, equipment and
supply needs, etc.
d. For students with significant behavior challenges, implement improved
social/emotional supports at each school and address the personnel issues affecting
the Behavior Intervention Program. It is essential that more students be educated
successfully in general education classes in order for the district to have the capacity
to effectively support those with the most intensive needs. Identify any schools with
an unusually large number of students being referred to separate settings or separate
schools. In both circumstances, consider the strength of current PBIS efforts at tiers 2
and 3 and need for improvement. It is anticipated that recommendation 5 regarding
PBIS and social/emotional support will improve school capacity.
Improve the Behavior Intervention Program. Section D below addresses
personnel issues related to the provision of substitutes for paraprofessionals,
assignment of highly skilled special education teachers and paraprofessionals, and
administrative support. In addition, consider asking the district’s consultant, Dr.
Diana Browning Wright, to review the Behavior Intervention Program’s current
structure and make recommendations, including training for behavior coaches and
teachers to implement evidence-based behavioral strategies for tier 2 and 3
interventions.
Investigate private school interest in collaborating with the district to provide
supports to students in PPSD schools and, if there is sufficient interest, identify
and address any contractual barriers to such collaboration. The district should
aggressively pursue this course of action to support students with significant
social/emotional issues.

Review of Special Education in the Providence Public School District
Council of the Great City Schools Page 123
e. Eliminate “fundamental” courses. Review current courses and their descriptions to
ensure that students with disabilities who take the regular NECAP assessments are
not given separate ―fundamental‖ courses. These students should have access to core
curricular standards—with accommodations—if they are to have any chance of
improving performance on these assessments. Recommendations 5 and 6 provide
additional information for supporting students with disabilities taking classes aligned
with the core curriculum.
In addition to the personnel issues discussed above, section D addresses strategies for
increasing the number of special education teachers who are highly qualified and
knowledgeable in core curricular areas.
Instruction for English Language Learners with Disabilities
8. Identify and provide more flexible models to support the education of ELLs with
disabilities. Establish a working group with staff members from general education, ELL,
special education, gifted and talented, research and accountability, and schools to review
research-based practices on language acquisition and on providing language support to
students with disabilities (without a waiver) in a manner that would enable them to be
successfully educated in classes they would attend if not disabled. As part of this process,
consider how bilingual/ESL staff can be used to help improve the effectiveness of
monolingual staff to provide instruction and services to ELLs with disabilities, and share
information through professional development, technical assistance, co-teaching, etc. In
addition, consider how special and general education teachers who are not ESL-certified
and paraprofessionals can receive training on effective strategies to support or scaffold
student language development. Based on the results of this work, (1) establish relevant
board policy, (2) include relevant activities in school-based planning for RTI and inclusive
education guidance, and (3) implement professional development activities, revised walk
through protocol, etc. Also, consider any data changes necessary in REG to support
differing service models for ELL students.
Support for Postsecondary Transitional Activities and Services
9. Develop a districtwide, comprehensive, and coordinated vision for transition services;
plan to implement this vision. To provide a research-based system of transition services
and activities, review current activities to determine the extent to which they align with the
16 evidence-based predictors of post-school employment, and success in independent
living found in the correlational study published by the National Secondary Transition
Technical Assistance Center and the National Center for Workforce Development website.
a. Ensure the Birch Vocational Center operates consistently with research-based
practices. As part of the review above, and with the involvement of Birch parents and
staff, conduct a comprehensive analysis of the Birch Vocational Center to determine
the extent to which the program is aligned with accepted research sources. Also, obtain
information showing the school’s budget and per pupil cost. Based on the results,

Review of Special Education in the Providence Public School District
Council of the Great City Schools Page 124
prioritize any programmatic components that require change, and develop a cost-
neutral implementation plan that includes an aggressive time frame.
b. Expand community-based supportive work and employment. Develop a working
group of diverse stakeholders (including business, community, state agencies, special
education personnel, staff from high schools, and the Birch Vocational Center) to
review district practices in the area of community-based supported work and
employment, and establish measurable standards for school-based practices at every
high school. As part of this process, identify and address barriers, including improved
access to transportation for Project WORK, and steps to be taken that would enable
students to engage successfully in this activity. For example, engage and educate
students/parents about the benefits of work experiences and how any payment for work
may (or may not) impact federal benefits.
c. Research the need and possibilities for expanding the Transition Academy. Identify
how many students may benefit from enrollment in the Transition Academy. Assuming
the number is more than the current 14, share the information with partner agencies
and Johnson and Wales University to identify ways to meet this need.
d. Ensure Electronic Transition System Is Fully Implemented. Resolve outstanding
issues with implementing the new electronic data system and ensure that it is put into
place at all district schools.
Section D. Support for Teaching and Learning
Special Education Management and Operations
10. Reorganize the special education office in the following ways:55
a. Employ one director for special education and support services. Although focus group
participants provided positive comments about the two special education directors, the
district’s size does not justify having two different leaders for this area. Instead, one
voice in special education and support services will provide more consistency and
accountability and will eliminate previous overlapping responsibilities. The director
should have responsibility for the overall management and operation of special
education, providing leadership to managers and collaborating with PPSD education-
related administrators. (1 administrative assistant)
b. Establish manager positions to assist the director in the administration and operation
of the office. Instead of layering districtwide and grade-level programmatic
responsibilities on top of direct support to schools, consider establishing the following
manager positions:
55 It is anticipated that these changes would be budget neutral. Also, the recommendations are offered with
recognition that they represent details that would likely be modified based on further review and consideration.

Review of Special Education in the Providence Public School District
Council of the Great City Schools Page 125
Programmatic manager to provide leadership in the areas of behavior (including
PBIS, behavior coaches, behavior intervention programs), physical restraint
training, autism teams, and alternative assessments. (1 administrative assistant for
this and next three managers)
Clinical and other support manager to provide support for all related-service
personnel, assistive technology, vision/mobility, adapted physical education,
scheduling psychiatric evaluations, etc.
Data support manager to coordinate electronic IEP processes and develop on-
demand data reports.
Business operations manager to provide support on the budget, Medicaid billing,
taxi vouchers, private school billing, etc.
Elementary-level manager to (1) support teaching and learning’s direction for
RTI/PBIS and provide direction for inclusive educational services; (2) implement
program quality reviews; (3) coordinate extended school year and home
instruction; (4) support preschool and child find activities; (5) coordinate
professional development activities for elementary level schools; (6) liaise with the
Local Advisory Committee; (7) support human resource activities; and (8) attend
teaching and learning and grade level meetings. (1 administrative assistant for
manager and coordinators)
Secondary-level manager. Same as above but support transition activities (instead
of early childhood activities.) The current transition coordinator would report to
this manager. (1 administrative assistant for manager and coordinators)
Preschool manager to provide support for preschoolers with disabilities, including
curriculum development, teaching strategies, mandates from RIDE, child outreach
screening, working with the pre-k community, transition to kindergarten, early
intervention, and coordinating with the 24 pre-k classrooms and three pre-k teams.
Lead psychologists, social workers and speech/language pathologists. Investigate
the possibility of reducing the caseloads of the two leads in each area to support
their effectiveness. (1 administrative assistant)
Include under one or more of these managers the responsibility for developing the
procedures necessary for implementing federal and state compliance activities. As
discussed in recommendation 11, transfer to Human Resources the responsibility for
recruiting and screening teacher assistants.
c. Redefine the specialist position as a coordinator (or other title) to directly support
schools that are under the supervision of the elementary- or secondary-level
manager. Coordinators would directly support schools and teachers in all areas for

Review of Special Education in the Providence Public School District
Council of the Great City Schools Page 126
which the elementary- and secondary-level managers are responsible. In addition, the
coordinators would support the work of the other programmatic managers in their
respective schools. Assign five coordinators to elementary schools and four to middle
and high schools. The additional support at the elementary level would assist
coordinators in being the district’s representative at IEP meetings until individuals in
the elementary schools can be identified to carry out this function. In the meantime,
provide sufficient training to elementary school related-service personnel and special
educators to conduct these meetings pursuant to federal and state requirements.
d. Provide sufficient professional development for personnel to enable them to carry out
their responsibilities.
Staffing Patterns and Usage
11. Establish the following procedures and practices designed to enhance the expertise of
personnel involved in the instruction of students with disabilities:
a. With university collaboration and exemplary core content teachers, aggressively
provide professional development to special education teachers who do not have
necessary core curriculum knowledge and skills.
b. Review the proportion of personnel hired as a special education teachers and teacher
assistants; review use of occupational therapists. With a representative group of
principals, consider effective models for utilizing more special educators and fewer
teacher assistants in a budget neutral way. In addition, review the use of occupational
therapists and whether the ratios in place are necessary to meet the needs of students.
c. Establish criteria-based hiring practices for special educators and teacher assistants.
As soon as possible, implement criteria-based hiring for teachers and teacher
assistants. As part of this process, determine if there is any way to address the
seniority-based filling of positions without having to hire previously hired teachers
who are now without jobs. Also, take steps to end the practice of midyear job shifting,
given the negative impact this practice has on students, particularly those with
significant disabilities. In particular, establish hiring criteria for teachers and teacher
assistants working with students who have intensive needs (e.g., autism,
social/emotional, communication, hearing, vision, etc.).
d. Ensure the appropriate and effective use of teacher assistants. Issue a reminder to
principals that teacher assistants shall not be asked to leave instructional duties to
perform clerical or other nonrelated instructional activities, and investigate/follow up
on any noncompliance the practice might involve.
e. Aggressively explore the use of substitutes for absent teacher assistants. The use of
substitutes would require discussion with the union because the current requirement
indicates that once teacher assistants work 60 days they become a long-term substitute,
which entitles them to benefits.

Review of Special Education in the Providence Public School District
Council of the Great City Schools Page 127
f. Expect Human Resources to engage in expanded recruitment, screening, and hiring
in the area of special education and related services. Set expectations for Human
Resources to expand advertising for and recruitment individuals for teacher assistants
so there is a sufficiently large applicant pool to fill all positions at the beginning of the
year. Interview and screen individuals applying to become teacher assistants, and
increase support for recruiting and hiring special education teachers certified in core
content areas, and bilingual staff members with expertise working in challenging
behavior, speech/language pathology, and multiple languages.
g. Explore the use of “virtual” speech/language therapy when the need exceeds
capacity.
h. Pursue more flexible work rules, including:
Job descriptions that enable teacher assistants to fulfill various childcare worker
duties that do not require specific educational requirements, e.g., changing diapers
and that enable childcare workers to provide incidental supplementary instructional
support to students.
More flexible role descriptions that support changing needs, e.g., asking secretaries
to input SWIS behavior data on-line; expecting an ESL teacher’s duties include
supporting an ELL student in a class that is not designated as ―ESL‖ etc.
Enabling teacher assistants to serve as bus monitors and/or enabling bus monitors
to be trained to restrain a student as appropriate.
i. Increase professional development opportunities for teacher assistants. Collaborate
with the union to provide more training for teacher assistants, including comprehensive
initial training before the school year and again midyear for new hires as needed and
for assistants involved with students having significant needs. Training should include
strategies for supporting co-teaching and core PBIS principles and strategies.
Parental Support and Involvement
12. Reinforce PPSD’s efforts to promote effective parent involvement in the education of
their children with disabilities by considering the following:
a. To support consistent grade-level attendance at LAC meetings by principals and
special educators, rotate volunteer principal/teacher involvement, with an
understanding that the responsible individual will arrange for a substitute if unable
to attend a meeting. As part of this process, the superintendent and chief academic
officer would stress the importance of this activity and why their participation and
sharing of information is beneficial to parents and their children.

Review of Special Education in the Providence Public School District
Council of the Great City Schools Page 128
b. Share with the LAC leadership the feedback that sessions might be best grouped or
organized around relevant grade levels. While the meetings may continue to address
parents for all grade levels, it may be appropriate to divide some presentations and
discussion into specific preschool, elementary, middle, and high school components to
make them more relevant and attractive to parents and stakeholders.
c. Consider the benefits of possibly translating IEPs into Spanish and providing Spanish
language translators for IEP meetings upon request. Establish procedures for
notifying appropriate staff about meeting these requests.
d. Establish a LAC subgroup to discuss ways to improve communication between
parents and schools, including sharing information about special education
requirements, identification of school-based contacts, etc. Consider one-page parent
information sheets that could be available in schools and other convenient locations,
such as the ones recently developed by the Detroit Public Schools. See appendix D.
e. Investigate if it is possible to obtain from RIDE the district’s non-reported percentage
of parents with a child receiving special education services reporting the school
facilitated parental involvement as a means of improving services and results. Based
on the results, establish in-district target for improved performance.
Professional Development
13. Based on the recommendations on professional development included in this report,
have the PPSD leadership team consider how professional development could be
organized effectively and mandated to accomplish desired goals. As part of this
process, consider the district’s capacity and need for training using webinars, videos, and
assessments, as well as coaching and mentoring, to ensure that all required staff have
access to quality professional development, internalize information, and use what they
learn. Especially important is identifying ways that special educators can learn core
content information in a practical and user-friendly manner.
Use of Technology and Data
14. Improve how PPSD uses technology to support staff personnel and students receiving
special education services.
a. Improve electronic IEP reporting. Follow up on the district’s discussions with its
vendor about plans for migrating data between Easy IEP and REG and fully utilizing
the electronic IEP system, including useful data edits, compliance notices, and routine
and advance reporting. Discontinue the use of manual special education data entry into
REG. Making these changes should also improve the district’s ability to monitor IEP-
service documentation, and this should have a positive impact on Medicaid billing.

Review of Special Education in the Providence Public School District
Council of the Great City Schools Page 129
b. Authorize approved special education personnel to download software for assistive
technology, electronic transition planning process, etc.
c. Ensure that reported data are accurate. Investigate the basis of inconsistent data
reported by PPSD and RIDE in the areas discussed in this report: graduation and
dropout rates and compliant-transition data. If possible, identify ways to correct
inconsistent reporting in the future.
d. Stop the practice of centralizing special education student records at the special
education office. Aggressively develop procedures for the confidential maintenance of
student special education records at the student’s school, and for transferring these
records between schools upon student transfer. The process should align with the
process used for maintaining all student records in schools. Carry out this transfer of
the special education records back to the schools as quickly as possible, with
accountability measures for their maintenance.
Section E. Accountability for Expected Practices and Results
15. Enhance PPSD’s system of accountability by incorporating core measurable
expectations, including those for RTI/PBIS, inclusive instruction, outcome indicators
required by the SPP, etc. Establish, communicate, support, and monitor clear
expectations and ―non-negotiables,‖ establishing clear lines of accountability and
responsibility across departments, aligning them with the relevant guidance document.
Require schools to incorporate effective activities into their school improvement plans to
meet these expectations into their school improvement plans (e.g., walk-throughs and
professional development), and incorporate them into administrator, principal, teacher,
teacher assistant, and related-service personnel evaluations. Establish school-based targets
for meeting these expectations that would enable the district to meet or exceed all state
performance targets. Expect executive directors to review, monitor, and support activities
to meet targets with collaborative support from the special education office.
16. Communicate clear expectations for principal accountability for the administration
and operation of special education at the school level. Establish clear oral and written
communications to principals and their executive directors on principal accountability for
special education operations and administration. To support this process, provide
principals with the professional development and support they need (1) to provide
leadership for effectively educating students with disabilities in general education classes
with the provision of supplementary aids and services; (2) to ensure that students educated
in separate classes have access to the core curriculum and positive behavior supports; and
(3) to set up systems for appropriate eligibility determinations, IEPs and required services,
manifestation-determinations, etc. To this end, provide sufficient training to new executive
directors and principals either before or soon after they begin their tenure.
17. Establish a process whereby the core measurable outcomes referred to in

Review of Special Education in the Providence Public School District
Council of the Great City Schools Page 130
Recommendation 15 are actively reviewed and acted upon. Following the oft-quoted
saying, what gets measured gets done, regularly gather relevant stakeholders to review
data and identify actions that need to be taken when the review indicate necessary follow-
up action. Stakeholders would include relevant executive directors and principals,
special/general education, and other relevant administrators. Such meetings should rotate
reviews on such data elements for students with and without IEPs as (1) graduation rates
(at beginning of year), (2) dropout rates (periodically when data are available), (3) credits
earned and failure and ―D‖ grading rates, (4) unexcused absences, (5) suspensions (in-
school and out-of-school, by race/ethnicity) and office referrals, (6) use of PBIS and RTI,
(7) referrals for special education evaluations and the percentage of students found eligible
by disability area, (8) and SPP performance indicators. The Baltimore City Public Schools
have been using this process successfully and, as a result, principal accountability in this
area has become a reality.

Review of Special Education in the Providence Public School District
Council of the Great City Schools Page 131
CHAPTER 5. SYNOPSIS AND DISCUSSION
The Providence Public School District (PPSD) has made important strides over the last
several years, including efforts by the school board and administration to overhaul and update
the school system’s instructional programs. This work has laid an important foundation for
future student achievement gains and has set the stage for next steps in modernizing
instruction for students with disabilities and English language learners, the subject of a parallel
report by the Council of the Great City Schools.
This report was prepared by the Council at the request of the school board and the
former superintendent, Tom Brady, as the district was beginning to turn its attention to how its
new instructional system would work with special education and bilingual students. As it turns
out, the city school district’s leadership was right to ask for assistance, because the situation
that the Council of the Great City Schools and its Strategic Support Teams found warranted
substantial reform.
The PPSD has a higher special education identification rate than the nation (but
slightly lower than the state) and identifies students as learning disabled and emotionally
disturbed at higher rates than the nation. White, African American, and Native American
students are all more likely to be identified as disabled in Providence than their same-race
peers nationwide. And English language learners are more likely to be identified as needing
speech/language services or as developmentally delayed. In addition, PPSD’s referral rates
have been increasing, and the district has lower-than- expected eligibility-determination rates,
raising questions about the number of unnecessary evaluations and the extent to which school-
based teams appropriately screen referred students to determine the basis for suspecting a
disability. The district also appears to over-use psychiatric evaluations for students believed to
have autism or emotional disturbances.
Most importantly, the achievement levels of students with disabilities are well below
state performance targets and the overall academic attainment of special education students
has not been improving. It is also clear from the Council’s review that the district lacks
sufficient capacity to differentiate language acquisition issues from disabilities among English
language learners. In addition, PPSD lacks a fully developed academic or behavioral
Response-to-Intervention (RTI) system. It does not have consistent monitoring of practice, it
has weak data systems and poorly integrated technology, and it lacks a uniformly applied
transition framework.
The school district also fails to include students with disabilities in general education
classes at target rates, and it educates a higher percentage of its special education students in
separate schools or classrooms than should be expected. Moreover, the district lacks a
sufficient number of content-certified special education teachers, deploys an overly generous

Review of Special Education in the Providence Public School District
Council of the Great City Schools Page 132
number of teacher assistants, and has an administrational arrangement that is not well
organized.
Rounding out these challenges is the fact that no one in the district is really held
accountable for the well being or the achievement of students with disabilities.
However, the Providence Public School District does have a number of substantial
assets in its special education program upon which it can build, however. For instance, people
across the district whom the Council’s team interviewed made positive comments about many
of the central office staff members, for their helpfulness in managing the evaluation process.
Moreover, the district has seen a slight decline in its overall identification rates, in part,
because of responsiveness by some staff members to the academic and behavioral needs of
students with disabilities who are in the general education program. In addition, the district has
seen some decline in its disproportionality rates and the state has indicated that the rates do not
appear to be the result of inappropriate practice. Also, the district generally conducts timely
initial evaluations and has provided extensive professional development to evaluation teams.
Students with disabilities also score reasonably well on the state’s alternative
assessments, and PPSD is not far off the state’s targets for graduating students with a regular
diploma after four years. Dropout rates among students with disabilities have also seen some
decline over the last several years. Finally, the district has put into place a more standardized
curriculum and instructional program that is bound to produce higher student achievement
over the long run.
Still, the school district has considerable work to do in order to have a better
functioning special education program. The Council of the Great City Schools and its Strategic
Support Team have made a number of recommendations to improve programming for students
with disabilities over time. Some of these proposals involve—
1. improving the consistency of eligibility determinations across the district
2. strengthening the special education referral and screening process;
3. revising the use of psychiatric evaluations;
4. improving the evaluation process for English language learners;
5. using data to better identify students with disabilities who are not on track for
graduation;
6. reducing out-of-school suspensions and unexcused absences;
7. implementing a comprehensive Response-to-Intervention (RTI) system for reading,
math, and behavior;
8. strengthening differentiated professional development around an RTI model;
9. moving toward greater inclusion of students with disabilities into general education
classes and regular schools;
10. reducing the numbers of students in self-contained classes and separate schools;

Review of Special Education in the Providence Public School District
Council of the Great City Schools Page 133
11. boosting the accountability systems for staff members on the academic and
behavioral progress of students with disabilities;
12. providing a more uniform and consistent transitional program for students leaving
high school;
13. linking technology and data systems more convincingly; and
14. reorganizing central office staff in a more effective manner, among other
recommendations.
In general, the special education program in the Providence Public School District has
considerable work to do if it expects to adequately meet the academic, behavioral, and social
needs of its students with disabilities. However, with greater leadership, focus, and planning,
there is little reason that the district cannot meet that goal. The Council and its other city
school systems participating in this review stand ready to assist the district toward that end,
and the organization remains confident that the Providence school system will rise to the
occasion on behalf of its students with disabilities.

Review of Special Education in the Providence Public School District
Council of the Great City Schools Page 134
APPENDIX A. VALID AND RELIABLE ASSESSMENTS FOR PRESCHOOL ENGLISH
LANGUAGE LEARNERS
Concerns about valid and reliable assessments for three- and four-year-olds are exacerbated
for English Language Learners (ELL) at that early age. When selecting an assessment, one
must be clear about the purpose of the assessment: (1) to set a benchmark for current English
and Spanish performance or (2) to determine the possible need for special education services.
Various experts provided feedback to the Council’s team about valid and reliable assessments
for each purpose:56
Three assessments (Stanford Spanish Language Proficiency Test, Language
Assessment Scales, and IDEA Language Proficiency Test) allow for assessments
across languages using the same measure, i.e., Spanish and English, providing a
determination of a student’s relative proficiency and dominance in these two
languages. Such assessments are useful for young children who are developing
language in both English and Spanish.
The Preschool Language Scale (fourth edition in Spanish, 2002) and the new
Comprehensive Evaluation of Language Function (CELF) for preschoolers (second
edition in Spanish, 2009) are well-regarded assessments used to assess language
skills of young Spanish-speaking children. Speech/language pathologists use the
CELF to help differentiate between speech/language impairments and
developmental stages of acquiring a second language.
To the extent these assessments provide information about language proficiency and
dominance, they contribute to knowledge about a child’s preferred language. Additional
assessments can expand understanding about the child’s language acquisition to help
determine the provision of services (to the extent there is an option to provide them in the
child’s native language). Also, the tools provide important information for making decisions
about whether a student’s academic deficiencies or poor performance may be due to second
language acquisition or to a disability.
All experts caution against relying on a single measure for such decision making. Particularly
56 The above guidance was provided to the Council of Great City Schools’ Strategic Support Team by Claudia
Rinaldi, Ph.D., senior training and technical assistance associate, Urban Special Education Leadership
Collaborative. Leadership and Learning Innovation, Education Development Center, and
Sylvia Linan-Thompson, associate professor and fellow UT, Austin, Learning Disabilities, Department of
Special Education, College of Education at The University of Texas at Austin.

Review of Special Education in the Providence Public School District
Council of the Great City Schools Page 135
when using assessment results for evaluating ELLs, staff must be cognizant that a score
might indicate a ―lack of exposure‖ to language as opposed to a particular disorder in
language development. It is not uncommon that ELL and immigrant families (as well as
families living in poverty) lack exposure to language due to such factors as hectic work
schedules, culturally determined interactions between child and parent, or low levels of
literacy of adults in the home. The results from any of the mentioned assessment tools are
best interpreted along with a comprehensive socio-contextual history of the child to help
interpret his/her literacy and language development in first and second languages.57
57 Tania N. Thomas-Presswood, Ph.D., associate professor of psychology, Gallaudet University. Specialty areas
are cognitive, educational and neuropsychological assessment of children, including those who are deaf and hard
of hearing; cultural and linguistic diversity; and economically disadvantaged children and families.

Review of Special Education in the Providence Public School District
Council of the Great City Schools Page 136
APPENDIX B. EVIDENCE-BASED PREDICTORS OF POST-SCHOOL EMPLOYMENT,
EDUCATION, AND INDEPENDENT LIVING SUCCESS 58
Predictors/Outcomes Education Employment Independent
Living
Career Awareness X x
Community Experiences X
Exit Exam Requirements/High School Diploma Status X
Inclusion in General Education X X X
Interagency Collaboration X X
Occupational Courses X X
Paid Employment/Work Experiences X X X
Parental Involvement X
Program of Study X
Self-Advocacy/Self Determination X X
Self-Care and Independent Living X X X
Social Skills X X
Student Support X X x
Transition Program X X
Vocational Education X X
Work Study X
58 National Secondary Transition Technical Assistance Center (2010). Evidence-Based Practices and Predicators
in Secondary Transition: What We Know and What We Still Need to Know, Charlotte, NC, NSTTAC at
http://www.nsttac.org/ebp/ExecsummaryPPs.pdf

Review of Special Education in the Providence Public School District
Council of the Great City Schools Page 137
APPENDIX C. STAFFING RATIOS
Students with Disabilities (SwD) Incidence Rates and Special Educators Staffing, April 2011
Tota
l E
nro
llme
nt SwD Incidence Sp Educator Para-educator Speech/Lang Psychologist
% S
wD
SwD
En
r
Nu
mb
er Ratio To:
Nu
mb
er Ratio To:
Nu
mb
er Ratio To:
Nu
mb
er Ratio To:
Sw
D
Enr
Sw
D
Enr
Sw
D
Enr
Sw
D
Enr
Agawam Public Schools 4,347 15% 656 39 17 112 100 7 44 15 44 290 3 219 1449
Atlanta Public Schools 43,443 11% 4,950 431 11 101 224 22 194 65 76 688 22 225 1975
Austin Pub S D 84676 10% 8,062 772.5 10.4 110 824 9.7 103 70.5 114 1201 34.6 233 2447 Baltimore City Publ Sch 82,824 16% 12,866 1,121 12 74 620 21 134 92 140 901 12 NA NA
Boston Public Schools 54,966 21% 11,534 1200 10 47 800 14 70 147 78 383 48 240 1173
Cambridge Publ Schools 6,000 20% 1,200 176 7 35 103 12 59 20 60 300 22 55 273
Carpentersville 19,844 15.8% 3,139 227 13.8 87 380 8.3 52 43 73 461 28 112 708
Chicago Pub Sch 419,272 13% 52,409 3,753 14 112 2,905 18 145 392 134 1072 235 223 1788
Clark Cty School Dist 309,476 10% 32,167 2,247 15 138 1,346 24 230 299 108 1036 180 179 1720
Cleve Hts-Univ Hts Cty 6,000 18% 1,100 83 14 73 58 19 104 7 158 858 8 NA NA
D.C. Public Schools 48,991 18% 8,603 669 13 74 653 14 76 90 96 545 78 111 629
Davenport 15,302 12% 1,857 188 10 82 287 7 54 NA NA NA NA NA NA
Deer Valley Unified SD 36,086 9% 3,289 190 18 190 229 15 158 49 68 737 108 31 335 Denver Public Schools 78,352 12% 9,142 592 16 133 528 18 149 94 98 834 98 94 800 ESD 112 13,764 14% 1,987 55 37 251 158 13 88 20 100 689 12 166 1147
Elgin U-46, IL 40,531 14% 5,658 273 21 148 277 20 146 72 78.6 563 20 283 2027 Everett Public Schools 6,100 17% 1,049 74 15 83 51 21 178 4 263 1525 5 210 1220 Fort Worth 79,885 8% 6,144 520 12 154 450 14 178 73 85 1095 31 199 2577
Houston Indepen SD 200,568 9% 17,489 1,625 11 124 1,145 16 176 158 111 1270 NA NA NA
Kalamazoo Pub Schools 12,100 14% 1,667 70 24 173 79 22 154 15 112 807 NA NA NA Kyrene School District 17,910 9% 1,544 141 11 128 124 13 145 27 58 664 14 111 1280 Lakota Local 18,500 10% 1,800 126 15 147 120 15 155 39 47 475 18 100 1021 LAUSD 632,881 13% 82,326 4,470 19 142 8,470 10 75 379 218 1670 599 138 1057 Lincoln 1,060 12% 128 21 7 51 21 7 51 5 26 212 2 64 530
Marlborough Public Sch 4,835 25% 1,198 141 9 35 115 11 43 7 172 691 4 300 1209
Memphis City 110,863 15% 16,637 912 19 122 655 26 170 53 314 2092 58 287 1912 Miami-Dade 376,264 11% 40,012 2,500 17 151 1,226 33 307 209 192 1801 206 195 1827 Montgomery Cty Sch 146,812 12% 17,226 1,588 11 93 1,398 13 106 293 59 502 97 178 1514 Naperville IL 203 11% 1978 150 13 120 237 8 76 33 59 549 22 90 824 New Bedford 12,692 21% 2,655 204 14 63 205 13 62 26 103 489 9 295 1411
Oak Park Sch Dist 97 5,400 16% 875 78 12 70 90 10 60 14 63 386 8 110 675
Pittsburgh Pub Schools 28,000 18% 5,096 359 14 78 252 20 110 40 127 700 16 319 1749 Portland Public Schools 46,596 14% 6,513 355 19 132 535 13 88 92 71 507 56 117 833 Providence 23,695 18.8% 4460 340 13 70 339 13 70 40 111 592 28 159 846 Rockford IL Pub S 28,973 14% 4,065 336 12 86 334 12 87 49 83 591 24 169 1207 Round Rock 43,000 8% 3,313 369 9 117 171 20 252 41 81 1049 29 115 1483
San Diego Unified SD 132,500 12% 16,300 1,100 15 121 1,300 13 102 196 84 677 129 NA NA Saugus, MA 3,012 15% 462 28 17 108 29 16 104 6 77 502 NA NA NA
Sch Dist of Philadelphia 168,181 20% 33,686 1,535 22 110 610 56 276 99 341 1699 100 337 1682
Sun Prairie Area S Dist 6,656 10% 697 62 12 108 93 8 72 14 50 476 7 100 951
Tucson Unified SD 56,000 14% 8,092 409 20 137 419 20 134 61 133 919 54 150 1038 Washoe County Sc Dist 63,310 14% 8,551 472 19 135 325 27 195 77 112 823 37 232 1712 Williamson Cty Schl 31,292 9% 2,824 213 13 147 400 7 78 34 121 911 23 178 1346 Worcester 24,825 21% 5,172 254 21 98 366 15 68 38 137 654 NA NA NA
Averages 12.7 15 116 16 122 125 986 181 1427

Review of Special Education in the Providence Public School District
Council of the Great City Schools Page 138
Ratios for Social Workers, Nurses, and OTs and PTs to Students with Disabilities (SwD)
and Total Student Enrollment, Staffing Survey of Urban School Districts, April 2011
Ratios for Social Workers, Nurses, OTs and PTs
Tota
l Stu
de
nt
Enro
llme
nt
Tota
l Sw
D Social Worker Nurse OT PT
Nu
mb
er Ratio To:
Nu
mb
er Ratio To:
Nu
mb
er Ratio
Nu
mb
er Ratio
Sw
D
Enr
Sw
D
Enr
Sw
D
Sw
D
Agawam Pub Schools 4,347 656 0 NA NA 8 82 544 3 219 3 219 Atlanta Public Schools 43,443 4,950 30 165 1448 58 85 511 12 413 3 1650
Austin Pub S D 84,676 8,062 21 384 4032 68 119 1245 19 424 13 620 Baltimore City Public 82,824 12,866 193 67 430 78 165 1062 20 644 5 2574 Boston Public Schools 54,966 11534 6 NA NA 100 115 563 67 172 17 680 Cambridge Pub School 6,000 1,200 16 75 375 0 NA NA 16 75 7 172 Carpentersville 19,844 3,139 36.5 86 544 27.5 114 722 22 142 6 523 Chicago Pub School 419,272 52,409 358 119 1174 336 156 1250 106 494 37 1416 Clark Cty School Dist 309,476 32,167 26 NA NA 173 186 1789 68 474 29 1100 Cleve Hts-Univ Hts Cty 6,000 1,100 7 158 858 5 220 1200 2 550 1 1100 D.C. Public Schools 48,991 8,603 90 96 545 127 68 386 48 180 16 538 Davenport Comm Sch 15,302 1,857 NA NA NA 7 266 2186 NA NA NA NA Deer Valley Unified SD 36,086 3,289 0 NA NA 37 89 976 19 174 4 823
Denver Public Schools 78,352 9,142 74 124 1059 77 119 1018 25 366 12 762
Elgin U-46, IL 40,531 5,658 50 113 810 76 74 533 22 257 4 1414
ESD 112 13,764 1,987 0 NA NA 5 398 2753 6 332 3 663
Everett Public Schools 6,100 1,049 2 525 3050 11 96 555 2 525 3 350
Fort Worth 79,885 6,144 2 NA NA 106 58 754 16 384 10 615
Houston Indepen SD 200,568 17,489 26 673 7715 25 700 8020 17 1029 8 2187
Kalamazoo Pub 12,100 1,667 5 334 2420 2 834 6050 4 417 3 556
Kyrene School District 17,910 1,544 0 NA NA 4 386 4478 2 772 2 772
Lakota Local 18,500 1,800 6 300 3084 14 129 1322 8 225 2 900 LAUSD 632,881 82,326 275 300 2302 575 144 1101 159 518 28 2941 Lincoln 1,060 128 5 26 212 2 64 530 2 64 1 128 Marlborough Public 4,835 1,198 9 134 538 10 120 484 4 300 2 599
Memphis City 110,863 16,637 55 303 2016 68 245 1641 11 1513 9 1849
Miami-Dade 376,264 40,012 35 NA NA 206 195 1827 65 616 23 1740 Montgomery Cty Sch 146,812 17,226 14 NA NA NA NA NA 112 154 61 283 Naperville, IL 203 1978 27 73 671 29 68 625 4 494 3 659 New Bedford 12,692 2,655 67 40 190 30 89 424 11 242 3 885 Oak Park Sch Dist 97 5,400 875 12 73 450 8 110 675 7 1125 1 875
Pittsburgh Pub Sch 28,000 5,096 NA NA NA NA NA NA NA NA NA NA
Portland Pub Schools 46,596 6,513 10 652 4660 0 NA NA 20 326 9 724
Providence 23,695 4460 35 127 677 0 NA NA 11.5 388 4.5 991
Rockford IL Pub S 28,973 4,065 26 135 1114 32 127 905 12.5 325 4.5 903
Round Rock 43,000 3,313 0 NA NA 1 NA NA 10 332 3 1105
San Diego Unified SD 132,500 16,300 3 NA NA 129 127 1028 40 408 10 1630 Saugus, MA 3,012 462 4 116 753 5 93 603 2 231 1 462
S Dist of Philadelphia 168,181 33,686 31 NA NA 280 121 601 20 1685 20 1685
Sun Prairie Area S Dist 6,656 697 8 88 832 1 NA NA 5 140 2 349 Tucson Unified SD 56,000 8,092 26 312 2154 53 153 1057 10 810 4 2023 Washoe Cty Sc Dist 63,310 8,551 0 NA NA 35 248 1836 12 713 7 1222
Williamson Cty Schl 30,942 4,093 4 1024 7736 37 111 837 22 187 5 819
Worcester 24,825 5,172 0 NA NA 0 NA NA 12 431 5 1035
Averages 283 2224 158 1246 427 1144

Review of Special Education in the Providence Public School District
Council of the Great City Schools Page 139
Incidence Rates and Students with Disabilities to Staff Ratio in Ascending Order
Rank % SwD Sp. Ed.
Teachers Para-
educator Speech Psych Social Work Nurses OT PT
1 8% 7 7 26 31 26 58 64 128
2 8% 7 7 44 55 40 64 75 172
3 9% 9 7 47 64 67 68 140 219
4 9% 9 8 50 90 73 74 142 283
5 9% 10 8 58 94 73 82 154 349
6 10% 10 8.3 59 100 75 68 172 350
7 10% 10.4 9.7 59 100 86 85 174 462
8 10% 11 10 60 110 88 89 180 523
9 10% 11 10 63 111 96 89 187 538
10 11% 11 11 68 111 113 93 219 556
11 11% 11 11 71 112 116 96 225 599
12 11% 12 12 73 115 119 110 231 615
13 12% 12 12 76 117 124 111 242 620
14 12% 12 13 77 138 127 114 257 659
15 12% 12 13 78 150 135 115 300 663
16 12% 12 13 79 159 134 119 325 680
17 12% 13 13 81 166 158 119 326 724
18 13% 13 13 83 169 165 120 332 762
19 13% 13 13 84 178 300 121 332 772
20 13% 13.8 13 85 178 300 127 366 819
21 14% 14 14 96 179 303 127 384 823
22 14% 14 14 98 195 312 129 388 875
23 14% 14 14 100 199 334 144 408 885
24 14% 14 15 103 210 384 153 413 900
25 14% 15 15 111 219 525 156 417 903
26 14% 15 15 108 223 652 165 424 991
27 14% 15 16 111 225 673 186 431 1035
28 15% 15 16 112 232 1024 195 474 1100
29 15% 16 18 112 233 NA 220 494 1100
30 15% 17 18 114 240 NA 245 494 1105
31 15.8% 17 19 121 283 NA 248 518 1222
32 16% 17 20 127 287 NA 266 525 1414
33 16% 18 20 133 295 NA 386 550 1416
34 17% 19 20 134 300 NA 398 616 1630
35 18% 19 20 137 319 NA 700 644 1650
36 18% 19 21 140 337 NA 834 713 1685
37 18% 19 21 158 NA NA NA 772 1740
38 18.8% 19 22 172 NA NA NA 810 1849
39 20% 20 22 192 NA NA NA 1029 2023
40 20% 21 24 218 NA NA NA 1125 2187

Review of Special Education in the Providence Public School District
Council of the Great City Schools Page 140
41 21% 21 26 263 NA NA NA 1513 2574
42 21% 22 27 314 NA NA NA 1685 2941
43 21% 24 33 341 NA NA NA NA NA
44 25% 37 56 NA NA NA NA NA NA
Average 12.7% 15 16 125 181 283 158 427 1141

Review of Special Education in the Providence Public School District
Council of the Great City Schools Page 141
APPENDIX D. DETROIT PUBLIC SCHOOLS INFORMATIONAL LEAFLET

Review of Special Education in the Providence Public School District
Council of the Great City Schools Page 142

Review of Special Education in the Providence Public School District
Council of the Great City Schools Page 143
APPENDIX E. DOCUMENTS AND DATA REVIEWED
Disability Rates over Time
Disability Rates by Grade Level Over Time
Current Percentage of Students with Disabilities (SwD) of Total Enrollment by Disability
Areas and Percentage of All SwD of the Total Enrollment
District Public School and Clinical Program Students ages 6-21
Private Parochial Schools Serving SwD ages 6-21
Service Plan Students
Public School and Clinical Students with Limited English Proficiency (LEP) Status 2010-
11
Public School and Clinical Students with FRP Status 2010-11
Public School and Clinical Students by Race 2010-11
2010 School Classification Multiyear Analysis Report
NECAP Reading and Math Proficiency Levels
Rhode Island School and District Accountability System, Technical Bulletin, March 2011
Evaluation and Referral Data over Time
Discussion of Initiatives to Ensure Appropriate Referrals
Referral for an Evaluation to Determine Eligibility For Special Education
a. Eligibility and Evaluation
b. Review of Existing Data
c. Parental Consent, Refusal of Consent, or Revoking of Consent
d. Eligibility Report
e. Eligibility Criteria at a Glance
Rhode Island Criteria and Guidance for the Identification of Specific Learning Disabilities
Graduation Rates
Dropout Rates
Attendance Rates
Staffing Data
RTI/PBIS Progress Monitoring, Including Elementary and Secondary Multi-Tiered Model
Teacher Support Teams Forms and Procedures
Overview of Behavior RTI
Suspensions/Dismissals/Expulsions Data
LRE Data by Disability, Race, Grade
Description of Data Reports, Including Evaluation Log, Referral Counts
Indicator 11 Report
Out-of-Compliance Report
District’s Vision, Mission, Goals, and Priorities
Memorandum of NECAP Reading and Math Results, Office of Special Education and the
Office of Research, Planning and Accountability

Review of Special Education in the Providence Public School District
Council of the Great City Schools Page 144
Beliefs and Commitments of the Providence School Board
Providence School District Corrective Action Plan, 2009-10 and 2010-11 Academic Years
Instruction, Strategic Direction Policy
Principal Performance Metrics
Educator Evaluation System Standards
Teacher Evaluation Handbook
Providence School Choice Policy and Procedures
Description of Efforts to implement Positive Behavior Supports
Special Education Administration and Job Descriptions, including Organization Charts
Methods to Ensure SwD are Provided High Quality Instruction
Continuum of Services and Related Services
Disproportionality Update/Emotionally Disturbed Procedures
Update from RIDE on Disproportionality Data, February 15, 2008
Fiscal Data Impacting Special Education and Related Services
Services to Non-Public Schools/Proportionate Share
Research-Based Services to Students with Autism
State Performance Plan Indicators
Letter from RIDE dated September 9, 2010 on SPP and Action Plan from PPSD from
October 8, 2010
SPP Quarterly Reports for School Year 10-11
RIDE Letters on SPP, February and March 2011
Providence School Department Plan--Disproportionality
Overview of Professional Development for the Office of Special Education, including
Agendas of PD and Middle School Professional Development Guide
Public Consulting Group Evaluation of the Providence Special Education Program, Phase
1 Evaluation Findings, October 2006
Referral and Eligibility Procedures
Overview of Projects Carried out with ARRA Funds
Sample IEPs
Sample Psychological Evaluations and Eligibility Reports

Review of Special Education in the Providence Public School District
Council of the Great City Schools Page 145
APPENDIX F. TEAM AGENDA AND INDIVIDUALS INTERVIEWED
Tuesday, April 12, 2011
Team Dinner
Time Name Position
5:45-8:00 Superintendent
Brady
Superintendent
Paula Shannon Executive Director of Curriculum Development and
Implementation
Karen Vessella Secondary Director of Special Education
Lisa Vargas-Sinapi Elementary Director of Special Education
Wednesday, April 13, 2011
Time Name Position
8:00-9:00 Lisa Vargas-Sinapi Director of Elementary Special Education
Karen Vessella Director of Secondary Special Education
9:00-10:00 Mary Cullen Secondary Special Education Supervisor
Gail DeRoy Secondary Special Education Supervisor
10:00-11:00 Nkoli Onye Executive Director of High Schools
Gary Moroch Executive Director of Elementary Schools
Marc Catone Executive Director of Middle Schools
11:00-12:15 Ginger Olivelli Elementary General Education Teacher-Grade K ESL
at Veazie
Lauren Hall Elementary General Education Teacher-Grade 1
Inclusion at Carnevale
Carolyn Richardson General Education Teacher-Grade 1 at GJ West
Silvana Larame Bilingual Inclusion General Education Teacher
Lillian Turnipseed Secondary General Education Teacher
Galo Reyes Secondary General Education Teacher
Arianna Testa Secondary General Education Teacher
Mark Manzo Secondary General Education Teacher
12:15-12:45 Working Lunch
12:15-12:45 Marco Andrade Director of Research Planning and Development
Emily Klein RIDE
1:45-2:45 Sheila Gryzch Special Education Teacher-Autism S/C at Carnevale
Jen Tsonos BIP Program at Carl Lauro

Review of Special Education in the Providence Public School District
Council of the Great City Schools Page 146
Julie Arruda Spec Ed Teacher/Co-Teach Flynn
Emily Hayes Pre-K MLK Integrated Preschool
Gloria Simoneau Exceptional Children Services (Severe Disabilities)
Kathleen Severian Bilingual Pre-K Integrated
Donna Hanley Bilingual Inclusion Teacher Fortes Elementary
Ana Feenstra Elementary Special Education Specialist (Bilingual)
Andrew Milligan Secondary Special Education Teacher Inclusion
Dot Kurbiec Secondary Special Education Specialist
Diane Fagan Secondary Special Education Teacher Inclusion
Joana Santos Co-Teacher Bilingual
Cynthia Robles Secondary Special Education Teacher/Teacher
Leader
2:45-3:00 Break
3:00-4:00 Sharon Contreras (Was not able to join us so the special education
teachers listed above stayed longer)
4:00- 4:45 Andrew Henneous Special Education Attorney (declined)
June Daniels School Board Attorney
Maryann Carole Special Education Attorney/works with Andrew
Henneous (declined)
4:45-5:30 Mindy Mertz Pre-K Special Education Supervisor/Assistive
Technology
Kathy Mastrobuono Elementary Sp Ed Supervisor K-6
Dawn Pelino Elementary Special Education Supervisor K-6
Susan Hartson Elementary Special Education Supervisor K-6 and
Parent Liaison
5:45-8:00
(Dinner)
Paula Shannon Executive Director of Curriculum Development and
Implementation
Thursday, April 14, 2011
Time Name Position
8:00-9:30 Gail Mastropietro Lead Psychologist/PBIS
Clea Poirier Lead Psychologist/PBIS
Jim Breen Lead Social Worker
Barbara Witbeck Lead Social Worker
Gail Robinson Lead Speech/Language Pathologist
Suzanne Maher Lead Speech/Language Pathologist
Shelli Roach Bilingual Speech Therapist
Wally VanDyck Supervising Occupational Therapist
Jackie Estrella Occupational Therapist
Lisa Devine-Keenan Physical Therapist
Danielle Petsch Vision Teacher

Review of Special Education in the Providence Public School District
Council of the Great City Schools Page 147
9:30-10:30 Maribeth Calabro Teachers Union Representative
Fr. Nick Milas Teachers Union Representative
Paul Vorro Teachers Union Representative
Aubrey Lombardo Teacher Assistant Union-Local Union 1033
Betty Jackson Teacher Assistant Union-Local Union 1033
10:30-11:30 Mike D’Antuno Acting Chief Financial Officer
Anthony Vescera Coordinator of Grant Oversight and External Funding
Chris Petisce Senior Budget Officer
Carlton Jones Chief Operations Officer
Lois Cardarelli Medicaid Specialist
Andre Thibeault Director of Operations
Lou Dipaolo Data Management (not available-later spoke on
conference call)
Penny Pare Social Worker/Clinical Team
Craig S. Parlato Autism Speaks
11:30-12:00 Victoria Rodriguez RIPIN (RI Parent Information Network)
12:00-12:30
lunch
12:30-1:15
Soledad Barreto
Director of ELL K-8
Kristi Bond Director of Federal Programs
(out of town)
Marco Andrade Director of Research and Development
(moved to Wednesday)
Denise Carpenter Director of Drop-Out Prevention
1:15-1:45 Nancy Stevenin Transition Director
1:45-2:15 Larry Roberti Birch Vocational
2:15-2:30 Break
2:30-3:30 Susan Chin Elementary Principal at Veazie
Mariellen Boisclair Elementary Principal at Carnevale
Rachel Mellion Elementary Principal at GJ West
Lori Hughes Elementary Principal at Charles Fortes
Nicole Mathis Middle School Principal at Greene
Diana Larbi Middle School Principal at DelSesto
Wobberson Torschon High School Principal at Alvarez
(did not participate)
John Hunt High School Principal at Classical
3:30-4:00 Kathy Crain President of the School Board (moved to conference
call Thursday evening)
4:00-4:45 Leslie Gell Ready to Learn Pre-K Agent
Mary Pendergast LAC Chair

Review of Special Education in the Providence Public School District
Council of the Great City Schools Page 148
Shavon Smith Parent of student at Carnevale
Charlene Borders Parent
Alfredo Nunez Parent of student at Fortes
6:00 p.m.—2
a.m.
Working Dinner and Development of Findings and Recommendations
(Conference call with School Board President, Kathy Crane 45 minutes
approx. 7:45-8:30 p.m.)
April 20,
2011
Follow-up conference call with Data/Technology—Peter Santos, Information
Technology Officer and Lou DiPaolo, Data Information Consultant
Friday, April 15, 2011
Time Name Position
12:30-1:00 Working Lunch
1:15-2:45 Tom Brady Superintendent
Paula Shannon Exec Director
Karen Vessella Secondary Director of Special Education
Lisa Vargas-Sinapi Elementary Director of Special Education
Gary Moroch Executive Director of Elementary
Nkoli Onye Executive Director of High Schools
Marc Catone Executive Director of Middle Schools
Kathy Crane School Board President

Review of Special Education in the Providence Public School District
Council of the Great City Schools Page 149
APPENDIX G. STRATEGIC SUPPORT TEAM
Karla Estrada
Karla Estrada is currently an administrator in the Division of Special Education in Los
Angeles Unified School District (LAUSD). In this role, she works to organize projects for
instruction, least restrictive environment, inclusion, autism, and transition. Karla works with
staff, parents and students all over LA. She is part of the Central Team for School-Wide
Positive Behavior Support implementation. She is also the Division of Special Education’s
representative in the development of training and projects for Response to Instruction and
Intervention, she is a member of an Ad Hoc Team gathered to improve the educational
opportunities of English Language Learners (ELLs) in LAUSD. Karla provides a great deal of
professional development in schoolwide positive behavior support, classroom management,
coaching classroom management, data-based decision making, and instruction/behavior
support planning. Working with local district and school teams throughout LA, Karla has had
multiple opportunities for building successful partnerships in meeting individual as well as
district goals. Karla has degrees in general education and special education and is certificated
in administration. She is a also Board Certified Behavior Analyst (BCBA). She is currently in
a doctoral program in educational leadership for social justice at Loyola Marymount
University, with a dissertation topic focused on meeting the English language development
needs of ELLs with specific learning disabilities. Her special interests include instructional
practices that ensure positive educational outcomes for all students, as well as, exploring
disproportionality issues affecting ELLs, students with disabilities, and at-risk youth. Karla is
committed to creating educational opportunities and access for all children and supporting
families and staff toward this common goal.
Sue Gamm, Esq.
Sue Gamm, a nationally recognized expert on special education, formerly served as chief
specialized services officer for the Chicago Public Schools and division director for the Office
for Civil Rights, Region V (Illinois, Minnesota, and Wisconsin). She has participated on
Strategic Support Teams provided by the Council of the Great City Schools for school districts
in the District of Columbia (1998), Guilford County, N.C., (2003), Richmond, Va., (2003), St.
Louis (2003), Charleston, (2005), Milwaukee (2007), New York City, District 75 (2008),
Rochester (2008), Boston (2009), Philadelphia (2009/2010), Pittsburgh (2009), and Austin
(2010). Ms. Gamm recently served as consulting attorney on the Council’s amicus brief in
support of the New York City Board of Education in Board of Education of the City School
District of the City of New York v. Tom F., On Behalf of Gilbert F., A Minor Child (2007). She
currently consults with the Illinois State Board of Education on the state’s monitoring of the
Chicago Public Schools on least-restrictive environment (LRE) as part of the district’s
implementation of the Corey H. v. ISBE settlement agreement. Further, she consults with the
Public Consulting Group and numerous school districts and state educational agencies and

Review of Special Education in the Providence Public School District
Council of the Great City Schools Page 150
provides training at national, state, and local conferences on special education matters,
particularly in the area of special education disproportionality. In 2006, Ms. Gamm was an
expert for the plaintiffs in Blackman v. District of Columbia, et al., Civil Action No. 97-1629
(PLF) Consolidated with Civil Action No. 97-2402 (PLF) in the areas of special education
policies, procedures, and practices. In Baltimore, she completed a review of special education
services in 2004-05 for the city’s public schools and was an expert for plaintiffs Vaughn G., et
al. v. Mayor and City Council of Baltimore, et al., Civil Action No. MJG-84-1911. Ms. Gamm
has also done extensive special education consultation on LRE issues for the Los Angeles
County School District and is a consultant for the class action consent decree in Los Angeles.
Finally, Ms. Gamm has provided expert advice over the past five years to the New York City
Board of Education. This assistance included writing a Principal’s Quick Reference Guide to
Special Education (2003). Ms. Gamm graduated with high honors from University of Illinois
with a B.A. degree in regular and special education (1970) and earned a law degree from the
De Paul College of Law (1976). She is admitted to practice before the Illinois Bar, the Federal
Bar, and the U.S. Supreme Court Bar.
Will Gordillo
Will Gordillo is the administrative director for the Division of Special Education for
Miami-Dade County Public Schools, the fourth-largest school district in the nation serving
approximately 40,000 students with disabilities. In this role, he provides leadership for
program planning and implementation, professional development, curriculum and
instruction, and compliance in special education. In addition, his office oversees the direct
operation of five exceptional student education centers serving students with
emotional/behavioral disabilities and significant intellectual disabilities requiring the
highest level of service intensity. He has extensive expertise in the areas of
emotional/behavioral disabilities, inclusive practices, schoolwide positive behavior
support, and the development of specialized programs for student ages 16-22, in
collaboration with community-based organizations. In his present position, he has
overseen the implementation of the Individuals with Disabilities Education Act (IDEA),
Florida Inclusion Network, The Miami-Dade/Monroe Multiagency Network for Students
with Emotional/Behavioral Disabilities (SEDNET), and Schoolwide Positive Behavior,
and Florida Diagnostic Learning Resource System-South (FDLRS-S) grants. Mr. Gordillo
has been an active administrative representative on the United Teachers of Dade County
Special Education Task Force, the Superintendent’s Advisory Panel for Students with
Disabilities, and the Autism Task Force. He has been instrumental in developing a Local
Education Agency (LEA) Resource Guide for program specialists, implementing a
computerized individualized education program (IEP) system, and developing a plan of
action to serve students with disabilities at or in close proximity to their home schools.
Julie Wright Halbert, Esq.
Julie Halbert has been legislative counsel for the Council of the Great City Schools for more
than 16 years. In that capacity, she has served as a national education legal and policy

Review of Special Education in the Providence Public School District
Council of the Great City Schools Page 151
specialist, with emphasis on special education. She worked extensively on the reauthorization
of the Individuals with Disabilities Education Act (IDEA) in 1997 and 2004. Ms. Halbert is
responsible for drafting numerous technical provisions to the IDEA and providing technical
assistance to Congress and the U. S. Department of Education. In 1997 and, again, in 2005,
she testified before the U.S. Department of Education on its proposed regulations on IDEA
2004. Ms. Halbert has directed each of the Council’s special education review teams,
including special education reviews in the District of Columbia, Guilford County (NC),
Richmond, St. Louis, Charleston, New York City, Rochester, Boston, Philadelphia and
Pittsburgh. Halbert was also the counsel of record for the Council of the Great City Schools’
amicus briefs in the Supreme Court of the United States in (a) Board of Education of the City
School District of the City of New York v. Tom F., On Behalf of Gilbert F., A Minor Child
(2007); (b) Jacob Winkelman, a Minor By and Through His Parents and Legal Guardians, Jeff
and Sander Winkelman, et al., v. Parma City School District (2007); (c) Brian Schaffer v.
Jerry Weast, Superintendent of Montgomery County Public Schools, et al., (2005); (d) Parents
Involved in Community Schools v. Seattle School District and Meredith v. Jefferson County
Board of Education (2007) and Forest Grove School District v. T.A, (2009). Ms. Halbert
graduated with honors from the University of Maryland and the University of Miami School
of Law. She is admitted to practice in the Federal Bar, the U.S. Supreme Court Bar, and the
Florida and Pennsylvania Bars.

Review of Special Education in the Providence Public School District
Council of the Great City Schools Page 152
APPENDIX H. ABOUT THE COUNCIL AND HISTORY OF STRATEGIC SUPPORT
TEAMS
The Council of the Great City Schools is a coalition of 65 of the nation’s largest urban public
school systems, including Providence.59
The organization’s Board of Directors is composed of
the Superintendent, CEO or Chancellor of Schools, and one School Board member from each
member city. An Executive Committee of 24 individuals, equally divided in number between
Superintendents and School Board members, provides regular oversight of the 501(c)(3)
organization. The composition of the organization makes it the only independent national
group representing the governing and administrative leadership of urban education and the
only association whose sole purpose revolves around urban schooling.
The mission of the Council is to advocate for urban public education and assist its members in
their improvement and reform. The Council provides services to its members in the areas of
legislation, research, communications, curriculum and instruction, and management. The
group convenes two major conferences each year; conducts studies of urban school conditions
and trends; and operates ongoing networks of senior school district managers with
responsibilities for areas such as federal programs, operations, finance, personnel,
communications, research, and technology. Finally, the organization informs the nation’s
policymakers, the media, and the public of the successes and challenges of schools in the
nation’s Great Cities. Urban school leaders from across the country use the organization as a
source of information and an umbrella for their joint activities and concerns.
The Council was founded in 1956 and incorporated in 1961, and has its headquarters in
Washington, D.C. Since the organization’s founding in 1956, geographic, ethnic, language,
and cultural diversity has typified the Council’s membership and staff.
59 Albuquerque, Anchorage, Atlanta, Austin, Baltimore, Birmingham, Boston, Broward County (Ft. Lauderdale),
Buffalo, Caddo Parish (Shreveport), Charleston County, Charlotte-Mecklenburg, Chicago, Cincinnati, Clark
County (Las Vegas), Cleveland, Columbus, Dallas, Dayton, Denver, Des Moines, Detroit, Duval County
(Jacksonville), East Baton Rouge, Fort Worth, Fresno, Guilford County (Greensboro, N.C.), Hillsborough
County (Tampa), Houston, Indianapolis, Jackson, Jefferson County (Louisville), Kansas City, Little Rock School
District, Long Beach, Los Angeles, Memphis, Miami-Dade County, Milwaukee, Minneapolis, Nashville,
Newark, New Orleans, New York City, Norfolk, Oakland, Oklahoma City, Omaha, Orange County (Orlando),
Palm Beach County, Philadelphia, Pittsburgh, Portland, Providence, Richmond, Rochester, Sacramento, Salt
Lake City, San Diego, San Francisco, Seattle, St. Louis, St. Paul, Toledo, Washington, D.C., and Wichita

Review of Special Education in the Providence Public School District
Council of the Great City Schools Page 153
History of Council Strategic Support Teams of the Council of the Great City Schools
The following is a history of the Strategic Support Teams provided by the Council of the Great
City Schools to its member urban school districts over the last 10 years.
City Area Year
Albuquerque
Facilities and Roofing 2003
Human Resources 2003
Information Technology 2003
Special Education 2005
Legal Services 2005
Safety and Security 2007
Anchorage
Finance 2004
Communications 2008
Math Instruction 2010
Atlanta
Facilities 2009
Transportation 2010
Austin
Special Education 2010
Birmingham
Organizational Structure 2007
Operations 2008
Facilities 2010
Boston
Special Education 2009
Broward County (FL)
Information Technology 2000
Food Services 2009
Transportation 2009
Buffalo
Superintendent Support 2000
Organizational Structure 2000
Curriculum and Instruction 2000
Personnel 2000
Facilities and Operations 2000
Communications 2000
Finance 2000
Finance II 2003
Bilingual Education 2009
Caddo Parish (LA)
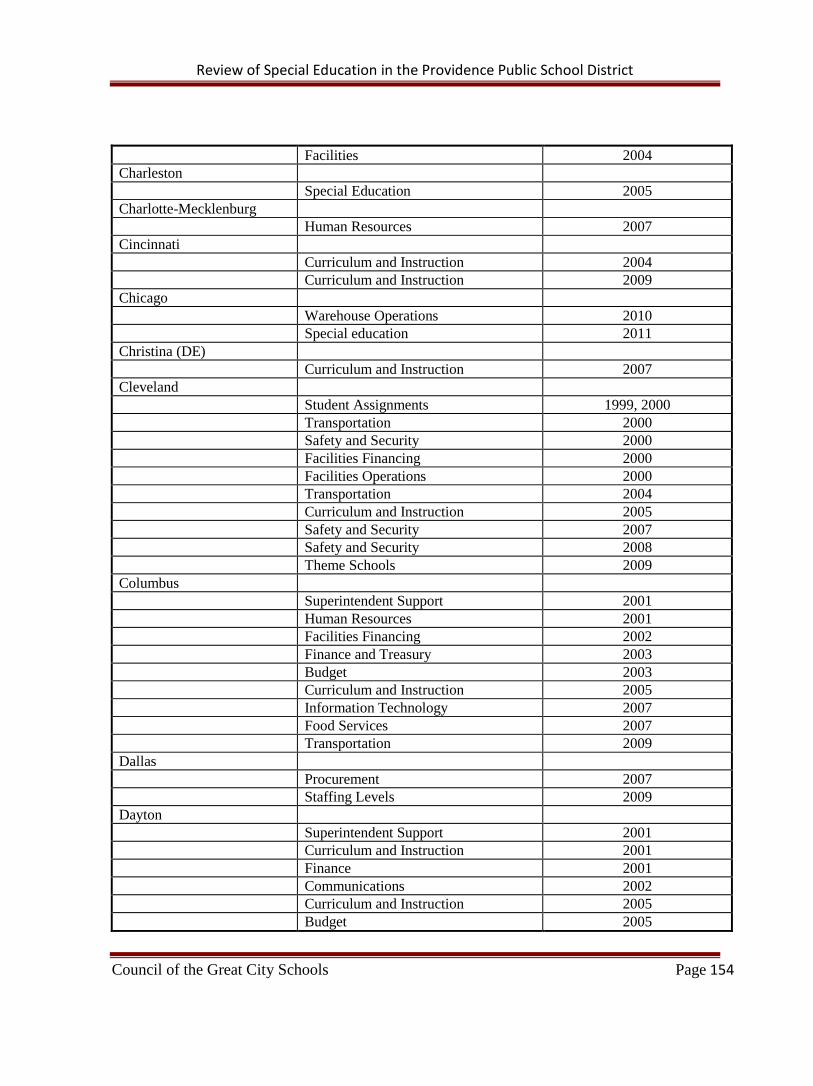
Review of Special Education in the Providence Public School District
Council of the Great City Schools Page 154
Facilities 2004
Charleston
Special Education 2005
Charlotte-Mecklenburg
Human Resources 2007
Cincinnati
Curriculum and Instruction 2004
Curriculum and Instruction 2009
Chicago
Warehouse Operations 2010
Special education 2011
Christina (DE)
Curriculum and Instruction 2007
Cleveland
Student Assignments 1999, 2000
Transportation 2000
Safety and Security 2000
Facilities Financing 2000
Facilities Operations 2000
Transportation 2004
Curriculum and Instruction 2005
Safety and Security 2007
Safety and Security 2008
Theme Schools 2009
Columbus
Superintendent Support 2001
Human Resources 2001
Facilities Financing 2002
Finance and Treasury 2003
Budget 2003
Curriculum and Instruction 2005
Information Technology 2007
Food Services 2007
Transportation 2009
Dallas
Procurement 2007
Staffing Levels 2009
Dayton
Superintendent Support 2001
Curriculum and Instruction 2001
Finance 2001
Communications 2002
Curriculum and Instruction 2005
Budget 2005

Review of Special Education in the Providence Public School District
Council of the Great City Schools Page 155
Curriculum and Instruction 2008
Denver
Superintendent Support 2001
Personnel 2001
Curriculum and Instruction 2005
Bilingual Education 2006
Curriculum and Instruction 2008
Des Moines
Budget and Finance 2003
Detroit
Curriculum and Instruction 2002
Assessment 2002
Communications 2002
Curriculum and Assessment 2003
Communications 2003
Textbook Procurement 2004
Food Services 2007
Curriculum and Instruction 2008
Facilities 2008
Finance and Budget 2008
Information Technology 2008
Stimulus planning 2009
Greensboro
Bilingual Education 2002
Information Technology 2003
Special Education 2003
Facilities 2004
Human Resources 2007
Hillsborough County (FLA)
Transportation 2005
Procurement 2005
Houston
Facilities Operations 2010
Capitol Program 2010
Information Technology 2010
Indianapolis
Transportation 2007
Information Technology 2010
Jackson (MS)
Bond Referendum 2006
Communications 2009
Jacksonville
Organization and Management 2002
Operations 2002

Review of Special Education in the Providence Public School District
Council of the Great City Schools Page 156
Human Resources 2002
Finance 2002
Information Technology 2002
Finance 2006
Kansas City
Human Resources 2005
Information Technology 2005
Finance 2005
Operations 2005
Purchasing 2006
Curriculum and Instruction 2006
Program Implementation 2007
Stimulus Planning 2009
Little Rock
Curriculum and Instruction 2010
Los Angeles
Budget and Finance 2002
Organizational Structure 2005
Finance 2005
Information Technology 2005
Human Resources 2005
Business Services 2005
Louisville
Management Information 2005
Staffing Levels 2009
Memphis
Information Technology 2007
Miami-Dade County
Construction Management 2003
Food Services 2009
Transportation 2009
Maintenance and Operations 2009
Capital Projects 2009
Milwaukee
Research and Testing 1999
Safety and Security 2000
School Board Support 1999
Curriculum and Instruction 2006
Alternative Education 2007
Human Resources 2009
Minneapolis
Curriculum and Instruction 2004
Finance 2004
Federal Programs 2004

Review of Special Education in the Providence Public School District
Council of the Great City Schools Page 157
Newark
Curriculum and Instruction 2007
Food Service 2008
New Orleans
Personnel 2001
Transportation 2002
Information Technology 2003
Hurricane Damage Assessment 2005
Curriculum and Instruction 2006
New York City
Special Education 2008
Norfolk
Testing and Assessment 2003
Orlando (Orange County)
Information Technology 2010
Philadelphia
Curriculum and Instruction 2003
Federal Programs 2003
Food Service 2003
Facilities 2003
Transportation 2003
Human Resources 2004
Budget 2008
Human Resource 2009
Special Education 2009
Pittsburgh
Curriculum and Instruction 2005
Technology 2006
Finance 2006
Special Education 2009
Portland
Finance and Budget 2010
Procurement 2010
Operations 2010
Providence
Business Operations 2001
MIS and Technology 2001
Personnel 2001
Human Resources 2007
Special education 2011
Bilingual education 2011
Richmond
Transportation 2003
Curriculum and Instruction 2003
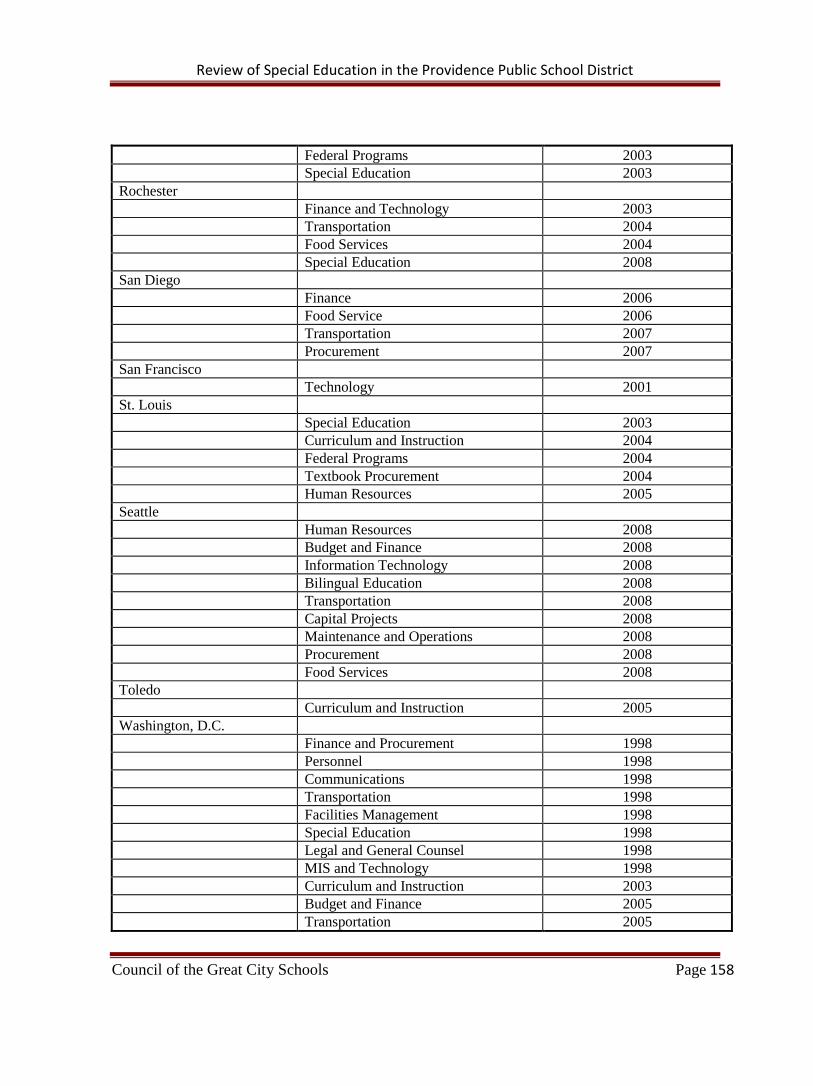
Review of Special Education in the Providence Public School District
Council of the Great City Schools Page 158
Federal Programs 2003
Special Education 2003
Rochester
Finance and Technology 2003
Transportation 2004
Food Services 2004
Special Education 2008
San Diego
Finance 2006
Food Service 2006
Transportation 2007
Procurement 2007
San Francisco
Technology 2001
St. Louis
Special Education 2003
Curriculum and Instruction 2004
Federal Programs 2004
Textbook Procurement 2004
Human Resources 2005
Seattle
Human Resources 2008
Budget and Finance 2008
Information Technology 2008
Bilingual Education 2008
Transportation 2008
Capital Projects 2008
Maintenance and Operations 2008
Procurement 2008
Food Services 2008
Toledo
Curriculum and Instruction 2005
Washington, D.C.
Finance and Procurement 1998
Personnel 1998
Communications 1998
Transportation 1998
Facilities Management 1998
Special Education 1998
Legal and General Counsel 1998
MIS and Technology 1998
Curriculum and Instruction 2003
Budget and Finance 2005
Transportation 2005

Review of Special Education in the Providence Public School District
Council of the Great City Schools Page 159
Curriculum and Instruction 2007
Wichita
Transportation 2009
![PROVIDENCE PUBLIC LIBRARY...Providence Public Library, Special Collections department. Preferred Citation: Researchers are requested to use the following citation format: [item title],](https://img.dokumen.tips/doc/110x75/6036c36686bd0e6e1d69201a/providence-public-library-providence-public-library-special-collections-department.jpg)