Embed Size (px)
Citation preview

Plastic ZERO - Public Private Cooperations for Avoiding Plastic as a Waste
City of Copenhagen | City of Malmö | City of Hamburg | SIA Liepajas RAS Tampere Regional Solid Waste Management Ltd. | I/S Amager Ressourcecenter | Aalborg University LIFE10 ENV/DK/098 - with the contribution of the LIFE financial instrument of the European Union
1
Review of plastic waste in municipal waste stream Germany

2
Table of contents
1 Introduction ........................................................................................ 3
2 Brief description of the waste management system .................................. 3
2.1 Households ................................................................................. 3
2.2 Private enterprises ...................................................................... 4
3 Regulatory measures on plastic waste .................................................... 5
3.1 Packaging – producer responsibility ............................................... 5
3.2 Deposit – refund systems ............................................................. 6
3.3 Landfill ban ................................................................................. 6
3.4 Charge or fee for management of municipal waste .......................... 6
3.5 High recycling targets for waste plastic .......................................... 7
4 Collection Schemes and quantities collected ............................................ 7
4.1 The recycling bin or “Gelbe Tonne plus” or “Wertstofftonne” ............. 7 4.1.1 Hamburg .............................................................................. 8
4.1.2 Berlin ................................................................................. 10
5 Background information ...................................................................... 11
5.1 Structure of Administration ......................................................... 11
5.2 GDP per capita .......................................................................... 12
5.3 Occupational Structure ............................................................... 12
6 References ........................................................................................ 13
January 2014, final
Action 1.3
Quality Assurance
Done by Mette Skovgaard December 2013
Quality assured by Elke Schekahn January 2014
Approved by Line Geest Jakobsen July 2014
3
1 INTRODUCTION
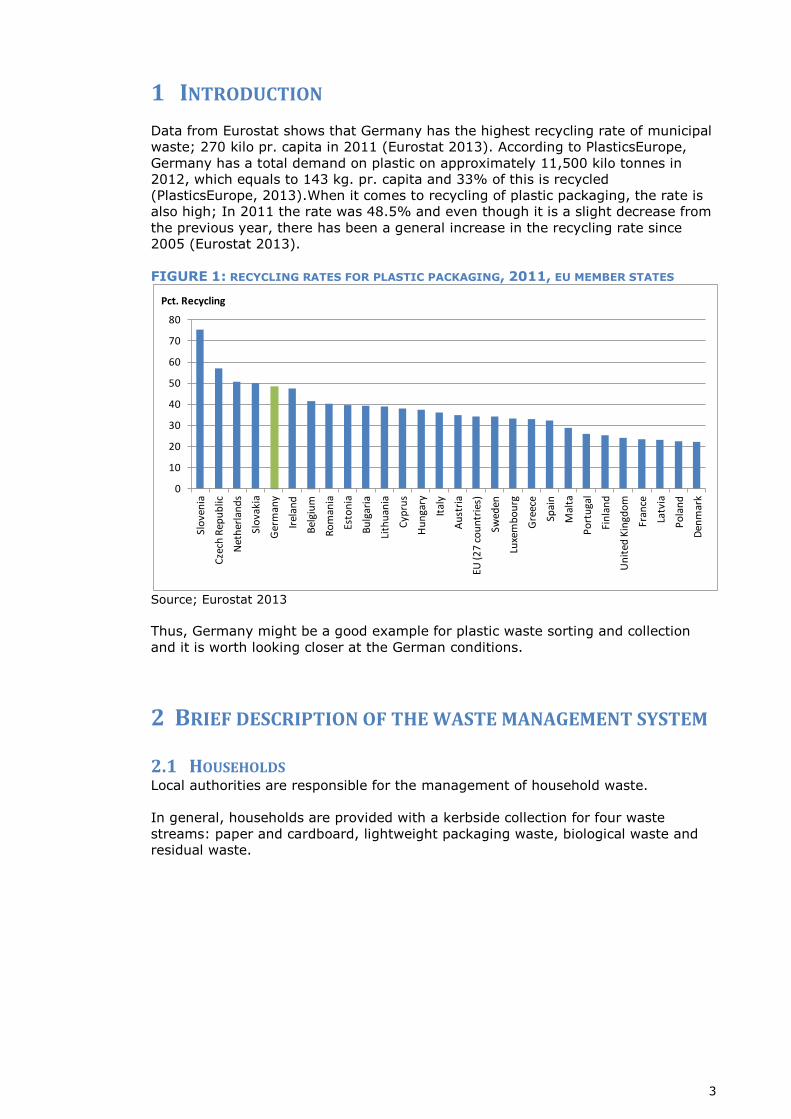
Data from Eurostat shows that Germany has the highest recycling rate of municipal
waste; 270 kilo pr. capita in 2011 (Eurostat 2013). According to PlasticsEurope,
Germany has a total demand on plastic on approximately 11,500 kilo tonnes in
2012, which equals to 143 kg. pr. capita and 33% of this is recycled
(PlasticsEurope, 2013).When it comes to recycling of plastic packaging, the rate is
also high; In 2011 the rate was 48.5% and even though it is a slight decrease from
the previous year, there has been a general increase in the recycling rate since
2005 (Eurostat 2013).
FIGURE 1: RECYCLING RATES FOR PLASTIC PACKAGING, 2011, EU MEMBER STATES
Source; Eurostat 2013
Thus, Germany might be a good example for plastic waste sorting and collection
and it is worth looking closer at the German conditions.
2 BRIEF DESCRIPTION OF THE WASTE MANAGEMENT SYSTEM
2.1 HOUSEHOLDS Local authorities are responsible for the management of household waste.
In general, households are provided with a kerbside collection for four waste
streams: paper and cardboard, lightweight packaging waste, biological waste and
residual waste.
0
10
20
30
40
50
60
70
80
Slo
ven
ia
Cze
ch R
epu
blic
Net
her
lan
ds
Slo
vaki
a
Ger
man
y
Irel
and
Bel
giu
m
Ro
man
ia
Esto
nia
Bu
lgar
ia
Lith
uan
ia
Cyp
rus
Hu
nga
ry
Ital
y
Au
stri
a
EU (2
7 c
ou
ntr
ies)
Swed
en
Luxe
mb
ou
rg
Gre
ece
Spai
n
Mal
ta
Po
rtu
gal
Fin
lan
d
Un
ited
Kin
gdo
m
Fran
ce
Latv
ia
Po
lan
d
Den
mar
k
Pct. Recycling

4
Waste glass is collected in a bring scheme and is often colour separated in clear,
green and brown glass.
Households also have access to one or more recycling stations for bulky waste,
electrical and electronic waste, hazardous waste and various forms of domestic,
construction waste.
Producers and retailers have financial responsibility for the collection and
management of packaging waste (incl. paper, glass and lightweight packaging), the
households do not pay a waste fee for these streams. Instead, householders pay
indirectly when they buy goods. Local authorities charge the households a waste
fee for residual waste and biological waste, if they have the latter bin.
The German graphic papers working group (AGRAPA) made a voluntary
commitment in September 1994 to recover 60 % of graphic paper by 2000. For
several years the recovery rate has been above 85 %, (BMU 2011).
The first Packaging Ordinance was issued in 1991, and is presented in detail below.
The development of separate collection in Germany is shown in table 2.
TABLE 2. GERMANY: WASTE COLLECTED 1990, 2004 AND 2008
1990 2004 2008
Percent Tonnes Percent Tonnes Percent Tonnes
Residual waste 87 34 mio. 42 18 mio. 39 16.7 mio.
Waste for recycling: 13 5 mio. 58 26 mio. 61 26.5 mio.
biowaste √ √ √
glass √ √ √
paper √ √ √
packaging n/a √ √
Source: Federal Statistic Office 2010, Federal Ministry for the Environment
2.2 PRIVATE ENTERPRISES The local authorities may collect residual waste from private enterprises.
Companies using the public collection scheme are mostly small enterprises and
commerce in the city area.
TABLE 1. KERBSIDE COLLECTION IN GERMANY Blue bin (paper & cardboard) - Envelopes, books, catalogues, illustrations, cartons, writing pads, brochures, writing paper, school
books, washing detergent cartons without plastic, newspapers, paper boxes
Yellow bin or bags (lightweight packaging) - Aluminum foil, plastic wrap, inside packaging materials - Tins, cans, liquids refill sachets/bags, yogurt cups, body lotion bottles - Plastic bags, margarine tubs, milk sachets, plastic packaging trays for fruit and vegetables, screw-
top bottle tops, detergent bottles, carry bags, vacuum packaging, dishwashing liquid bottles
Brown or green bin (biological waste) - Kitchen waste: old bread, eggs shells, coffee powder and filters, food leftovers, tealeaves and tea
filters - Fruit and vegetables: peels, apple cores, leaves, nutshells, fruit stones and pips, lettuce leaves - Garden waste: soil, hedge trimmings, leaves, grass clippings, weeds, dead flowers, and twigs - Other: feathers, hair, kitchen towels, tissues, sawdust, and straw
Grey bin (household waste) - residual waste
Source: www.howtogermany.de

5
In 1996, the amendment of the German Waste Act made private enterprises
responsible for organising collection of the recyclable materials they generate
(Weissenbach, 2007).
The German construction industry committed themselves to reduce the volume of
recyclable construction waste being landfilled by half by 2005. In 2005, 70 % was
recycled, (BMU 2011).
3 REGULATORY MEASURES ON PLASTIC WASTE
Back in the 1970s, authorities’ environmental focus was mainly on pollution from
landfills. Later, in the mid-1980s, focus shifted to diverting waste from landfills
towards recycling and energy recovery. Today, focus is on efficient resource use
and scarce resources.
In the mid-1990s, the Closed Substance Cycle and Waste Management Act
(Kreislaufwirtschaftsgesetz) came into force, (BMU, 2011). The act has been
amended in June 2012 to comply with the European Waste Directive and the five-
level waste hierarchy.
The waste sector employs 250,000 people and has a turnover of 50 billion euros a
year, (BMU, 2011).
3.1 PACKAGING – PRODUCER RESPONSIBILITY In 1991, Germany was the first country to introduce a comprehensive system
where manufacturers and distributors were made financially responsible for the
packaging they created. Packaging waste had grown to around 30 % by weight of
the total waste stream and 50 % by volume (Clean Production Action, 2003).
Requirements were set on the amount of packaging waste that manufacturers
(fillers) and distributors (retailers) had to take back and recover, and these
requirements increased gradually. This led to the creation of the Dual System
Deutschland, DSD, in 1993, an organisation that collects and manages packaging
waste according to the requirements on behalf of fillers and retailers. Companies
pay a fee to the DSD which reflects the collection and recovery costs of the
individual materials thus providing them with an incentive to reduce or minimise
the packaging materials used.
In effect, the DSD had a monopoly status on the German market. However, in 2009
the Packaging Ordinance was amended to allow more producer responsibility
systems to be established. Today, there are 10 producer responsibility systems in
Germany.
Plastics are part of the lightweight packaging stream and is collected in a yellow bin
or sack together with metals and drink cartons. Around 50 % of the lightweight
fraction (yellow bins and sacks) from households is plastics (DKR website).
In 2009, almost 73% of packaging plastic placed on the market was recovered.

6
FIGURE 2: GERMAN RECYCLING RATES FOR PLASTIC PACKAGING
Source; Eurostat 2013
3.2 DEPOSIT – REFUND SYSTEMS In 2009, 15 % of the plastics on the market was sold in recyclable plastic bottles,
and another 2.6 % in ecologically advantageous beverage packaging, which
includes beverage carton and stand-up pouch. As a result, the share of returnable
and ecologically advantageous beverage packaging has been reduced to 52 %,
(UBA 2011b). The other half was packed in recyclable plastic, glass bottles and
cans.
Since 2004, one-way plastic packaging has increased from around 25 % of the
market to more than 45 % (read from graph, UBA 2011b).
3.3 LANDFILL BAN Germany has set limitations on the organic content of landfilled waste. The
regulation has been implemented in two steps, first in 1993 with the TASi and in
2001 with the Waste Landfilling Ordinance (Weissenbach, 2007).
The TASi, technical instructions on municipal waste, requires that waste with a
biodegradable content to be stabilised and inert. It sets a limit value on the organic
content of waste going to landfill of 3 %.
However, the TASi had some loopholes, and so by June 2005, the Waste Landfilling
Ordinance requires that waste has to be pre-treated prior to landfill. Pre-treatment
include incineration and high-quality mechanical-biological treatment.
3.4 CHARGE OR FEE FOR MANAGEMENT OF MUNICIPAL WASTE Traditionally, every household has to pay a fee for the municipal waste service.
In Hamburg, the fees depend on the size of the waste bin and the service
frequency. The fees include most of the waste services (residual waste, paper
waste, recycling yards etc.). Extra fees are charged for bio-waste and collection of
bulky waste from the owner site. The fee structure is created to motivate the
citizens to separate recyclable waste (no extra fee for paper waste, fee for bio-
waste only 20 % of fee for residual waste). The fee amount depends to the size of
the residual waste bin. Additionally, all households have to pay a basic fee (for
infrastructure, recycling-yards etc.). The monthly waste fee for a household in a
multi-storey building with 10 flats is shown in table 6 (below).
0
10
20
30
40
50
60
2000 2001 2002 2003 2004 2005 2006 2007 2008 2009 2010 2011
%
Year

7
3.5 HIGH RECYCLING TARGETS FOR WASTE PLASTIC The German packaging ordinance demands targets only for packaging used by
private consumers (households): 60 % of the production should be collected,
hereof 60 % for recycling, which means the recycling target is 36% of the plastics
placed on the market for private consumers. Therefore, the targets are not directly
comparable with the EU targets. The EU targets were reached.
4 COLLECTION SCHEMES AND QUANTITIES COLLECTED
This chapter is dedicated to convey information about a single example on a
German collection scheme; an expansion of the lightweight packaging to a recycling
bin.
4.1 THE RECYCLING BIN OR “GELBE TONNE PLUS” OR “WERTSTOFFTONNE” In September 2011, the Federal Environment Agency recommended that the yellow
bin should be upgraded to a dry recycling bin (UBA, 2011a). In addition to
packaging, the recycling bin should contain everyday items made of plastic and
metal. Non-packaging items are for example toys, cutlery, pots, pans and plastic
buckets. Moreover, many citizens already used the yellow bin/sack for non-
packaging items. The aim is to increase the amount of recyclable materials
collected by 7 kg per capita per year.
The agency finds that the bin should not contain waste from electrical and
electronic equipment as it might contaminate the other materials with heavy metals
and fire-proofing agents.
The financing of the initiative is still to be decided upon. Two models have been
developed. In model A, all responsibility and financing is placed with the private
sector. In model B, the responsibility for organising the waste collection lies with
the municipalities, while the financing is shared, so the light packaging will be
financed by the manufacturers and suppliers as today, and the non-packaging
items will be financed via a waste charge.
The recommendation from the agency is based on results from a pilot project.
Several municipalities and federal states (Länder) have conducted pilots. In
addition to equivalent non-packaging materials, various combinations of materials
accepted in the recycling bin have been tested. For example, Berlin includes
electronic devices, wood and textiles in the recycling bin but not lightweight
packaging. Hamburg on the other hand, accepts only lightweight packaging and
non-packaging made of plastic and metal.
TABLE 3. COMPARING THE RANGE OF MATERIALS ACCEPTED IN SELECTED CITIES Materials Berlin Hamburg Leipzig Dortmund Hannover
Equivalent non-packaging
materials (metals, plastics and
composite materials, e.g. pans, watering cans, toys)
+ + + + +
Electronic devices + - + + +
Wood + - - - -
Textiles + - - - +
Lightweight packaging - + + + -
Increase in the collected amount: 5 – 13 kg per capita per year Source: Nogueria (2012)
In Leipzig, a pilot was initiated in September 1994 (Bünemann et al., 2011). The
partners in the pilot were the SERO Leipzig GmbH, a cooperative initiative of the
city of Leipzig, the Abfall-Logistik Leipzig GmbH and Duales System Deutschland

8
GmbH, (DSD website). The outcome of the project was successful and the partners
agreed to continue the system on regular terms. In the pilot, the collected amount
increased by 7.7 kg/capita where 3.1 kg/capita was plastic and metal.
A pilot was made in selected areas of Berlin from September to December 2004
where the orange box or Yellow Bin Plus was tested among 5,000 households
(Senatsverwaltung für Gesundheit, Umwelt und Verbraucherschutz, 2009). During
the pilot, the residual waste volume was reduced by 19 % and the collected amount
of dry recyclables increased from 15.6 to 22.8 kg per inhabitant, or 7.2
kg/inhabitant. Of the additionally collected waste, 4.4 kg was metal and plastic.
In Hamburg, two pilot areas were selected: Hamburg-Langenhorn where the pilot
ran for about 21 months (June 2006 – February 2008), and in Hamburg-Wilstorf
und Hamburg Kirchdorf-Süd where it ran from October 2007 till June 2008
(Bünemann et al., 2011).
An interesting result from the pilots is that in addition to the collection of same-
material non-packaging, more lightweight packaging was collected in the new
scheme.
TABLE 4. MATERIALS COLLECTED IN LEIPZIG, BERLIN AND HAMBURG IN PILOTS Leipzig
Yellow Bin Plus Berlin
Yellow Bin Plus Hamburg
Recycling Bin
Kg/capita Percent Kg/capita Percent Kg/capita Percent
Before change of system
Lightweight packaging 14.4 56.0 6.1 39.3 10.5 66.5
Other metal & plastic 3.5 13.4 1.9 12.3 1.6 10.1
Other items 7.9 30.6 7.6 48.4 3.7 23.4
Total 25.8 15.6 15.8
After change of system
Lightweight packaging 15.3 45.6 8.4 36.8 13.8 63.9
Other metal & plastic 5.7 17.0 4.0 17.5 3.3 15.3
Other items 12.5 37.3 10.4 45.6 4.5 20.8
Total 33.5 22.8 21.6
Increase in collected amount of LWP, plastic & metal
Lightweight packaging 0.9 2.3 3.3
Other metal & plastic 2.2 2.1 1.7
Total 3.1 4.4 5.0
Source: Bünemann et al. (2011)
4.1.1 Hamburg The general trend in Hamburg, as well as in many other German federal states, is
that more waste is seperated for recycling and less residual waste is incinerated
with energy recovery. Landfilling of residual waste terminated in 1999.
TABLE 5. HAMBURG: HOUSEHOLD WASTE COLLECTED 1990, 2000 AND 2012
1990 2000 2012
Percent Tonnes Percent Tonnes Percent Tonnes
Residual waste 88 625.000 72 586.000 68 479.000
Waste for recycling: 12 86.000 28 226.000 32 223.000
biowaste (√) (√) √
glass √ √ √
paper √ √ √
packaging n/a √ √
Source: Hamburg State Ministry of Urban Development and Environment (BSU)
In 2009, the City of Hamburg introduced a new “recycling campaign” which was
activated in January 2011 through a Recycling-Ordinance with a revised fee-
structure: “Separate to save”. The initiative re-launched the four-bin system:
green bin for bio and garden waste
blue bin for paper and cardboard
yellow bin for lightweight packaging and other items of plastic and metal
grey bin for residual waste.

9
BOX 1: THE CONTENT OF THE NEW YELLOW BIN IN HAMBURG
The city had aimed at some ambitious collection waste targets for 2012, which for
plastic, metals and packaging was 39.700 tonnes. They did not meet this, but they
did collect 32.800 tonnes and it constitutes an improvement of 5,100 tonnes of
extra collected of plastic, metal and drink cartons compared to 2007 level.
With the re-launch, the yellow bin was upgraded to a recycling bin where citizens
could get rid of other items than just packaging. It is an advantage that the yellow
bin is a well-known system already, and that there is no need for investing in new
bins or finding space for an extra bin in the back yards all ready equipped. The
recycling bin was introduced in all of Hamburg in May 2011.
The yellow bin is financed by the city (Stadtreinigung Hamburg) who pays for the
treatment of the non-packaging waste in the bin and a share of the collection costs.
The dual systems for packaging still pay municipalities for information and access to
infrastructure, they arrange logistics and pay for it, and they get the materials after
sorting and they sell it on the market.
By January 2011, Hamburg also revised the fee structure for private households.
The fee for the green biowaste bin was reduced by around 70 %, and the fee for
the grey residual bin was increased by around 4 %. There is no bin-bound fee for
the households for the blue (paper) bin. The costs for collection and recycling are
paid by the Stadtreinigung for the not-packaging paper (the costs are covered by
the basic fee, every household has to pay (see 3.4)) and by the producers in the
packaging producer responsibility systems (see 3.1)). Also the yellow bin is free of
a direct bin-bound fee for the households. The costs are splitted following the same
principle as above. The packaging collection systems pay for the packaging waste
(paper/cardboards, plastics and metall), the Stadtreinigung pays (money from the
basic fee) for the not-packaging paper, plastics and metal.
Use of the 12 recycling stations is free (or covered by the waste fee) for bulky
waste, and other recyclables. If households bring heavy and expensive waste
streams, such as construction waste, asbestos or waste oil, there is a fee1.
The monthly waste fee for a household in a multi-storey building with 10 flats is
shown in table 6.
TABLE 6. HAMBURG: MULTI-STOREY BUILDING WITH 10 FLATS, EURO Monthly fee per flat Fee before
1.1.2011 Fee from 1.1.2011
Waste volume: 102 litre per week (excluding packaging)
1,100 litre residual waste bin, weekly collection (1/10) 500 litre residual waste bin, weekly collection (1/10)
240 litre biowaste bin, weekly collection (1/10) 240 litre paper and cardboard bin, weekly collection 1,100 litre ”yellow bin”, collection every two weeks
10.17
0.00
6.87
0.48 0.00 0.00
Basic fee 6.15 6.56
Total waste fee per flat 16.32 13.91
Change -2.41
Source: Stadtreinigung Hamburg.
1 For an overview to the fee amounts look at http://www.srhh.de/srhh/opencms/privatkunden/gebuehren.html
Drinks and milk cartons Plastic packaging (bottles, films, bags) Plastic objects (bowls, buckets, toys) Cans and tubes Aluminium foil, aluminium bag and pet food bowls Metal items (pots, pans, tools)

10
Between May and December 2011 the share of non-packaging materials collected in
the recycling bin was around 12.5 % of the total amount of packaging and non-
packaging materials in Stadtreinigung Hamburg. Around 54% of the collected
materials are plastic. 11 % is flexible plastic/foils and 9 % rigid plastic to recycling.
The additional amount is 35% mixed plastic which is used for energy recovery.
The collected amount of plastic per capita in 2011 was 20.7 kg/head (incl.
commercial generators; only households-packaging 6.5 kg/head).
4.1.2 Berlin In 2010, Berlin generated 1.26 million tonnes of household and commercial waste.
Of the 858,000 tonnes destined for incineration, 703,000 tonnes is from households
and 155,000 tonnes is from commerce.
A sorting analysis of the two streams showed that they comprised a large share of
recyclables. Plastics are about 7 % of the residual household waste and 9 % of the
residual commercial waste. This analysis shows, that there is a potential for
increasing the recycling level.
TABLE 7. BERLIN: WASTE COMPOSITION OF WASTE IN THE RESIDUAL/GREY BIN, PERCENT Materials Household waste
(2010) Commercial waste
(2010)
Plastics 6.6 8.9
Metals 2.1 2.3
Paper/cardboard 11.4 15.0
Glass 6.8 3.9
Organic matter 41.9 45.2
Compound 9.1 10.5
Textiles 3.6 1.6
Mineral material 2.1 1.9
Wood 0.3 0.8
Other 16.1 9.9 Source: Senatsverwaltung für Gesundheit, Umwelt und Verbraucherschutz (2010)
The Yellow Bin Plus from the pilot project has been introduced gradually in Berlin.
In 2007, 21 % of the population was able to use the bin, (Senatsverwaltung für
Gesundheit, Umwelt und Verbraucherschutz, 2009).
The Yellow Bin Plus was renamed to the Orange Box and by January 2011, all
households in Berlin had access to the orange box placed on either private ground
(kerbside collection) or in public areas (bring scheme).
The scheme has been evaluated and the results show that a total of 13 kg was
collected from every citizen. The share of plastics for recycling was 0.9 percent.
BOX 2: WHAT THE ORANGE BOX IN BERLIN CONTAIN
Plastics: Household items such as plastic bowls, buckets, watering cans, molded parts,
plastic covers, flower pots, plastic toys Hair dryers, toasters, radios, MP3 / CD players, Gameboys, telephones, cell phones,
keyboards, smaller printers Toys: Wood, plastic and electric toys Metals: Household items made of metal and iron goods such as pots, pans, cutlery, metal
tools, screws, nails, pieces of wire, pipe sections, sheet remains Disk media such as CDs, DVDs and floppy disk Textiles (in bags): No more portable and old clothing, lingerie, home textiles such as
towels, curtains, bed linen and fabric scraps. Please no shoes.
Waste wood.
11
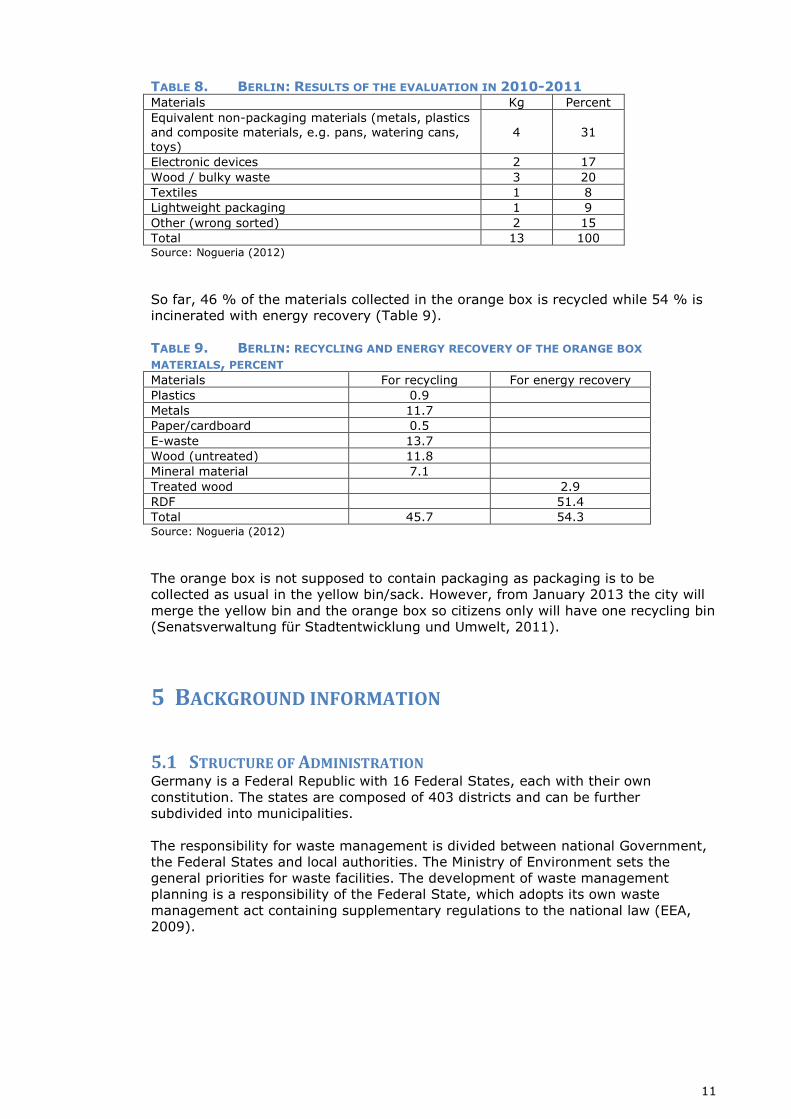
TABLE 8. BERLIN: RESULTS OF THE EVALUATION IN 2010-2011 Materials Kg Percent
Equivalent non-packaging materials (metals, plastics
and composite materials, e.g. pans, watering cans, toys)
4 31
Electronic devices 2 17
Wood / bulky waste 3 20
Textiles 1 8
Lightweight packaging 1 9
Other (wrong sorted) 2 15
Total 13 100 Source: Nogueria (2012)
So far, 46 % of the materials collected in the orange box is recycled while 54 % is
incinerated with energy recovery (Table 9).
TABLE 9. BERLIN: RECYCLING AND ENERGY RECOVERY OF THE ORANGE BOX
MATERIALS, PERCENT Materials For recycling For energy recovery
Plastics 0.9
Metals 11.7
Paper/cardboard 0.5
E-waste 13.7
Wood (untreated) 11.8
Mineral material 7.1
Treated wood 2.9
RDF 51.4
Total 45.7 54.3 Source: Nogueria (2012)
The orange box is not supposed to contain packaging as packaging is to be
collected as usual in the yellow bin/sack. However, from January 2013 the city will
merge the yellow bin and the orange box so citizens only will have one recycling bin
(Senatsverwaltung für Stadtentwicklung und Umwelt, 2011).
5 BACKGROUND INFORMATION
5.1 STRUCTURE OF ADMINISTRATION Germany is a Federal Republic with 16 Federal States, each with their own
constitution. The states are composed of 403 districts and can be further
subdivided into municipalities.
The responsibility for waste management is divided between national Government,
the Federal States and local authorities. The Ministry of Environment sets the
general priorities for waste facilities. The development of waste management
planning is a responsibility of the Federal State, which adopts its own waste
management act containing supplementary regulations to the national law (EEA,
2009).

12
FIGURE 3: MAP OF GERMAN FEDERAL STATES
5.2 GDP PER CAPITA GDP per capita in 2011 was EUR 31,437, which is a slight growth compared to the
previous year.
5.3 OCCUPATIONAL STRUCTURE The labor force is divided as follows; agriculture; 2.4%. Industry; 29.7%. Services;
67.8%. GDP by sector in 2011 is divided as follows; agriculture: 0.8%, industry:
28.6%, services: 70.6%.
TABLE 10. BACKGROUND DATA ON POPULATION DENSITY AND NYMBER OF HOUSEHOLDS Berlin Hamburg Country
Population 3.5 million 1.8 million 80.548 million
Number of households 2 million* 930,000** 40,076 million***
Population density 3,800/km2 2,400/km2 235,5 /km2
Notes: * Around 83 % of the citizens live in rented homes. ** 80 % of inhabitants are living in flats / multi-storey buildings. *** 2008

13
6 REFERENCES BMU, Federal Ministry for the Environment, Nature Conservation and Nuclear Safety, Environmental Report 2010, Environmental policy - a policy for the future, October 2010 http://www.bmu.de/english/strategy_legislation/stategies_and_reports/doc/47916.php
BMU, Federal Ministry for the Environment, Nature Conservation and Nuclear Safety, Closed-loop waste management, July 2011 Bünemann, A. Rachut, G., Christiani, J., Langen, M., Wolters, J., Planspiel zur Fortentwicklung der Verpackungsverordnung Teilvorhaben 1: Bestimmung der Idealzusammensetzung der Wertstofftonne, 2011b, Umweltbundesamt
Clean Production Action, Summary of Germany's packaging take-back law, Sept 2003 Eurostat 2013, Plastic Packaging recycling rate, 2011; http://epp.eurostat.ec.europa.eu/tgm/graph.do?tab=graph&plugin=1&pcode=ten00063&language=en&toolbox=sort
Eurostat 2013, Plastic Packaging recycling rate, Germany 2000- 2011; http://epp.eurostat.ec.europa.eu/tgm/graph.do?tab=graph&plugin=1&pcode=ten00063&language=en&toolbox=data Eurostat 2013, Material recycling rate for municipal waste, 2011; http://epp.eurostat.ec.europa.eu/tgm/graph.do?tab=graph&plugin=1&pcode=tsdpc240&lang
uage=en&toolbox=data Nogueria, Dr. M., 2012, The Orange Box – Berlin’s Resource Bin?, Presentation at DAKOFA Conference, Copenhagen, 29.02.2012 http://www.dakofa.dk/Aktiviteter/konferencer_seminarer/120207/Materiale/1055,%20Margarida%20Nogueira.pdf
PlasticsEurope, 2013; “Plastics – the Facts 2013”, http://www.plasticseurope.org/Document/plastics-the-facts-2013.aspx?FolID=2 Senatsverwaltung für Gesundheit, Umwelt und Verbraucherschutz (Berlin Senate Department
for Health, the Environment and Consumer Protection), Abfallbilanz des Landes Berlin 2010
Senatsverwaltung für Gesundheit, Umwelt und Verbraucherschutz (Berlin Senate Department for Health, the Environment and Consumer Protection), 2009, Municipal waste in Berlin, www.berlin.de/sen/guv Senatsverwaltung für Stadtentwicklung und Umwelt. Abfallwirtschaftsplan Berlin - Teilplan Siedlungsabfälle - Planungszeitraum: 2011-2020, Fortschreibung 2011, http://www.stadtentwicklung.berlin.de/umwelt/abfall/wirtschaftsplan/download/AWP_Siedlun
gsabfaelle_2011.pdf Stadtreinigung Hamburg, Recycling Offensive der kommunalen Abfallwirtschaft in Hamburg Wer trennt, der spart!, http://www.srhh.de/srhh/export/sites/srhh/images/privatkunden/wertstoffe/gebuehren3.pdf UBA, Umweltbundesamt (Federal Environment Agency), 2011a, Recovering more metal and
plastics from waste, Pilot project on introduction of recycling bin completed, Press Release No. 43/2011, http://www.umweltbundesamt.de/uba-info-presse-e/2011/pdf/pe11-
043_recovering_more_metal_and_plastics_from_waste.pdf UBA, Umweltbundesamt, Upwards trend in disposable plastic bottles continues, 2011b, Press Release No. 31/2011, http://www.umweltbundesamt.de/uba-info-presse-e/2011/pdf/pe11-031_upwards_trend_in_disposable_plastic_bottles_continues.pdf