Embed Size (px)
Citation preview

UNITED NATIONS CONFERENCE ON TRADE AND DEVELOPMENT
REVIEW OF MARITIMETRANSPORT
2012
Report by the UNCTAD secretariat
Chapter 3
UNITED NATIONS
New York and Geneva, 2012

FREIGHT RATES AND MARITIME
TRANSPORT COSTS

REVIEW OF MARITIME TRANSPORT 201258
A. FREIGHT RATES
This section presents an analysis of maritime freight
rate developments for containers, dry bulk and
industry trends and gives a selective outlook on future
developments of freight markets.
1. Container freight rates
Having experienced one of the steepest freight
rate cuts in history in 2008, the recovery remains
sluggish in 2011. Current freight rates are still far from
reaching pre-crisis levels, having experienced another
downturn in the second half of 2011 after a temporary
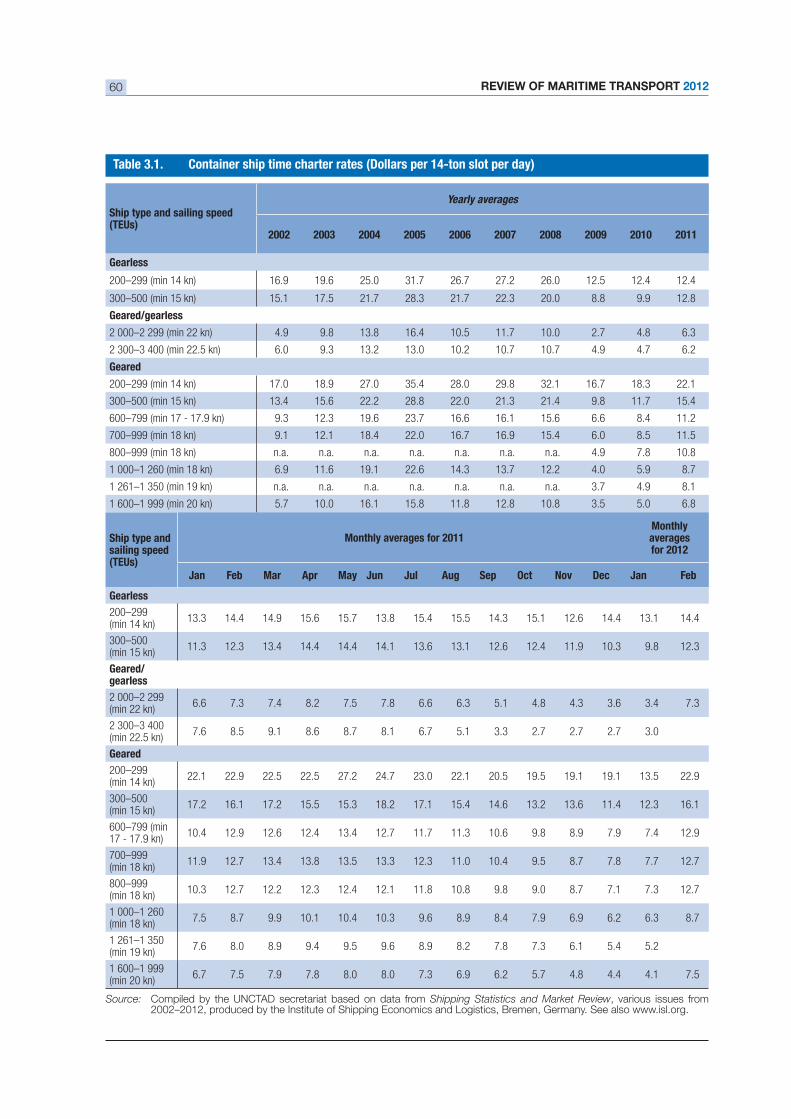
resurgence. Time charter rates for container ships
have declined from May to December 2011 for most
a condensed container freight rate indicator covering
a wide range of ship sizes, which experienced a dip of
1
An overstretched container cargo market on the
supply side precipitated the low freight rate levels in
2011. While the demand is currently still recovering
crisis, the growth rates of the global container carrier
due in part to shipowners not being able to withdraw
from their buying contracts. In addition, ship operators
suffer from substantial bunkering price increases that
As a result, the industry has experienced aggressive
pricing policies of boxship operators competing for
market shares.2 Many box carriers are still operating
trade routes and/or raise prices for shippers. An
increases of between $200 and $400 on routes
linking Asia to Northern Europe and Western Africa.
Companies such as CMA CGM, CKYH and OOCL
cut their capacity on the transatlantic lanes.3 These
measures did not, however, lead to a substantial
freight rate increase in the overall container shipping
market in 2011. It is estimated that the total loss to the 4
High-volume routes, in particular, are experiencing an
increasing competition. Operators place their largest
ships in these networks and aim at offering more regular
services. As a result, shipping lines build alliances to
share costs, bundle capacity and streamline their
operations. Examples of this industry trend include the
partnership of MSC and CMA CGM, or the merging
of Asia–Europe services between the Grand Alliance
(Hapag-Lloyd, NYK and OOCL) and the New World
Alliance (HMM, APL and MOL).5 Individual shipping
to remain competitive on the world’s busiest shipping
lanes. Furthermore, with a growth rate predicted at
large-scale capacity is continuing to enter this market
segment.6
Container ship operators entering the reeferbusiness
The decline in freight rates in the container shipping
business increasingly puts competitive pressures
on specialized reefers. Refrigerated cargo is used
some of the idle capacity in the business. This trend
contains an increasing share of vessels with large
reefer capacity (see also chapter 2).7
Industry-leader reefers such as Star Reefers have
described 2011, as for 2010, as one of the poorest
years in the industry’s history, companies being hit
hard by the low freight rates and increased competition
from container ship operators.8 The spot market
rates for larger reefer ships reached an average of 43
cents per cubic feet per 30 days in 2011, following
42 cents in 2010.9 The near collapse of banana
exports from Ecuador and Central America since April
2011 brought additional stress to reefer freight rates.
Although a strong growth in demand for the transport
of perishable goods is being predicted, the shipping
industry will most likely also experience an ongoing
cargo shift from specialized reefers to container
ships. International container lines are constantly
introducing new regular services for the transportation
centres with the largest consumer markets, such as
Europe and North America. According to Drewry, in
will be transported by container ships, these providing
capacity.10
orderbook for specialized

CHAPTER 3: FREIGHT RATES AND MARITIME TRANSPORT COSTS 59
Source: Compiled by the UNCTAD secretariat, using the New ConTex index produced by the Hamburg Shipbrokers’ Association. See http://www.vhss.de.
Note: from six ConTex assessments, including the following ship sizes: 1,100, 1,700, 2,500, 2,700, 3,500 and 4,250 TEUs.
Source: Compiled by UNCTAD secretariat on the basis of data from Clarkson Container Intelligence Monthly, various issues.
Note:
0
200
400
600
800
1 000
1 200
10.2
007
12.2
007
02.2
008
04.2
008
06.2
008
07.2
008
09.2
008
11.2
008
01.2
009
03.2
009
05.2
009
07.2
009
09.2
009
11.2
009
01.2
010
03.2
010
05.2
010
07.2
010
08.2
010
10.2
010
12.2
010
02.2
011
04.2
011
06.2
011
08.2
011
10.2
011
11.2
011
01.2
012
03.2
012
-10
-5
0
5
10
15
Demand 10.7 2.4 10.5 11.6 13.4 10.6 11.2 11.4 4.2 -9 12.8 7.1 4.8
Supply 7.8 8.5 8 8 8 10.5 13.6 11.8 10.8 4.9 8.1 6.7 6.7
2000 2001 2002 2003 2004 2005 2006 2007 2008 2009 2010 2011 2012
REVIEW OF MARITIME TRANSPORT 201260
Ship type and sailing speed(TEUs)
Yearly averages
2002 2004 2005 2006 2007 2008 2009 2010 2011
Gearless
200–299 (min 14 kn) 16.9 19.6 25.0 31.7 26.7 27.2 26.0 12.5 12.4 12.4
300–500 (min 15 kn) 15.1 17.5 21.7 28.3 21.7 22.3 20.0 8.8 9.9 12.8
Geared/gearless
2 000–2 299 (min 22 kn) 4.9 9.8 13.8 16.4 10.5 11.7 10.0 2.7 4.8 6.3
2 300–3 400 (min 22.5 kn) 6.0 9.3 13.2 13.0 10.2 10.7 10.7 4.9 4.7 6.2
Geared
200–299 (min 14 kn) 17.0 18.9 27.0 35.4 28.0 29.8 32.1 16.7 18.3 22.1
300–500 (min 15 kn) 13.4 15.6 22.2 28.8 22.0 21.3 21.4 9.8 11.7 15.4
9.3 12.3 19.6 23.7 16.6 16.1 15.6 6.6 8.4 11.2
700–999 (min 18 kn) 9.1 12.1 18.4 22.0 16.7 16.9 15.4 6.0 8.5 11.5
800–999 (min 18 kn) n.a. n.a. n.a. n.a. n.a. n.a. n.a. 4.9 7.8 10.8
1 000–1 260 (min 18 kn) 6.9 11.6 19.1 22.6 14.3 13.7 12.2 4.0 5.9 8.7
1 261–1 350 (min 19 kn) n.a. n.a. n.a. n.a. n.a. n.a. n.a. 3.7 4.9 8.1
1 600–1 999 (min 20 kn) 5.7 10.0 16.1 15.8 11.8 12.8 10.8 3.5 5.0 6.8
Ship type and sailing speed(TEUs)
averagesfor 2012
Jan Feb Apr Jun Jul Aug Sep Oct Nov Dec Jan Feb
Gearless
200–299(min 14 kn)
13.3 14.4 14.9 15.6 15.7 13.8 15.4 15.5 14.3 15.1 12.6 14.4 13.1 14.4
300–500(min 15 kn)
11.3 12.3 13.4 14.4 14.4 14.1 13.6 13.1 12.6 12.4 11.9 10.3 9.8 12.3
Geared/gearless
2 000–2 299 (min 22 kn)
6.6 7.3 7.4 8.2 7.5 7.8 6.6 6.3 5.1 4.8 4.3 3.6 3.4 7.3
2 300–3 400 (min 22.5 kn)
7.6 8.5 9.1 8.6 8.7 8.1 6.7 5.1 3.3 2.7 2.7 2.7 3.0
Geared
200–299(min 14 kn)
22.1 22.9 22.5 22.5 27.2 24.7 23.0 22.1 20.5 19.5 19.1 19.1 13.5 22.9
300–500(min 15 kn)
17.2 16.1 17.2 15.5 15.3 18.2 17.1 15.4 14.6 13.2 13.6 11.4 12.3 16.1
600–799 (min 10.4 12.9 12.6 12.4 13.4 12.7 11.7 11.3 10.6 9.8 8.9 7.9 7.4 12.9
700–999(min 18 kn)
11.9 12.7 13.4 13.8 13.5 13.3 12.3 11.0 10.4 9.5 8.7 7.8 7.7 12.7
800–999(min 18 kn)
10.3 12.7 12.2 12.3 12.4 12.1 11.8 10.8 9.8 9.0 8.7 7.1 7.3 12.7
1 000–1 260 (min 18 kn)
7.5 8.7 9.9 10.1 10.4 10.3 9.6 8.9 8.4 7.9 6.9 6.2 6.3 8.7
1 261–1 350 (min 19 kn)
7.6 8.0 8.9 9.4 9.5 9.6 8.9 8.2 7.8 7.3 6.1 5.4 5.2
1 600–1 999 (min 20 kn)
6.7 7.5 7.9 7.8 8.0 8.0 7.3 6.9 6.2 5.7 4.8 4.4 4.1 7.5
Source: Compiled by the UNCTAD secretariat based on data from Shipping Statistics and Market Review, various issues from 2002–2012, produced by the Institute of Shipping Economics and Logistics, Bremen, Germany. See also www.isl.org.

CHAPTER 3: FREIGHT RATES AND MARITIME TRANSPORT COSTS 61
operating age below six years.11 Despite this fact, most
carriers were not willing to invest in modern vessels
In addition, an annual average of 36 reefer ships was
sent for scrapping between 2008 and 2010.12
2. Tanker freight rates
The tanker market, which encompasses the
transportation of crude oil and petroleum products,
represents approximately one third of the world
seaborne trade volume.
Freight rates for different ship sizes
in the tanker business, with substantial price gaps
The comparison of oil prices and tanker market freight
rates and oil prices trend in similar patterns.13 This is
because vessel bunkering contributes a large share
to the total ship operating costs (see also the vessel
world demand for oil and maritime transport services
are both strongly linked to overall economic growth.
During times of economic growth, the demand
for maritime transport services and oil increases
substantially, possibly outweighing, in parallel, their
demand and supply balance and thus leading to
price increases. In the past, seaborne trade has
grown approximately two times faster than the world’s
gross domestic product (GDP) (see also chapter 1).
Oil demand increases during periods of economic
energy for the transport of goods, but also because it
is used in some 70,000 manufactured products, such
as synthetic fabrics, plastics and medicines.
From 2009 onwards, however, a divergence between
the trends of oil price and freight rates can be
observed. While the crude oil price has recovered to
Source: Compiled by UNCTAD secretariat based on information from Clarkson Shipping Intelligence Network. Oil price data from United States of America Energy Information Administration, available at http://205.254.135.7/dnav/pet/pet_pri_spt_s1_w.htm.
Note: a modern tanker. Oil price is indexed with index base 150 in May 2001. Ship sizes are expressed in deadweight capacity
Oil price
47 000 dwt
0
100
200
300
400
500
600
700
800
01.2
001
06.2
001
10.2
001
03.2
002
08.2
002
01.2
003
06.2
003
10.2
003
03.2
004
08.2
004
01.2
005
06.2
005
11.2
005
03.2
006
08.2
006
01.2
007
06.2
007
11.2
007
04.2
008
08.2
008
01.2
009
06.2
009
11.2
009
04.2
010
09.2
010
01.2
011
06.2
011
11.2
011
04.2
012
310 000 dwt
150 000 dwt

REVIEW OF MARITIME TRANSPORT 201262
pre-crisis levels, tanker freight rates have not shown
substantial signs of recovery. On the contrary, freight
rates on most routes can be seen to have decreased
behind these discrepancies.
Freight rates on different trade routes
Freight rates vary on different trade routes depending
sizes. Developments on some of these routes will be
presented in this section.
cent of seaborne petroleum trade, were transported
through the Persian Gulf in 2011, making it the world’s
busiest shipping strait for this product.14 In terms of
crude carrier (VLCC) trips have passed through the
Persian Gulf.15 Transport restrictions due to the
oil embargo on the Islamic Republic of Iran could,
therefore, heavily affect the world tanker shipping
market as a whole. The cut in transport demand for
oil from the Islamic Republic of Iran was expected
to trigger freight rate drops. However, prices on the
Persian Gulf–Europe route, as an example, rose from
37 to 44 on the Worldscale from February to April
ramped up oil production to compensate for the drop
in exports from the Islamic Republic of Iran. Other oil
Africa, the Caribbean and the North Sea region. The
routes from these sources to Asia are much longer
than those from the Persian Gulf, thus increasing
tanker ton miles and capacity utilization rates.16 With
oil-consuming countries such as the United States and
China building up their energy reservoirs, additional
vessels have been taken out of the spot market.17
Freight rates on routes from West Africa were exposed
to volatilities in 2011, with drops in the West Africa–
North-West Europe route from 107 on the Worldscale
in March to 69 in August. Increasing demand for cargo
and resistance of Suezmax tanker owners to accept
2011
ExchangeBaltic Tanker
150 110 74 48 Dirty Index Clean Index
January 30 250 24 375 17 875 14 750 13 000 842 635
February 29 500 21 750 16 875 14 750 13 000 660 642
March 30 000 21 000 16 125 15 188 13 188 965 749
April 30 000 21 000 16 000 15 800 13 700 927 836
May 27 250 21 500 15 812 15 562 14 250 822 882
June 26 125 21 000 15 375 15 500 14 250 750 706
July 25 800 18 600 15 450 15 450 14 150 746 690
August 22 125 17 000 15 312 14 875 13 875 720 682
September 21 000 17 700 15 050 14 650 13 850 677 679
October 19 750 18 250 14 500 14 000 13 688 704 721
November 19 562 17 750 13 938 13 438 13 250 763 721
December 19 000 16 300 13 600 13 000 13 650 784 725
Average 2011 25 030 19 685 15 493 14 747 13 654 780 722
January 19 250 16 000 13 625 13 000 14 000 783 762
February 20 375 16 000 13 938 13 000 14 250 803 645
March 20 700 16 400 13 650 13 000 14 250 781 711
April 22 750 17 000 13 750 12 500 14 250 819 645
Source: Daily time charter rates expressed as monthly averages are based on information from Clarkson Shipping Intelligence Network.
Note:

CHAPTER 3: FREIGHT RATES AND MARITIME TRANSPORT COSTS 63
Vess
el t
ype
Rou
tes
2010
2011
2012
Dec
Jan
Feb
Apr
Jun
Jul
Aug
Sep
tO
ctN
ovD
ec
Perc
enta
ge
chan
geD
ec 2
011/
Dec
201
0
Jan
Feb
Apr
Pers
ian
Gul
f–Ja
pan
6148
7463
5051
5350
48
4550
5759
6752
5963
Pers
ian
Gul
f–Re
publ
ic o
f Kor
ea56
5055
6049
4954
48
4643
4654
5761
5158
58
Pers
ian
Gul
f–Eu
rope
5734
37..
3838
4343
39
3432
34..
....
3540
44
“Per
sian
Gul
f–C
arib
bean
/Eas
t Coa
st
of N
orth
Am
eric
a”36
3237
4238
3739
37
3534
3339
3740
3435
42
118
6375
107
8384
..74
69
7089
7986
9177
8768
“Wes
t Afr
ica–
Car
ibbe
an/E
ast C
oast
of
Nor
th A
mer
ica”
103
6072
101
7981
6669
66
6984
7583
8575
8465
Med
iterr
anea
n–M
edite
rran
ean
113
7182
130
8680
7475
69
8111
074
8698
8684
73
162
8897
121
107
110
9810
2 98
9611
710
412
211
193
9599
Ea
st C
oast
of N
orth
Am
eric
a”12
013
190
109
9510
280
..92
..98
92..
..11
999
....
“Car
ibbe
an–
Car
ibbe
an/E
ast C
oast
of
Nor
th A
mer
ica”
146
125
9812
512
310
498
110
113
9010
410
411
211
812
911
213
1
Med
iterr
anea
n–M
edite
rran
ean
138
7597
122
9599
9488
90
8712
787
130
105
8210
494
133
6910
313
585
9084
86
8884
138
8411
897
8210
591
Indo
nesi
a–Fa
r Ea
st11
188
8711
011
599
9898
96
9191
102
104
100
9060
85
Med
iterr
anea
n–M
edite
rran
ean
168
140
116
134
155
138
130
132
107
119
135
134
153
147
157
147
140
“Med
iterr
anea
n–C
arib
bean
/Eas
t Coa
st
of N
orth
Am
eric
a”14
613
411
114
713
913
311
611
5 11
511
411
612
512
112
412
111
812
7
“Car
ibbe
an–
East
Coa
st o
f
Nor
th A
mer
ica/
Gul
f of M
exic
o”20
015
510
517
415
513
912
811
8 12
212
412
114
113
311
314
814
513
1
All
clea
n ta
nker
s
Pers
ian
Gul
f–Ja
pan
125
107
9810
512
312
911
112
5 12
412
411
510
010
510
086
8491
Pers
ian
Gul
f–Ja
pan
128
119
111
122
142
145
124
125
142
133
114
118
119
107
101
100
117
“Car
ibbe
an–
East
Coa
st o
f
Nor
th A
mer
ica/
Gul
f of M
exic
o”15
813
312
019
019
117
115
215
2 15
513
615
116
715
515
016
515
215
5
Sing
apor
e–Ea
st A
sia
193
139
135
159
185
..17
7..
185
..23
421
6..
....
150
155
183
Sourc
e:
UN
CTA
D s
ecre
taria
t, b
ase
d o
n D
rew
ry’s
Ship
pin
g In
sight,
vario
us
issu
es.
Note
:
size
, est
imate
d in
div
idually
for
each t
anke
r ro
ute
.
REVIEW OF MARITIME TRANSPORT 201264
lower freight rates pushed price levels up again to 89
on the Worldscale in October.18 While piracy along
the Gulf of Guinea was almost non-existent about 10
years ago, it has become an issue of growing concern,
leading to insurance premium increases for vessels
operating in the region.19 Expenses for rerouting to
avoid high-risk piracy areas and investment in security
piracy. Ships also navigate at higher speeds to avoid
18 knots or higher.20 The direct costs of piracy for the
maritime industry were estimated to have reached a 21
The International Maritime Organization (IMO) reported
46 piracy incidents in 7 countries in 2010 along the
Gulf of Guinea. This number expanded to 64 incidents
in 9 countries in 2011.22
Freight rates on export routes from the Mediterranean
dropped in mid-2011 compared with the previous
year. Price increases during 2011 were mostly
caused by exceptional events and do not imply a
long-term change in the market. The freight-level
unrest and military operations in Libya that pushed
buyers to ship their cargo out of the country. Due
to the war, oil-extraction volumes dropped in Libya
barrels per day. This dragged the freight rates
recovery.23 The rally in freight rates in October was
triggered by congestions on the Bosporus Strait,
which is one of the maritime choke points for oil
shipments. These were caused by bad weather
conditions, which increased tanker freight prices
across the Mediterranean and on routes out of West
bottleneck on Suezmax tankers every day.24
Saint Croix, one of the United States Virgin Islands,
caused short-term freight rate drops on the route
linking the Caribbean to the United States Atlantic
Coast. The closure has been caused by the economic
emerging markets.25 The facility will now be used as a
market will have to be imported from more distant
sources to compensate for the capacity loss. This can
positively affect product tanker freight rates on long-
Asia. The added ton-miles may also increase freight
rates within the product tanker market as a whole.26
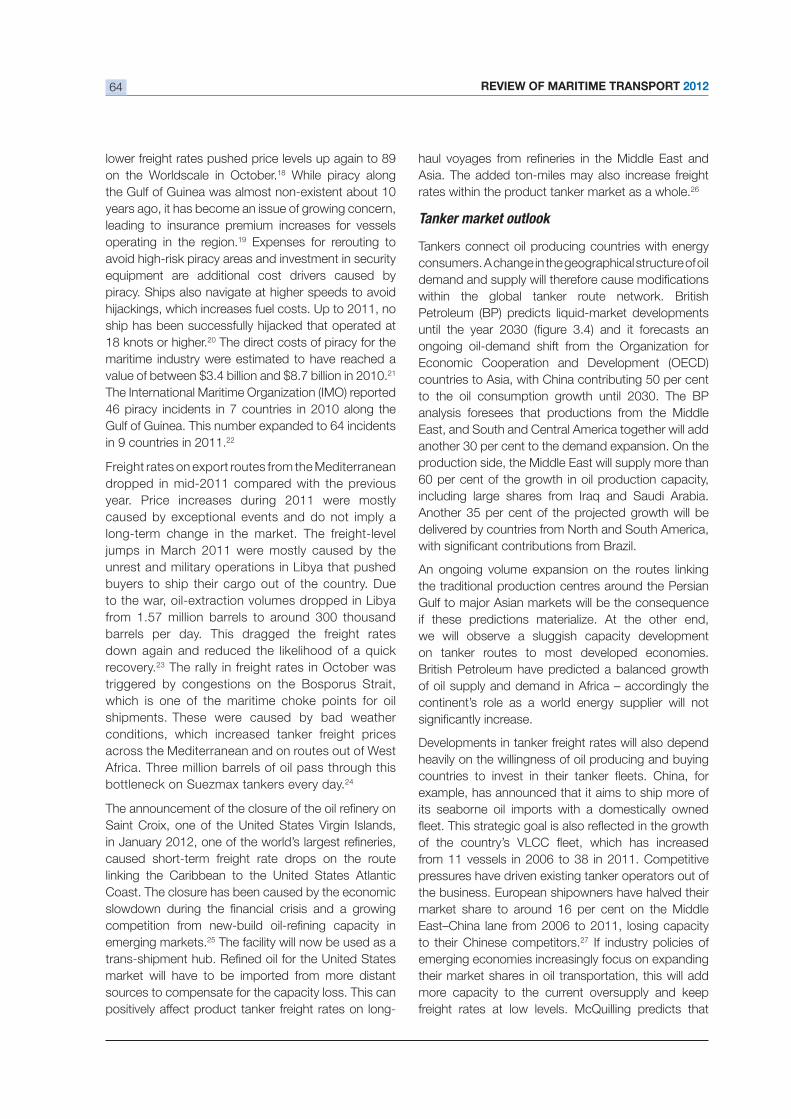
Tanker market outlook
Tankers connect oil producing countries with energy
consumers. A change in the geographical structure of oil
within the global tanker route network. British
ongoing oil-demand shift from the Organization for
Economic Cooperation and Development (OECD)
to the oil consumption growth until 2030. The BP
analysis foresees that productions from the Middle
East, and South and Central America together will add
production side, the Middle East will supply more than
delivered by countries from North and South America,
An ongoing volume expansion on the routes linking
the traditional production centres around the Persian
if these predictions materialize. At the other end,
we will observe a sluggish capacity development
on tanker routes to most developed economies.
British Petroleum have predicted a balanced growth
of oil supply and demand in Africa – accordingly the
continent’s role as a world energy supplier will not
Developments in tanker freight rates will also depend
heavily on the willingness of oil producing and buying
example, has announced that it aims to ship more of
its seaborne oil imports with a domestically owned
from 11 vessels in 2006 to 38 in 2011. Competitive
pressures have driven existing tanker operators out of
the business. European shipowners have halved their
East–China lane from 2006 to 2011, losing capacity
to their Chinese competitors.27 If industry policies of
emerging economies increasingly focus on expanding
their market shares in oil transportation, this will add
more capacity to the current oversupply and keep
freight rates at low levels. McQuilling predicts that

CHAPTER 3: FREIGHT RATES AND MARITIME TRANSPORT COSTS 65
tanker freight rates will continue to be under pressure,
estimating a total delivery of 767 tankers over the next
pronounced among larger ship sizes with a forecasted
number of 62 VLCCs and 43 Suezmax entering the
market in 2012.28
3. Dry bulk freight rates
bulk includes iron ore, coal and grain, typically
transported by large Capesize and Panamax vessels.
They contribute about two thirds of the world dry bulk
trade. Minor bulks include fertilizers, steel products,
construction materials such as cement and aluminium,
non-grain agricultural products, forest products and
sundry minerals (for example, phosphate rock), these
adding another third to the total dry bulk seaborne
trade. These goods are most commonly shipped by
the smaller Handymax and Handysize vessels.29
The increasing vessel utilization rate reinforced hopes
of a market recovery in mid-2011. This indicator
environment.30
in the development of the Baltic Exchange Dry Index
from 1,256 points to 2,173 points in October. One
of several factors behind the rally was the increasing
Asian demand for iron ore and coal.31 Japan, for
example, increased its imports of these raw materials
for reconstruction of areas affected by destruction as 32 However,
this has been a short-lived trend. Since October a
continuous decrease of the index can be observed,
persisting until February 2012 where it reached its
bottom value of 647 points.
individual ship class, large gaps in freight rates occur
between the different dry bulk vessel segments. Small
dry bulk carriers performed better than their larger
section, to look at the individual developments within
the four segments: Handysize, Supramax, Panamax
and Capesize.
Source: UNCTAD secretariat based on BP Energy Outlook 2030.
3 600
3 800
4 000
4 200
4 400
4 600
4 800
NorthAmerica
AsiaPacific
Demand2010
Decline2030
Increase2030
Supply2010
World liquidDemand
World liquidSupply
Million tonnes
MiddleEast
S&C Amer.
Asia Pacific
Decline2030
Increase2030
Europe &Eurasia
Africa
Europe&Eurasia
Africa
S&CAmerica
MiddleEast
NorthAmerica

REVIEW OF MARITIME TRANSPORT 201266
Source: UNCTAD, based on London Baltic Exchange data.
Note: The index is made up of 20 key dry bulk routes measured on a time charter basis. The index covers Handysize, Supramax, Panamax and Capesize dry bulk carriers, carrying commodities such as coal, iron ore and grain.
Source: Note:
four T/C routes; Capesize: average of the four T/C routes.
0
500
1 000
1 500
2 000
2 500
3 000
3 500
4 000
4 500
01Ja
nuar
y20
10
19Ja
nuar
y20
10
17Fe
brua
ry20
10
15M
arch
2010
10Ap
ril20
10
08M
ay20
10
07Ju
ne20
10
03Ju
ly20
10
21Ju
ly20
10
17Au
gust
201
0
14Se
ptem
ber2
010
11Oc
tobe
r201
0
08No
vem
ber2
010
05De
cem
ber2
010
06Ja
nuar
y20
11
05Fe
brua
ry20
11
04M
arch
2011
22M
arch
2011
18Ap
ril20
11
18M
ay20
11
16Ju
ne20
11
08Ju
ly20
11
03Au
gust
201
1
30Au
gust
201
1
23Se
ptem
ber2
011
19Oc
tobe
r201
1
14No
vem
ber2
011
08De
cem
ber2
011
11Ja
nuar
y20
12
06Fe
brua
ry20
12
01M
arch
2012
27M
arch
2012
24Ap
ril20
12
21M
ay20
12
0
10'000
20 000
30 000
40 000
50 000
60 000
04.2
010
05.2
010
06.2
010
07.2
010
08.2
010
09.2
010
09.2
010
10.2
010
11.2
010
12.2
010
01.2
011
02.2
011
03.2
011
04.2
011
05.2
011
06.2
011
07.2
011
07.2
011
08.2
011
09.2
011
10.2
011
11.2
011
12.2
011
01.2
012
02.2
012
03.2
012
04.2
012
05.2
012
Supramax
Handysize
Capesize

CHAPTER 3: FREIGHT RATES AND MARITIME TRANSPORT COSTS 67
Capesize vessels
different vessel sizes described in this section. The
results underline that Capesize vessels are facing the
to smaller bulk ships. From January 2011, daily
earnings of Capesize carriers dropped over a period
of several months to levels below those of the smaller
Handysize, Supramax and Panamax ships.33 This can
According to Baltic Exchange, between 2000 and
2008 Capesize vessels have constantly reached
higher daily earnings than smaller ships. On 5 June
2008, Baltic Exchange reported record earnings for
Capesize vessels of $244,000 per day. Four years
later, in May 2012, the same ships could be chartered
for around $8,000 dollars.
segment are often the result of demand volatility
in the coal and iron-ore market, these being goods
typically transported by large bulk carriers. Low raw
material prices most commonly indicate a sluggish
world demand for these goods. However, in 2011,
prices for iron ore were are at highs ($140.4 per ton in
February 2012).34 In addition, thermal coal prices had
2012.35 Therefore, the supply-side overcapacity in
the largest dry bulk segment appears again as the
decisive factor precipitating current declines in freight
rate.36 Bulk carriers accounted for two thirds of all
newbuildings delivered in 2011. Recent investment
pressures in the Capesize segment. The orderbook
37 Competitive pressures are also triggered by
Large Capesize vessels are restricted to navigate
between a few ports mostly located in Australia,
China and Brazil.38
route between these countries can therefore cause
as a whole.
Panamax vessels
Freight rates in the Panamax segment have been
exposed to a long-term downward trend. Clarksons
counted 1,632 Panamax bulkers at the beginning of
2010 and during the same period the Baltic Exchange
to a $11,000–$15,000 corridor.39 In 2012, this trend
2,035 ships and the average daily time charter rate
of below $9,000 reached its lowest level since July
2008.40
The turbulent economic environment and mild weather
conditions in Europe reduced the coal demand from the
continent, thus leading to weak prices on the Atlantic
route in early 2012. Per-day charges fell to $4,000 on
the Baltic Exchange United States–Europe/Europe–
more than a factor of two, this also provoked by the
demand for coal shipments from Indonesia to Asia.41
With the grain season ramping up in March in South
America, freight rates on the spot market have risen,
but this momentum has been lost again in May with
the ebbing of the season.42
Supramax vessels
Supramax vessels increasingly compete with
Panamax ships. This is due to their growing size. In
2008, Supramax vessels had an average capacity of
handed over from shipyards reach a capacity of
cranes on board for loading and unloading, which can
be an advantage in small and medium-sized ports
in developing countries that often do not provide 43 The competitiveness of
Supramax vessels when compared to Panamax is 44 The
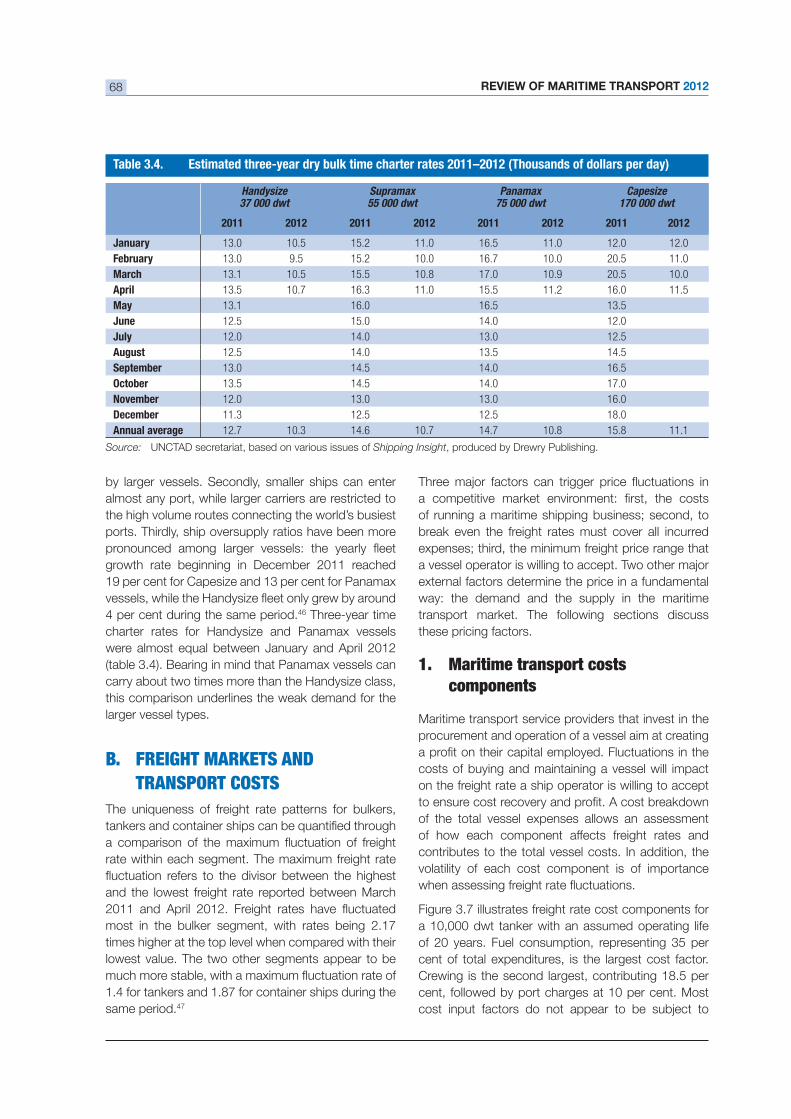
estimated three-year dry bulk time charter rates in
2011 were higher in 6 out of 12 months for Supramax 45 However,
the segment also experienced a steep cut in freight
rate, with daily rates falling from $12,296 at the end of
2011 to $6,348 in February 2012. Nevertheless, the
has been more sustainable, reaching earnings mostly
Handysize vessels have been more resilient in the bleak
advantages. They can load more than 30 cargo types,
compared to only a handful of different goods carried
REVIEW OF MARITIME TRANSPORT 201268
by larger vessels. Secondly, smaller ships can enter
almost any port, while larger carriers are restricted to
the high volume routes connecting the world’s busiest
ports. Thirdly, ship oversupply ratios have been more
growth rate beginning in December 2011 reached
46 Three-year time
charter rates for Handysize and Panamax vessels
carry about two times more than the Handysize class,
this comparison underlines the weak demand for the
larger vessel types.
B. FREIGHT MARKETS AND
TRANSPORT COSTS
rate within each segment. The maximum freight rate
and the lowest freight rate reported between March
most in the bulker segment, with rates being 2.17
times higher at the top level when compared with their
lowest value. The two other segments appear to be
1.4 for tankers and 1.87 for container ships during the
same period.47
of running a maritime shipping business; second, to
break even the freight rates must cover all incurred
expenses; third, the minimum freight price range that
external factors determine the price in a fundamental
way: the demand and the supply in the maritime
transport market. The following sections discuss
these pricing factors.
1. Maritime transport costscomponents
Maritime transport service providers that invest in the
procurement and operation of a vessel aim at creating
costs of buying and maintaining a vessel will impact
on the freight rate a ship operator is willing to accept
of the total vessel expenses allows an assessment
of how each component affects freight rates and
contributes to the total vessel costs. In addition, the
volatility of each cost component is of importance
cent of total expenditures, is the largest cost factor.
Source: UNCTAD secretariat, based on various issues of Shipping Insight, produced by Drewry Publishing.
Supramax Panamax Capesize
2011 2012 2011 2012 2011 2012 2011 2012
January 13.0 10.5 15.2 11.0 16.5 11.0 12.0 12.0
February 13.0 9.5 15.2 10.0 16.7 10.0 20.5 11.0
13.1 10.5 15.5 10.8 17.0 10.9 20.5 10.0
April 13.5 10.7 16.3 11.0 15.5 11.2 16.0 11.5
13.1 16.0 16.5 13.5
June 12.5 15.0 14.0 12.0
July 12.0 14.0 13.0 12.5
August 12.5 14.0 13.5 14.5
September 13.0 14.5 14.0 16.5
October 13.5 14.5 14.0 17.0
November 12.0 13.0 13.0 16.0
December 11.3 12.5 12.5 18.0
Annual average 12.7 10.3 14.6 10.7 14.7 10.8 15.8 11.1

CHAPTER 3: FREIGHT RATES AND MARITIME TRANSPORT COSTS 69
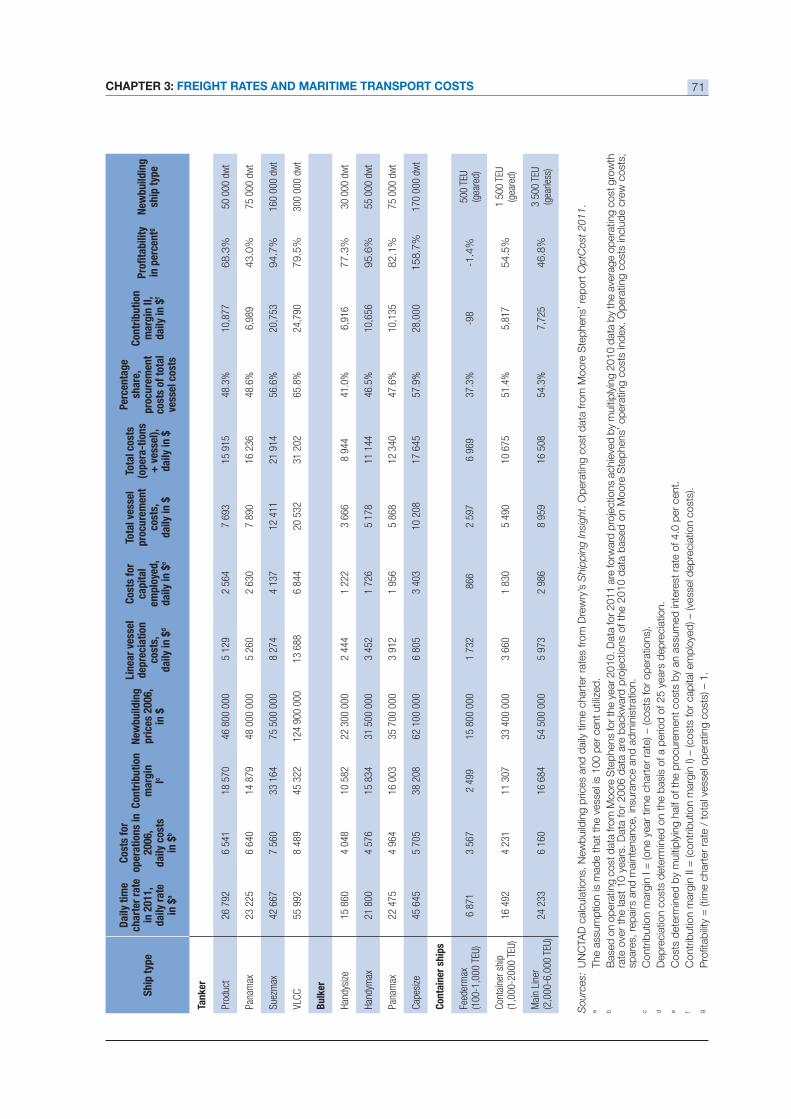
2. Maritime transport cost andrevenue comparison
Based upon the information from the freight rate
cost breakdown, a more comprehensive cost and
revenue comparison is conducted below for the three
shipping sectors and their different vessel sizes. Such
cost structures for different vessel types and potential
illustrates the results of the calculations for 2006 and
2011.
The yearly time charter rate represents the revenue
side of the analysis. The ship operating costs have
been derived from a yearly survey that is based on
indications from ship operators, owners and brokers
for over 2,600 vessels.48 As bunker costs and port
handling charges are usually not included in the time
charter rates, these expenses have also been excluded
from the calculations. Assumptions have been made
utilization rates, interest rates or the commercial life
expectancy of the ship, with the aim of obtaining a
comparable dataset.49
Results for 2011
of scale that can be reached with large scale vessels.
Panamax tankers, for example, reported daily ship
operating costs of $8,871 while the same expenses
for the four-times-larger VLCC tanker were less than
that the share of vessel procurement costs as a
percentage of the total vessel costs increases with
Capesize carrier.
year’s unfavourable economic environment for
maritime transport service providers and show that
rates. Only the bulker segment has estimated positive
margins. The results also show that, in 2011, larger
Source: Data received from a ship operator in February 2012.
Note: Figures refer to share of cost component as a percentage of total costs. Results are based on the assumption that the ship is staffed with a Turkish crew. Relative costs depend on many factors that may change over time.
Port charges, 10.00%
Crewing, 18.50%
Bunkers, 35.00%
Classification, 1.99%
Registration, 0.01%
Repair & Maintenance,6.50%
Insurance, 2.75%
Commissions, 6.25%
Ship procurement, 5.00%
Ship financing, 2.00%
Management, 4.00%
Profit, 8.00%
0% 10% 20% 30% 40% 50% 60% 70% 80% 90% 100%

REVIEW OF MARITIME TRANSPORT 201270
Shi
p ty
pe
Dai
ly t
ime
char
ter
rate
in 2
011,
da
ily r
ate
in $
a
Cos
ts f
or
oper
atio
nsin
201
1,da
ilyin
$b
Con
trib
utio
n m
argi
n Ic
New
build
ing
pric
es20
11,
in $
Line
ar v
esse
l de
prec
iati
on
cost
s, d
aily
in
$d
Cos
ts f
orca
pita
lem
ploy
ed,
daily
in $
e
Tota
l ves
sel
proc
urem
ent
cost
s,da
ilyin
$
Tota
l cos
ts
(ope
rati
ons
daily
in $
Perc
enta
ge
shar
e,pr
ocur
emen
t co
sts
of t
otal
ve
ssel
cos
ts
Con
trib
utio
n m
argi
n II
, da
ilyin
$f
inpe
rcen
tg
New
build
ing
ship
type
Tank
er
Prod
uct
13 6
008
740
4 86
036
100
000
3 95
61
978
5 93
414 6
74
40.4
%-1
,074
-7.3
%
Pana
max
13
800
8 87
24
928
4450
0 00
04
877
2 43
87
315
16 1
87
45.2
%-2
,387
-14.7
%
Suez
max
19 7
0010
102
9 59
864
100
000
7 02
53
512
10 5
3720 6
39
51.1
%-9
39
-4.5
%
VLC
C24
650
11 3
4213
308
1013
00 0
0011
101
5 55
116
652
27 9
94
59.5
%-3
,344
-11.9
%
Bul
ker
Han
dysi
ze12
596
5 58
97
007
2480
0 00
02
718
1 35
94
077
9 6
66
42.2
%2,9
30
30.3
%
Han
dym
ax14
888
6 31
88
570
3000
0 00
03
288
1 64
44
932
11 2
50
43.8
%3,6
38
32.3
%
Pana
max
14 8
636
854
8 00
932
600
000
3 57
31
786
5 35
912 2
13
43.9
%2,6
50
21.7
%
Cap
esiz
e16
354
7 87
68
478
5160
0 00
05
655
2 82
78
482
16 3
58
51.9
%-4
0.0
%
Con
tain
er s
hips
Feed
erm
ax4
250
4 65
611
400
000
1 24
9 6
251
874
6 5
30
28.7
%-2
,280
-34.9
%500 T
EU
(geare
d)
Con
tain
er s
hip
9 82
55
522
4 30
327
400
000
3 00
31
501
4 50
410 0
26
44.9
%-2
01
-2.0
%1 5
00 T
EU
(g
eare
d)
Mai
n Li
ner
14 4
798
040
6 43
945
600
000
4 99
72
499
7 49
615 5
36
48.2
%-1
,057
-6.8
%3 5
00 T
EU
(gearle
ss)
CHAPTER 3: FREIGHT RATES AND MARITIME TRANSPORT COSTS 71
Shi
p ty
pe
Dai
ly t
ime
char
ter
rate
in
201
1,
daily
rat
e in
$a
Cos
ts f
or
oper
atio
ns in
20
06,
daily
cos
ts
in $
b
Con
trib
utio
n m
argi
nIc
New
build
ing
pric
es 2
006,
in
$
Line
ar v
esse
l de
prec
iati
on
cost
s,da
ily in
$d
Cos
ts f
orca
pita
lem
ploy
ed,
daily
in $
e
Tota
l ves
sel
proc
urem
ent
cost
s,da
ily in
$
Tota
l cos
ts
(ope
ra-t
ions
daily
in $
Perc
enta
gesh
are,
pr
ocur
emen
t co
sts
of t
otal
ve
ssel
cos
ts
Con
trib
utio
n m
argi
n II
, da
ily in
$f
in p
erce
ntg
New
build
ing
ship
typ
e
Tank
er
Prod
uct
26 7
926
541
18 5
7046
800
000
5 1
29 2
564
7 6
93 1
5 91
510
,877
68.3
%
Pana
max
23
225
6 64
014
879
48 0
00 0
00 5
260
2 6
30 7
890
16
236
6,98
943.0
%
Suez
max
42 6
677
560
33 1
6475
500
000
8 2
74 4
137
12
411
21
914
20,7
5394.7
%
VLC
C55
992
8 48
945
322
124
900
000
13
688
6 8
44 2
0 53
2 3
1 20
224
,790
79.5
%
Bul
ker
Han
dysi
ze15
860
4 04
810
582
22 3
00 0
00 2
444
1 2
22 3
666
8 9
446,
916
77.3
%
Han
dym
ax21
800
4 57
615
834
31 5
00 0
00 3
452
1 7
26 5
178
11
144
10,6
5695.6
%
Pana
max
22 4
754
964
16 0
0335
700
000
3 9
12 1
956
5 8
68 1
2 34
010
,135
82.1
%
Cap
esiz
e45
645
5 70
538
208
62 1
00 0
00 6
805
3 4
03 1
0 20
8 1
7 64
528
,000
158.7
%
Con
tain
er s
hips
Feed
erm
ax6
871
3 56
72
499
15 8
00 0
00 1
732
866
2 5
97 6
969
-1.4
%50
0 TE
U(g
eare
d)
Con
tain
er s
hip
16 4
924
231
11 3
0733
400
000
3 6
60 1
830
5 4
90 1
0 67
55,
817
54.5
%1
500
TEU
(gea
red)
Mai
n Li
ner
24 2
336
160
16 6
8454
500
000
5 9
73 2
986
8 9
59 1
6 50
87,
725
46.8
%3
500
TEU
(gea
rless
)
Sourc
es:
UN
CTA
D c
alc
ula
tions.
New
build
ing p
rices
and
daily
tim
e c
hart
er
rate
s from
Dre
wry
’s S
hip
pin
g In
sight.
Op
era
ting c
ost
data
fro
m M
oore
Ste
phens’
rep
ort
Op
tCost
2011
.a b
spare
s, r
ep
airs
and
main
tenance, in
sura
nce a
nd
ad
min
istr
atio
n.
c dD
ep
recia
tion c
ost
s d
ete
rmin
ed
on t
he b
asi
s of a p
erio
d o
f 25 y
ears
dep
recia
tion.
e fC
ontr
ibutio
n m
arg
in II
= (contr
ibutio
n m
arg
in I)
– (cost
s fo
r cap
ital e
mp
loye
d) –
(vess
el d
ep
recia
tion c
ost
s).
g

REVIEW OF MARITIME TRANSPORT 201272
than smaller vessels. The reason for this is that, in
2011, the advantage of economies of scale has been
offset by a pronounced oversupply of larger vessels,
particularly in the bulker segment. When interpreting
these numbers, it should to be taken into consideration
that the calculations are based on the assumption that
among most operators utilization rates were much
lower in 2011, which would translate into even lower
Results for 2006
The calculations for 2006 illustrate that the cost and
higher. The yearly time charter rate for a Capesize tanker
stood at an average of $45,645 in 2006 and reached
lower operating costs, which demonstrated moderate
tonnage, pushing up vessel prices. Hence, the share
of ship procurement costs as a percentage of the total
vessel expenses was considerably higher in 2006. The
same type of vessel.
Second-hand prices were exposed to even higher
between the ship being sold and handed over. Buyers
positive business environment, making them willing to
accept elevated second-hand prices. A contrary effect
occurs if freight rates are low: second-hand prices will
then drop due to a lack of investors who are willing
with freight rates, second-hand values have been
exposed to losses – the price for a Capesize ship,
effect of economies of scale on freight rates. In addition,
their impact on the overall vessel expenses have been
observed underlines the large impact of structural
changes in demand and supply on the maritime shipping
Type and size of vessel 2004 2005 2006 2007 2008 2009 2010 2011Percentage
change2011/2010
5 years old 25 35 44 47 40 51 30 26 28 7.7
Oil tanker – Suezmax, 43 60 72 76 87 95 59 62 54
5 years old 60 91 113 116 124 145 84 86 77
10 years old 9 11 12 14 23 23 20 13 11
LPG carrier – 15 000 m ,10 years old
21 23 30 39 40 39 30 25 26 4.0
10 years old 10 15 20 20 28 31 17 20 17
5 years old 20 35 40 39 83 70 31 25 31 24.0
5 years old .. .. .. .. .. .. 47 54 43
Container – geared, 500 TEUs,10 years old
5 7 11 10 9 13 4 6 7 16.7
Container – gearless, 2 500 TEUs, 10 years old
20 29 39 41 24 36 18 23 30 30.4
10 years old 25 34 43 44 43 45 24 28 34 21.4
Source: Compiled by the UNCTAD secretariat on the basis of data from Drewry’s Shipping Insight.

CHAPTER 3: FREIGHT RATES AND MARITIME TRANSPORT COSTS 73
business, as discussed in the following section, when
commensurate demand is present.
3. Transport demand and supply
During different stages in the shipping market cycle,
diverging demand and supply lead to substantial
rates and the volume of new ship orders often evolve in
parallel. In times of high freight rates, ship owners tend
to invest in new vessel capacity, this being also due to
an increased willingness of banks to lend money, thus
expanding the orderbook. With an increasing supply of
for cargo, thus reducing the industry’s appetite to invest
in new vessel capacity.50 With this interplay between
supply and demand in mind, this section will assess
selected indicators for the two elements.
Growth rates of both supply (vessel capacity) and
In all three segments, vessel capacity has grown
faster than the seaborne trade volume. Between
2000 and 2011, bulk carrier supply expanded almost
two times faster than the transport demand. In the
tanker segment, this gap was even larger, with a
vessel capacity increasing 2.3 times faster than the
transported volume of goods. In the coming years,
the dry bulk sector in particular will experience high
rates under additional pressure within an already
oversupplied bulk shipping segment.
The supply side can also be assessed through a
comparison of indicators that describe the structure of
for example, reveals the degree of competition in the
Container shipping reaches the highest market
concentration levels out of all the three segments. The
cent of the world’s containerized shipping market.
On routes to remote regions with low trade volumes
in particular, this may lead to higher freight rates and
less volatile price reactions to changes in transport
lower in the bulk trade business, with the 19 largest
transport supply.
4. Freight costs in developingcountries
percentage of the total value of imported goods. The
results illustrate that although volatilities occur over
time, in the long term a tendency towards a lower ratio
Container ships Bulk carriers Tankers
Dem
and
and
supp
ly
Ø Transport supply growth per year
Ø Transport supply growth per year
Ø Transport demand growth per year(2000–2011, based on tons loaded)
Ø Transport demand growth per year(2009–2011, based on tons loaded)
conc
entr
atio
n (s
uppl
y si
de) Market share of the the top 3 companies n.a.
Market share of the the top 10 companies
Market share of shipping business
Sources: Growth in transport supply, transport demand and market shares from UNCTAD’s Review of Maritime Transport 2011;Lloyd’s List Intelligence.
a Data for 2010 from Review of Maritime Transport 2011, based on the number of containers shipped. b Data for 2008 from Tanker Operator Annual Review March 2009c

REVIEW OF MARITIME TRANSPORT 201274
between freight costs and value of goods has occurred
among all country groupings. Furthermore, the freight
rates share of developing countries tend to converge
to those of developed economies. Developing
Oceania achieved a transport cost share reduction
while the developing nations of America and Asia have
already reached a transport cost share approximately
exception from this trend of convergence is developing
Africa, with a stable ratio of freight costs to import value
Low productivity, high charges and congestions in
many African ports are some of the factors explaining
these discrepancies.51 Vessel operators tend to
pass these costs on to shippers when calculating
their freight rates. In addition, African ports are often
transport infrastructure.52
On the shipping side, the UNCTAD Liner Shipping
Connectivity Index (LSCI) (see also chapter 4) reveals
a lack of economies of scale and competition in many
African countries. African ports cannot host the largest
ships that offer the most competitive freight rates. The
relatively small number of alternative operators serving
most African ports results in low competitive pressure,
thus keeping freight rates high. Trade imbalances are
another factor contributing to higher freight rates in
Africa. With an import surplus for containerized cargo,
and exports that mostly comprise bulk goods, which
are transported by tankers and dry bulk carriers,
vessels can often only be fully utilized on one route.53
freight rate for a single trip that compensates their
expenditures for both the fronthaul and the backhaul
lanes.
C. POLICY OPTIONS TO REDUCE
MARITIME TRANSPORT COSTS
Transport costs remain an important component of
consumer. High maritime transport costs for imported
goods impact the price level of the basket of consumer
goods. Conversely, excessive freight rates for exports
affect the trade competitiveness of the products of a
country in the global markets. Hence, countries may
outbound maritime transport costs in their trade with
partners, as discussed below.
Source: UNCTAD.
4
6
8
10
12
14
Developing Africa 12.3 12.55 12.83 12.63 12.38 12.18 12.18 12.18 12.23 12.49 12.78 12.92 13.21 13.1 12.46 11.91 11.55 11.02 10.56 10.89 10.78 10.72 10.74 10.68 10.66 10.77 10.93
Developing Oceania 11.52 11.55 11.78 12.34 11.95 11.61 12.12 12.05 11.4 11.66 11.74 11.35 11.32 11.6 12.08 12.22 11.61 11.16 11.03 10.41 9.893 9.567 9.397 8.864 8.817 8.47 8.559
Developing America 8.117 8.122 8.27 8.323 8.556 8.639 8.778 8.65 8.721 8.523 8.525 8.355 8.243 8.337 8.626 8.688 8.875 9.335 9.517 9.208 8.738 8.318 7.91 7.278 6.998 7.235 7.342
Developing Asia 8.867 8.959 9.039 8.714 8.665 8.628 8.802 8.784 9.034 9.466 9.614 9.526 9.563 9.378 8.817 8.561 8.288 8.07 7.954 8.035 8.049 7.945 7.799 7.913 7.924 7.932 7.894
Developed economies 7.479 6.899 6.537 6.515 6.232 6.402 6.688 6.954 6.887 7.152 7.523 7.622 7.801 7.524 7.021 6.61 6.26 5.886 6.065 6.339 6.388 6.448 6.51 6.389 6.264 6.244 6.517
1984 1985 1986 1987 1988 1989 1990 1991 1992 1993 1994 1995 1996 1997 1998 1999 2000 2001 2002 2003 2004 2005 2006 2007 2008 2009 2010

CHAPTER 3: FREIGHT RATES AND MARITIME TRANSPORT COSTS 75
The freight rate cost analysis, conducted for the case of
elements of freight rates and can assist when identifying
policy measures aimed at reducing individual cost
drivers. The policy options available to a single country
that could produce a substantial reduction of freight
rates are, nonetheless, limited. Vessel operators can
choose worldwide between many alternative suppliers
when procuring the goods and services they need for
their vessel operations, thus levelling comparative cost
advantages of individual destinations. In most large
ports, for instance, cheap fuelling services are offered
and, even if these services are not provided, a ship
can choose to use bunkering services at an alternative
destination. If one country alone were able to offer
level of other nations, these competitive advantages
or from that country. Hosting competitive insurance
service providers, for example, will not assist a country
to reduce its maritime transport costs. These cost
freight rates for all routes a vessel operator serves
within his shipping network.
When evaluating the elements comprising freight
countries can choose from, and by which maritime
effect on ship operating costs and freight rates.
Option 1 – developing coastal shipping
Individual countries can exercise only a limited
operates as an open market with very little regulation
other than relevant international rules on carrier
liability, security and safety. An exception to this is
these services through the design of ship registration
infrastructural investments such as the development
of a feeder port network.
In a market where cabotage is restricted to domestic
carriers only, ship operators have no choice but
to comply with the country’s regulatory set up. An
therefore directly affect operating costs. The potential
the United States Department of Transportation. It
estimates, for example, that the costs for United
54
Opening cabotage to international shipping lines is
another policy option. The entrance of new market
players may reduce freight rates for shippers and
lead to better and more diverse services. However,
most countries often give cabotage rights exclusively
to domestic carriers with the aim of protecting and
promoting the national shipping industry.
Another measure to support cabotage is the expansion
of a country’s feeder port network. This will facilitate
access of traders to coastal shipping and encourage
them to shift from land to maritime transport. The
increased volumes may lead to higher utilization rates
and lower freight rates.
Option 2 – developing port competitiveness
Countries with sea access can apply a wide range
of policies that aim at increasing the operational
This includes decisions on the legal and institutional
framework, the selection of an ownership model or the
allocation of funds for infrastructure investments. The
reforms should target all entities having a relevant role
in the port, such as the landlord, regulator, operator,
marketer and cargo handler, thus reducing port
charges related to each function.
The negotiation of a balanced concession agreement
between the terminal operator and the responsible
regulatory institution is a critical element when shaping
a performance-orientated port business environment.
This should include appropriate incentives that promote
a continuous improvement of operations, competitive
price setting mechanisms and a comprehensive
performance monitoring system. However, considering
the total freight rate, the lever of these measures appears
Option 3 – developing port hinterland connections
directly the improvement of maritime transport chain
elements. In contrast, the third option addresses other
modes of transport that indirectly affect freight rates of
ships through their role within the multimodal transport
chain.

REVIEW OF MARITIME TRANSPORT 201276
Inland transport linkages are the arteries of ports
connecting them to regional markets. They enable
ports to consolidate exports from the region and
hinterland.
As an example, the port of Durban in South Africa
offers more modern and extensive rail linkages than
giving it an advantage when competing for customers.
Another example is the structure of the transport
serve the transport needs within the country’s territory.
However, only a few east–west linkages exist that
connect domestic entrepreneurs with ports along the
present their goods on the international markets.
Improving transport connections to and from
markets in the hinterland, therefore, enables ports
to attract greater cargo volumes. This does not only
lead to economies of scale within the ports. It may
also attract larger vessels with lower unit transport
costs or more alternative maritime transport service
providers.
Source: UNCTAD secretariat.
Three national policy related generic strategies to reduce maritime freight rates
2.Developing portcompetitiveness
Port administration related laws and regulationsPort management structures andownership modelInstitutional framework (e.g. portauthority)Port operationsPort infrastructure (e.g. links toother modes of transport)
Reducing port related charges formaritime transport service providers through:a. efficiency gains in port operations and port administrationb. reasonable profit margin of portoperator in a more competitivebusiness environment
Includes charges for all portfunctions: Landlord, regulator,operator, marketer and cargo -handler (e.g. cargo handling fees,channel fees)
1.Developing coastal shipping
Opening cabotage to globalcompetition or restricting it todomestic operatorsNational ship registration policiesInstitutional framework (e.g.maritime authority)Investment policies andownership modelMaritime infrastructure (e.g.feeder ports)
The compliance with new shipregistration requirements mayreduce or increase operations costsOpening cabotage can increasecompetitive pressure thus reducingfreight ratesImproving coastal shippinginfrastructure connects remoteregions to international tradenetworks modal shift to maritimetransport and better economies ofscale
Selected fieldof policy making
Strategy
Potential impacton freight
rates
3.Developing port hinterland
connections
Intermodal interface connectingport with national and regionalmarkets (options: Rail, road,waterway and air transport)Regulatory and institutionalframework for land transportmodesRegional transit and transportdevelopment agreements Public private partnerships
a. Increases cargo handlingvolumes in ports lower unithandling costsb. attracts larger ships lowerunit transport costsc. attracts new transport serviceproviders lower margins due toincreased competition
Improved port connectivity:

CHAPTER 3: FREIGHT RATES AND MARITIME TRANSPORT COSTS 77
ENDNOTES
1 The purpose of the coverage of more vessel sizes within the New ConTex index is to give a more comprehensive
2
php?id=108, accessed 20.02.2012.
3 Lloyd’s List (2011). Rate hikes and capacity reductions fail to lift box freight prices. http://www.lloydslist.com/ll/sector/containers/article385705.ece, accessed 17.02.2012.
4 Journal of Commercecom/container-lines/new-world-grand-alliances-merge, accessed 21.02.2012.
5 Journal of Commercecom/container-lines/new-world-grand-alliances-merge, accessed 21.02.2012. See also International Freight News(2011). MSC/CMA CGM alliance will shake up Asia-Europe trade. http://www.ifw-net.com/freightpubs/ifw/article.htm?artid=20017924842&src=rss, accessed 21.02.2012.
6
php?id=108, accessed 20.02.2012.
7 Lloyd’s Listarticle173229.ece, accessed 20.02.2012.
8 Journal of Commercestar-reefers-swings-124-million-loss-2011, accessed 20.02.2012.
9 Shipping Herald (2012). Star Reefers posts USD 124m net loss. http://www.shippingherald.com/Admin/ArticleDetail/ArticleDetailsFinanceEconomy/tabid/104/ArticleID/2947/Star-Reefers-posts-USD-124m-net-loss.aspx, accessed 06.04.2012.
10 Drewry (2011). Charter rates thaw amid shifting reefer market. http://www.bairdmaritime.com/index.php?option=com_content&view=article&id=11116:charter-rates-thaw-amid-shifting-reefer-market&catid=66:container&Itemid=57, accessed 20.02.2012.
11 Lloyd’s Listarticle173229.ece, accessed 20.02.2011.
12 Drewry (2011). Charter rates thaw amid shifting reefer market. http://www.bairdmaritime.com/index.php?option=com_content&view=article&id=11116:charter-rates-thaw-amid-shifting-reefer-market&catid=66:container&Itemid=57, accessed 20.02.2011.
13 For additional information on the development of the oil price and freight rates refer to UNCTAD (2010). Oil Prices and Maritime Freight Rates: An Empirical Investigation. Geneva.
14 Lloyd’s Listarticle390597.ece, accessed 03.02.2012.
15 Lloyd’s List (2011). Tanker Owners’ Exposure to the Strait of Hormuz. http://www.lloydslist.com/ll/incoming/article388221.ece/BINARY/090112_Liz_page2.pdf, accessed 03.02.2012.
16 Steelguru (2012). Iran oil sanctions revive tanker rates around the globe. http://www.steelguru.com/middle_east_news/Iran_oil_sanctions_revive_tanker_rates_around_the_globe/254183.html, accessed 23.05.2012.
17 Tankeroperator (2012). VLCC spike to end. http://www.tankeroperator.com/news/todisplaynews.asp?NewsID=3446, accessed 23.05.2012.
18 Lloyd’s List (2011). Suezmax owners resist falling West Africa rates. http://www.lloydslist.com/ll/sector/tankers/article381146.ece, accessed 29.02.2012.
19 United Nations (2012). Piracy threatens West Africa oil expansion. http://www.google.com/hostednews/afp/
accessed 29.02.2012.
20 One Earth Future Foundation (2011). The Economic Cost of Somali Piracy. http://oceansbeyondpiracy.org/sites/
21 One Earth Future Foundation (2010). The Economic Cost of Maritime Piracy. http://oneearthfuture.org/images/
22
apps/news/story.asp?NewsID=41390&Cr=gulf+of+guinea, accessed 29.02.2012.

REVIEW OF MARITIME TRANSPORT 201278
23 GCaptain (2011). Stability to help boost Mediterranean tanker market. http://gcaptain.com/stability-libya-boost-mediterranean/?30212#, accessed 03.01.2012.
24 Hellenic Shipping News (2011). Tanker Market: Modest demand growth and continued oversupply sets the scene. http://www.hellenicshippingnews.com/News.aspx?ElementId=fc2b1429-a5fa-4526-af80-4d11456bd89c, accessed 03.01.2012.
25 Market Watch
26 Lloyd’s Listtankers/article391040.ece, accessed 23.05.2012.
27 Lloyd’s Listcom/ll/sector/tankers/article375538.ece, accessed 28.02.2012.
28 Hellenic Shipping News (2011). Tanker oversupply to hurt larger ships the most says analyst. http://www.hellenicshippingnews.com/News.aspx?ElementId=f5a1616d-b41c-4d97-9619-aab73c890c75, accessed 27.02.2012.
29 Clarkson Research Services Limited (2012). Dry Bulk Trade Outlook from February 2012, p. 2.
30 Lorentzen & Stemoco (2011). Weekly 33.2011. http://www.lorstem.com/Global/Weekly%20reports/Report%2033-2011.pdf, accessed 14.03.2012.
31 Lloyd’s List (2011). Largest overnight capesize rate drop in two months. http://www.lloydslist.com/ll/sector/dry-cargo/article387492.ece?service=print, accessed 14.03.2012.
32 Lorentzen & Stemoco (2011). Weekly 33.2011. http://www.lorstem.com/Global/Weekly%20reports/Report%2033-2011.pdf, accessed 14.03.2011.
33 Fish Info & Servicesupload/FISUpdateFeb11.pdf, accessed 03.04.2012.
34 (2012). Iron ore Monthly price. http://www.indexmundi.com/commodities/?commodity=iron-ore&months=60, accessed 04.04.2012.
35 (2012). Coal, Australian thermal coal monthly price. http://www.indexmundi.com/commodities/?commodity=coal-australian&months=60, accessed 04.04.2012.
36 Fish Info & Servicesupload/FISUpdateFeb11.pdf, accessed 03.04.2012.
37 Clarkson (2012). Dry Bulk Trade Outlook. 18(2). February 2012.
38 Lloyd’s List (2012). Size of Capesize ships set to explode. http://www.lloydslist.com/ll/sector/dry-cargo/article393401.ece, accessed 03.04.2012.
39 Lloyd’s List (2012). Panamax period charters stall. http://www.lloydslist.com/ll/sector/dry-cargo/article391339.ece, accessed 15.03.2012.
40 Clarkson (2010–2012). Dry Bulk Trade Outlook. Various issues.
41 Lloyd’s Listsector/dry-cargo/article392634.ece, accessed 15.03.2012.
42 IHS Fairplay (2012). Panamax rates keep sliding. http://www.fairplay.co.uk/login.aspx?reason=denied_empty&script_name=/secure/display.aspx&path_info=/secure/display.aspx&articlename=dn0020120516000001, accessed 30.05.2012.
43 GLG Research (2007). Supramax market better protected than larger cousins. https://www.hightable.com/maritime-and-shipping/insight/supramax-market-better-protected-than-larger-cousins-12957, accessed 05.04.2012.
44 Lloyd’s List (2011). Bigger Supramaxes steal market share. http://www.lloydslist.com/ll/sector/dry-cargo/article359304.ece, accessed 05.04.2012.
45 Drewry (2012). Shipping Insight. Various issues.
46 Clarkson (2011). Dry Bulk Trade Outlook. December 2011.
47 Figures based on the analysis of the New ConTex index for containerships, the Baltic Exchange Dry Bulk Index for bulkers
48 Data from study conducted by Moore Stephens in 2011 based on data from over 2,600 vessels. http://www.moorestephens.gr/images/OpCost_Seminar.pdf, accessed 09.05.2012.
49
50 Stopford M (2006). Maritime Economics. Routledge. Oxford. p. 43.
51 World Bank (2012). Why Does Cargo Spend Weeks in Sub-Saharan African Ports? Washington DC.
52 World Bank (2007). Port and Maritime Transport Challenges in West and Central Africa. Washington DC.
53 World Bank (2007). Port and Maritime Transport Challenges in West and Central Africa. Washington DC.
54 United States Department of Transportation (2011). Comparison of U.S. and Foreign-Flag Operating Costs. http://www.marad.dot.gov/documents/Comparison_of_US_and_Foreign_Flag_Operating_Costs.pdf, accessed 24.04.2012.