Embed Size (px)
Citation preview

47
REVIEW OF LITERATURE, METHODOLOGY
AND PROFILE OF THE STUDY AREA
This chapter presents a review of literature on the past studies of dairy
industry. Though voluminous literature is available in this area, only a few contextual
works are reviewed here. Further, the methodology adopted for the present study and
a discussion of the profile of the study area are also presented to ensure greater clarity
and comprehensiveness.
2.1 REVIEW OF RELATED STUDIES
The review of the related studies enables the researcher to have an idea of the
past studies and to study the untouched aspects of the areas studied earlier. Also, the
value of any research work depends upon the review of literature concerned with that
study. Hence, we shall have a bird’s eye view of some of the important studies in this
area.
Jain et al (1978)7 studied the growth of milk producers cooperatives in
Mehasana district of Gujarat. The sample villages in the milk shed area were selected
and were studied for the growth of cooperative societies, membership, share capital,
volume of milk handled, price paid by different agencies. The data was scored under
the benchmark and repeated surveys were carried out by the Indian Agricultural
Statistics Research Institute during 1968-69 and 1973-74 respectively. It was
observed that there was a sizable increase in the number of village level milk
producers cooperatives viz., from 230 to 380 between the two occasions, the
membership of those cooperatives also increased from an average of 157 members per
cooperatives on the first occasion to 240 on the second occasion and the share capital
7 Jain, J.P., Saxena, B.C., Aneja, K.G. and Prem Naraian, “Growth of milk producers cooperatives in
Mehsana ”, Dairy man, 30, 1978, pp 549-552.

48
of the cooperatives increased from an average of Rs. 3448 per milk cooperative on the
first occasion to Rs. 18842 on the second occasion. They also noticed that there was
an overall increase in the number of persons employed by the milk cooperatives to
assist in their functioning and the daily milk collection of milk cooperatives increased
in second occasion during all three seasons.
M. B. Kulkarni (1979)8 opined that the lack of sufficient milk collection of
cooperatives in the rural areas, malpractices in weighment and quality testing,
inconvenient timings of milk collection, spoilage during the rains and warm seasons
and inadequate extension services were some of the lacunae in milk collection from
the producers.
C. S. Rayudu (1985)9, to measure the financial operations and performance of
cooperative spinning mills in Andhra Pradesh, studied different financial ratios such
as current ratio, acid test ratio and debt equity ratio. He opined that ratio analyses had
a dominant role not only for the appraisal of financial performance of cooperative but
also for their ability to handle professional financial management.
Baviskar (1986)10 submitted a report based on data collected during field work
in two villages of Surat district. The report traced the increase in the number of
co-operative milk producer societies and their impact on dairy development in the
tribal area of Gujarat. It focused upon milk cooperatives managed by Jesuit
missionaries in the region presenting a detailed description of their internal
8 Kulkarni, M.B., “Collection of Milk: Some Lacunae and Remedies”, Dairy Guide 1(10), 1979,
pp 31-34.
9 Rayudu, C.S., “Ratio Analysis and Financial Performance”, Indian Cooperative Review, 23(1), 1985,
pp 54-70.
10
Baviskar, B.S, “ Dairy development in a tribal area of Gujarat”, working paper, institute of social
studies, Netherlands, No. 8 , 47, 1986.

49
organization. The main reason for the success of the Jesuit seen cooperative was
found to lie with the loyalty of its members and integrity of its leaders. The secretary
of dairy cooperative was found to be key functionary in the success of the project.
V.Gangadhar and K.Raji Reddy (1986)11
employed debt equity ratio to study
the capital structure and for studying working capital, liquidity and turn over. Ratios
like current ratio, acid test ratio, inventory turnover ratio were used while studying the
financial performance of super bazaar in Warangal.
G. A. Nikam (1986)12
made an attempt to study the financial strength of four
cooperative sugar factories situated in Aurangabad district. Two important ratios viz.,
current ratio and acid test ratio were employed to locate financial strength of three
units (short term) and two ratios viz., debt equity ratio and net fixed assets to net
worth ratio were used for assessing the long term financial strength of the societies.
H. G. Shankara Murthy (1986)13
studied the performance of Karnataka State
Cooperative Marketing Federation Limited. He employed financial ratio analysis to
evaluate the financial performance of the federation. He used different ratios to study
the different aspects of financial position of the federation such as solvency, liquidity,
turnover, profitability, efficiency and strength. He said that the ratio analysis would
provide better idea of the financial position of the federation.
11
Gangadhar, V.and Raji Reddy K., “Financial Performance of Super Bazaar”, Indian Cooperative
Review, 24 (2), 1986, pp 131-140.
12
Nikam, G.A., “Financial Strength of Sugar Cooperatives A Ratio Analysis Approach”, Indian
Cooperative Review, 45(3), 1986, pp 244-254.
13
Shankaramurthy, H.G., “Performance of The Karnataka State Cooperative Marketing
(KMF) Ltd and Its Impact on Farm Market: An Economic Analysis”, Ph.D. Thesis, Andhra Pradesh
Agric. Univ., Hyderabad, 1986.

50
Praveen kumar and Gupta (1988)14 found the relative share of different items
of cost in the maintenance of buffalo, local cow and cross-bred cow. They had found
the cost of feed comprising green fodder, dry fodder and concentrates constituted
65.46 per cent of the total cost. Labour cost came next which claimed 28 per cent in
the total maintenance cost of buffalo, 30 per cent of local cows and 19 per cent of
cross-bred cows. Ninety per cent of the maintenance cost was accounted for feed and
fodder. The cost of milk production per litre from buffalo, local cow and cross-bred
cow worked out as Rs.2.34, Rs.1.89 and Rs.1.83 respectively.
C.G.Rande, D.P.Mathur, B.Rangarajan and V.K. Gupta (1988)15
studied about
the performance of integrated milk co-operatives. This study tries to explore the
hypothesis that those cooperatives as they develop backward, forward and horizontal
integration are able to increase the income of their farmer members through
rationalization of costs and through undertaking value addition functions. The
findings of the study reveal that cooperative in milk commodity have played
important role in improving the income of their members from their milk operations
substantially and have also helped small landless labourers to undertake milk
production as a primary occupation. It is hoped that the study will be useful to the
policy makers as well as the milk cooperative societies.
Hirevenkana Gouda et al (1988)16
studied the impact of dairy development on
the weaker sections of Bangalore north and Doddaballapur taluk of Karnataka. The
14
Praveen Kumar and J.N.Gupta, “Comparative Cost of Milk Production from Different Species of
Milch Animals: A Case Study of Muzaffar Nagar District (UP) ” , The Indian Journal of Dairy Sci-
ence,41(4), 1988,pp.411-420.
15
C.G.Rande, D.P.Mathur, B.Rangarajan and V.K. Gupta, Performance of Integrated Milk Co-
operatives, Concept Publishing Company, New Delhi, 1988. p.ii.
16
Hirevenkanagouda, L.V, Hanumanthappa, D.S and Jalihal, K.A, “Impact of Dairy Development On
The Weaker Sections: A Study”, Kurukshetra, 36(5), 1988, pp 7-11.

51
small, marginal farmers and agricultural labourers were selected from the villages
having SFDA programmes. They were classified as Karnataka Dairy Development
Corporation (KDDC) farmers and non-KDDC farmers who were not availing the
facilities of cooperatives. They found that more than 56 percent KDDC farmers
getting only 25 percent of family income from dairy enterprises more than 64 percent
of KDDC farmers had repaid 75 to 100 percent of dairy loan, whereas only 10 to 25
percent of non KDDC farmers had repaid 75 to 100 percent of dairy loan.
Jawan Ram (1988)17
made an attempt to analyze the organization and working
of Jaipur district milk producers cooperative union limited, Jaipur. The study was
conducted through personal interview with management and other employees of the
union. It was found that the organizational structure and functions performed such as
(i) milk collection (ii) supply of technical inputs (iii) farmers induction programmes
and (iv) supervision etc., were analyzed. Some drawbacks were found out and
appropriate suggestions were made.
As per the study made by S.L.Makker (1989)18
, Dairy Cooperatives definitely
increase the cattle feed, fodder, artificial insemination and veterinary services. It not
only provides effective leadership and a team of committed professionals but also
encourages an active participation of producers which has ultimately made the project
a success.
17
Jawanram, “Organization and Working of Dairy Cooperatives in Rajasthan: a case study”, Indian
cooperative review, 25(3), 1988, pp 273-282.
18
S.L.Makker, “Dairy Co-operatives in India- A Strategy of Rural Development”, Kurukshetra,
vol.XXXVII, No.4. January 1, 1989, p.17.

52
R.M.Mattigatti (1990)19 studied the performance of milk producers
cooperative societies and their impact on dairy farming in Dharwad district. The
author selected a number of physical and financial indicators to evaluate the
performance. The secondary data required was collected from the various annual
reports of milk producers cooperative societies for the period 1986-88. He opined that
both the physical and financial indicators of the societies showed significant growth in
their values. The above average societies have already progressed with higher values
for the indicators compared to below average societies, while below average societies
well shown a greater rate of growth, hence, he concluded that over the period of time
all these societies would contribute to the overall development of the societies.
D. S. Jithendra Kumar (1990)20 studied the performance of dairy cooperatives
and their impact on milk production, income and employment in Chitoor district of
Andhra Pradesh. The study revealed that the societies which were above the average
level has shown better performance with an increase in membership and milk
procurement, and profits of societies showed an increasing rate.
S.S Chalal and K.S. Gill (1993)21
, in their study, identified six channels of
milk distribution namely
Producer Milk Vendor Consumer
Producer Milk Vendor Creamery Consumer
19
Mattigatti, R.M., “Performance of Milk Producers Cooperative Societies and Their Impact On Dairy
Farming In Dharwad District, Karnataka”, M.Sc. (Agri) Thesis, University of Agricultural Science,
Dharwad, 1990.
20
Jithendrakumar, D.S., “Performance of Dairy Cooperatives and Their Impact On Milk Production,
Income and Employment In Chitoor District (A.P.)”, M.Sc. (Agri) Thesis, University of Agricultural
Sciences, Dharwad, 1990.
21
S.S.Chalal & K.S.Gill, “Price –Spread in Milk Marketing in Co-operative and Private Sectors of
Punjab”,Indian Journal of Agricultural Marketing, Vol 7, No.1, 1993, pp 43-45.

53
Producer Sweet Shop Consumer
Producer Milk Vendor Sweet Shop Consumer
Producer Milk Plant Consumer and
Producer Consumer (in rural areas).
According to them, the net share of milk vendor depended upon the type of
channel adopted and from which milk was sold to the consumer finally. It was also
found that water is mixed in milk by the vendors in the ratio of 1:5.
Manob Kanti Bandyopadhyay (1995)22
in his study ‘ Dairy Cooperative and
Rural Development (With Special Reference to Comparative Study between the Kaira
District Co-operative Milk Producers’ Union Limited and the Himalayan
Co-operative Milk Producers’ Union Limited) ‘ deals with the analysis- as to how far
the Operation Flood Programme i.e. replicating the ANAND model programme taken
by the N.D.D.B. is achieved in India. This analysis depicts that the programme which
was taken with a view to replicating the ‘Anand’ model has not achieved success
throughout the country. Besides, this programme did not consider local geographical
and socioeconomic aspect at the time of copying ‘Anand’ model exactly. As a result,
in many cases invested capital of Operation Flood Programme could not yield any
favourable result.
Prof.Ombui J. Nyarongi(1995)23
made a study on the ‘Quality of raw milk
collected and Marketed by dairy cooperative societies in Kiambu District’ in
Nairobi. The study found that most farmers in the district supply to dairy cooperative
societies relatively good quality milk, but the quality of the milk deteriorates while in
22
Manob Kanti Bandyopadhyay, ”Dairy Co-operative and Rural Development” , Finance India, Vol. X
No. 2, June 1996, pp. 406–411 23
Prof.Ombui J. Nyarongi, “Quality of raw milk collected and Marketed by dairy cooperative
societies in Kiambu District– 1995”, A publication from the University of Nairobi.

54
the hands of the management of dairy cooperative societies which could be attributed
to long milk collection rounds coupled with high ambient temperatures and
inadequate cleaning of cans after use due to lack of enough potable water.
K. Sreedevi (1996)24
analysed the role and impact of milk cooperatives on
production of milk. She purposively selected the Tenali Division of Guntur District in
Andhra Pradesh and made the investigation. As per the results of the study, the
members of the Cooperative Milk Producers’ Societies were better off in all respects
when compared to non-members. This shows that the Milk Producers’ Co-operatives
had a great impact in increasing the milk production and income of the rural people
and in increasing awareness of the importance of the dairy industry.
S.S.Chalal (1996)25 examined the role of co-operatives in marketing of milk in
Punjab. The study was based on the data collected from sample members of Milk
Producers’ Cooperative Societies (MPCS) of the milk plant. It was found that 73 % of
the milk was purchased by agencies other than milk cooperative societies in rural
Punjab. The major portion of milk market was still monopolized by the private milk
traders. On the whole, milk co-operatives were playing a positive role in rural market
by providing tough competition to the private milk traders. But, there was a need to
strengthen the milk co-operatives so as to make milk production activity a successful
venture by eliminating the malpractices committed by private traders. This will go a
long way to help the dairy farmers to get remunerative prices for their produce and in
turn the consumer will be benefited by getting quality milk at reasonable prices.
24
K.Sreedevi, “Impact of Producers’ Co-operative in Rural Economy: A Case of Village Milk
Producers’ Co-operative Society in Guntur District of Andhra Pradesh”, Indian Journal of
Agricultural Economics,Vol.51, No.4, October-December 1996,pp.805-806.
25
S.S.Chalal, “The Role of Co-operatives in Marketing of Milk in Punjab”, Indian Journal of
Agricultural Economics, Vol.51, No.4,October-December, 1996, pp.802-803.

55
Rajmohan (1996)26, in his article ‘Problems Facing Dairy Cooperatives in
Usilampatty Taluk in Madurai District of Tamil Nadu’ states that the unsatisfactory
marketing facilities, compels the milk producers to convert their surplus milk into
milk product like butter, curd and ghee and force some others to sell it to the private
vendors or middlemen at low prices. The staff members of the societies are not
trained properly and they are not sincere in testing and dispatching of milk. They have
failed to keep and maintain profit and loss accounts. This would lead to wrong
calculation of income of the milk producers and finally affect their income.
Kale et al (2000)27
studied the financial position, working and operational
efficiency of 23 dairy cooperatives in Raigad district of Maharashtra. They studied the
economic efficiency through income expenditure ratio, expenditure income ratio, rate
of return on capital and rate of turnover. They concluded that (i) the societies had low
owned capital and were dependent on borrowing from financial institutions (ii) even
though the working capital of the dairy cooperatives was low, their turnover was high
because dairy cooperative did not make payment to milk producers from their own
funds. Therefore, dairy cooperatives were able to carry on business with limited
capital and (iii) majority of the societies were trading profit.
Sant Kumar and D.K.Mishra (1998)28
in the chapter ‘Role of Cooperatives in
Rural Development’ express their views about the importance of Cooperative
development. For an economy of India’s size and potentialities, the development of
cooperative sector is the sin-qua-non for its healthy growth as it requires, among other
26
Rajmohan, “Problems Facing Dairy Co-operatives in Usilampatty Taluk”, Tamil Nadu. Journal of
Co-operation, Vol.88, No.1, 1996, pp.28-30.
27
Kale, N.K., Tilekar, S.N., Borude, S.G. and Hinge, B.J., “ An economic enquiry into working of dairy
cooperatives in coastal area of Maharashtra”, Indian Cooperative Review, 38(4), 2000, pp 426-433.
28
Gursharan Singh Kainth, India's rural cooperative, Daya Books, 1998, p.28.

56
things, eradication of poverty, training for good citizenship and the spirit of
cooperation for mutual advantage.
According to K. V. Subrahmanyam and T. M. Gajanana (2000)29, the recent
success of the Milk co-operative societies organized by the National Dairy
Development Board (NDDB), Anand (Gujarat), has given hopes, that the cooperative
societies can be successfully organised to take care of the interest of the producer
members. Hence, a number of cooperative societies for marketing of various
commodities including fruits and vegetables have been started in various states. But
unfortunately most of these societies have failed. The reason for the Milk cooperative
societies to be successful, though it is also a perishable commodity like fruits and
vegetables and for the failure of the latter can be known if one looks at the differences
more closely. in case of milk, the reason for their success are: milk is considered as an
essential commodity and is required daily by all sections of the people; the processed
products of milk like milk powder, ghee, curd etc. are also considered as essential
commodities and are in great demand; the milk cooperative societies handle only one
commodity i.e. milk and the societies are backed up by their own processing facilities
for utilization of excess milk; also, milk price is stable throughout the year without
much fluctuations.
R K Ghosh, A Goswami and A K Mazumdar (2000)30
, Department of
Veterinary and Animal Husbandry Extension Education , West Bengal University of
Animal and Fishery Sciences , in their research regarding the adoption behaviour of
29
K. V. Subrahmanyam, T. M. Gajanana, Cooperative marketing of fruits and vegetables in India,
Concept Publishing Company, 2000, pp.79 and 80..
30
R K Ghosh, A Goswami and A K Mazumdar, “Adoption behavior of the dairy farmers in relation to
artificial insemination in co-operative farming system”, Part of the MVSc. Thesis of the First
Author, Department of Veterinary and Animal Husbandry Extension Education, West Bengal
University of Animal and Fishery Sciences.

57
the dairy farmers in relation to artificial insemination in co-operative farming system,
states that adoption of any improved technology involves a process in which
awareness is created, attitudes are changed and favourable conditions for adoption are
provided. How latent is the knowledge of a dairy producer about various husbandry
practices such as breeding, feeding and management of milk animals, determines
largely the success or failure of a dairy enterprise. In this context, milk co-operatives
have quite ambitious objectives. They not only want to increase the productivity of
milk animals but also wish to raise the economic status of rural people at large
through increased milk production. To enhance the production potential of our milk
animals distributed throughout the length and breadth of our country, introduction of
superior germ-plasm into our indigenous breeds of cattle through artificial
insemination (AI), may be the key factor. For this purpose, mass adoption of AI by
the dairy farmers is a crucial factor .They add value to their research by stating that all
the communication variables are significantly correlated with adoption of improved
animal husbandry practices in Non-member Co-operative Society (NMCS) whereas
mass media communication, personal local sources and personal cosmopolitan
sources are significantly correlated with adoption in Member Co-operative Society
(MCS). Among socio-economic variables, age and education of the respondents were
significantly correlated with adoption of improved animal husbandry practices.
Communication source and knowledge about de-worming were the key variables that
directly and indirectly influenced the adoption of improved animal husbandry
practices in MCS and NMCS, respectively.

58
Chidambaram (2000)31, analyzed the growth and development of Amaravati
sugar mill, Tamil Nadu, with respect to 13 identified indicators such as (1) area under
sugar cane production (2) membership (3) recovery (4) equity capital (5) debt capital
(6) net working capital (7) cane price (8) cost of production of sugar (9) machinery
utilization (10) sale price (11) income (12) expenditure and (13) profit, compound
growth rate was calculated for each indicator to study the growth.
Goswami et al (2000)32
reported similar findings for the relationship between
the dependent variable (adoption of artificial insemination) and occupation, caste,
family size, land and house type, knowledge about AI, deworming, feeding of
concentrates and mass media communication. A similar attitude towards dairy
farming was shown by Kaura (1967)33. In the case of non-members of milk
co-operatives, the relationships are similar to those reported by Chander (1970)34 for
education of the respondent; with Kulkarni (1973)35 for family type; with Goswami
et al (2000) for education of the respondent, occupation, caste, family size, land,
house type, knowledge about AI, deworming, feeding of concentrates and mass media
communication, and with Kaura (1967) for attitude towards dairy farming.
31
Chidambaram., “Factors Affecting The Growth and Development of Cooperative Sugar Factory - A
Case Study ”, Indian Cooperative Review, 25(3), 2000, pp 243-255.
32
Goswami A Roy N, Mazumdar A K and Duttagupta R 2000. “Factors related with adoption behavior
of the livestock owners about Artificial insemination”. Journal of Interacademcia.4 (2):pp 304-309.
33
Kaura M S 1967, “A scale to measures farmer's attitude towards Artificial Insemination”, M.Sc.
Thesis submitted to Punjab Agriculture University, Hissar.
34
Chander Satish, “A study of socio-economic factors affecting the adoption of AI and attitude of
farmers towards the same”, A dissertation submitted to the Punjab University for M.Sc, (Dairy
Extension) National Dairy Research Institute, Karnal, 1970.
35
Kulkarni P S x, “A study of socio-economic factors affecting adoption of AI in cattle in the selected
villages of key village center, Nagpur”, M.Sc. Thesis submitted to JNKVV, Jabbalpur, 1973.

59
Sriramalu et al (2001)36, in assessing the performance of 58 Farmers Service
Cooperative Societies (F.S.C.S) in Andhra Pradesh concluded that out of the total
volume of non credit services, input supply constituted 91.36 percent, consumer
goods accounted for 5.18 percent and customer services 0.04 percent. This indicated
that the non-credit services were mainly confined to supply of agricultural inputs and
the marketing of agriculture produce was completely neglected by all the F.S.C.S.
Dr .V. Selvaraj (2002)37
, in his study named “Marketing of Dairy Products
through E-Commerce”, states that the dairy business in India merely means milk
production and the co-operative movement has done a world of good for this
predominantly agro-based activity and India has grown sufficiently in milk
production. He has also intended that depending on the local conditions, special
training sessions are to be arranged to produce value added dairy products and to
market their products all over the world by the introduction of E-Commerce at village
level.
Peerapon Prasertsri and Richard L. Kilmer (2002)38
, in their book “Rural
Cooperatives” persuades that milk processors, milk marketing cooperatives and dairy
farmers need to improve their cooperation. They also need to be aware of how the
action of each member of the vertical market influences the business operation of the
others. A major function of a milk-marketing cooperative is transferring and
balancing the supply and demand of fluid milk from dairy farmers to milk processors.
Farmers and processors want milk collected and delivered on a well-timed schedule.
36
Sriramulu, P., Lingamurthy, N. and Sudershan, G., “Andhra F.S.S. Promise and performance”,
Yojana, 49 (3) , 2001, pp 20-21.
37
, Dr.V.Selvaraj, “Marketing of Dairy Products through E-Commerce”, Kisan World, Vol.29, No.9,
September 2002, pp 27-28. 38
Peerapon Prasertsri, Richard L. Kilmer, “Rural Cooperatives”, Business Publications, March-April,
2002.

60
It is the cooperative's task to ensure that the milk routing and scheduling are
performed efficiently to improve coordination among farmers, the cooperative and
milk processors.
Thomas and Chirathalattu Santosh (2004)39
conducted research
regarding the milking management of dairy buffaloes. The aim of the thesis was to
investigate some of the underlying principles for milking management of Murrah
buffaloes. The study was carried out through five experiments, four on an
experimental farm in India and one as a field survey. From the results it was observed
that the total cisternal area and cisternal fraction of milk in Murrah buffaloes was
smaller than in dairy cattle, sheep and goat. Teats were longer and thicker and had
longer teat canals than reported in dairy cattle. To prevent a possible irritation and
stress due to machine milking without milk flow at high vacuum, milk removal should
be synchronised with milk ejection. It is thus necessary to improve machine milking
settings for buffaloes and to develop ISO standards optimised to suit the anatomical
and physiological characteristics of buffaloes. Training of milkers and milking
machine users is also important for improving the udder health and welfare of
buffaloes.
Jayachandra Reddy et al (2004)40
, conducted a comparative study of
economics of milk production in three states, viz., Chitoor district in Andhra Pradesh,
Erode district in Tamil Nadu and Kolar district in Karnataka involving aspects related
to existing cost structure of milk production, profitability of crossbred dairy cows in
the three states under the changed socioeconomic-political scenario and also suggests
39
Thomas, Chirathalattu Santosh (2004), “Milking management of dairy buffaloes”. Doctoral diss.
Dept. of Animal Nutrition and Management, SLU. Acta Universitatis agriculturae Suecia. Agraria
vol. 455. 40
Jayachandra Reddy, Reddy, Y.V.Reddy and Ramakrishna, Y.S., 2004, “A Comparative Study of Cost
of Milk Production Under Different Agro-Climatic Regions In Semi-Arid Regions”, Indian Journal of
Agricultural Economics 59(3), p 611.

61
methods to improve the viability and profitability of these enterprises. The net
profitability varied from 43 percent in Tamil Nadu, 70 percent in Andhra Pradesh and
83 percent in Karnataka. The study has further brought out the fact that higher fat
content provides higher prices as milk is priced based on fat and solid non-fat (SNF)
content by dairies. Hence proper scientific breeding procedure is to be followed to
improve fat content in the milk as well as milk production per animal.
K. Rajendran and Samarendu Mohanty (2004)41
made a study on ‘Dairy
Cooperatives and Milk Marketing in India: Constraints and Opportunities’. This study
reviews the existing status of milk marketing and dairy co-operatives in India and
provides recommendations to meet future challenges. The results of the study
indicate that 80 percent of the milk produced by the rural producer is handled by an
unorganized sector and the remaining 20 percent is handled by an organized sector. It
is found that the dairy co-operatives play a vital role in alleviating rural poverty by
augmenting rural milk production and marketing. Involvement of intermediaries; lack
of bargaining power by the producers; and lack of infrastructure facilities for
collection, storage, transportation, and processing are the major constraints which
affect the prices received by producers in milk marketing. Milk quality, product
development, infrastructure development, and global marketing are found to be future
challenges of India’s milk marketing.
Dixit et al (2004)42 studied the economics of milk production in five agro
climatic zones of Kerala. The primary data with respect of farm inventory, production
traits of Milch bovines, feeds and fodder fed, labour utilization, production and
41
Rajendran K. and Samarendu Mohanty, “Dairy Co-operatives and Milk Marketing in India: Con
straints and Opportunities”, Journal of Food Distribution Research 35(2), July 2004. 42
Dixit, P.K., Dhaka, J.P., Sajeesh, M.S., and Aravinda Kumar, M.K., “Economics of Milk Production In
Kerala- An Inter-Regional Empirical Study”, Indian Journal of Agricultural Economics, 59(3), 2004,
pp 646.

62
consumption of Milk, value of various inputs and outputs, expenditure on veterinary
and other miscellaneous items etc. were collected from 750 households. The data
pertained to the year 2002-03. The results of the analysis indicate that bovine
husbandry forms an important component of the typical homestead-farming situation
in Kerala. The crossbreeding of cattle has resulted in the spectacular performance of
dairy sector in the state.
Tangirala (2005)43
in his article “New Generation Co-operatives versus
Traditional Co-operatives” reveals that the industrialization of agriculture and allied
sectors, changes in technology and emergence of WTO have become challenges for
the co-operatives. To become more competitive, the co-operatives have to respond
proactively to the prevailing environment and should become more member and
market driven. Hence it is time for the co-operatives to develop value added business,
monitor the consumer preferences and track products throughout the value chain, sup-
ply chain, incorporating all information at all levels, that is, Management
Information System (MIS) in order to capture profits at every stage. Such
arrangement enhances the earnings of the member producer of a co-operative because
of the return on investment in the processing activities. This is the common aspect of
New Generation Co-operatives (NGC).
D Thirunavukkarasu and N K Sudeepkumar (2005)44
studied about the milk
marketing options for the dairy farmers in open economy and their choice in Tamil
Nadu, India. In the study area predominantly three marketing options were available
for the dairy farmers; unorganized vendors, formal / organized dairy cooperatives and
43
H.S.K.Tangirala, “New Generation Co-operatives Versus Traditional Co-operatives”, Kurukshetra,
Vol 53, No 7, May 2005, pp 32-37. 44
D Thirunavukkarasu and N K Sudeepkumar. “Marketing options for the dairy farmers in open
economy and their choice in Tamil Nadu, India “. Part of Post graduation research work in Madras
Veterinary College, Tamil Nadu, India, Livestock Research for Rural Development 17 (8) 2005.

63
integrated contract system. A majority of dairy farmers around 57.3 percent had shift-
ed from one marketing option to another. The rest 42.7 per cent of dairy farmers re-
mained in the same marketing option from the day they began commercial milk pro-
duction. A major shift from vendors (informal system) to contract (39.5 per cent), fol-
lowed by vendor to co-operative (24.4 per cent) and co-operative to vendor (19.8 per
cent) was noticed. Irregularity in payment and stoppage of procurement by vendor
system made dairy farmers shift from vendor system to others. After the weakening of
vendor- farmer relationship and initiation of Milk Producer Cooperatives at the
village level, there has been a shift from vendor to co-operative system. When the
dairy sector opened for private investment coupled with poor performance of
cooperatives, farmers shifted towards new marketing option the 'integrated contract
system'. Irregularity in payment, distant location of collection centre and inability to
milk the animals were reasons for shifting back to vendor from other marketing
options. Prompt payments, sustainability of marketing systems in business were major
factors responsible for retaining members and attracting new dairy farmers. Dairy
farmers with the experiences of various marketing options gave more value to the
prompt payment for the milk sold on comparing to milk prices.
M Younas and M Yaqoob (2005)45 in their study about Feed resources of
livestock in the Punjab, Pakistan states that livestock improvement demands the
efficient use of available feed resources. The provision of feeding stuffs of adequate
nutritional quality is likely to be the most limiting factor in increasing livestock
production in the developing countries. This paper reviews the extent of feed
resources available and their potential in meeting the animal needs and maintaining
45
, M Younas and M Yaqoob,” Feed resources of livestock in the Punjab, Pakistan”, Dept of Livestock
Management, Faculty of Animal Husbandry, University of Agriculture, Faisalabad-38040, Pakistan,
Livestock Research for Rural Development 17 (2) 2005.

64
their health status. It deals with the different aspects of fodder crops, concentrate
feeding, range resources, non-conventional feed resources, and nutrient requirements
of farm animals. It further delineates the strategies to cope with the future threats
confronting the livestock sector.
Vinmathy (2005)46, in her study titled, “An Economic Study of Dairy
Development with Particular reference to Bathrakaliamman Milk Plant-Palamedu”
has found out location, length, dry periods, calving intervals for cows and buffaloes
and compared their respective yield. She also has pointed out the efficiency of
different cattle. She has found that both cows and buffaloes calved approximately at
equal intervals. The cows remain dry for longer periods. The freshly calved buffalo
gives more milk than the freshly calved cow.
S.Suryalatha (2005)47
has conducted a research regarding the performance of
the Tirunelveli Milk Producers’ Society and has found out that there is a normal
increase in the share capital of the Society but a sharp increase in the reserve fund.
The total number of members and the number of members supplying milk to the
Society also showed an increasing trend. Regarding the members of the Society, the
opinion given by respondents with respect to their preference for selling the milk to
the Society indicates that as many as 69 out of 90 respondents reported that they
preferred the Society for ready payment and only two of them preferred it for safety.
46
V Vinmathy, “An Economic Study of Dairy Development with Particular reference in Bathraka
liamman Milk Plant _ Palamedu”, Unpublished Masters’ Thesis _ Madurai Kamaraj University, 2005. 47
.S.Suryalatha, “Performance of Tirunelveli Milk Producers Co-operative Society Limited”,
Unpublished Master’s thesis, Manonmaniam Sundaranar University, 2005.

65
Bir Bahadur Karki (2005)48 , in his study ‘Strategic Planning in Co-operative
Sector: A Study on Dairy Co-operative’ states that dairy co-operatives are found
everywhere in both developed and developing countries. In developing countries, it is
one of the income sources of their rural economy whereas in developed countries it
takes on as a sustainable business. These countries face different types of problems.
Developing countries focus on increase in production volume of milk and milk
product, and developed countries concentrate on enhancement of milk product, brand,
and merger of dairy cooperatives. Dairy cooperatives have been getting various
opportunities as well as facing different challenges. They are going to formulate
different types of strategic planning to cope with these challenges and to get success.
Strategic plans of dairy cooperatives in developing countries are, generally to increase
production volume of buffalo milk, bring about the internal improvement in
cooperative societies, reduce cost of production, and provide quality service to
consumer through skill, trained and educated manpower, and e-commerce. Strategic
plan of developed countries is quite different from that of developing countries. Their
strategic plans are to merge different dairy cooperative societies / institutions into a
dairy cooperative, and compete in the global market with quality of products.
Olive McCarthy, Robert Briscoe and Michael Ward (2005)49
, in the article
‘Irish Agricultural Co-operatives: An Overview’ reviews the current status and recent
history of Irish agricultural co-operatives. The evolution of Ireland’s co-operative
movement is traced through the efforts of co-operators to address two major
organisational dilemmas, the quandary of Local Autonomy versus Rationalised
Integration, and the even more fundamental issue of User Control versus Investor
48
Bir Bahadur Karki, “Strategic Planning in Co-operative Sector: A Study on Dairy Co-operative”, The
Journal of Nepalese Business Studies, Vol. II, No. 1, Dec. 2005, p 72. 49
Olive McCarthy, Robert Briscoe, Michael Ward, “ Irish Agricultural Co-operatives: An Overview”,
The Centre for Co-operative Studies Strategic Plan 1999-2005, Ireland.

66
Control. These are dilemmas which are familiar to successful co-operators around the
world.
According to B.R.Patil (2006)50, Substantial efforts in agricultural R&D have
been directed towards design of new technologies for smallholder dairy farming. A
series of concepts and methods were developed to incorporate these considerations,
and to replace narrow technology-driven approaches by broader ones such as Farming
Systems Research (FSR). This thesis describes and analyses experiences of BAIF, an
Indian NGO, with the use of FSR methodology in livestock development programmes
in Gujarat, India. Some guidelines regarding the usefulness of approaches and
technologies are given. But agricultural R&D is ultimately considered to be a
complex adaptive system, also in Gujarat, and development organizations such as
BAIF have to, therefore, show dynamic behaviour.
Usha Jumani (2006)51, in her book ‘Empowering Society: An Analysis of
Business, Government and Social Development Approaches to Empowerment’,
mentions that the unique structure of the co-operative dairy industry in Gujarat and
India has developed from the concern for the building member owned, democratic,
economic institution which can strengthen the position of the co-operative members
in society. Social, economic, and political change for the members has been made
possible by the dairy co-operatives.
50
B.R. Patil, “Dynamics of livestock development in Gujarat, India: experiences of an Indian NGO”,
14, November, 2006. 51
Usha Jumani, “Empowering Society: An Analysis of Business, Government and Social
Development Approaches to Empowerment”, Foundation Books PVT.Ltd., New Delhi, 2006.
P 224.

67
According to J.P. Dhaka and N. Rangasamy (2007)52, the triumph of dairy
industry is extremely influenced by operations, viz., procurement of milk, processing
and distribution of milk and its products. Among these three components, milk
procurement is the edifice of the dairy industry on which economic efficiency of dairy
industry lies. Efficiency of milk procurement is heavily dependent on the operational
efficiency, viz., milk collection, transportation, chilling and reception of milk.
K.N. Srikanth (2007)53
conducted a study of Agricultural Economics of the
Performance of Dairy Cooperatives in Kolar District of Karnataka. The study was
undertaken with specific objectives of evaluating the working of dairy cooperatives,
to assess cost-return structure and their impact on milk production, income and
employment in Kolar district. The Entire district was divided in to two areas
(a) Above the average milk procurement area and (b) Below the average milk
procurement area. Eight societies were selected at the rate of four each from the each
selected area. Primary data were collected from the members and nonmembers of the
societies from 120 respondents for the year 2005-06. Secondary data were collected
from the societies for the period of ten years from 1995-2005. Tabular analysis,
percentages and compound growth rate analysis were worked out to meet the specific
objectives. Important finding is the employment generation out of respondents was
more in both the areas when compared with the employment creation out of nonmem-
ber respondent’s i.e., on an average 282.53 employment days from area-I as against
246.79 employment days from area-II. As per the opinion of members of
52
J.P. Dhaka and N. Rangasamy Indian Journal of Agricultural Economics Vol: 62, Issue: 4, pp 679-
693, Oct, 2007.
53
Srikanth K. N., “Performance of Dairy Cooperatives and Their Impact on Milk Production, Income
and Employment in Kolar District – An Economic Analysis”, Master of Science (Agriculture) Thesis,
University of Agricultural Sciences, Dharwad, 2007.
68
societies, it was observed that the performance of area-I was better than area-II. The
members in the area-I were highly satisfied regarding the correct weighment (70.00
percent) and transport problem is less severe (90.00 percent).
Prof. Mrs. Sunanda A. Chaudhari (2008)54
, in her study ‘A Geographical
Study of Co-Operative Dairy Farming -A Case Study in Jalgaon District’ concludes
that the Vikas Federation has taken tremendous efforts for quality and productivity
improvement under the control of present management. The improvement is in its
equipments and processes. The union invested large amount of capital to develop and
modify the infrastructural facilities. In this process the union is encouraging the DCS
to adopt modern and scientific milk collection and testing methods with the help of
technologically advanced equipments. The Union is also conducting awareness
programmes and workshops for farmers and DCS employees to encourage clean milk
production.
According to an article by Pratyusha Basu and Jayajit Chakraborty (2008)
55
from the University of South Florida, Livestock-based livelihoods are currently being
promoted by international development agencies as part of global efforts to combat
poverty. India's dairy development program, organized around village cooperatives,
has become an important model for such efforts. Field work for this research was
supported by the International Dissertation Field Research Fellowship Program of the
Social Science Research. This article aims to identify household characteristics that
influence membership in India's rural dairy cooperatives by comparing two villages
representing different degrees of success. Utilizing logistic regression methods, data
54
Prof. Mrs. Sunanda A. Chaudhari , “A Geographical Study Of Co-Operative Dairy Farming -A Case
Study In Jalgaon District”, Shodh, Samiksha aur Mulyankan (International Research Journal)—ISSN-
0974-2832 Vol. II, Issue-5 (Nov.08-Jan.09). 55
, Pratyusha Basu & Jayajit Chakraborty , “Land, Labor, and Rural Development: Analyzing
Participation in India's Village Dairy Cooperatives “,The Professional Geographer, Volume 60,
Issue 3 August 2008 , pp 299-313

69
collected through a comprehensive survey of all households in the two villages are
analyzed to examine
(1) How variables describing animal ownership, agricultural attributes, and
household labour availability contribute to explaining membership in the dairy
cooperative
(2) Whether factors influencing membership differ across the two villages.
The results indicate that although agricultural property ownership influences
cooperative membership in both villages, the kind of dairy animal used and labour
utilized for dairying work also have a significant and context-specific effect on
household participation.
A Study (2009)56
published under the Science News in Science Daily journal
suggests Research undertaken by the Universities of Reading, Cardiff and Bristol has
found that drinking milk can lessen the chances of dying from illnesses such as
coronary heart disease (CHD) and stroke by up to 15-20 %.The reviewers also believe
that increased milk consumption is likely to reduce health care costs substantially due
to reduced chronic disease and associated morbidity.
Sharma K. and Saini G.S (2010)57
in their research study ‘Satisfaction of
Dairy Farmers regarding the Selected Aspects of Marketing of Milk through
Cooperative Societies in Ludhiana’ confirms that the success of dairy enterprise in
Punjab lies in the disposal of milk through milk cooperative societies. How far are the
56 “Longer Life For Milk Drinkers”, Science Daily (July 24, 2009) — Science News
57 Sharma K. and Saini GS. “Satisfaction of Dairy Farmers regarding the Selected Aspects of
Marketing of Milk through Cooperative Societies in Ludhiana”, A Research report published by
Open agri : An Open Access Agriculture Research Repository ,04/19/2010.

70
dairy farmers satisfied with the different aspects of marketing? What changes could
be brought to make this system more efficient? These were the bases of conducting
this study. The data were collected from 200 dairy farmers to solicit their views about
these aspects of marketing. The farmers were satisfied with the existing system of
marketing of milk except two practices. They desired that no excess milk be taken
while fat testing and the payments should be made after every week as has been
envisaged in the schedule of the societies. The milk cooperative societies are playing
a significant role in promoting social and economic development of dairy farmers by
providing assured market for the milk. These encourage the farmers to rear the cow
especially the exotic breeds because disposal of milk is assured at reasonable price.
These societies have broken the monopoly of private milk vendors and helped the
dairy farmers in getting a competitive price for milk. This can encourage the dairy
farmers to take up dairy enterprise to supplement their farm income and make the
optimum use of their time and labour.
Gangasagare P.T, Karanjkar L.M and Kulkarni S.A (2010)58 conducted an
investigation to review the situation of dairying in Marathwada with the objectives to
study various trends of milk production and socio-economic status of the dairy
farmers. The survey was carried out on 295 dairy farmers from the milk pocket area
of eight districts of Marathwada region. Higher proportions of the dairy farmers were
enjoying the benefits of co-operative societies. Twenty per cent dairy farmers
believed in proper supply of quality feeds at subsidized rate, 74 per cent dairy farmers
have availed the financial facility, and only 4 per cent get the technical advice from
society.
58
Gangasagare P.T, Karanjkar L.M and Kulkarni S.A., Role of dairy co-operative society for im
provement in dairy industry in Marathwada region, Journal of Dairying, Foods and Home
Sciences, Volume : 29, Issue : 2, Year : 2010.

71
The analysis of the existing studies created an interest in the researcher to
undergo a complete study about a particular co-operative milk society. The studies
reviewed above are related to the present study to a great extent. The present study
fills the gap found in these studies in several respects.
2.2 METHODOLOGY
Designing a suitable methodology and selection of effective analytical tools
are important for a meaningful analysis of any research problem. This section is
devoted to describing the methodology, which includes the period of the study, the
area of the study, the sampling procedure, the procedure for the collection of data,
pilot study, construction of tools and pre-test and statistical tools used by the
researcher.
2.2.1 Period of Study
The study covers a period of eleven years from 1999-2000 to 2009-10. The
latest published data available is that of 2009-10. So the terminal year of this study is
2009-10.
2.2.2 Study Area
The area of operation of the Tirunelveli Milk Producers Co-operative Society
comprises of Tirunelveli, Palayamkottai, Thatchanallur, Melapalayam, Sankar Nagar
and the areas which belong to the Maanur Panchayat Union. All the above areas are
covered in this study.
2.2.3 Sample Design
The study covers the members of the Tirunelveli Milk Producers Cooperative
Society situated at a well-known place, namely Tirunelveli where most of the people
are engaged in cattle rearing in addition to agriculture. Out of the 799 members who
are supplying milk to the Society, a total of 125 members were selected. Out of the 50

72
milking yards of the Society situated in and around the city in various villages, 25
milking sheds were selected by stratified random sampling and 5 members from each
yard were randomly selected.
2.2.4 Collection of Data
This is an empirical research study mainly based on survey method. It was
proposed to collect both primary and secondary data.
Primary data
The primary data were collected directly from the members and officers of the
milk cooperative society. The researcher has used data sheet to collect information
from the officials. The data were collected from the respondents i.e. the beneficiaries
of the Society with the help of the interview schedules (vide Appendix A) and other
methods. The researcher has adopted sampling method for the study of attitude of the
members towards the functioning of the Society.
Secondary data
The secondary data pertaining to the study was collected from various files
and records kept by the Society. Data regarding the performance evaluation of the
Milk Cooperative Society were collected from the audit reports of the selected Society
directly by the researcher by visiting the office frequently.
Apart from that, secondary data were collected from
i) Directorate of Economics and Statistics, Government of Tamil Nadu, Chennai.
ii) Office of Assistant Director of Economics and Statistics, Tirunelveli District.
iii) Office of the Deputy Registrar of Cooperative Societies, Tirunelveli.
In addition to that, books, journals and magazines were referred. Journals such
as Indian Journal of Agricultural Economics, Indian Journal of Agricultural
Marketing, Indian Dairyman, The Indian Journal of Dairy Science, The TamilNadu

73
Journal of Co-operation and other relevant journals were referred to for collecting
secondary data for the study. Secondary sources of data relating to location, climate,
rainfall, soil type, land utilization pattern, production, yield of major crops and the
like were collected from the office of the Assistant Director of Economics and
Statistics, District Collectorate, Tirunelveli.
2.2.5 Pilot Study
A pilot study was conducted to find out the feasibility of getting the required
information for the study. Before choosing the research problem, the researcher met
some of the members and had fruitful discussions with them to know their attitude.
2.2.6 Construction of Tools and Pre-Test
Interview schedule used in this study has been structured by the researcher
herself. The variables to be studied had been identified in the preliminary interview
with some selected members of the milk societies. The variables thus identified by the
researcher had been converted into appropriate questions.
The interview schedules were pre-tested and revised in the light of the
experience gained from the pilot study.
2.2.7 Statistical Tools used
The researcher has used average, percentage, ratios, correlation, regression,
equation by the method of least square, graph, trend line, bar and pie diagrams.
The data collected from the files and records of the Society which were in turn
converted into graphs, trend lines, bar and pie diagrams had been used for realizing
the findings.
For the analysis of data and testing the hypotheses, the following statistical
tools were employed.

74
A) Karl Pearson’s co-efficient of correlation
To analyse the relationship between the number of members supplying milk to
the Society and the number of milch cattle owned by them, Karl Pearson’s
co-efficient of correlation59
method is used. It is also used to analyse the relationship
between the Society’s purchase price and the selling price of milk.
The framework of the analysis takes the following form.
r =
∑���∑��×∑��
where,
x = X – X
y = Y – Y
B) Method of Least Squares
To analyse the trend in the number of members supplying milk to the Society
and to find out the future trend, the method of Least Squares60 is used and ‘the line of
best fit’ is obtained. This method is also used to trace the trend in the total milk
procured by the Society from its members.
The trend in the payment of bonus to the members of the Society and the trend
in the net profit earned by the Society are calculated by the method of least squares.
The framework of the analysis is as follows.
Yc= a+bX
where Yc = Trend values
a = constant ( intercept ) or the value of the Y variable when X=0
59
Gupta S.P. , Statistical Methods, Sultan Chand & sons publishers , New Delhi, 1977, p E-10.10
60
Gupta S.P. , Statistical Methods, Sultan Chand & sons publishers , New Delhi, 1977, p E-14.22

75
b = Slope of the line or the amount of change in Y variable associated with a
change of one unit in X variable and
X = variable in time series representing time.
C) Method of Simple Averages
To measure the seasonal variation in the procurement of milk by the Society,
the method of simple averages under the ‘Analysis of Time Series’61
is used. The
seasonal index is calculated for each month by following the steps given below.
1. The data was arranged by months.
2. The totals of January, February, etc for the study period were found out.
3. Each total was divided by the number of years (9).
4. An average of monthly averages was obtained by dividing the total of monthly
averages by 12.
5. Taking the average of monthly averages as 100, the percentages of various
monthly averages were computed as follows
Seasonal index for January 100×=averagesmonthlyofAverage
JanuaryforaverageMonthly
D) Ratio Analysis
To analyse the financial performance of the TMPCS Ltd, the following ratios62
are used by the researcher.
A) Liquidity analysis ratios-Current ratio, Liquid ratio, Trade Dues and Other Current
liabilities to Working Capital ratio.
61
Gupta S.P. , Statistical Methods, Sultan Chand & sons publishers , New Delhi, 1977, p E-14-36
62
R.S.N. Pillai and Bagavathi, Advanced Accountancy, Konark Publishers PVT Ltd.1991,pp 1165-70.

76
B) Capital structure ratios-Total debt equity ratio, Long–term loan to equity ratio, Net
fixed assets to net worth ratio.
C) Profitability ratios of the Society-Operating ratio, Gross Profit and Net profit
ratios.
D) Turnover ratios-Fixed asset Turnover ratio, Receivable Turnover ratios, Stock or
Inventory Turnover ratios.
E) Multiple Linear Regression model
To analyse the profitability of the Society, Multiple Linear Regression63
model
has been used by the researcher. The framework of the analysis takes the following
form.
Y= a0 + a1X1 + a2X2 + a3X3 + u
Where,
Y = Total income from sale of milk
X1 = cost of milk sold + operating expenses
X2 = Miscellaneous expenses
X3 = Establishment expenses
a0 = intercept
a1, a2 and a3 are partial regression coefficients of the variables X1, X2 and X3
respectively and
u = Stochastic disturbance term.
F) Scaling
To measure the attitudes of the members towards the services rendered by the
TMPCS Ltd., the researcher has used the scaling technique. It includes the procedures
of assigning numbers to various degrees of opinion, attitude and other concepts. For
63
Kothari, C.R., Quantitative Techniques, Vikas Publishing House (P) Ltd., New Delhi. 1984, p 249.

77
the purpose of this study, the researcher has constituted a five point scale. At one
extreme of the scale, there is strong agreement and at the other strong disagreement,
and between them lie intermediate points. Numbers for measuring the distinctions of
degree in the attitudes/ opinion are assigned to individuals corresponding to their scale
positions.
G) Chi- square test
In order to study the association between the attitude of the members towards
the Society and the factors influencing the overall attitude, chi- square test has been
used. The frame work of analysis of the Chi- square64
test is as follows.
χ
2 =(��)��
O – observed value and
E – expected value.
H) Proportional analysis under ‘Z’ test
To examine whether the contribution of income from milk to the family
budget is substantial or not and also to find out whether the families of the members
can maintain themselves without the contribution of income from milk, the
proportional analysis under ‘Z’ test65 was used. The framework of the analysis is as
follows.
H0 = p1 = p2
H1 = p1 ≠ p2
Z = �����
������� �������
64
Gupta S. C., Fundamentals of Statistics, Himalaya Publishing House Bombay, 1987 pp 1168. 65
Kothari, C.R., Research Methodology, Wiley Eastern Limited, New Delhi, 1989, p.298.

78
Where,
p1 = proportion of contribution of income from other sources including
agriculture
p2 = proportion of contribution of income from sale of milk
q1 = 1- p1
q2 = 1- p2
n1 = no. of observations in the first sample
n2 = no. of observations in the second sample
n1 = n2 = 125.
I) Lorenz Curve and Gini Coefficient
In order to test the inequality in the distribution of income of the members
before and after the contribution of income from sale of milk, Lorenz Curve and Gini
Coefficient were used. The frameworks of the analysis of the test are as follows.
i) Geometrically, the Gini Coefficient66
may be defined with respect to Lorenz
curve as:
Area between Lorenz Curve and the Diagonal G =
Total area under the Diagonal
ii) The algebraic analogue of the geometric definition of the Gini Coefficient
is calculated by using the Trapezoidal Rule which is given as
G = 1 - Σ Pi (Zi + Zi – 1)
Where,
Pi = cumulative percentage of members
Zi = cumulative percentage of income
66
Elhance, D.N. Fundamentals of Statistics, Allahabad, Kitab Mahal, 1973, p 228-229.

79
2.3 PROFILE OF THE STUDY AREA AND SELECTED MILK SOCIETY
The usefulness of any research study can fully be appreciated only when the
results are studied with the geographic and demographic features. Hence, an attempt
is made to present a brief profile of the study area.
As the Milk Producers Cooperative Society is situated at Tirunelveli, we shall
first discuss the significance and multi focal view of Tirunelveli District in this
chapter.
2.3.1 Profile of Tirunelveli District
Tirunelveli is a district of Tamil Nadu state in Southern India. The city of
Tirunelveli is the district headquarters. A unique feature of this district is that it
consists of all five geographical classifications as found in ancient Tamil Literature;
Kurinji (mountains), Mullai (forest), Marudham (paddy fields), Neithal (coastal) and
Palai (desert). It is the second largest district as on October, 2008 the first being
Villupuram district.
Tirunelveli District, the penultimate southern most district of Tamil Nadu, is
described as a microcosm of the State. The district has diverse geographical and
physical features such as lofty mountains and low plains, rivers and cascades, seacoast
and thick inland forest, sandy soils and fertile alluvium, a variety of flora, fauna, and
protected wild life.
The District has been endowed with multitude of natural resources, judicious
management of which will ensure sustainable development in all sectors. The glory of
Tirunelveli District is the pride of Tamils. The crawling clouds on the Western Ghats,
the picturesque Pothigai hills and the Courtallam waterfalls are the special features
which make Tirunelveli unique. The lifeline of the district, river Tamiraparani feeds
the district and quenches the thirst of residents of Tuticorin district too.
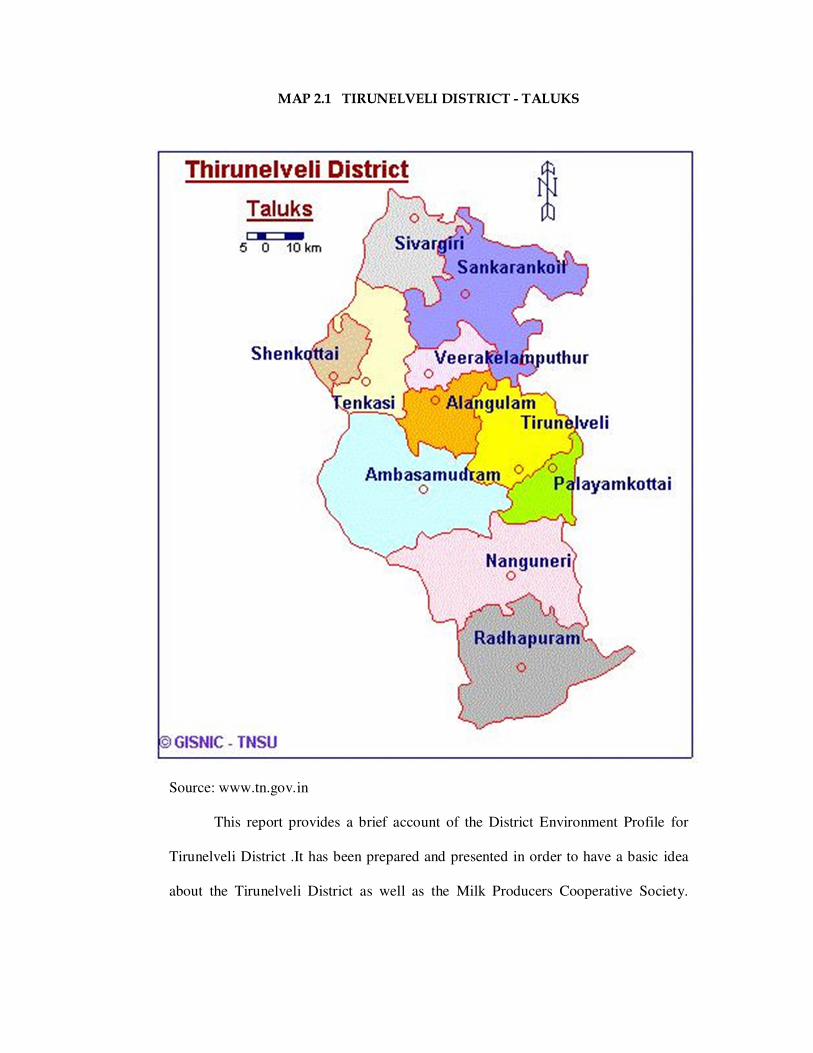
MAP 2.1 TIRUNELVELI DISTRICT - TALUKS
Source: www.tn.gov.in
This report provides a brief account of the District Environment Profile for
Tirunelveli District .It has been prepared and presented in order to have a basic idea
about the Tirunelveli District as well as the Milk Producers Cooperative Society.

81
Accordingly, the data compiled in the prescribed formats have been synthesised and
presented in this chapter.
Tirunelveli, the name has been composed from the three Tamil words i.e.
"Thiru-Nel-Veli” i.e. "Sacred paddy Hedge". This district is fertile on account of the
river Tamiraparani. In most parts of Tirunelveli district, paddy is the main
(cultivation) crop. On the whole, the district looks green always.
A) Puranic Association
The Tirunelveli Sthalapurana prescribes a tradition for the origin of the name
Tirunelveli. The puranic version goes that one Vedasarma, a staunch devotee of
Shiva, on his pilgrimage from the North to the South was invited by Lord Shiva in his
dream to his abode on the banks of the sacred river Tamiraparani. The delighted
devotee came to 'Sindupoondhurai on the banks of the river and stayed there with his
family. Once there was a famine which forced Vedasarma to collect paddy by way of
begging and continuing his daily prayers. One day he spread out the paddy to dry
under the Sun before the Lord, and went for his ablutions in Tamiraparani. He prayed
to the Lord for rain which he thought could be a remedy for the famine. His prayer
was answered and when he was bathing, a thunder storm broke-out and it rained
heavily. Vedasarma rushed to the place where he had spread the paddy. He witnessed
a miracle. Despite rain around the area, the paddy that he had spread did not get even
a single drop of rain and did not get wet. Since then, according to the purana the
Town is called as “Tiru-nel-veli” (Sacred hedged paddy).
B) Economic profile
Tirunelveli has been an agricultural state through the ages. The district is a
major producer of Paddy (Rice), Coconut, Banana, Spices and forestry based
products. The district's Livestock and Poultry data is given in the table 2.1.

82
TABLE 2.1
LIVESTOCK AND POULTRY POPULATION OF THE DISTRICT
Cattle Buffaloes Sheep Goats Pigs
Horses &
Ponies
Donkeys Rabbits
Total
Live
stock
Total
Poultry
418,694 78,777 487,273 390,570 12,752 245 961 2401 67,877 1,218,583
Source: 17th Livestock Census 2004
According to Table No.2.1, total livestock population in the district was
67,877 and total poultry population was 1,218,513 in the year 2004.
Tirunelveli, being a coastal district, is also involved in fisheries development
and production. For the period 2005 - 2006, the total inland fish catchment stood at
1,874 tonnes while the total marine fish catchment was 7,014 tonnes. The district is
also rich in mineral wealth. It has a total 407 mining and quarrying units. Limestone,
granite and garnet sand are some of the minerals mined/produced here. The major
industries in the district include textile, food products and forestry products. A Special
Economic Zone (SEZ) was started at Nanguneri in 2001. A pharma park, Windmill
spare parts units and a television manufacturing unit has been planned in this SEZ.
TIDCO has planned to set up a Rs 700-crore Hi-Tech Industrial Park in Nanguneri in
association with INFAC Group and Axes Technologies Inc, US. The State
Government is planning to have manufacturing of light, design and assembly
facilities, modern infrastructure facilities and amenities in this SEZ to attract
workforce from across the globe.

83
C) Land Area
The district is bounded on the North by Virudhunagar district, on the East by
Tuticorin district, and Travancore areas of Kerala State and Kanyakumari district on
the West. The Gulf of Mannar bound the Southern side. In the west, hills of the
Western Ghats ranging from 1000 to 2000 metres form the dominant boundary.
Tirunelveli District having geographical area of 6823 sq.kms, in the Southeastern
portion of Tamil Nadu is triangular in shape.
The land utilisation pattern of Tirunelveli district for four years (2003-04 to
2006-07) is furnished in Table No.2.2 in the adjoining page.
TABLE 2.2
LAND USE PATTERN - 2003-04 TO 2006-07
(Area in hectares)
Sl.No. Classification 2003-2004 2004-2005 2005-2006 2006-2007
1. Forest 1,20,801 1,20,801 1,20,801 1,20,801
2. Barren and Uncultivable uses 30,961 30,961 30,961 30,961
3. Land put to Non-Agricultural
uses 1,01,546 1,01,722 1,03,669 1,05,284
4. Cultivable Waste 64,555 64,345 47,442 41,613
5. Permanent Pastures and Other
Grazing Land 5,267 5,267 5,271 5,353
6.
Land Under Miscellaneous
Tree Crops and Groves not
included in Net Area Sown
10,822 10,846 10,009 10,049
7. Current Fallows 36,622 23,574 32,053 30,075
8. Other Fallow Lands 1,78,545 1,58,373 1,65,481 1,63,064
9. Net Area Sown 1,33,189 1,66,419 1,66,621 1,75,108
10. Total. Geographical Area 6,82,308 6,82,308 6,82,308 6,82,308
11. Total Cropped Area 1,48,127 1,98,422 1,39,776 2,07,868
12. Area sown more than once 14,938 32,003 28,644 32,760
Source: Season and Crop Report of Tamil Nadu, (Various issues)

84
According to Table No.2.2, the total area of the district amounts to 6,82,308
hectares of which total cropped area accounts for 2,07,868 hectares and forest land
accounts for 1,20,801 hectares in the district.
D) Geographical and Physical Features
The prominent hills are part of the Western Ghats and form the boundary
between Kerala State and this district on the western side. The Western Ghats run to a
length of about 160 km. in the district starting from the north-western part in
Sankarankoil Taluk and ending at about 15 km. from Kanyakumari. Valuable trees are
found in the Western Ghats. The Western Ghats lie on the western part of
Sankarankoil, Tenkasi and Ambasamudram taluks. Near the border of Tenkasi and
Ambasamudram taluks, the ghats widen forming undulating hills, broad valleys and
extensive plateau. The height of the hills diminished considerably near Sengottah and
permits communication by road and rail to places in Kerala through the Sengottah
pass. Besides this, a portion of the range lie on the southern part of Ambasamudram
taluk and in the western and southern portion of Nanguneri taluk, It diminishes in
height at Aramboly permitting road communication with Kanyakumari. The hills of
the Western Ghats have valuable trees, which are being exploited for commercial
purposes.
The most conspicuous among the hills is Agasthiamalai and is considered the
seat of the Saint Agasthiyar who was conducting research in Tamil language.
E) Geographical Location of the District
Tirunelveli district is bounded by Virudhunagar district in the North, Kerala
State and Kanyakumari district in the West, Gulf of Mannar in the South and
Tuticorin district in the East. The district lies between 80 10’ and 9
0 40’ north latitude
and 770 21’ and 77
0 99’ east longitude.

85
F) Administrative Arrangement in the District
The Tirunelveli district comprises 11 taluks, 19 blocks and 481 villages. As
regards the hierarchy of administrative arrangement, there are 1 corporation, 6
municipalities, 38 Town Panchayats and 424 village panchayats in the district. The
community development blocks are Vasudevanallur, Sankarankovil, Kuruvikulam,
Melaneelithanallur, Shencottai, Tenkasi, Alangulam, Keelapavoor, Kadaiyanallur,
Manur, Palayamkottai, Ambasamudram, Kadayam, Pappakudi, Cherenmahadevi,
Nanguneri, Kalakadu, Radhapuram and Valliyoor.
Table No.2.3 given below clearly shows the division of the district facilitating
easy administration.
TABLE 2.3
ADMINISTRATIVE ARRANGEMENT OF THE DISTRICT
Source: Unpublished Records of the District Statistical Office, Tirunelveli.
G) Meteorological Information
The district has a peculiar climate and receives rainfall in all the seasons. The
district receives a rainfall which is more than the annual average rainfall in the months
of May, October, November and December. This is due to North-East and
Tirunelveli
Location Code Number 29
Number of Taluks 11
Number of CD Blocks 19
Number of Towns 45
Number of Municipalities 5
Number of Town Panchayats 38
Number of Census Towns 1
Number of Villages 481

86
South-West monsoons. The Climatic Condition of the District is discussed in the
following paragraphs.
Temperature
In the day time the coastal regions are cooler than the interior parts by about a
degree in summer and southwest monsoon seasons and warmer by one to two degrees
during the rest of the year. From about the middle of February, temperature increases
steadily. In May which is usually the hottest month in the interior, the mean daily
maximum temperature is 37.1 degree Celsius. The weather is quite hot in May and
June and the maximum temperature sometimes reaches 45 degree Celsius. With the
onset of the southwest monsoon by the end of May or beginning of June, there is
some drop in temperature. By about the middle of October, both day and night
temperatures decrease appreciably. The period from November to January is the
coolest part of the year with the mean daily maximum temperature of about 30 to 31
degree Celsius in the interior parts. The mean daily minimum in these months is about
22 to 23 degree Celsius in the district in general.
Humidity
The relative humidity in general, during the year, is between 55 and 65 percent
in the interior parts of the district, except during the Northeast monsoon season, when
it is over 65 per cent. The coastal parts are comparatively more humid.
Winds
• Generally light to moderate in strength.
• Between May and September winds are mainly North westerly or Westerly.
• From October to February winds are mainly North easterly or Northerly
Rainfall.
• Main rainy season is from October to the middle of January.

87
• During the Southwest monsoon season the rainfall is more in the western parts
of the district.
• November is generally the rainiest month. The heaviest rainfall in 24 hours
recorded in the district was 371.5 mm at Sivagiri on 29/10/1929.
• The average rain fall in the district is 814.8 mm per annum.
According to the Annual employment report of Tirunelveli District in the state
of Tamil Nadu for the year 2007-08 submitted by the District Rural Development
Agency – Tirunelveli, Month wise Rainfall of Tirunelveli District during the year
2006 - 2007 is as given in Table 2.4 in the adjoining page.
It can be assumed that the same trend is more or less found in the monthly
rainfall pattern of the district in the following years.
TABLE 2.4
MONTHLY RAINFALL FOR 2006 - 2007 (In Millimeters)
Month Actual Normal %Deviation
Jun-06 26.4 20.6 28.2
Jul-06 26.7 23.1 15.6
Aug-06 19.1 17.2 11.0
Sep-06 43.4 31.7 36.9
Total (South-West Monsoon) 115.6 92.6 23.9
Oct-06 373.9 138.9 169.2
Nov-06 389.7 193.7 101.2
Dec-06 21.1 97.2 -78.3
Total (North-East Monsoon) 784.7 429.8 82.6
Jan-07 19.8 41.4 -52.2
Feb-07 0.1 31.2 -99.7
Total (Winter) 19.9 72.6 -151.9
Mar-07 7.5 41.7 -82.0
Apr-07 119.7 61.6 94.3
May-07 9.1 38.6 -76.4
Total (Hot summer) 136.3 141.9 -64.1
Annual Total 1056.5 736.9 -109.5
Source: Records of Indian Meteorological Department, Chennai -6.

88
The Comparative Statement of Rainfall of this district in mm given above
shows that the total amount of rainfall received is 1056.5mm in 2006- 2007, The
maximum precipitation is contributed by the North East Monsoon 784.7mm followed
by the South west monsoon 115.6mm.
The following chart shows the actual amount of rainfall and the normal
amount of rainfall expected during various months. The deviation of the actual from
the normal rainfall can be easily identified.
From the chart, we can easily understand that the actual rainfall obtained
during the months of October and November is very much higher than that expected
during the months.
H) Demographic Details
The growth of population over the past four decades and the essential
characteristics of the population for the past few decades in terms of birth rate, death
rate, infant mortality rate and literacy level are given in the following paragraphs to
have an idea about the demography of the District.
0
50
100
150
200
250
300
350
400
450
june july aug sep oct nov dec jan feb mar apr may
Mm
Month
FIG.2.2 MONTHLY RAINFALL FOR 2006-07
Actual
Normal

Population
The population of Tirunelveli district has grown from 16,98,578 in 1961 to
30,72,880 in 2011, the density of population per sq.km. being 458. In 2011,
Tirunelveli has population of 30,72,880 of which male and female are 15,18,595 and
15,54,285 respectively. There is a change of 13.66 percent in the population compared
to population as per 2001. In the previous census of India 2001, Tirunelveli District
recorded increase of 8.93 percent to its population compared to 1991.
The year-wise population of the district from the years 1961 to 2011 is
depicted in the chart below. The trend in the increase in population can also be traced.
Source: Tamil Nadu Census, 2011.
Trend in Birth/Death Rate and Infant Mortality Rate
There has been a steady decline in birth rate, death rate and infant mortality
rate over the decades in the district. The birth rate has come down from 25.38 in 1961
to 19.60 in 1991(figures - per thousand) and the death rate from 9.32 in 1961 to 7.20
in 1991 figures –per thousand). The infant mortality rate has also gone down from
60.86 in 1961 to 47.0 in 1991 (figures - per thousand).
0
5
10
15
20
25
30
35
1961 1971 1981 1991 2001 2011
Population in lakhs 16.98 19.91 22.23 27.4 28.01 30.72
Po
pu
lati
on
in l
ak
hs
FIG.2.3 POPULATION OF TIRUNELVELI DISTRICT (YEARWISE)

90
The trend in birth rate, death rate and infant mortality rate from 1961 to 1991
is shown in the following line chart.
Source: Tamil Nadu Census, 1991.
Literacy Level among the Population
The literacy level of Tirunelveli district, according to figures available for the
year 1996 is 55.16% with male literacy level being more than the female literacy
level. It is also observed while the male literacy level has grown from 53.78% in 1981
to 63.50% in 1996, there has been a significant increase of female literacy level from
34.16% in 1981 to 47.06% in 1996.
Average literacy rate of Tirunelveli in 2011 is 82.92 compared to 76.09 of
2001. If things are looked out at gender wise, male and female literacy are 89.66 and
76.38 respectively. For 2001 census, same figures stood at 85.21 and 67.43 in
Tirunelveli District. Total literate in Tirunelveli District are 22,98,262 of which male
and female are 12,23,964 and 10,74,298 respectively. The information on literacy
level of the district is shown in the chart in the adjoining page.
0
10
20
30
40
50
60
70
1961 1971 1981 1991
Census years
FIG.2.4 DISTRICT BIRTH/DEATH RATE AND INFANT MORTALITY RATE
Infant Mortality rate
Birth rate
Death rate
Parameter
(per
thousand)
Parameter
(per
thousand)

91
Source: Tamil Nadu Census, 2011.
I) Education
Three polytechnics, one Engineering College and two Medical Colleges
including a Siddha College are functioning in this district. The ratio of Higher
Secondary schools is 0.54, Secondary schools 0.65, a middle school 1.49 and Primary
schools are 3.31 for every 10000 urban population in Tirunelveli district.
Tirunelveli and Palayamkottai are twin cities considered to be excellent
academic centres. They are regarded as the “Oxford of South India”. This district is
blessed with all types of colleges and schools with a historic background.
J) Resources
Resources of the district, their availability, use and environmental status are
discussed in the following paragraphs.
1. Land Resources
Land Utilisation:
The total geographical area of the district is 6,82,308 hectares of which
cropped area accounts for about 25.66% of the total area. Forestlands cover about
1981 1991 1996 2001 2011
Total 9.73 14.19 16.85 19.17 22.98
Male 5.86 8.19 9.56 10.42 12.24
Female 3.86 6 7.29 8.75 10.74
0
5
10
15
20
25
I
n
L
a
k
h
s
FIG.2.5 LITERATE POPULATION OF TIRUNELVELI DISTRICT

92
17.71% of the total land. A significant portion of the land falls under the category of
‘non available for cultivation’ and ‘fallow lands’.
The land utilisation pattern in Tirunelveli district during 2006-07 is shown in
the form of a pie chart given below.
FIG.2.6 LAND UTILISATION – TIRUNELVELI DISTRICT
Paddy is cultivated mainly in Sankarankoil, Tirunelveli, Tenkasi, Shencottai,
Ambasamudram and Nanguneri taluks. Cambu, Cholam and Kudiraivali are being
cultivated in the dry tracts of this districts namely Sivagiri and part of Sankarankoil
taluks. Cotton is being cultivated mainly in Sankarankoil taluk.
Soil Types
The two major groups into which the soils of the division may be divided are
the red and black. The black soil is restricted to the cultivated area. The red soils
non available for
cultivation, 19.97
Other
uncultivated
lands, 8.35
Fallow lands,
28.31
Cropped area,
25.66
forest lands,
17.71

93
being generally the result of decomposition in situ of underlying ferruginous rock
vary considerably in character depending upon the local edaphic factors.
Trend in Production and Productivity of Important Crops:
Cereals, pulses and oil seeds have been the three important crops produced in
the district. The productivity pattern over the past 16 years indicates that the
productivity of cereals, pulses and oil seeds have fluctuations but they have
significantly gone down in the years 1995-96. Another significant feature is the
decrease in the area under production for cereals, pulses and oilseeds in the years
1995-96.
Animal Husbandry
Livestock population comprises mainly of cattle and buffaloes, sheep, goats,
pigs and poultry. The following veterinary institutions are available in the district:
1. Clinic centres
2. Veterinary hospitals
3. Veterinary dispensaries
4. Veterinary dispensary cum-key village centre
5. Clinical laboratories
6. Animal disease intelligence unit.
Under the Special Animal Husbandry Project, a sheep production program
was implemented. 129 sheep breeding co-operative societies had been covered under
this project besides 8 societies functioning under the Agricultural Refinance
Development Corporation. A mass dowering program for augmenting mutton
production is being implemented.

94
2. Forest Resources
The total area of the forest of the district is 1,22,055 hectare of which 81700
hectare is set apart for Tiger reserve of Mundanthurai and Kalakadu. The entire forest
of the district stretches along the Western ghats. Various types of forests from
luxuriant tropical wet evergreen forests to southern thorn scrub forests occur in the
district. Owing to its diverse geographical factors, the forests in the district are
technically classified as Southern hill top tropical evergreen forests, West Coast
tropical evergreen forests, Southern moist mixed deciduous forests, Ochlandra reed
forests, Carnatic umbrella thorn forests Southern Euphorsia scrub and Southern thorn
scrub.
The ghat regions are under the influence of the Southwest monsoon and have
thick forests. The forests are of light deciduous growth in the lower slopes and dense
masses of short trees from an elevation of1000' to 3000'. Above 3000, evergreen
forest with very tall trees is found. Teakwood, black wood, rose wood etc. are the
most important among them. The important forest products of Tirunelveli division are
honey, wax, cashew, palmyrah, cane pepper, tamarind, bamboo etc.
3. Mineral Resources
Lime stone and garnet sand is the mineral reserves found in the district.
Limestone is a major industrial mineral found in the district and the requirements of
M/s. India Cement, Talaiyuthu with a capacity of 2550 tonnes per day are met from
the crystalline limestone deposit located around Tirunelveli. There are large reserves
of limestone of the crystalline, sedimentary, corraline and tufaceous types amounting
to 59 million tonnes in the Nanguneri, Ambasamudram, Sankarankoil and Tenkasi
taluks. Alluvial gypsum occurs in the Sankarankoil taluk. The mineral is being
utilised chiefly for cement manufacture.

95
4. Water resources
Rivers canals and Water ways
Tamiraparani river rises in Agasthiyamalai of the Western Ghats. The river
gets water from both Southwest and north- east monsoons and is never dry. At
Papanasam, the river has been dammed for regulating the supply of water for
irrigation and for generation of electric power. The river Tamiraparani has its origin in
the district. Pambayaar, Peyyar, Ultar, Pambar, Kariyar and Servalar are the chief
tributaries of Tamiraparani. The other important rivers in the district are Chittar,
Jambunadi and Gatananadi. There have been 5 dams/ reservoirs in the district, which
are used for irrigation two of them are used for power generation. Papanasam dam /
reservoir has the maximum water spread areas as well as designated capacity.
K) Urbanisation
Urbanisation pattern
The proportion of urban population to total population has increased rapidly
during 1981-96 from 29.74% to 44.91%. Among the urban areas, Town Panchayat
accounts for a greater share of urban population while compared to the other urban
areas. The proportion of rural population to total population has decreased from
70.26% to 55.09% during the years 1981-1996. It is 48.03% urbanised in 2001.
Density of Population
The overall density of population has increased from 324 persons / sq.km. in
1981 to 446 persons / sq.km. in 1996. The density in urban area has increased from
2079 persons/sq.km. in 1981 to 3840 persons/sq.km. in 1996 and the density of rural
area has also increased from 239 persons/sq.km. in 1981 to 259 persons/sq/km. in
1996. In 2001, the overall population density was 410.5 persons per square kilometer.

96
Population below Poverty Line
As per the population Below Poverty Line survey done in 1992, number of
families below poverty line is 151370 in the district.
Financial Institutions
The district has a wellbuilt banking structure catering to the needs of the farm-
ing populations. The district is well served by 86 branches of nationalized banks, 66
co-operative bank branches, 47 Pandian Grama Bank branches, 76 Private sector bank
branches and 500 plus chit companies. Both the public and private sector banks play
an active role in extending finance to agriculture in line with national objectives.
L) Industries
Though the main occupation of the people is cultivation in recent years
industries and services are also competing with this ancient occupation. M/s. India
Cements of Talaiyuthu, Co-operative Spinning Mills situated at Pettai near
Tirunelveli and other spinning mills in Ambasamudram and Thoothukudi, Sun Paper
Mill of Cherenmahadevi, Dharani Sugar mill at Vasudevanallur are a few large scale
industrial units functioning in the district.
The industries prevalent in the district may be classified under
(i) household industries
(ii) small scale and
(iii) medium and large-scale industries.
Beedi rolling, safety matches making, mat weaving and processing and
manufacture of palm fibre and articles from palm trees and handloom weaving of
textiles are the main household industries. Workers in household industries are
concentrated mostly in Tenkasi, Ambasamudram and Tirunelveli taluks. Safety
matches are manufactured mainly in Sankarankoil and Sivagiri taluks.

97
Handloom weaving is prominent in Ambasamudram and Tenkasi taluk. Beedi
rolling and mat weaving are chiefly found in Tenkasi, Ambasamudram and
Tirunelveli taluks. Manufacture of articles from palm trees in mainly found in
Nanguneri taluk where palmyrah trees cover large areas. There are about 2300
small-scale industries. Of all the 18 major groups, units manufacturing chemical
products alone account for nearly one third. Next comes the manufacture of food
products, under food products salt industry form about one third of the total number
of registered units under food products. The chief items produced by large-scale
industries in the district are cement, cotton yarn, textiles, chemicals and chemical
products. M/s. India Cements Limited have two plants, one in Sankarnagar and
another in Talaiyuthu for producing cement. The production of "Portland Cement" in
1979 was more than 13 lakh tonnes. There are more than 20 textile mills situated in
this district for the production of yarn. The first spinning mill under co-operative
moment was established in this district during 1958 at Pettai near Tirunelveli. Most of
them are situated in Ambasamudram, Tirunelveli, and Nanguneri taluks. Tamil Nadu
Sugar Corporation Limited has established a factory at Tirunelveli, which has a
capacity to crush 1250 tonnes of cane a day.
There have been 24 red category, 52 orange category and 8 green category
Industries in 1995-96, which are classified, based on the nature of hazard by TNPCB.
Red category industries are mostly chemicals, textiles and pharmaceutical industries.
N) Summary of Observations
The key observations of the environmental profile of Tirunelveli district are
Demographic details
• The growth rate of population has been in an increase at about 2.32 % per
annum during the period of 1981-91. The population of Tirunelveli district has
shown an increase of about 60.37% from 1961 to 2001.

98
• It is encouraging to note that the female literacy rate has significantly
increased in the past 15 years.
Land resources
• Utilisation of land cropped area is up to 20.91% in the Tirunelveli district.
A land area of 10.65% remains as cultivable wasteland.
Forest resources
• The forest area in Tirunelveli district is about only 17.62% of the land area.
• Protection of wild life has received a major impetus in the district with
declaration of Kalakadu - Mundanthurai Sanctuaries on Tiger Reserve.
Urbanisation
• Urbanisation process in Tirunelveli district has been taking place at a higher
rate. However, certain essential needs of urban areas like drinking water,
electricity, public convenience, drainage, approach roads and health centres
have not been increased keeping pace with the process of urbanisation.
• There is an increase in urban slum population in Tirunelveli district for the
past five years in spite of several poverty alleviation program undertaken by
Government.
• There has been no much improvement of urban services particularly protected
drinking water and solid waste management in the district.67
2.3.2 A Short Profile of “Tirunelveli Milk Producers Cooperative Society Ltd.,
O.1067” (TMPCS Ltd.) called by name ‘Palagam’
This part of the chapter gives a short introduction about the Milk Society, its
formation, registration, objectives, functions and its current position. The TMPCS
Ltd. is functioning at the heart of Tirunelveli city and it is very near Tirunelveli
67 Tirunelveli District Environment Profile – Final Report 22, AIMS Research, Chennai – 600 018.
Directorate of Environment, GTN.

99
Junction. Thiru S. Ramaswamy, a lawyer founded the Society. This Society started
functioning even before we got independence.
Before studying about the formation and growth of the Tirunelveli Milk
Producers Cooperative Society, it is essential to trace the sufferings of the innocent
and gullible milk vendors which necessitated the foundation of a cooperative milk
society. Before the starting of the Society, people belonging to a specific community
called ’Yadavar’ alone were engaged in the business of supplying their domestically
produced milk to the population in and around Tirunelveli. Initially, the quantity dealt
with was small and there was no need for a large scale organization. Very often there
were surplus quantities of milk that could not be sold profitably. They faced much
hardship due to this type of unsalable random surpluses. Such inconveniences were
very common in other sub-urban areas and excess supply in rural areas. It was a
paradoxical situation. The sub-urban surplus milk had to be procured and sold at
scarce urban centres. As there was no centralized arrangement to procure and sell
milk from the milkmen, the milkmen were put to a lot of hardship. They wanted to
solve this very inconvenient problem on a permanent basis. Moreover they found it
very hard to collect money from the hotel owners who purchased their milk. Under
such conditions, they could not concentrate on agriculture and led a miserable life in
great poverty.
Considering the serious problems faced by the community,
Thiru. S. Ramasamy a lawyer, a stalwart and a kind-hearted gentleman of the Yadavar
community put his heart and soul to explore a scientific method to solve this problem
of ‘Scarcity in the midst of plenty’. He worked about certain viable arrangements by
which the surplus milk in and around Tirunelveli could be systematically processed
and sold at fair prices to the urban consumers regularly. He gathered the mass support

100
for his idea and evolved a system in which incentives would be available for those
who are engaged in the production of milk and those who sold milk. The quality of
milk also would be at a very high level .It was a system in which the producer, the
seller and the ultimate consumer could be suitably rewarded.
A) Founder of the Society
Mr.S.Ramasamy was a popular leader. He dedicated his whole life for the
welfare of the people. Out of the three Cooperative institutions started by him, the
Tirunelveli Cooperative Milk Supply Society flourished by leaps and bounds and
soon established itself as a premier cooperative institution. In Tirunelveli District,
Mr. S.Ramaswamy’s involvement with the institution and his contribution to the rapid
growth are praiseworthy. Mr.S.Ramaswamy started the milk supply society with a
great vision. As he hailed from an agricultural family, he knew the difficulties of
farmers. The farmers of the district with their small holdings of land could not always
depend upon the income from their land for their subsistence. Hence they had to
necessarily seek alternative employments. This scenario is not peculiar to Nellai
district alone and it has a national relevance. Hence it will be in order here to project
dairying as a valuable and gainful alternative employment for the farmers of Nellai
District in particular and that of the country in general.
B) Establishment of the Society
In order to put an end to such exploitation of the gullible Yadava milkmen,
some of the educated and thoughtful persons of the Yadava community convened a
meeting at the house of Govindadass, under the leadership of Mr.S.Ramaswamy,
Mr.Chakrapani Nambiar, Mr.Govindakonar, Mr.Dakshana Moorthy konar,
Mr.Kandhasamydas, Mr.Armugakonar, Mr.Shunmugasundara Perumaldas,
Mr. C.S.Yadav and Mr.K.Muthaiah konar were among the important persons who

101
attended the meeting. During the discussion, Mr.S.Ramaswamy insisted that they
should produce and supply only pure milk. He vehemently opposed on the idea float-
ed by somebody that they could sell impure milk and yet escape punishment by open-
ly advertising that, “This milk is not pure one” on the pattern of many hoteliers who
sell their food items by openly stating that they were not prepared with pure ghee thus
escaping from the punishment of the health inspectors. At last, all the members agreed
that they would insist on the supply of quality milk.
C) Formation and Registration
With his novel and beneficial ideas, Mr.S.Ramaswamy mobilized support
among the common masses and ultimately founded the “Tirunelveli Milk Supply
Co-operative Society Ltd.” in 1945 on a cooperative basis. When Mr.S.Ramasamy
could convince others about the importance and value of the co-operative society,
nearly 10 members joined together and made an application to the Deputy Registrar
of Co-operative Societies with a request to sanction one co-operative society to the
milk producers of Tirunelveli. The Deputy Registrar verified the application and
sanctioned . Thus, the Cooperative Society was born. It was made open for all
sections of public at large and it was not confined to any particular community.
This voluntary association was registered as “Tirunelveli Milk Supply
Co-operative Society Ltd., O.1067” under section 4 of the Madras Co-operative
Societies Act of 1932, on 13th May 1945. The certificate of Incorporation and the
certificate of commencement were duly obtained. The Society started functioning on
the date of registration itself. Since then, it has been functioning based on the
principles such as “each for all and all for each” and “self–help through mutual help”.
The register number of the Society is O.1067. Later on, it has to be changed as
Producers Society on 29th
January 1993. The other name of the Society is “Palagam”.

102
D) Commencement of the Society
During the initial period, the Society did not have a building of its own and
hence it was functioning in a rented building opposite to the Kannamman Kovil,
Tirunelveli Junction. In the first year, the total strength of the members was 3 to 9 and
the paid-up share capital was Rs.7445. After streamlining the organisational setup of
the Society, Mr.S.Ramasamy made arrangements for the inauguration of milk supply.
The milk supply of the Society was commenced on 27th
by Mr.Radhakrishnan pillai
who was then the Mayor of the Madras Municipal Corporation and also a veteran
congress leader. To begin with milking yards were started at seven places in the
following areas – Udayarpatti, Sindhupoonthurai, Tirunelveli town, Saliyar Street,
Town Veeanthaaki Pillayar Kovil Street, Thatchanallur and Thatchanallur
Theneerkulam. He also appointed the necessary personnel to manage these milking
yards at different places.
E) Early problems of the Society
The Society incurred loss at the beginning. There were a number of reasons
for the initial failure. The hotel owners and the common public could not develop
confidence in the Society. As they were used to get milk from private vendors, they
could not change their mind all of a sudden. Moreover the private vendors sold their
milk at the doorsteps of the consumers while the Society was selling milk only from a
few identified spots. Due to this reason, the consumers did not show much interest in
the milk sold by the Society. In addition to this, many hotel owners began to rear
cows of their own. The monsoon was very good during those years and hence the
milk production was at its peak. These factors resulted in decrease in the demand for
the milk supplied by the Society. Moreover some hotel owners who got milk from the
Society were not prompt in their payment.

103
As there was no sufficient demand for the Society milk, a large quantity of
milk remained unsold. Further there was no proper facility to store the milk
scientifically. Hence they tried to make other by-products of milk such as curd, butter
and ghee and sell them. Even this attempt was not profitable. Hence they gave it up.
As a result there was a large stock of unsold milk. As there was no other go, hundreds
of litres of milk were poured into the Tamiraparani river. Owing to this, the Society
had to face a heavy loss. The office bearers and member of the Society were very
much disheartened and highly frustrated, but the president of the Society
Mr. S. Ramaswamy never lost will and he optimistically instilled confidence in the
hearts of the members and tried to boost up the morale of the Society which was at its
lowest ebb. Because of the sincere efforts taken by him the Society was saved from a
crisis.
F) Objectives of the Society
The principal object of the Society is to improve dairying among the members and
to assist them to produce pure milk. In order to achieve the main objective, the
following are the several goals of the Society.
1. To help to develop the economic and financial position of the members of the
Society.
2. To help increase the milk production by improving the quality of milch cattle.
3. To take efforts for the proper maintenance of the milch cattle.
4. To procure standard milk at suitable prices.
5. To take steps to get reasonable price for the milk which is sold to the Union.
6. To develop the saving habits of the members. For this purpose, the Society
deducts some amount in the name of members thrift fund at the time of
payment.
104
7. To spread the principles and policies of co-operation among the members.
G) Administration and Management
As per the by-laws of the Society, it should be managed by a board
constituting ten directors elected from the members and headed by a president elected
from the board of directors. The president shall conduct general meetings every
month. In his absence, the members may choose a chairman among themselves to
preside over the meeting.
But, the elections were not conducted for the past few years. In order to
administer and manage the daily routine functions of the Society, there is an office
headed by a paid secretary. The secretary shall be responsible for the executive
administration of the Society subject to the control of the President.
Under the secretary, there is a head clerk and four supervisors for various
works. The milch yards are managed by clerks appointed by the Society. There is
also a typist, attender and watchman for all milch yards and a peon is also appointed
for carrying out various activities.
The chart in the adjoining page shows the line organization of the
administration set up followed in the TMPCS Ltd.

105
Chart No. 2.7 Line Organisation of the administration
Supervisor
(Milk Shed)
SECRETARY
HEAD-CLERK
Supervisor
(General and
Internal Audit)
Supervisor
(Vendors)
Assistant
Master
Cleaner
Clerk
(Establish
ment)
Clerk
(Invoice Check-
up)
Clerk
(Accounts)
Clerk
(Stores &
Record)
Clerk
(Cash)
Clerk
(Members
loan)
Clerk
(Production)
Keeper (Shed)
Watcher (Shed)
Cleaner Peon
Clerk
(Distribution)
Vendor
Attender
Watchman
Clerk
(Milk Card issues)
Attender
(Card Sales)
Assistant
Supervisor
(Stall)

106
H) Building Facility
As told earlier, this Society is functioning in the middle of the city near
Tirunelveli Junction in its own building. The Society enjoys its own three-storied
building and one underground storage room. The office of the Society is functioning
at the first floor. On the second floor, the central co-operative bank is functioning.
The third floor is meant for conducting the general meetings of the Society. All
facilities and physical amenities with a fully equipped meeting hall have duly been
provided with.
At present, the Society has set up a livestock farm at Abishekapatti which
covers a very wide area. In this farm, several high-breed variety cattle like Sind,
Jersey and Murrah Buffalo are brought up in order to increase the milk production of
the Society.
There are 50 milch yards in total, out of which 12 are functioning in the
Society’s own building. The Society had a van of its own which was used for the
procurement and distribution of milk. Due to heavy maintenance costs, the van has
been sold by the Society and now the transport of milk is done using a hired van.
I) Area of Operation
The TMPCS Ltd. is functioning in a wide area. It can cover up to eight kilo
metres surrounding the city of Tirunelveli. Its area of operation is listed below.
1. Municipal Corporation - The Municipal Corporation area has been divided
into four zones namely
a) Tirunelveli Zonal b) Palayamkottai Zonal
c) Melapalayam d) Thatchanallur Zonal
2. Sankarnagar Township
3. Vellalankulam Panchayat Area

107
4. Naranammalpuram Panchayat Area
5. Rajavallipuram Panchayat Area
6. Thenkalam Panchayat Area
7. Palamadai Panchayat Area
8. Karaieruppu Panchayat area
9. Abishegapatti Panchayat Area
10. Ramayanpatti Panchayat Area
11. Thalayuthu Panchayat Area
12. Alaguneri Panchayat Area and
13. Papayapuram Village
J) Funds
The funds of the Society consist of share capital, reserve fund, staff security
deposits and fixed deposits and subsidies from the state government.
There is a provision in the by-laws of the Society for creating ‘Cattle mortality
fund’ which consists of subscription from members, subscription by the Society from
general fund and contribution from net profits of the Society. Every member who
owns animals should contribute @ Re.1 per animal not exceeding Rs.5 per month.
The bylaw also provides for the creation of Reserve fund to be used at the time of
unforeseen losses.
Recently a new scheme has been introduced in the Society by the name
“members welfare fund” for which each member should contribute Re. 1 per month
and the Society also will contribute Re. 1 and another 50 paise will be contributed by
the union. This fund can be utilized for the welfare of the members.

108
K) Development of the Milk Society
After overcoming the initial problems, the Society concentrated on the
development project. The “Abishekapatti Scheme” was the outcome of it. A salvage
farm was created at ‘Abishekapatti’, where the milk drained-animal could be well
taken care of and rehabilitated. As a result, they became fit to give milk again and
again. Cattle sheds and servant quarters were built at a cost of about Rs.2000 at
Abishekapatti where around 300 cattle were accommodated initially. For the grazing
of these cattle, kini grass was cultivated in 15 acres and cholam was cultivated in
many acres. Hay was also fed to the cattle. Stud bulls belonging to higher varieties
like Sindi, Jersey and Murrah buffaloes were brought to the farm for mating with the
cattle. At Udayarpatti, an artificial insemination centre was formed to enable the
members to own high yield variety cattle. A veterinary doctor was appointed to look
after the cattle of the members at a nominal cost. And now, the Society is functioning
in a full-fledged form.
The development of the Society from 1999-2000 to 2009- 10 is presented in
Table No.2.5.

10
9
TA
BL
E 2
.5 P
RO
GR
ES
S O
F T
IRU
NE
LV
EL
I M
ILK
PR
OD
UC
ER
S C
OO
PE
RA
TIV
E S
OC
IET
Y L
TD
.
(Rs.
in
Th
ou
san
ds)
Sl.
No
P
art
icu
lars
1
99
9-2
00
0
20
00
-01
2
00
1-0
2
20
02
-03
2
00
3-0
4
20
04
-05
2
00
5-0
6
20
06
-07
2
00
7-0
8
20
08
-09
2
00
9-1
0
1.
Cu
rre
nt
ass
ets
2
06
7.8
46
2
42
5.1
07
3
05
1.9
72
2
84
5.4
20
3
16
5.8
28
4
03
9.8
46
3
74
3.6
20
4
70
9.7
82
4
59
6.7
23
4
69
2.6
57
3
12
3.2
35
2.
Cu
rre
nt
lia
bilit
ies
17
94
.97
6
17
02
.23
1
18
38
.25
4
13
84
.54
3
13
51
.84
1
16
79
.49
8
15
91
.37
3
30
42
.41
3
24
86
.85
7
31
38
.78
3
31
20
.82
9
3.
Fix
ed
ass
ets
2
58
8.5
13
2
96
1.1
84
2
92
4.5
36
3
33
3.4
94
3
27
0.7
85
4
05
7.4
14
4
34
9.9
50
4
17
5.6
60
3
45
6.3
60
4
48
8.3
45
4
57
9.3
44
4.
De
bto
rs
14
79
.78
2
17
31
.62
0
20
27
.33
9
18
74
.26
1
22
41
.71
1
31
59
.89
0
27
52
.98
1
29
15
.29
1
33
53
.74
4
33
18
.63
2
18
88
.33
4
5.
Sa
les
48
23
2.7
6
48
53
6.1
7
47
03
8.3
8
45
89
9.8
3
44
40
5.5
4
48
66
6.7
0
51
09
7.3
7
48
96
5.4
0
54
76
7.5
9
63
91
0.9
3
65
13
1.2
3
6.
Gro
ss P
rofi
ts
47
59
.01
5
52
57
.77
2
57
36
.20
2
56
96
.13
3
54
76
.24
8
59
69
.00
3
63
27
.05
0
45
77
.23
4
32
04
.45
4
31
49
.32
1
15
29
.47
8
7.
Ne
t P
rofi
ts
61
.20
5
11
0.9
89
1
20
.03
8
15
9.9
85
4
00
.28
6
40
8.7
48
2
98
.70
7
50
.43
5
12
1.2
93
1
30
.54
5
16
8.2
89
8.
To
tal
de
bt
22
42
.83
0
24
76
.58
3
29
61
.89
8
24
11
.80
9
21
98
.39
0
28
71
.85
8
25
04
.59
6
35
29
.46
6
29
84
.33
5
39
69
.21
6
39
60
.66
6
9.
Eq
uit
y 2
09
7.7
03
2
38
0.6
39
2
76
0.8
54
3
07
0.5
01
3
42
4.9
64
4
43
3.8
66
4
68
0.2
81
4
81
4.2
11
4
85
4.4
58
4
78
3.2
57
3
27
3.8
79
10
. Sh
are
ca
pit
al
12
9.8
50
1
32
.43
0
13
3.7
90
1
33
.14
0
13
3.2
70
1
32
.92
0
13
6.8
95
1
36
.47
5
13
6.4
30
1
36
.09
5
13
5.8
05
110
L) Honours and awards
The Society is always in the list of grade ‘A’ from the date of starting itself. It
was honoured with many awards and shields both at the district and at the state levels.
It was declared the “Best co-operative unit” at the district level as well as the state
level, many times. The Society has won the top rank among the units at the Union
level in 1974-75 and 1986-87. Shields were awarded. At the Tamil Nadu State level,
this Society was declared the best in 1973-74, 1975-76, 1981-82 and 1985-86 (four
times) considering its performance. Valuable mementos of honour were also awarded.
It has also won District level Best Society Award eleven times.
M) Current Position
The current position of the TMPCS Ltd. regarding the paid up share capital,
number of members, milk production and sales, purchase rate and sales rate of milk,
number of animals maintained are given below. The following information are got by
the researcher from the annual short notes published on the working of TMPCS Ltd.
Share Capital
As per the by-laws of the Society, the authorised share capital was Rs.75,000
divided into 15,000 shares of Rs.5 each. In 1945, when the Society was started, its
share capital was just Rs. 7,445 divided into shares of Rs.5 each. The entrance fee was
0.25 paise per member.
But, later on, modifications were made in the by-laws to increase the share
capital and now, it is functioning with the paid up Share Capital of Rs. 1,36,315
divided into shares of Rs.10 each, the entrance fee being Re.1.

111
Number of Members
Members are the shareholders of the Society. The liability of the members is
limited to their share capital. The total number of members who own shares in the
Society is 7,449 out of whom only 568 members are supplying milk to the Society.
Dividend is the only benefit for those members who do not supply milk to the Society.
The following table gives the details of the members.
TABLE 2.6 TOTAL NUMBER OF MEMBERS
Source: “Short Notes on the Working of O.1067. Tirunelveli Milk Producers Cooperative
Society Ltd.” prepared as on 13.03.2010.
From the table, we can understand that there are 7449 members in total out of
which 3948 are female members i.e. more than 50% of the members are women. In
case of milk supplying members also, the female members are nearly double in
number than the male ones.
Cattle maintenance Services
The Breeds available in the Village are Murrah, Jersey and Sindhi Cross. Out
of the total cows, 777 give milk whereas 398 are pregnant and 426 have gone dry. Out
of the total buffaloes, 41 give milk while 5 of them are pregnant and 7 have gone dry.
The following table gives the particulars about the cows and buffaloes
maintained by the Society.
Category Men Women Total
Current No. of Members
Supplying Milk to Society
SC 770 1131 1901 Male 186
OC 2731 2817 5548 Female 382
Total No. of members 3501 3948 7449 Total 568

112
TABLE 2.7 TOTAL NUMBER OF COWS AND BUFFALOES
Category Milk Preg Dry
Current No. of Cows and Buffaloes
supplying Milk to Society
Cows 736 398 426 cows 736
Buffalos 41 5 7 Buffaloes 41
Total 777 403 433 Total 777
Source: “Short Notes on the Working of O.1067. Tirunelveli Milk Producers Cooperative
Society Ltd.” prepared as on 13.03.2010.
The Society purchases cattle feed on wholesale rate from the market and
distributes it to its members at a subsidised rate which is less than the market rate.
Artificial insemination centre is set up by the Society in order to increase the
availability of high-bred variety milch cattle.
Once in a week, the cattle of the members are normally checked by a
veterinary doctor appointed by the Union. From the net profit of the Society, three per
cent will be allotted for cattle development fund and two per cent is meant for
co-operative educational fund.
Milk Procurement
Milk is collected from the fifty Milking Yards and directly supplied to the
Union. The Average FAT is 4.1 and the Average SNF is 8.2.Cow milk is purchased
@ Rs.15.00 per litre and Buffalo milk is purchased @ Rs.21.00 per litre. The daily
procurement of the Society from the members is 4,640 litres. The Society also
procures milk from other institutions and pocket milk from the union for its sales. In
total, the Society procures nearly 9000 litres of milk per day.

113
Milk Distribution
The Society supplies 800 to 1000 litres of milk per day to the union and the
remaining part of the milk procured is marketed by the Society itself. The milk
procured by the Society is to be distributed to the public in and around Tirunelveli
through various channels of marketing. The Society charges different rates to different
consumers with regard to the selling of milk. The procured milk is sold to the people
directly as raw milk and also through card sales as pocket milk. The Sales Rate of
milk is Rs.17 per litre to the Union and to local Sales is @ Rs.20 per litre.
The average current milk production and sales of milk per day is presented in
the following table.
2.8 AVERAGE MILK PRODUCTION AND SALES
Source: Records of the TMPCS Ltd.
Generally, there are two seasons in milk production namely flush and lean. In
flush season the milk production is comparatively more than that of lean. This
seasonal difference is due to the effect of monsoon on breeding.
Sale of other Milk Products
Besides supplying milk, the Society also supplies curd, butter, ghee and milk
sweets (palpeda) from the very beginning, according to the surplus unsold milk and
the nature of demand. It also deals in cattle feed.
Category Flush Lean Present
Average milk production lpd 6916 5984 6097
Average Local Sales lpd 4791 4780 4687
Average Supply to Union lpd 2125 1204 1410
114
Functioning
The TMPCS Ltd. is functioning as a self sufficient Society earning profit from
the very beginning. This Society became a member of the Tirunelveli District Milk
Producers union in the year 2000 by purchasing 15 shares for Rs. 15000. It activates
many plans for the welfare of the members. But, still there are number of plans to be
initiated by the Society for its development and to increase the milk production and
sales.
At present, the Society is functioning under the control of Deputy Registrar of
co operative societies as no election has been held for the past few years and
representatives have not been duly elected.