Embed Size (px)
Citation preview

Review of Input and Out-put Policies for Cereals Production in Pakistan Abdul Salam
October 2012

i
ABBREVIATIONS AND ACCRONYMS ADBP Agricultural Development Bank of Pakistan APCOM Agricultural Prices Commission API Agriculture Policy Institute CPI Consumer price index DAP Diammonium phosphate FAO Food and Agriculture Organization of the United Nations FID Fertilizer Imports Directorate FSC&RD Federal Seed Certification & Registration Department GDP Gross domestic product IFPRI International Food Policy Research Institute KPK Khyber Pakhtunkhwa MAF Million acre-feet MINFA Ministry of Food and Agriculture MFAC Ministry of Food, Agriculture and Cooperatives MOF Ministry of Finance MST Ministry of Science and Technology NFC National Fertilizer Corporation NFDC National Fertilizer Development Centre NSC National Seed Council OPV Open-pollinated varieties PASSCO Pakistan Agricultural Storage and Services Corporation PC Planning Commission WPADC West Pakistan Agricultural Development Corporation ZTBL Zarai Taraqiati Bank Limited

ii
ACKNOWLEDGMENTS This paper was prepared for the Cereal Systems Initiative for South Asia (CSISA) with financial support from the U.S. Agency for International Development (USAID). Preparation of the paper also benefited from support provided from the Pakistan Strategy Support Program (PSSP), also funded by USAID. The author was formerly Chairman of the Agricultural Prices Commission, Pakistan, and is currently a Professor of Economics at the School of Economic Sciences, Federal Urdu University of Arts, Science and Technology, Islamabad Campus. He is indebted to David Orden, Professor, Virginia Poly-technic Institute and State University (Blacksburg, Virginia), and Senior Research Fellow at the International Food Policy Research Institute (IFPRI, Washington D.C.), for his valuable comments, suggestions, and editing of this report. He is also thankful to David J. Spielman, Senior Research Fellow at IFPRI, and to an anonymous referee for detailed comments and suggestions that were very useful in improving the manuscript. He would like to acknowledge the support and encourage-ment of Sohail J Malik, Chairman Innovative Development Strategies (Pvt) Ltd. for undertaking this study and for his valuable advice at various stages of the report preparation. He appreciates the valuable assistance of the anonymous technical editor of the report. The assistance of his colleague Ihtsham ul Haq in formatting the report is also gratefully acknowledged.
ABSTRACT The marketing of farm inputs and outputs has become a major problem for farmers in Pakistan. Farm input supplies are irregular, characterized by shortages and high prices at critical times. This report reviews the input and output policies for cereals implemented in Pakistan during the period 1996–2010. Pakistan has a long and varied history of intervening in farm input and output markets, going back decades before the period under review. Most significantly, in the wake of economic reforms launched during the 1980s, it has withdrawn from most of the commodity markets except wheat. In other commodity markets, intervention is by and large notional and without much practical involvement. The rolling back of the public sector from markets has certainly saved public funds, but the savings have come at a cost. Some of the cost, in terms of higher prices and variability stemming from the uncertain economic environment and supply, is borne by consumers, and some, in terms of lower producer prices at harvest, is borne by farmers, especially small and medium farmers, whose farms account for more than 50 percent of the area under cereals.
The devolution of decision making in agriculture, food, livestock, and related subsectors to the provinces under the 18th constitutional amendment (and subsequent establishment of the federal-level Ministry of Food Security and Research with its National Food Security and Research Division) have reduced clarity in terms of the public sector’s role and responsibilities in relation to agriculture. While the many challenges facing the agriculture sector continue, the ability to address these with concerted science-based interventions seems less clear at this moment.
To transform these challenges into opportunities and address the emerging issues, it is imperative to develop and strengthen institutional capacity for policymaking based on coordinated and concerted technical and economic analyses at the federal and provincial levels. To meet the technological challenges facing agriculture, the research system needs major restructuring and overhauling, administrative decentralization, financial support, autonomy, and accountability. Simply pumping in more resources, without deciding on the strategic priorities and making the system accountable, will not serve a useful purpose. The entire research-based policymaking and implementation system needs direction and coordination.
Keywords: agriculture, cereals, distortion, food security, markets, price policy, support price, research and devel-opment

1
WORKING PAPER NO. 006| October 2012
INTRODUCTION Poor agricultural performance has serious implications for food security and foreign exchange earnings, as well as for the health of the manufacturing sector and the overall economy. Farm production, with its many forward and backward linkages in the economy, exerts a powerful influence on the prospects of on and off-farm employment, incomes, livelihoods, and well-being for the multitudes of farm households.
As the problems confronting the farm sector become more complex over time in Pakistan, the public sector’s capacity to address them has nose-dived, seriously aggravating the situation. Poor performance in the crop sector, inter alia, may in many cases be attributed to the inadequacy of the support system for agriculture and its failure to develop and deliver new technologies and modern inputs. Distortion in input and output markets is also a contributor. Another important factor in this context is the disconnect between research and extension agencies on one hand, and farmers and agricultural extension departments on the other. This report focuses on the input and output policies of the government of Pakistan in relation to cereals during the period between 1996 and 2010.
The report is organized into five sections. Section 2 explains the performance of the cereals subsector in terms of pro-duction, trade, and availability. Section 3 provides details of the country’s input policies and institutional support for agricul-ture, including cereals, in the areas of seed, fertilizers, farm mechanization, irrigation, credit, and agricultural research and extension systems. Section 4 explains Pakistan’s output polices for cereals, including output pricing, support and market prices, and procurement and stocks. Section 5 describes recent institutional changes in the context of the devolution of food and agriculture to the provinces. The concluding section summarizes important points and issues emerging from the discus-sion of input–output policies for cereals.
PAKISTAN’S ECONOMY AND FOOD SECURITY The Pakistan economy has experienced structural changes and transformation over time. The aggregate share of various commodity-producing sectors, including agriculture, mining and quarrying, manufacturing, construction, electricity, and gas distribution, which was estimated to be 51.4 percent in 1990/91, declined to 46.7 percent in 2009/10 (Pakistan, MOF 2002, 2010b). The relative shares have also changed within the commodity-producing sectors. The contributions of agriculture and industry, estimated to be 25.8 and 25.7 percent, respectively, in 1990/91, dropped to 21.5 and 25.2 percent, respectively, by 2009/10. As a result, the economy has been transformed from an agricultural to a diversified economy. The gross domestic product (GDP) share of the livestock subsector during the last 10 years has averaged around 11.3 percent; the GDP share of the crop subsector decreased from 13.1 percent in 1999/2000 to 9.4 percent in 2009/10 (Pakistan, MOF 2010b). The changes in relative shares of various subsectors of agriculture, notwithstanding the extent to which they are prone to annual fluctuations, reflect the dynamics of the sector’s structural transformation and technological change. The performance of the crop subsector in general and of cereals (wheat, rice, maize, and so on) in particular have far-reaching implications for combating rural poverty and improving food security prospects in the country.
Agriculture in Pakistan—comprising the subsectors of crops, livestock and poultry, fisheries, and forestry—contributes 21.5 percent to the GDP, making it the country’s second-largest sector. The principal source of employment, it was respon-sible for 24.26 million of the 53.82 million people employed in 2010 (Pakistan, MOF 2010b). Agriculture (and the textile value chain that it is a part of) contributes 60–65 percent to the foreign exchange earnings from trade in merchandized goods. Agriculture provides livelihoods to 68 percent of the rural population and supplies markets for the goods and services of other sectors with key inputs. Textiles, sugar, flour, rice, and feed mills, the manufacturing sector’s main components, depend on agriculture for their raw materials. Thus, the economic health and performance of agriculture and its allied

2
WORKING PAPER | September 2011
subsectors holds the key to overall economic development. Its performance is also crucial in combating poverty and improv-ing the country’s food security and nutrition. However, agriculture, heralded as an engine of growth during the 1960s and 1970s, has not performed consistently, especially during the last two decades. In the recent past, its performance has been erratic, making it vulnerable to the vagaries of climate change and other natural factors. Agriculture’s annual growth rate is marked by wide variations, ranging from−5.2 percent in 1992/93 to 11.72 percent in 1995/96 (Pakistan, MOF 2010b). Its recent performance has not been smooth either. Indeed, the crop sector’s varying and poor performance—three years of negative growth between 2006 and 2010—has been noted by observers. However, the agriculture sector as a whole experienced positive growth in the period 2006–10, riding on the solid performance of the poultry and livestock subsector.
Major Cereals and Their Performance Major cereals cultivated in Pakistan include wheat, rice, maize, millets, sorghum (jowar), and barley. The area under these cereals averaged 12.483 million hectares (ha) per year between 2006 and 2010, with production averaging 31.983 million metric tons1 (Pakistan, MINFA 2011). Wheat, rice, and maize, the most important foodgrains (cereals) in Pakistan, are also the staple food crops. Together, these three crops command 94 percent of the area under cereals and make up 98 percent of the annual production of all cereals. This study focuses on wheat, rice, and maize due to the overwhelming importance of these three crops.
Wheat is the largest crop in terms of area: It is planted over 9 million hectares each year and accounts for 69 percent of the total production of cereals.2 Wheat cultivated under both irrigated and rainfed conditions is grown throughout Pakistan. In the 2008–10 period, its average annual production was 22.77 million tons. Pakistan, famous for the long-grain aromatic basmati rice that it produces and exports, is the world’s fifth-largest rice exporter, after Thailand, India, Vietnam, and the United States. Hovering around 2.9 million tons, its rice exports, which also include a substantial quantity of coarse rice, account for 9 percent of the world’s exports. Annually sown over an average area of 2.79 million hectares, rice has account-ed for 21 percent of the area under foodgrains and its production has averaged 6.47 million tons in the recent past. The area under maize, the third most important foodgrain after wheat and rice in Pakistan, has expanded to more than 1 million hectares, and production has increased to reach an average of 3.49 million tons in the period 2008–10. Though maize is traditionally raised as a summer crop from indigenous seed, hybrid maize planted in the spring with yields averaging 8–9 tons per hectare has revolutionized maize production in some of the irrigated districts of Punjab province. As a result, the share of maize in the value added by major crops has increased from 3.15 to 5.09 percent, and its contribution to the total output of foodgrains has risen from 6.6 to 10.5 percent (Pakistan, MOF 2010b).
The cultivation of these cereals provides raw material for wheat flour and rice milling and for the feed and starch indus-tries. Since rice is a major export and wheat an important import, their performance has affected not only the food security situation in the country but also the course of international trade and the balance-of-trade situation. Maize cultivation is a source of raw material for several industrial products, such as corn oil, starch, corn flour, and livestock and poultry feeds. More than 50 percent of the area under these crops is reported to be on farms operating less than 12.5 acres each (Paki-stan, Agricultural Census Organization 2003).
Data from 1996 to 2010 on the area and production of wheat, rice, and maize are provided in Table A.1; the growth rates estimated from these data are presented in Table 2.1. These data show that wheat production, ranging from 16.65 to 24.03 million tons, is estimated to have increased at a rate of 2.30 percent per year during the period. A large proportion of this production increase was achieved through higher crop yield, which rose at the rate of 1.73 percent per year as area expanded at the average annual rate of 0.57 percent. Average wheat production in 2006–10 works out to be 22.58 million tons per year.
1 Metric tons are used throughout the report. 2 Rice accounts for 19 percent and maize for 10 percent of the total production of cereals.

3
WORKING PAPER | September 2011
Table 2.1—Growth rates in area, production, and yield of cereals in Pakistan, 1996–2010
Indicator Wheat Rice Maize
(percent per year)
Area 0.57 1.69 0.67
Production 2.30 3.26 7.35
Yield 1.73 1.57 6.68
Sources: Based on data from Pakistan, MINFA 2011.
Exhibiting a rising trend, rice production increased from 3.967 million tons in 1995/96 to 6.883 million in 2009/10. Esti-mated at 3.26 percent, the average annual growth rate in rice production is due to both horizontal expansion in area and vertical gains in crop yield. The country’s rice area has expanded from an average of 2.24 million hectares in the years 1996–98 to 2.79 million in the last three years. Rice yields during the corresponding periods are estimated at 1,872 and 2,315 kilograms per hectare (kg/ha), respectively. Between 1996 and 2010, maize production has more than doubled, increasing from 1.60 million tons in 1995/96 to 3.49 million in 2009/10, an impressive achievement realized through higher productivity due to the adoption of hybrid seeds and a related technology package in maize-growing regions, especially in the central Punjab. The average annual growth rate in maize yield is estimated to be 6.68 percent; its area expanded at the rate of 0.67 percent. To draw lessons about technology adoption packages for other commodities, an in-depth, field survey–based analysis of maize production and productivity gains is warranted.
Trade in Cereals Both wheat and rice, Pakistan’s staple foods, are also important traded commodities. Pakistan is the 12th-largest producer of rice and the 5th-largest exporter of the commodity, accounting for about 9 percent of the annual world trade in rice. Pakistan has been a regular wheat importer, with occasional exports during the last decade. Neither the Pakistan Economic Survey nor the annual report of the State Bank of Pakistan, both of which are valuable sources of economic data, report any maize imports or exports. Therefore, the discussion of the cereals trade in this report is confined to wheat and rice only. The underlying assumption is that maize production is strictly available for domestic use.
Table 2.2 shows that total exports of rice have ranged from 1.6 to 4.18 million tons, averaging 2.41 million tons a year. Exports during 2006–10 have been much higher, ranging from 2.72 to 4.18 million tons, with an average of 3.31 million per year. Rice exports have made a substantial contribution to foreign exchange earnings, rising from US$1.157 billion3 in 2005/06 to $3.523 billion in 2009/10. Wheat trade data reflect an interesting picture. During 1996–2000, annual wheat imports, which ranged from 1.968 to 4.088 million tons, averaged 2.760 million tons per year. During the next five-year period annual imports averaged 206, 000 tons, but they rose significantly during the next five years (2006–10) to average 1.194 million tons. The last five years of the period under study here (1996–2010) are also characterized by substantial wheat exports. Accounting for the exports, net wheat imports in this period averaged 817, 000 tons per year. In 2006/07, Pakistan had a particularly large crop, which led to net exports of nearly 1 million tons.
3 All dollar amounts are in U.S. dollars.

4
WORKING PAPER | September 2011
Table 2.2—Exports and imports of cereals in Pakistan, 1996–2010
Year Total rice exports Wheat imports Exports of wheat and
wheat flour Quantity Value Quantity Value Quantity Value ’000 tons US$ million ’000 tons US$ million ‘000 tons US$ million
1995/96 1,600.52 503.96 1,968.00 452.48 1996/97 1,767.21 468.56 2,500.00 485.34 1997/98 2,091.24 562.42 4,088.00 701.56 1998/99 1,788.77 533.57 3,240.00 406.19 1999/2000 1,916.05 539.67 2,006.00 283.48 172.00 2000/01 2,294.29 525.55 80.00 14.95 1,039.00 2001/02 1,684.30 448.23 267.00 49.71 1,704.00 2002/03 1,819.98 555.46 148.00 29.06 2003/04 1,822.74 634.46 108.00 23.54 2004/05 2,891.25 932.55 427.00 92.97 2005/06 3,688.74 1,157.82 816.00 132.64 470.6 97.56 2006/07 3,129.14 1,125.82 136.00 41.54 975.60 207.13 2007/08 2,809.15 1,836.06 1,820.00 864.72 285.60 61.84 2008/09 2,729.36 1,983.23 3,103.00 1,083.03 142.50 39.04 2009/10 4,180.25 3,523.05 94.00 40.65 9.50 2.00
Sources: APCOM (2005); Pakistan, MINFA (2008 and 2011); and Pakistan, MOF (2010b).
Per Capita Production Table 2.3 sets out data on population and annual production of wheat, rice, and maize from 1996 to 2010 in Pakistan. During the period studied in this report, the population increased by 36 percent, from 127.51 million to 173.51 million. The produc-tion of wheat, rice, and maize during this period also increased significantly. But the annual production data also reflect fluctuations, a universal feature of crop production. Nevertheless, average annual production of wheat, rice, and maize in 2008–10 in relation to the 1996–98 data reflects increases of 31 percent, 54 percent, and 132 percent, respectively. Per capita production of wheat, rice, and maize has increased from 133 kg, 31 kg, and 12 kg, respectively, in 1995/96 to 134 kg, 40 kg, and 19 kg, respectively, in 2009/10. Further analysis of these data confirmed significant upward trends in per capita production of rice (1.2 percent per year) and maize (5.3 percent per year), but no such trend was noted in the case of wheat.
Table 2.3—Per capita production of cereals in Pakistan, 1996–2010
Year Population Total production Per capita production Wheat Rice Maize Wheat Rice Maize
(million) (’000 tons) (kg) 1995/96 127.51 16,907 3,967 1,504 133 31 12 1996/97 130.56 16,651 4,305 1,491 128 33 11 1997/98 133.48 18,694 4,333 1,517 140 32 11 1998/99 136.69 17,858 4,674 1,665 131 34 12 1999/2000 139.76 21,079 5,156 1,652 151 37 12 2000/01 142.86 19,024 4,803 1,643 133 34 12 2001/02 145.96 18,227 3,882 1,664 125 27 11 2002/03 149.03 19,183 4,479 1,737 129 30 12 2003/04 150.47 19,500 4,848 1,897 130 32 13 2004/05 153.96 21,612 5,025 2,797 140 33 18 2005/06 156.77 21,283 5,547 3,110 136 35 20 2006/07 159.06 23,295 5,438 3,088 146 34 19 2007/08 161.86 20,959 5,563 3,605 129 34 22 2008/09 169.94 24,033 6,952 3,593 141 41 21 2009/10 173.51 23,311 6,883 3,262 134 40 19
Source: Author’s calculations based on population data from Pakistan, MOF (2010b) and crop production data from Pakistan, MINFA (2011).
Per Capita Availability Due to substantial trade in both wheat and rice, it would be expected that their domestic availability varies from the amount produced. Moreover, the per capita availability data and the corresponding production are not strictly comparable, the former having been adjusted to reflect the allowance for seed, feed, and wastage (10 percent for wheat and 6 percent for rice).

5
WORKING PAPER | September 2011
Table 2.4 shows data on per capita availability of wheat and rice after adjusting for trade and seed/feed allowances. Due to limited trade in maize, its per capita production is assumed to represent its availability.
Table 2.4—Per capita availability of wheat and rice, 1996–2010
Year Wheat Rice
April–May June–July (kg)
1995/96 127 16 1996/97 131 17 1997/98 134 15 1998/99 141 20 1999/2000 131 21 2000/01 124 16 2001/02 115 14 2002/03 119 17 2003/04 119 18 2004/05 123 13 2005/06 118 15 2006/07 125 13 2007/08 133 15 2008/09 127 21 2009/10 125 18
Source: Based on data from Pakistan, MINFA 2004, 2011; Pakistan, MOF 2010b.
In 1996–98, the per capita availability of wheat averaged 131 kg per year; in 2008–10, it averaged 128, reflecting a de-cline of about 1 percent. The average availability for the entire study period (1996–2010) is estimated to be 126 kg per year, with a variation coefficient of 6 percent. In the case of rice, annual exports account for a substantial proportion of the annual production, almost 50 percent. The average per capita availability is 17 kg per year, with a variation coefficient of 16 percent.
The per capita production and availability data on cereals highlight the impact of rising population and related develop-ments. In spite of substantial gains in the domestic production of wheat over time, its per capita domestic availability has declined on average. Some of the wheat availability losses have been made up by higher rice availability. Maize may have directly or indirectly contributed in this direction, the latter by reducing the pressure to divert wheat for animal and poultry feed, since its per capita production has climbed from 12 kg in 1995/96 to 19 kg in 2009/10. To improve the per capita availability of foodgrains, production growth must outpace population growth by a significant margin. Otherwise, to feed the growing population, exports would need to be curtailed, larger imports would be needed, or both.
INPUT SECTOR POLICIES
Seed Quality seed holds the key to raising crop productivity. The potential of planted seed determines and caps the impact of various other inputs like fertilizer, water, and cultural practices in crop production. For self-pollinated crops like wheat and rice that are susceptible to seed-borne diseases, it is of utmost importance that seed be pure, bold, highly vigorous, and pathogen- and disease-free. For such crops, experts recommend replacing seeds on a 5-year cycle and sowing 20 percent of total area annually with improved seed to maintain seed vigor and obtain high yield. Hybrid seeds with superior yield potential have been developed for open-pollinated crops like maize. The adoption of these seeds and related technology package have revolutionized maize production in many countries, including Pakistan. The situation with regard to the requirements for improved seed; its availability for wheat, rice, and maize; and its use at the farmers’ field level in Pakistan is discussed below.
Data on the total annual requirements of wheat, rice (paddy), and maize seed are set out in Table A.2, along with the actual quantity of improved seed supplied by the public and private sectors. Data on supplies of improved seed in relation to total requirements are presented in Table 3.1 . Data on prices of certified seeds are laid out in Table A.3.

6
WORKING PAPER | September 2011
Table 3.1—Improved seed use relative to demand and private-sector share in supply, 1996–2010
Year Share of improved seed in total Share of private sector in improved seed
Wheat Rice Maize Wheat Rice Maize (percent) (percent)
1995/96 7.85 6.11 9.88 18.03 20.24 96.06 1996/97 7.57 4.37 10.57 18.97 9.51 97.37 1997/98 7.83 6.31 8.03 16.28 15.73 93.32 1998/99 10.55 6.72 15.74 26.94 34.39 96.02 1999/2000 10.47 10.92 13.33 36.78 59.09 91.69 2000/01 16.22 6.33 11.22 51.83 55.64 87.35 2001/02 13.96 11.96 14.00 46.78 47.12 90.88 2002/03 12.51 15.02 21.59 44.19 67.04 91.22 2003/04 13.74 21.91 28.09 54.71 71.19 87.28 2004/05 17.30 27.90 45.57 68.63 73.33 96.02 2005/06 16.44 33.12 43.49 69.68 78.38 97.11 2006/07 19.80 29.68 42.52 72.08 75.45 97.64 2007/08 18.41 32.58 47.31 73.09 73.56 96.18 2008/09 18.06 54.70 58.83 57.06 82.95 95.97 2009/10 25.95 39.67 52.24 79.42 71.00 93.91
Source: Hussain 2011.
The total annual requirements of wheat, rice (paddy), and hybrid maize seed, presented in Table A.2, were around 1 million, 40,000, and 19,000 tons, respectively, in 2009/10. No doubt seed requirements will vary with the area planted in these crops. The data on the availability of improved seed reflect two important developments. For both wheat and rice, the overall availability of improved seed has significantly increased and may be sufficient to meet the annual replacement requirements—that is, 20 percent of total seed. In the case of maize, the use of hybrid seed crossed the 50 percent thresh-old in 2009/10. Another important development in the seed sector is the role played by small and medium-sized private seed companies engaged in the production and marketing of improved seeds. These companies have accounted for more than 70, 76, and 96 percent, respectively, of the distribution of improved wheat, rice (paddy), and maize seed. Farmers, though appreciative of the role that these seed companies play, often express reservations about alleged business practices, including overcharging, under weighing, lax quality control, and varietal admixtures. Overcharging and under weighing are more common for maize seed; lax quality control and varietal admixtures are more common for rice and wheat.
Notwithstanding the need to exercise quality control, the seed industry needs genuine support and a conducive envi-ronment for attracting investment to keep itself abreast of the technological developments and requirements of moderniza-tion. Unleashing the vast potential for raising crop production and productivity relies on the expanded supply of certified and improved seeds for other crops, vegetables, and horticultural plants.
The seed industry faces the challenge of expanding its research and development base and facilities either on its own or in collaboration with public-sector research institutions. The industry also needs to develop new seeds and cultivars. The existing varieties of cereals, particularly of wheat and coarse rice, are outdated and need to be replaced by new germplasm. The current availability of improved wheat and rice seed seems sufficient to meet annual replacement requirements. But one challenge remains: enabling farmers to access quality seed so that coverage can be expanded to the total area in accord-ance with the recommended replacement cycle rather than limiting the use of improved seed to a small fraction of the same farmers.
Another problem relates to the use of hybrid maize seed. Currently, the adoption and availability of hybrid maize seed hovers around 50 percent of the crop area. Given its yield potential and edge over the traditional maize varieties, farmers’ continuing cultivation of traditional maize varieties entails colossal economic losses and inefficient, even wasteful, use of farm resources. Discussions with progressive growers and crop experts suggest the high cost of imported hybrid seed and its intensive management and technological requirements as important obstacles to its adoption. Given the scope and potential for improving farm incomes through the use of hybrid maize seed, intense efforts are required to address farmers’ problems, apprehensions, and grievances regarding these seeds. Farmers have furthermore expressed alarm about black marketing of and overcharging for seed by local distributors during shortages. Maize farmers allege declining real value of maize prices, discussed in more detail below. They also report problems in marketing maize, particularly in years of good wheat harvest, when maize does not fetch a good price.

7
WORKING PAPER | September 2011
INSTITUTIONAL SETUP IN SEED SECTOR Before 1961, Pakistan did not have its own independent seed production and marketing system; farmers relied on their own seed or purchased from other farmers.4 Following the recommendations of the Food and Agriculture Commission, the West Pakistan Agricultural Development Corporation (WPADC) was established in 1961 for the procurement and distribution of improved seeds of various crops. In 1972, the WPADC was abolished and provincial governments took on seed production, multiplication, procurement, and distribution functions. Based on 1976 World Bank mission recommendations, the federal government initiated the Seed Industry Development Project, which was provided legal cover through the Seed Act of 1976. This act established institutions for quality seed regulation. It also established the National Seed Council (NSC) and provin-cial councils. In 1997, the two agencies that had initially been established, the Federal Seed Certification Agency and the National Seed Registration Agency, were merged into one agency: the Federal Seed Certification and Registration Depart-ment (FSC&RD). At the provincial level, three provincial seed development agencies, the Punjab Seed Corporation in Punjab, the Sindh Seed Corporation in Sindh, and the Agricultural Development Authority in Khyber Pakhtunkhwa (KPK), were set up for seed production and marketing. The NSC advises the government on policy measures to regulate the provincial seed industry. It also approves the seed standards and regulates the interprovincial movement and import of seed. The provincial seed councils also provide policy advice regarding the development of the seed industry and propose chang-es in the seed laws as well as standards for quality control. As advisors on the development of seed farms, the councils can recommend withdrawal of varieties that have deteriorated and outlived their useful life span.
The FSC&RD prescribes rules for the registration of seed growers; inspects fields where the basic seed of newly regis-tered varieties are under cultivation; tests quality of seed with respect to its purity, germination, viability, and so on; and provides necessary certification. It also tests the quality of seed lots delivered to processing plants established under the Seed Act of 1976, conducts preregistration checking of varieties submitted for registration, and maintains a list of registered seed varieties. Headquartered in Islamabad, the FSC&RD has three regional directorates and a network of 28 seed testing laboratories in the country.
The country’s formal seed sector comprises provincial public-sector corporations, and national and multinational seed companies. Currently, there are 720 small, medium, and large nationally registered seed companies dealing in wheat, rice, cotton, maize, gram, vegetables, fruits, and nursery plants. About 95 percent of these companies, however, are concentrated in the Punjab and Sindh provinces. There are also 5 multinational seed companies that market and distribute maize, sun-flower, fodder, and forage seeds. There are also some companies that import the seed of crops, potatoes, and other vegeta-bles. Reportedly, the FSC&RD has canceled the registration of some 150 seed companies due to malpractice. The major seed sector challenges include the nonexistence of proper seed laws, smuggling, the widespread use of unapproved varieties, and the issue of breeders’ rights. Most of the seed companies are small and medium firms that lack resources for research and development activities and are therefore engaged only in marketing activities. The national research system is also unable to sustain commercial seed production (Pakistan, PC 2009). In this context, active collaboration between the private and public sectors can play an important role in augmenting Pakistan’s supply of improved seed.
Fertilizer The fertilizer sector in Pakistan has experienced policy shifts and changes in the management of its domestic production, import, and distribution system. There were times when government controlled fertilizer retail prices and was directly or indirectly engaged in fertilizer production, import, and distribution. As a result of reforms that were initiated in 1986 and completed by 1995, subsidies on sales prices of fertilizers were eliminated; the reforms disbanded provincial distribution organizations and the Fertilizer Imports Directorate (FID) in the federal Ministry of Food and Agriculture (MINFA). The public-sector production units were privatized in due course and the government’s involvement in the fertilizer sector was limited to policy planning and analysis (NFDC and FAO 2006). Tables A.4 and A.5 provide data on annual production and imports as well as the off take of various fertilizer products or nutrients.
Domestic production of various fertilizers, in terms of nutrients, has increased from 1.790 million tons in 1995/96 to 3.082 million tons in 2009/10, an overall increase of 72 percent. The production of all nutrients is reported to have expanded, but the major contribution comes from the expansion in production of the 2 most widely used fertilizers in Pakistan: urea and diammonium phosphate (DAP). The National Fertilizer Development Centre (NFDC) reported that urea production has risen
4 The material in this section is based on Hussain (2011).

8
WORKING PAPER | September 2011
from 3.258 million tons to 5.155 million tons in the period under study. In 1995/96, Pakistan had no facilities for producing DAP, the main source of phosphorus nutrients in the country; that same year, total nutrient imports were 734,000 tons. In 2009/10, Pakistan imported 1.444 million tons of nutrients, including 901,000 tons of nitrogen and 522,000 tons of phospho-rus. The share of domestic production in the total annual supply of fertilizer nutrients (ranging from 67 to 84 percent) aver-aged 74 percent in the period studied (1996–2010). In the case of nitrogen, domestic production has accounted for 87 percent of its total supply (see Table 3.2). Domestic production of all nutrients for the period under consideration in this study is estimated to have grown at 4.24 percent per year—imports at 1.93 percent and total availability in the country (sum of both imports and domestic production) at 3.68 percent.
Table 3.2—Share of domestic production in total supply of fertilizers, 1996–2010
Year Overall supply of all
nutrients (’000 metric tons)
Domestic share in overall supply All nutrients Nitrogen Phosphorus Potash
(percent) 1995/96 2,523.60 71 85 19 - 1996/97 2,640.30 67 78 17 - 1997/98 2,466.40 70 85 14 - 1998/99 2,745.60 69 81 17 - 1999/2000 2,926.00 77 90 35 - 2000/01 2,877.20 80 91 40 2 2001/02 2,911.20 79 92 25 33 2002/03 3,081.10 75 91 17 59 2003/04 3,303.40 77 92 31 67 2004/05 3,502.60 78 88 41 54 2005/06 4,100.50 69 80 35 37 2006/07 3,542.50 78 89 39 50 2007/08 3,698.30 76 90 34 39 2008/09 3,474.80 84 85 77 1 2009/10 4,526.50 68 75 44 33
Sources: NFDC 2008 and 2011.
HISTORICAL DEVELOPMENTS IN THE FERTILIZER SECTOR Local fertilizer production in Pakistan began in 1957 in the public sector with small-scale production units for ammonium sulfate and single super phosphate.5 Two private-sector urea plants commenced production in 1968 (Engro Chemicals Pakistan Limited) and 1971 (Dawood Hercules). The private companies had their own network of dealers for marketing their products. The government nationalized fertilizer marketing and distribution in 1973, setting up provincial distribution agencies for fertilizer marketing. Engro was allowed to continue to market all of its production. Initially, Dawood Hercules was allowed to market only 50 percent, but in 1978, it was granted permission to market all of its production. The National Fertilizer Corporation (NFC), a public organization, set up new fertilizer plants, managed existing public-sector fertilizer manufacturing units, and marketed their production. NFC set up two urea plants in 1980, one at Mirpur Mathelo in Sindh and the other at Haripur in KPK. NFC also expanded the capacity of its existing plants and added new production units. Notwithstanding its efforts to augment domestic production, NFC was unable to meet rapidly expanding fertilizer demand. Accordingly, in 1982, Fauji Fertilizer Company was granted permission to establish a urea plant at Machhi Goth, in Sindh.
Throughout this period, the government controlled and subsidized fertilizer prices. The manufacturers were allowed fixed marketing margins and a fixed annual return of about 20 percent on their equity. Fertilizer imports were handled by FID, part of MINFA, which had succeeded the Agricultural Development Corporation. As fertilizer use increased over time, the fertilizer subsidy burden mounted, creating budgetary problems and limiting allocations for other development options. The subsidy per nutrient ton, reported at Rs. 1,102 (Pakistan rupees) in 1975/76 and varying from year to year, increased to Rs. 1,593 in 1985/86, and the total subsidy bill on fertilizers swelled from Rs. 607 million to Rs. 2.409 billion during the same period (Pakistan, MINFA 1988). There were frequent complaints about supplies lagging behind demand and farmers purchasing fertilizers on the black market at prices much higher than the government-subsidized prices, especially at critical times of the crop production cycle.
5 Discussion in this section is based on material and information from NFDC and FAO (2006).

9
WORKING PAPER | September 2011
The situation was inefficient: The government subsidized the price but was not able to ensure sufficient supply to match the demand, and farmers were willing to pay higher prices to meet their crop requirements. The government came under pressure from donors and domestic actors to do away with subsidies while ensuring regular supplies. In 1985, the govern-ment ultimately decided to deregulate the prices of nitrogenous fertilizers, including urea, calcium ammonium nitrate, and ammonium sulfate, and abolished the fixed marketing margins and subsidies. It did, however, continue to control and subsidize the prices of phosphate and potash fertilizers. Imports remained with FID.
In spite of these developments, fertilizer subsidy bills continued to rise, peaking at Rs. 2.423 billion in 1988/89, 15 per-cent of all subsidies that year. Fertilizer subsidies declined thereafter and by 1996/97 were totally eliminated (Pakistan, MOF 1999). As a sequel to these developments, the efficiency of urea manufacturing units improved, resulting in higher returns on equity that provided further incentives to expand production. Prompted by the positive achievements of these reforms, the government eliminated subsidies in 1993 and deregulated phosphate fertilizer prices as well. As a result, the private sector entered the import business in 1994. One year later, the government deregulated the marketing and distribution of potash fertilizers. Due to the increasing importance of the private sector in fertilizer imports, FID was phased out in 1999/2000. Fertilizer manufacturers were free to set the prices of their products and to import and market without any restrictions. Since then, however, fertilizer import subsidies have been reintroduced and imports have been limited to the public sector, a development described in more detail below.
FERTILIZER PRICES A number of domestic and international developments affected fertilizer prices. These included the rising prices of energy and natural gas, which resulted in higher costs for fertilizer production and transportation. Higher costs led in turn to in-creased reliance on imports to meet burgeoning demand for fertilizers and reluctance on the part of the government to increase commodity prices in line with international prices. Moreover, in the wake of deregulation of the fertilizer sector and the elimination of subsidies, fertilizer prices in the second half of the last decade rose rapidly. For example, prices of nitrogen from urea, of P2O5 from DAP, and of potash from sulfate of potash averaged Rs. 20.35, 35.56, and 39.84 per nutrient kilogram, respectively, in 2004/05. In 2007/08, these had risen to Rs. 25.26, 74.07, and 59.80, respectively. This price hike adversely affected the amounts of fertilizers used. Total nutrient use, estimated at 163 kg/ha in 2004/05, declined to 156 kg/ha in 2007/08 (see Table 3.3).
Table 3.3—Prices of fertilizer nutrients and their use per crop hectare, 1996–2010
Year Prices of fertilizer nutrients Per-hectare use of nutrients
Nitrogen Potash Phosphorus Nitrogen Potash Phosphorus (Rs./kg) (kg/ha)
1995/96 11.61 13.24 14.12 88 1.31 22 1996/97 14.78 21.28 17.05 88 0.37 18 1997/98 14.96 21.52 17.79 92 0 .87 24 1998/99 15.04 21.64 20.95 93 0.93 20 1999/00 14.22 21.72 19.56 98 0.81 26 2000/01 15.78 27.28 20.12 100 1.03 31 2001/02 17.13 30.60 20.98 101 0.85 28 2002/03 17.87 31.20 20.48 104 0.94 30 2003/04 18.30 32.36 26.09 114 0.95 29 2004/05 20.35 39.84 35.56 124 1.43 38 2005/06 22.13 46.80 38.25 130 1.17 37 2006/07 22.91 39.40 34.21 117 1.83 42 2007/08 25.26 59.80 74.07 129 1.13 26 2008/09 32.65 87.00 99.31 134 1.06 27 2009/10 34.78 94.80 84.95 154 1.00 36
Source: Nutrient prices calculated by author based on data on prices of urea, diammonium phosphate, and sulfate of potash from NFDC 2008, 2011. Notes: Rs. = Pakistan rupees.
Discussions with experts on the subject suggest that in addition to developments in international markets, the recurring shortages of natural gas, which is the raw material for domestic nitrogenous fertilizers, have added to farmers’ woes. A reduced supply of gas leads to a reduction in the fertilizer industry’s capacity utilization and production, resulting in higher production costs, which the industry passes on to farmers through price hikes. Notwithstanding this price increase, the cost of domestically produced urea has been less than the imported price due to the subsidized gas supply to the fertilizer

10
WORKING PAPER | September 2011
industry. Since both imported and local fertilizers are sold at the same rate, the government has to subsidize the imported urea, the import of which has recently been confined in the public sector to the Trading Corporation of Pakistan. A compari-son of the domestic prices of urea and DAP, the two most commonly used fertilizers in Pakistan, and their corresponding import prices for the period of this study suggests the former to be considerably less than the latter. Accordingly, there has been an implicit element of subsidy in the sales price and use of these fertilizers throughout the reference period.
Studies of fertilizer use in the country have indicated the adverse effects of price hikes on the amount used (NFDC and FAO 2006). In the wake of increases in the price of fertilizer nutrients, their use declined and the nutrient mix became more unbalanced as prices of phosphate experienced larger increases. The N:P ratio, estimated at 3.26 in 2004/05, widened to 3.52 in 2005/06, forcing the government to reintroduce subsidies on potash and phosphate fertilizers in 2006/07, which helped correct the ratio to 2.52. The subsidy rate on phosphate and potash fertilizers in 2006/07 was Rs. 250 per 50 kg bag. As reported in Pakistan Economic Survey 2009–10 (Pakistan, MOF 2010a), the subsidy on phosphatic and potassic fertiliz-ers was eliminated on December 31, 2008. However, the government had to reintroduce the subsidy, at Rs. 500 per 50 kg bag for potash fertilizers, in January 2010. In addition, in 2009/10, the subsidies on imported urea cost the government Rs. 1,400 per 50 kg bag to make up for the difference between its price and that of local urea. The total subsidy bill on fertilizers during 2009/10 is estimated to be Rs. 14.5 billion. In addition, the government has indirectly subsidized the fertilizer industry by supplying feedstock gas at prices that are reportedly 50 percent less than the price for commercial users.
An important feature of fertilizer application in Pakistan’s crop production is its unbalanced use, resulting in large part from farmers’ lack of awareness, the distorted relative prices of different types of fertilizers, and the lack of soil analysis to determine crop requirements. Traditionally, the use of nitrogenous fertilizers has dominated the nutrient mix at the macro and micro levels. The effect of applying nitrogen on crops is soon reflected in a dark green color, vegetative growth, and a healthy look of the crop fields, convincing farmers of its efficacy. Nevertheless, lopsidedness and imbalance in fertilizer nutrients goes against the recommendations of crop and soil scientists, who suggest a nitrogen-to-phosphorus ratio of 2:1 (NFDC 2011). Thus, current fertilizer nutrient use involves waste and inefficient use of valuable resources. This situation needs to be corrected through an education campaign and suitable policy measures.
FERTILIZER USE ON CEREALS NFDC estimates of the 1996–2010 fertilizer off take for cereals, in terms of total nutrients, are given in Table A.5, while corresponding data per hectare are given in Table 3.4.
Table 3.4—Fertilizer off take per crop hectare, 1996–2010
Year Wheat Rice Maize (kg) 1995/96 141.11 116.34 107.17 1996/97 132.69 112.39 112.11 1997/98 141.96 120.40 122.24 1998/99 142.37 57.34 60.14 1999/2000 151.84 60.59 66.00 2000/01 164.29 67.07 70.30 2001/02 164.89 74.53 69.68 2002/03 170.51 73.02 72.31 2003/04 177.88 70.45 76.20 2004/05 220.99 87.97 56.96 2005/06 225.16 87.07 54.76 2006/07 214.01 85.34 54.15 2007/08 209.42 85.42 51.08 2008/09 205.12 75.17 52.94 2009/10 238.73 90.74 69.94
Sources: Per-hectare use calculated by author based on total fertilizer off take by crop estimated by NFDC (2008, 2011).
Fertilizer nutrient use per hectare of wheat, reflecting an increasing trend from 1996 to 2006, rose from 141 kg to 225 kg. Experiencing a downward trend from 2007 to 2009, fertilizer use fell to 205 kg/ha of wheat in 2008/09. However, by increasing to 239 kg/ha during 2009/10, fertilizer use on wheat seems to have recovered and regained lost ground. The overall trend of fertilizer use per hectare of wheat works out to an increase of 4.19 percent per year. Application of fertilizer nutrients on rice, which ranges from 57 to 120 kg/ha, represents an erratic and irregular pattern in the adoption of this

11
WORKING PAPER | September 2011
important input at farm level. No clear-cut trend emerges from the analysis of these data. Based on the fertilizer offtake data for maize, there appears to be a downward trend, a decline from 122 kg/ha in 1997/98 to 53 kg/ha in 2008/09.6
A few points on the level of fertilizer nutrient use on rice and maize, as estimated by NFDC, are in order. Based on its periodic fertilizer use surveys, NFDC has assumed varying proportions of the total annual off take of fertilizer nutrients for various crops. As shown by the data, area under both maize and rice has expanded, while their share in the off take of fertilizer nutrients has declined, resulting in a declining trend in per-hectare use of nutrients. Previous studies on the subject have also pointed out that the level of fertilizer use for maize does not correspond to the realities on the ground (Salam 2008). In view of the importance of fertilizers in crop production and the fast-changing demand–supply scenarios, it is imperative to have realistic estimates of fertilizer nutrients by crop for planning policies and imports.
Farm Mechanization Traditionally, farm operations such as land tillage and preparation, weeding and interculture, spraying for plant protection, harvesting, threshing, and hauling produce from farm to farmers’ homes or to storage areas have been performed manually or by animals or animal-driven implements. Animals used in these operations are mostly bullocks, male buffalo, and camels. In addition, horses and mules provide the muscle power to transport goods and produce. However, the source of power for some of the operations listed above has undergone a sea change. Starting in the 1960s, tractors of various makes and models have begun to dot the rural landscape. Most of the land preparation operations for planting seeds, sowing crops, carrying out intercultural operations, threshing produce, and transporting various inputs and outputs are performed by tractor-powered equipment and machines. Similarly, tube wells, powered by diesel engines or electric motors for pumping groundwater for irrigation, have been installed in many regions of the country, making a valuable contribution in farm production. The government has also encouraged the use of such equipment by asking commercial banks to advance farm credit for their purchase. Sometimes provincial governments have also provided subsidies for the purchase of various farm implements and equipment.
Initially, farm tractors, machines, and allied farm implements were imported. But over time a number of tractor assem-bling or manufacturing outfits were established in Pakistan. A number of small and medium units for manufacturing farm equipment and machines (threshers, cane crushers, seed drills, plows of various kinds, blades, trolleys, diggers, ridgers, and rotavators) sprang up in various urban areas. The government policies facilitating the establishment of manufacturing and assembly plants, and those for financing the purchase of farm machines and equipment, also helped the cause of farm mechanization in the country. In the initial stages of mechanization, the government provided implicit (through an overvalued exchange rate) and explicit (through subsidized bank loans) subsidies for the purchase of tractors. The government also encouraged farm mechanization by directing banks to provide farm loans for purchases of tractors and other equipment. The provincial governments have also launched some projects of their own to provide subsidies to small and medium farmers for the purchase of tractors and farm equipment. Many workshops, repair shops, and service stations have also been set up in both urban and rural areas for service and maintenance on tractors, tube wells, and other farm machines and equipment.
In the early stages of farm mechanization, many observers expressed reservations (McInerney and Donaldson 1975, Parthasarthy 1977, Binswanger 1978), especially related to the adverse effects of mechanization on farm employment, the eviction of tenants, and other social concerns. A number of studies based on field data examined the effects of mechaniza-tion and tractors on cropping intensity, farm production and productivity, employment, and other factors (Ahmad 1975; Salam, Ghayyur, and Hussain 1980; Salam 1981, 1986). In hindsight, it appears that many of the initial reservations about farm mechanization stemmed from tractor substitution for bullocks, ignoring forward and backward linkages. With the passage of time, tractor use in farming has been accompanied by the use of deep tillage implements, cultivators, planters, ridgers, seed drills, and booms for crop spraying. The use of these implements has improved the quality of tillage operations and land preparation, resulting in higher yields. Many of the concerns about lumpy nature of technology and investment have been addressed by the development of a market for the rental of farm machines, tractors, and tube wells, making this equipment available to farm households that could not afford to own and maintain it on their own. Consequently, both tube wells and tractors have become part and parcel of the Pakistani countryside.
6 The negative trend was also confirmed by the negative coefficient, −0.047 with a t-value of −4.112, of the time variable in estimating the semilog equation LnY = A + bt.

12
WORKING PAPER | September 2011
Data on the number of tube wells and tractors are given in Table 3.5, which shows that the number of tractors in the country rose to 811,191 in 2009/10 from 169,676 in 1995/96. These numbers, however, represent an exaggerated picture since the number of out-of-service tractors, a number that cannot be easily guessed, is neither known nor excluded from these numbers. During the same period, the number of tube wells rose from 485,505 to 1,070,375. The average annual growth rate for tractors is estimated to be 11.25 percent; it is 6.51 percent for tube wells. Reporting the number of tractors in operation at 464,000, Pakistan Economic Survey 2010–11 (Pakistan, MOF 2011) estimated the availability of horsepower (hp) per hectare at 0.9, against a recommendation from the FAO (Food and Agriculture Organization of the United Nations) of 1.4 hp/ha. To bridge the gap, the government has launched the Benazir Tractor Scheme, which aims to deliver 20,000 tractors at a subsidized rate of Rs. 200,000 per tractor (Pakistan, MOF 2011).
Table 3.5—Number of tube wells and tractors in Pakistan, 1996–2010 Year Tube wells Tractors 1995/96 485,505 169,676 1996/97 506,824 185,785 1997/98 531,259 213,749 1998/99 563,226 240,485 1999/2000 609,775 278,744 2000/01 659,278 316,783 2001/02 707,273 352,137 2002/03 768,962 395,520 2003/04 950,144 431,579 2004/05 984,294 480,366 2005/06 999,569 537,354 2006/07 1,025,636 601,836 2007/08 1,016,125 664,348 2008/09 1,069,991 727,545 2009/10 1,070,375 811,191
Source: Author’s estimates based on data reported in Pakistan, MINFA 2011; Pakistan, Agricultural Census Organization 2005.
Farmers increasingly use more sophisticated cultivation equipment like cultivators, moldboard plows, ridgers, rotavators and diggers. Pakistan Agricultural Machinery Census 2004 (Pakistan, Agricultural Census Organization 2005) reported the average tractor use as 173 days per year with daily use hovering around 6 hours. About 95 percent of tractor use time is devoted to farm operations, including the transportation of produce and farm inputs, while nonfarm use of tractors averaged around 5 percent. A great majority of the tractors, 71 percent, were reported to have been purchased by farmers from their own sources, and about 29 percent of the total were purchased through loans from various sources.
The adoption of tractor-powered equipment, implements, and farm machines is due in large part to their local produc-tion, facilities for which have sprung up in both urban and rural areas. In the process, these facilities have opened up employment opportunities for skilled, semiskilled, and unskilled labor. However, an important challenge that needs to be addressed by the local manufacturers of farm machines, implements, and equipment is their standardization and quality control. Lack of quality control and standardization not only limits the market for such equipment but poses problems of maintenance. Frequent breakdowns result in economic losses for farmers.
In rural areas throughout the country, a thriving market has emerged for the services of farm tractors, machinery, and equipment. This demand has not only helped address the problem of making large capital investments by farmers and the associated capacity utilization of farm machinery but has also facilitated the use of improved implements and technology on small and medium farms through renting the services of these machines on a custom hire basis. Accordingly, many farmers have done away with keeping bullocks for farming. This is, in turn, encouraging the use of specialized farm machines and equipment. Rental services are boosting the ownership of selective machinery and its widespread diffusion across all kinds of farms, resulting in efficient use of scarce resources. Farm mechanization has played an important role in the transfor-mation of agriculture in Pakistan. The increased and controlled supply of groundwater for irrigation through tube wells and the availability of power from tractors have helped in expanding the cultivated and cropped area. These technological changes have facilitated adoption of other yield-increasing inputs, including fertilizers, improved seed, plant protection, precision land leveling, and other inputs. All these developments have helped to increase farm production and incomes, generating employment opportunities in the farm and nonfarm sectors, and modernizing agriculture and the rural landscape.

13
WORKING PAPER | September 2011
The use of farm machines and related equipment requires cheap and reliable energy sources. The country’s energy prices have risen substantially in the wake of developments in the international market. The hike in energy prices, accompanied by high taxes and duties, is adversely affecting the economics of farm mechanization. If the inflation in energy and farm input prices are not stemmed, it will seriously undermine efforts at agricultural development, constrain farm production and incomes, and aggravate inflation in food prices. It could also price out exports of farm products from Pakistan in international markets, where cheap and subsidized exports from other countries pose stiff competition.
Irrigation Pakistan is endowed with excellent land and water resources. The climate is suitable for the year-round cultivation of field crops, vegetables, orchards, and fruit plants. The country‘s irrigation system, built around the Indus river and its tributaries, is the largest contiguous system in the world based on gravitational flow. Storage reservoirs and canals were added to the system under the Indus Waters Treaty, brokered by the World Bank to resolve the 1960 water conflict between India and Pakistan. Based on data from the Indus River System Authority, Ashfaq, Griffith, and Hussain (2009) reported the following salient features of the Indus Basin irrigation system: 3 major reservoirs, 19 barrages, 2 headworks, 12 link canals, 45 canal systems, and 107,000 water courses.
Because rainfall in most parts of the country is concentrated in the summer, irrigation water from the canal system is the lifeblood of Pakistan’s agriculture. With the introduction and widespread adoption of dwarf varieties of wheat and rice in the 1960s, and the increase in the use of tractors and fertilizers, farmers have taken to multiple cropping. To supplement the surface water available from the canal system, designed for low cropping intensity, farmers installed small and medium-sized tube wells to pump groundwater, increasing cropping intensity. These tube wells, run by electric or diesel motors, account for about 37 percent of the total water available at the farm level. However, groundwater quality in terms of its suitability for irrigation varies across regions. In the wake of energy shortages and rising power tariffs, many farmers have switched over to diesel motors for pumping groundwater. Accordingly, the proportion of electric tube wells shrank from 24 percent in 1996 to 15 percent in 2009. The share of diesel tube wells increased correspondingly. Table 3.6 lays out data on the supply of irrigation water from the surface and from groundwater.
Table 3.6—Water availability in Pakistan, 1996–2010
Year Surface water Groundwater Total water
Canal head Farmgate Tube well Farmgate (million acre-feet)
1995/96 102.38 81.46 49.39 130.85 1996/97 111.12 81.69 50.36 132.05 1997/98 103.14 81.95 40.20 122.15 1998/99 110.70 82.71 51.07 133.78 1999/2000 106.70 83.37 49.91 133.78 2000/01 86.17 84.22 49.65 133.87 2001/02 79.61 84.34 50.29 134.63 2002/03 96.41 84.46 50.02 134.48 2003/04 103.15 84.76 50.02 134.78 2004/05 86.92 85.66 50.02 135.68 2005/06 104.53 87.06 50.32 137.38 2006/07 97.96 87.48 50.32 137.80 2007/08 102.46 87.68 50.32 138.00 2008/09 95.41 81.19 50.32 131.51 2009/10 96.74 83.49 50.21 133.70
Source: Pakistan, MINFA 2011.
The diversion of surface water from rivers at canal heads has varied from a low of 79.61 million acre-feet (MAF) in 2001/02 to a high of 111.12 MAF in 1996/97. Data also suggest that these diversions declined over time. The annual diversion in 1996–98, which averaged 105.55 MAF, was reduced to 98.20 MAF in 2008–10. In view of the dwindling and varying supply of surface water, efforts have been made to apprise farmers and other stakeholders on measures to con-serve, economize, and enhance the efficiency of water use. These measures include lining canals and water courses, subsidizing drip irrigation equipment, introducing laser land-leveling technology, aligning and improving water courses, and introducing pucca nukkas, or concrete turnouts. The government launched a special Rs. 65 billion initiative to line and realign

14
WORKING PAPER | September 2011
water courses across the country. These efforts seem to be bearing fruit, with the conveyance losses from canal head to water gate, estimated at 20 percent in 1996, declining to 13.70 percent in 2010.
The total availability of water, from both surface and groundwater sources, has fluctuated from 122.15 MAF in 1998 to 138 MAF in 2010. Water pumped from tube wells has contributed 40 to 50 MAF per year. Because this number has stagnat-ed around 50 MAF in recent years despite the increased number of wells, the fluctuations in irrigation supply must have their origin in surface water sources. Here the major variation is felt during the rabi, or winter, crop season. As the water stored in reservoirs during summer is gradually drawn down by the canal system, the water supply is reduced, creating a difficult situation for water managers at the macro level and farmers at the micro level. The water shortage coincides generally with the planting of rabi (winter) crops like wheat; kharif (summer) crops (rice, cotton, maize) reaching maturity may also need late irrigation for a good harvest. However, when summer crop planting is about to commence and reservoirs are at their dead level, this water shortage delays sowing, stoking political disagreements on the distribution of water among the prov-inces. Also aggravating the country’s power shortage is the silting of dams over time.
In view of the diversified cropping pattern practiced in the country, precise estimates of water use by crop are difficult to attain. But some guesstimates about the irrigation situation for a given crop can be attempted, since data on water availabil-ity for rabi (winter) and kharif (summer) seasons are reported by the authorities and we know the area under rabi and kharif crops grown in the country. In the case of cereal crops under review, wheat and rice are rabi and kharif crops, respectively, while maize is grown in both seasons.
Annual water availability per crop acre has fluctuated between 2.15 and 2.50 feet during the study period (Table 3.7). The crops cultivated in Pakistan include some very high-water delta crops, such as rice, sugarcane, and maize, that require a lot of water. Obviously, when an area under high delta crops expands, less water is available for other crops. The cultiva-tion of rice coincides with the rainy season, when irrigation supplies are generally plentiful. But toward the rice crop’s maturity in October, especially in years of low rainfall, water shortages may adversely affect harvest size. On the other hand, wheat, a low-water delta crop, is the most likely to experience and suffer from water shortages. The water reservoirs filled during summer are slowly and steadily emptied to meet the requirements of irrigation systems and often reach critically low levels in winter, specifically December to February, which are crucial months for wheat crops. Similarly, spring-sown maize may suffer from water stress in years of water shortage, a frequent occurrence.
Table 3.7—Water availability by crop season, 1996–2010
Year Water availability Cropped area
(million acres) Water available per crop acre
(acre-feet) Kharif (summer) Rabi (winter) (million acre-feet)
1995/96 75.82 55.03 55.82 2.34 1996/97 76.37 55.68 56.07 2.36 1997/98 71.37 50.78 56.81 2.15 1998/99 77.19 56.59 57.06 2.34 1999/2000 76.90 56.38 56.07 2.38 2000/01 77.69 57.08 54.34 2.46 2001/02 77.57 57.06 54.59 2.47 2002/03 77.45 57.03 53.85 2.50 2003/04 77.63 57.15 56.56 2.38 2004/05 78.19 57.49 56.32 2.41 2005/06 77.64 59.74 57.06 2.41 2006/07 82.26 55.54 58.29 2.36 2007/08 86.93 51.07 59.03 2.34 2008/09 82.15 49.35 59.03 2.23 2009/10 86.55 56.31 59.03 2.26
Source: Pakistan, MINFA 2011.
Major irrigation-sector challenges include reducing system water losses, improving water delivery efficiency, and in-creasing water use efficiency at the farm level. There is also a need to create awareness about economic loss due to the neglect and poor maintenance of canals, distributaries, and water courses, as well as political interference, water theft, and corruption. High priorities include making farmers aware of agronomic water conservation practices and introducing them to technological innovations that economize and reduce irrigation system waste. In the last decade, the federal government launched a billion-rupee initiative to improve the country’s water courses. As reported in Agricultural Statistics of Pakistan

15
WORKING PAPER | September 2011
2009–10 (Pakistan, MINFA 2011), out of 144,164 water courses in the country, 108,787 had been improved by June 2010. The problem with such a program, however, is its slow pace and the need for an institutional system for the proper care and maintenance of improved water courses so that the investments are not lost. Since the construction of the Tarbela Dam in the 1970s, no large dams have been built in the country. Storage capacity has been lost as a result of silting. With its increasing population, the country’s requirements for farm products are expanding. But arable land is facing encroachments from nonfarm uses such as housing, industrial, infrastructural, and recreational projects. In the process, some of the most fertile lands, previously used for agriculture, have been permanently lost to farming. The land-to-person ratio is deteriorating. Similarly, water is facing competition from municipal, industrial, recreational, and other uses. With annual per capita availabil-ity of water estimated at 1,066 m3, Pakistan is in the “high water stress” category (Pakistan, MOF 2010a).
Given the climatic conditions and rainfall situation in Pakistan, new lands cannot be brought under plow unless and until additional irrigation water becomes available. This requires large investments, feasible sites, and political will. In the mean-time, it is imperative to make all-out efforts to economize water and improve the efficiency of resource use in agriculture. In this context, forming farmers’ irrigation groups with authority and responsibility for maintaining water courses and ensuring equitable distribution of water to farmers needs special mention and attention. This initiative was proposed in the report Institutional Reforms to Accelerate Irrigated Agriculture (John Mellor Associates and Asianics 1994), submitted to the government of Pakistan in 1994. There is also scope for undertaking small and medium water harvesting schemes and storage projects in the country’s barani, or rainfed, areas. Another important issue in addition to the quantitative expansion of facilities involves the quality of surface water and groundwater. As untreated municipal and industrial waste and effluents are discharged into water bodies, water quality is being adversely affected, influencing the health, wealth, and livelihoods of downstream water users. The indiscriminate installation of tube wells to pump groundwater is also taking its toll in terms of soil health, secondary salinization, and resource use efficiency. Pricing of irrigation water is a contentious issue among irrigation system stakeholders. But the fact remains that charges levied for the supply of irrigation water are not only far below its opportunity cost and contribution to farm production but also constitute the lowest fraction in the cost of production among various inputs. Another important issue remains the lack of effective coordination among various agricultural re-search, extension, and irrigation departments, resulting in inefficient use of land and water resources. All of these issues in irrigation and agriculture need to be addressed for the sustainability and good health of the country’s food- and fiber-producing system.
Agricultural Research and Extension Modern agriculture requires the support of a first-rate agricultural education, research, and extension system to train workers and address emerging technological, socioeconomic, and institutional challenges. It is also predicated on the timely supply of modern inputs and services. Empirical studies have indicated a high rate of return on investments in agricultural research and extension within and outside Pakistan (Evenson and Kislev 1973, Evenson and Bloom 1993). These high rates of return are also a manifestation of low investments in these sectors. Researchers at IFPRI (International Food Policy Research Institute) have reported investments in agricultural research and extension to be a meager 0.31 percent of the agricultural gross domestic product in Pakistan, as compared with 0.36 in Bangladesh, 0.44 in the Philippines, 0.46 in Sri Lanka, and 1.92 in Malaysia(Beintema and Stad 2008). The bulk of the funding for research goes into meeting the establishment and other fixed charges; operational research only gets a small fraction of 3–9 percent of the total outlay (Beintema et al. 2007). Additionally, the utilization of research funds is often inefficient and wasteful. As far as the institutional arrangements for carrying out research activities are concerned, there are 6 research institutions at the federal level and 15 provincial research institutions. In addition, there are 13 agricultural and veterinary sciences universities (faculties) in the provinces.
Total spending on agricultural research and development in the public sector was $223 million in 1991, in terms of 2005 dollars (Beintema and Stads 2008). This declined to $171 million in 2002. Public-sector spending on agricultural research and development fell by 23 percent in Pakistan; it was estimated to have increased by 31, 35, 82, 87, and 119 percent, respectively, in Sri Lanka, Bangladesh, India, Malaysia, and China. The number of agricultural scientists, estimated at 66 per million of population in 1973, had declined to 44 per million in 1988 and to 24 per million in 2010 (Ali 2011). As a conse-quence of the neglect of research and development efforts, the performance of the agriculture sector has suffered. The growth rate in agriculture during the 1980s, which averaged 5.4 percent per year, declined to 4.4 percent in the 1990s and 3.2 percent in the first decade of the 21st century.
It has been alleged that research programs are often inconsistent with national needs and priorities. The system in Pa-kistan suffers not only from inadequacy of funding but also from a lack of financial and administrative authority as well as

16
WORKING PAPER | September 2011
poor accountability and centralized authority. The provincial research institutes have also suffered from a lack of incentives, proper career structures, and training facilities for the scientists working there. An important weakness that has characterized the country’s research and extension system is poor coordination and inadequate linkage between the research organiza-tions and the extension services (Pakistan, PC 2009).
An important consequence of the neglect of agricultural research and extension systems is the huge recurring economic loss suffered due to low average crop yields at the national level in relation to the yields realized by “progressive” farmers. These farmers are getting about 4.8 tons of wheat, 7 tons of maize, and 4 tons of rice from a hectare while national average yields hover around 2.6, 2.9, and 2.1 tons, respectively, for these crops. These yield gaps of 43–55 percent in cereals translate into huge economic losses each year. These losses cannot be blamed on any single factor, but they are attributa-ble to either a lack of awareness of technical know-how and technologies (failure of extension services), the nonavailability of modern inputs like seed and fertilizers (market failure), or a lack of farmers’ purchasing power and liquidity due to a lack of credit, incentives, or both. It is possible that average farmers are not motivated with the right level of incentives to use high-input technologies. There could also be some institutional and other constraints and rigidities hampering the performance of these average farmers. The real culprits in this context—whether location-specific or general—nevertheless need to be identified and addressed to avoid these losses worth billions of dollars every year.
Farm Credit The importance of agricultural credit in the modernization and development of agriculture is well known. Empirical studies in Pakistan have also highlighted the role of credit in raising farm productivity (Zuberi 1989; Malik, Mushtaq, and Gill 1989). To promote use of farm machinery; installation of tube wells; and adoption of modern inputs like fertilizers, improved seeds, and more highly developed agriculture, Pakistan has made special efforts to provide farm loans, often subsidized. A specialized bank, now called the Zarai Taraqiati Bank Limited (ZTBL), has served agricultural credit needs since the 1960s, when it was founded as the Agricultural Development Bank of Pakistan (ADBP).
Today’s ZTBL provides production and development loans. The production loans, also called short-term loans, are de-signed to meet seasonal cash needs for buying seed, fertilizers, and pesticides; they are to be repaid after the crop harvest. Development loans provide funds for long-term investments in, for example, tube well installation and tractor purchases; they are repayable over a longer duration, 5 to 10 years. The bank, which has established a network of regional offices and branches to serve the agriculture sector, has reportedly financed 532,254 tractors and 148,486 tube wells since its inception (Pakistan, MOF 2010b). In addition, it has helped the cause of increasing farm production through financing farm input purchases for thousands of farmers annually. The commercial banks have also been required to extend farm loans to cater to short- and long-term credit requirements in agriculture. Policy concerning the interest rate charged on farm loans has seen several changes over time, but it has always included some element of subsidy for the farmers.
Table 3.8 presents data on loans disbursed by various institutions for the agriculture sector.
Table 3.8—Agricultural credit disbursed by institutions, 1996–2010
Year ZTBL Cooperatives Commercial banks
Domestic private banks Total
(Rs. millions) 1995/96 10,339.27 3,803.38 5,044.66 - 19,187.31 1996/97 11,687.11 3,431.13 4,429.43 - 19,547.67 1997/98 22,353.60 4,928.93 6,109.70 - 33,392.23 1998/99 30,175.96 5,439.97 7,236.00 - 42,851.93 1999/2000 24,423.89 5,951.23 9,312.50 - 39,687.62 2000/01 27,610.20 5,124.20 12,056.00 - 44,790.40 2001/02 29,108.01 5,127.54 17,486.12 592.82 52,314.49 2002/03 29,270.17 5,485.39 22,738.60 1,421.11 58,915.27 2003/04 29,933.07 7,563.54 33,247.45 2,701.80 73,445.86 2004/05 37,408.84 7,607.47 51,309.78 12,406.82 108,732.91 2005/06 47,594.14 5,889.49 67,967.40 16,023.38 137,474.41 2006/07 56,473.05 7,988.06 80,393.18 23,976.16 168,830.45 2007/08 66,938.99 5,931.45 94,749.29 43,940.92 211,560.65 2008/09 75,138.55 5,579.43 110,666.00 41,626.30 233,010.28 2009/10 79,012.35 5,721.73 119,608.98 43,777.41 248,120.47
Source: Pakistan, MOF 2010b.

17
WORKING PAPER | September 2011
Notes: ZTBL = Zarai Taraqiati Bank Limited, Rs. = Pakistan rupees.
The current value of farm loans extended by various agencies in the public and private sectors was an estimated Rs. 19.19 billion in 1995/96; it exceeded Rs. 248 billion in 2009/10. When adjusted for inflation (using the general consumer price index with 2000/01 as the base year), the corresponding farm loan values worked out to Rs. 26.45 and Rs. 115.72 billion, respectively. For the period under study in this report, the average growth rate in the real value of farm loans was 12 percent per year. Over time, the relative importance of agencies responsible for extending farm credit has changed. Over the 15-year period from 1995/96 to 2009/10 the contribution of ADBP/ZTBL in total institutional credit declined from an estimated 54 percent to 32 percent. During the same period, the share of farm loans extended by commercial banks is estimated to have risen from 26 to 48 percent. Notwithstanding the decline in its share in overall loans, ZTBL remains the premier source of institutional credit for agriculture in Pakistan. Commercial banks are obliged to meet annual farm loan targets prescribed by the State Bank of Pakistan. Despite various efforts aimed at increasing the role of agricultural credit in the rural economy, the farm sector accounts for only 45 percent of the banking sector’s total credit portfolio. It has been estimated that institu-tional credit satisfied only 47 percent of agriculture’s credit requirements in 2009/10. Regional and subregional disparities also mar the credit distribution in agriculture. Of a total of 7,015 bank branches, only 4,058 are designated for agricultural credit, and 46 percent of these are located in urban centers (Khan 2011). The reluctance of commercial banks to lend to agriculture is perhaps due to the high incidence of nonperforming loans in the sector. To minimize their risk, bank loans involve excessive paperwork, pledging of collateral, and other lengthy procedures, resulting in high transaction costs, which discourage farmers in general and small and marginal farmers—who need these loans the most—in particular from seeking bank loans.
OUTPUT POLICIES
Agricultural Pricing Policies Pakistan has a history of intervening in foodgrains markets—with periodic reviews and modifications—that dates back to the country’s independence in 1947. The policy of monopoly procurements of wheat and rice at the fixed prices inherited at the independence was continued. It was designed to provide cheap food to the urban population and industrial workers (Niaz 1995). However, as it adversely affected farm production and producer incentives, the policy was withdrawn in the 1960s. During the third five-year plan, which commenced in 1965, the focus of policy shifted to providing incentives to farmers in terms of limited price support and price stabilization operations (Niaz 1995). The support prices of wheat and rice were periodically reviewed to reflect the changing domestic demand and supply situation. The review was initially performed by the Planning Commission (PC) but later on transferred to the Ministry of Food, Agriculture and Cooperatives (MFAC) (Niaz 1995). The scope of the support price program in terms of its conceptual framework, commodity coverage, policy instru-ments, and institutional involvement has changed over time. In 1977, it was decided to annually review and suitably revise output prices of various commodities. In 1981, the government established the Agricultural Prices Commission (APCOM) as an autonomous organization affiliated with MFAC for advising on the pricing policy of wheat, rice, maize, cotton, sugarcane, oilseeds, potatoes, onions, and other commodities that the government may specify (APCOM 1984). Coverage of the support price program has varied from time to time, and it is currently effective for the wheat crop only.
Support Price Market prices of farm commodities exhibit wide fluctuations during the course of a year, rising in the off-season, when supply is lean, and falling during the harvest season, when supply is abundant. During the harvest period, market prices are under pressure, especially in years of good harvest, and tend to crash to the disadvantage of growers. This occurs because most farmers, but particularly small and medium farmers, lack adequate storage facilities and financial capacity to hold on to their produce in the hope of better prices later. They thus tend to dispose of their surpluses soon after harvest to meet their cash requirements for buying farm inputs and to defray other consumption and social obligations. The support price in Pakistan is meant to provide a market price floor during the harvest season. The sale of produce by farmers at the prices fixed by the government is voluntary, at least in theory. Government-designated agencies are supposed to procure all produce offered by growers at the support price (Salam 2001). To do so successfully, the institutional, logistical, and financial arrangements need to be set up in advance. In the event that market prices are higher than support prices, farmers are under no obligation to sell their produce to government agencies.

18
WORKING PAPER | September 2011
Since 1981, APCOM, which was renamed the Agriculture Policy Institute (API) when it became a Ministry of Food and Agriculture (MINFA) department in 2008, has undertaken the requisite analysis in connection with the determination of support prices since 1981. API’s commodity-specific technical analysis has invariably incorporated estimates of cost of production, changes in input prices, domestic demand and supply, trends in domestic and international prices, comparative economics of competing crops, the economy’s inflation rate, changes in the crop’s purchasing power, and the likely impact of its price proposals on other economic sectors. The commission’s proposals, forwarded to the government through MFAC/MINFA, are circulated to other economic ministries like finance, commerce, industry, and PC for their comments and views. The final pricing policy decision is made by the cabinet or its economic coordination committee, over which the finance minister presides (Salam 2001). In 2011, with the devolution of MINFA to the provinces, API was transferred to the Ministry of Science and Technology. The 2011 devolution of the government’s power as it affects agriculture and agricultural policy is discussed further below.
The situation in terms of producer, support, and market prices of wheat and rice (paddy), and in terms of annual pro-curements to protect the support prices is discussed below. In the case of maize, the government has not intervened in the output market, so the discussion of maize focuses on market prices.
Producer Prices of Foodgrains Wheat production—its marketing, trade, and milling—are carried out in the private sector. However, in view of its socioeco-nomic importance it has been the subject of a number of policy interventions. In the wake of the deregulation of the economy and the increasing role of the private sector, most of the interventions either have been phased out or are on their way out. Nevertheless, the government continues to announce its support price and procures substantial quantities of the crop to protect this price. It also holds stocks for food security reasons. The issue price for the provision of wheat from government stocks to flour mills, which is used as a measure of control over the market price of wheat flour, continues to be subsidized. The story of interventions in wheat markets in Pakistan is well documented (Cornelisse and Naqvi 1987; Dorosh and Valdes 1990; Hamid, Nabi, and Nasim 1990; Dorosh and Salam 2006; Salam and Mukhtar 2008; Salam 2009a). The impact of various government interventions in the wheat market on producer prices and incentives is discussed below. The review involves a comparison of market prices of wheat in the harvest season with the support prices and an assessment of the changes in the real values of wheat prices.
PRICES OF WHEAT Data on the support prices of wheat, as fixed by the government for the 1995/96 to 2009/10 crop years, along with the wheat procured at support prices, are given in Table 4.1. The average wheat market price in markets in important producer areas during the harvest season is also given in the table for comparison. Data in Table 4.1 indicate that between 1996 and 2010, the wheat support price increased from Rs. 173 to Rs. 950 per 40 kg. The cumulative increase in support price, which has been revised irregularly, is 449 percent. The support price has been protected through substantial procurements of wheat by public-sector agencies during the harvest season. The issues relating to revision of the support price are discussed at length elsewhere (Salam 2009b). The annual procurements under the support price program, though reflecting a wide range, 2.72 million to 9.23 million tons, have been mostly around 4 million tons.
Table 4.1—Support and market prices of wheat and its procurements, 1996–2010
Year Support price Market price Procurement (Rs./40 kg) (million tons)
1995/96 173 185 3.45 1996/97 240 273 2.72 1997/98 240 259 3.98 1998/99 240 261 4.07 1999/2000 300 297 8.58 2000/01 300 275 4.08 2001/02 300 292 4.04 2002/03 300 305 3.51 2003/04 350 388 3.45 2004/05 400 471 3.93 2005/06 415 420 4.51 2006/07 425 432 4.42 2007/08 625 651 3.92 2008/09 950 950 9.23

19
WORKING PAPER | September 2011
2009/10 950 902 6.71
Sources: Data on support and market prices from API 2011; data on procurements from Pakistan, MINFA 2011. Notes: Rs. = Pakistan rupees.
For the most part, market prices of wheat during harvest season have been generally higher than the corresponding support price fixed by the government. In the wake of a record harvest in the 1999/2000 crop year, the procurement of 8.58 million tons, and the availability of large stocks with the government agencies, the wheat market was subdued in 2001 and 2002, resulting in low harvest prices. Similarly, in 2009/10, when the government’s large opening stocks from the previous crop blocked huge amounts of capital, and storage capacity was limited, market prices were lower than the support prices. The private sector, expecting a sharp decline in price, preferred to remain on the sidelines.
PRICES OF RICE: BASMATI AND IRRI PADDY Rice production, marketing, and trade have been subjected to several policy interventions: monopoly procurement and exports in the public sector, levying of export taxes, restrictions on internal movements, bans on the cultivation of certain varieties, and restrictions on rice sowing in certain areas coupled with promotion of its cultivation in others to reclaim saline lands. In the wake of economic reforms introduced in the 1980s and the expanding role of the private sector in the economy, the government’s role in the rice sector is now limited to the occasional announcement of support or indicative prices, while milling, marketing, and trade of paddy are all handled by the private sector (Salam 2009b).
Until 2001/02, the government annually reviewed and announced the support price of rice (paddy). This support price was protected through market intervention and procurements of paddy in the public sector. In 2003/04, the government switched over to announcing only its indicative price, and that not regularly. With the adoption of the indicative price, the government has also absolved itself of any obligation to protect the rice price as was the case with the support price.
Table 4.2, which presents data on support and market prices of basmati and IRRI paddy from 1995/96 to 2009/10, sug-gests an irregular pattern in the announcement of official prices for basmati. From 1995/96 to 1999/2000 there was an annual revision of the support price. The price fixed for the 2000/01 crop was also maintained for the 2001/02 and 2002/03 crops. Subsequently, the concept of indicative price supplanted that of support price. However, for the next three crop years, prices were reviewed and announced.
Table 4.2—Support and market prices of basmati and IRRI paddy, 1996–2010
Year Prices of basmati Prices of IRRI paddy
Support/indicative Market Support/indicative Market (Rs./40 kg)
1995/96 222 231 112 181
1996/97 255.3 296 128.8 164
1997/98 310 297 153 205
1998/99 330 362 175 234
1999/2000 350 358 185 206
2000/01 385 302 205 179
2001/02 385 361 205 205
2002/03 385 471 205 221
2003/04 400 473 215 252
2004/05 415 453 230 346
2005/06 460 427 300 289
2006/07 NA 451 306 320
2007/08 NA 1,289 NA 525
2008/09 1,250 1,181 700 585
2009/10 1,000 1,097 600 666
Sources: Support prices from Pakistan, MOF 2010b; basmati prices from API 2011. Notes: Market prices relate to the main producing-area markets of Sindh for IRRI and of Punjab for basmati, obtained from November to January. Basmati prices are for basmati 385. Rs. = Pakistan rupees, NA = Not announced.

20
WORKING PAPER | September 2011
Data in Table 4.2 show the support/indicative price of basmati increasing from Rs. 222 per 40 kg in 1995/96 to Rs. 460 in 2005/06, a cumulative increase of 107 percent. But no price was announced for the 2006/07 and 2007/08 crop years. Then, in 2008/09, in the wake of very high prices in the international market, the government raised the indicative price of basmati to Rs. 1,250 per 40 kg, leading to a quantum jump in the price of fine paddy. However, for the next crop, the government reduced its official indicative price to Rs. 1,000 per 40 kg.
By and large, the market price of basmati paddy during harvest season in important Producer-area market have been higher than the government-announced price. But there have also been instances when market prices averaged below official prices with no government action to protect the official price. Farmers often question this policy of announcing support/indicative paddy prices if the price is not going to be protected and assured to the growers in case of need.
Data on support and market prices of IRRI paddy, as provided in Table 4.2, suggest a regular review of prices of coarse paddy, unlike that of basmati, discussed above. The support/indicative price fixed at Rs. 112 per 40 kg for the 1995/96 crop had increased to Rs. 306 in 2006/07. No price was announced for the 2007/08 crop. But for the 2008/09 crop, the an-nounced price was Rs. 700 per 40 kg, reflecting an increase of 131 percent over that for the 2006/07 crop. However, for the 2009/10 crop, the official price was lowered to Rs. 600 per 40 kg. Market prices of IRRI paddy between 1996 and 2010 have generally been higher than official prices. Market prices, fluctuating from year to year depending on the size of the harvest and the demand situation, have ranged between Rs. 164 and Rs. 666 per 40 kg.
NOMINAL VERSUS REAL PRICES The nominal prices of wheat, basmati, and IRRI paddy, as discussed above, have shown substantial increases over time. But the prices of inputs and other items of daily use have also recorded significant increases between 1996 and 2010. The general consumer price index (CPI), with 2000/01 as the base year, has increased from 72.55 in 1995/96 to 214.41 in 2009/10, reflecting an average annual increase of 6.74 percent. Real values of support and market prices of cereals, obtained by deflating their nominal values by the corresponding values of the CPI, are set out in Table 4.3. The real value of the support price of wheat, estimated at Rs. 238.46 per 40 kg in 1995/96 (in terms of 2000/01 prices) is estimated to have increased to Rs. 448.08 in 2009/10. Similarly, the real value of its market prices, estimated at Rs. 255 in 1995/96, had increased to Rs. 420.69 in 2009/10. When data on real values of wheat prices are analyzed to estimate their annual trend, the trend is estimated to be an annual increase of 3.11 percent for market prices and 3.60 percent for support prices.
Table 4.3—Real values of support and market prices of wheat, basmati, and IRRI paddy, 1996–2010
Year Support prices Market prices
Wheat Basmati IRRI Wheat Basmati IRRI (Rs./40 kg)
1995/96 238.46 306.00 154.38 255.00 318.40 249.48 1996/97 295.89 314.76 158.80 336.58 364.94 202.19 1997/98 274.44 354.49 174.96 296.17 339.62 234.42 1998/99 259.57 356.91 189.27 282.28 391.52 253.08 1999/2000 313.22 365.42 193.15 310.09 373.77 215.08 2000/01 300.00 385.00 205.00 275.00 302.00 179.00 2001/02 289.74 371.84 197.99 282.02 348.66 197.99 2002/03 281.03 360.66 192.04 285.71 441.22 207.03 2003/04 313.54 358.33 192.60 347.58 423.72 225.75 2004/05 327.92 340.22 188.56 386.13 371.37 283.65 2005/06 315.25 349.44 227.89 319.05 324.37 219.54 2006/07 299.57 NA 215.69 304.50 317.90 225.56 2007/08 393.33 NA 204.53 409.69 811.20 330.40 2008/09 495.05 651.38 364.77 495.05 615.42 304.85 2009/10 443.08 466.40 279.84 420.69 511.64 310.62
Source: Real prices calculated from the data on nominal prices presented in tables 4.1 and 4.2. Note: Nominal support and market prices deflated by consumer price index with base year of 2000/01. Rs. = Pakistan rupees.
The real values of support prices of both basmati and IRRI paddy, though reflecting interyear variation, have on the whole increased over time: Basmati increased from Rs. 306 per 40 kg in 1995/96 to Rs. 349.44 in 2005/06, and IRRI paddy increased from Rs. 154.38 to 227.89. The real values of the support prices of both basmati and IRRI paddy peaked in 2008/09 and fell the next year. Similarly, the market prices of both basmati and IRRI paddy, though suffering from annual fluctuations in their real values, have trended upward. The real values of the market price of basmati and IRRI paddy

21
WORKING PAPER | September 2011
recorded their highest levels in 2007/08, reflecting the transmission of developments in world prices of staple food crops to the domestic markets. The values of real market prices of basmati and IRRI paddy during the study period (1996–2010) depict rising trends of 3.62 and 2.27 percent per year, respectively. Notwithstanding improvements in the real price of wheat, basmati and IRRI paddy studies have indicated substantial resource transfers from wheat and rice farmers in Pakistan as the domestic producer prices lagged behind their corresponding international prices, reflecting their opportunity costs (Dorosh and Salam 2009; Salam 2009a).
PRICES OF MAIZE Of all the major crops in Pakistan, maize has been subjected to a minimum of policy interventions. Nevertheless, its imports have been subject to duties varying from 10 to 25 percent. Data on the average annual wholesale prices of maize in the Lahore market, the country’s largest grain market, along with the corresponding wheat prices, are set out in Table 4.4. The table also presents wholesale prices of maize that are deflated by the CPI estimates of its real value.
Table 4.4—Average wholesale prices of maize and wheat in Lahore market, 1996–2010
Year Price of maize Price of wheat General CPI Real price of maize (Rs./40 kg) 2000/01 = 100 (Rs./40 kg)
1995/96 257.00 199.92 72.55 354.24 1996/97 276.00 236.58 81.11 340.28 1997/98 312.00 300.75 87.45 356.78 1998/99 315.75 276.38 92.46 341.50 1999/2000 307.50 293.50 95.78 321.05 2000/01 309.50 322.17 100.00 309.50 2001/02 321.33 318.33 103.54 310.34 2002/03 353.92 338.25 106.75 331.54 2003/04 354.67 391.08 111.63 317.72 2004/05 385.50 452.44 121.98 316.04 2005/06 381.33 457.25 131.64 289.68 2006/07 460.00 459.17 141.87 324.24 2007/08 510.00 627.33 158.90 320.96 2008/09 750.83 887.18 191.90 391.26 2009/10 651.75 1,016.58 214.41 303.97
Source: Data on maize and wheat prices from Pakistan, MINFA 2011. Notes: CPI = consumer price index, Rs. = Pakistan rupees.
The wholesale prices of maize, which averaged Rs. 257 per 40 kg in 1995/96 and trended upward to peak at Rs. 750.83 in 2008/09, slid downward thereafter to average Rs. 651.75 in 2009/10. Although nominal maize prices have trended upward, their real value does not reflect a trend. Thus, as maize production in the country has expanded, its real price has not increased significantly. Another point worth noting is the high degree of association between the domestic prices of maize and wheat. The correlation coefficient between the prices of these two commodities in the Lahore market between 1996 and 2010 was about 0.96. Thus, in years of wheat shortage and high wheat prices, maize prices also rose on account of its substitution for many uses of wheat and due to the years of plenty for wheat that seem to have exerted downward pressure on maize prices.
Procurement, Stocking, and Distribution of Foodgrains The main motivation for the public procurement of foodgrains seems to be implementation of a support price policy for designated crops. Wheat is the only foodgrain for which active procurements and stocking in the public sector took place during the period covered in the study. For maize, the government has neither announced any support/indicative prices nor made any procurement. All steps and stages involving the transfer of maize and its products from producers to final con-sumers are performed by the private sector. With the abolition of the Rice Export Corporation of Pakistan in the late 1980s, government involvement or intervention in the rice market has been limited to occasional announcement of a sup-port/indicative price for rice (paddy), without much concern and effort to ensure the same to farmers. In regulating trade in rice, the government intervened in 2008 when international prices experienced a record hike and the government imposed restrictions to curtail exports, which it feared would create a domestic shortage of the commodity. But these restrictions were only temporary and soon eased.

22
WORKING PAPER | September 2011
In the case of wheat, the country’s staple food, the public sector is active throughout its procurement, storage, and dis-tribution. The federal-level Pakistan Agricultural Storage and Services Corporation (PASSCO) and provincial food depart-ments intervene in the wheat market, buying the crop at the support price fixed by the government at harvest time. Both PASSCO and provincial food departments are assigned procurement targets and provided credit facilities for wheat pro-curement and storage. The wheat from public stores is issued to flour mills at subsidized rates to exercise some leverage on the sale price of wheat flour in the market. Data on wheat procurements, releases, stocks, and wheat storage capacity in the public sector are presented in Table 4.5.
Table 4.5—Wheat procurements, releases, stocks, and storage capacity, 1996–2010 Wheat year Procurement Release Stock on May 1 Storage capacity (May–April) (’000 tons) 1995/96 3,740 5,139 385 4,777 1996/97 3,448 5,987 453 4,777 1997/98 2,725 5,794 902 4,780 1998/99 3,984 6,165 981 4,780 1999/2000 4,070 6,131 702 4,580 2000/01 8,582 5,537 3,552 4,339 2001/02 4,081 3,376 3,683 4,339 2002/03 4,045 5,130 992 4,339 2003/04 3,514 4,104 161 4,339 2004/05 3,939 4,500 350 4,339 2005/06 4,514 2,088 2,107 4,339 2006/07 4,422 6,003 501 4,339 2007/08 3,918 6,320 136 4,339 2008/09 9,200 5,784 822 4,339 2009/10 6,715 5,985 4,223 4,339
Sources: Pakistan, MOF 2010b for data on procurements, stocks, and releases. Data on storage capacity compiled from Pakistan, MINFA 2008, 2011.
The support price program under which government agencies procure wheat provides for voluntary sales by farmers. But in years of short crop, there have been reports that revenue officials and other government functionaries forced growers to sell. At the behest of food departments, district administrations and provincial governments have many times restricted wheat movements to achieve procurement targets. Until recently, wheat trade through the public sector was generally confined to imports. The private sector has been engaged in wheat exports only in the last few years. As shown in Table 4.5, the total storage capacity available through the public-sector agencies engaged in wheat marketing has been 4.339 million tons since 2000/01. As a matter of policy, no additions to this capacity have been made. Wheat procurement, on the other hand, was 8.582 million tons in 2000/01, 4.514 million tons in 2005/06, 9.2 million tons in 2008/09, and 6.715 million tons in 2009/10. Thus storage capacity has generally been inadequate; indeed, the author has often observed large quantities of wheat in gunnysacks stacked out in the open. Under such conditions, one can imagine the huge economic losses, quantita-tive as well as qualitative, suffered by the produce in the process.
DEVOLUTION OF FOOD AND AGRICULTURE POLICY FUNCTIONS Before July 2011, Pakistan had a federal ministry for food, agriculture, and livestock. The Ministry of Food and Agriculture (MINFA), tasked with 38 functions, had both autonomous organizations and institutions, and internal departments to carry out its duties, which are listed in Table A.6. These institutions included research, policy analysis, and development agencies and organizations. With the devolution of responsibility for agriculture, food, livestock, and related disciplines to the provinces under the 18th amendment to the constitution, a number of MINFA departments and organizations were devolved to the provinces. In July 2011, the ministry’s functions were parceled out to other ministries. The Planning and Development Division picked up economic coordination and planning with respect to food and policymaking for agriculture; the Statistics Division took on collection of data on various aspects of food and agriculture, and monitoring of the supply position of foodgrains; the Economic Affairs Division took over international cooperation; the Commerce Division handled plant protec-tion, including plant quarantine, aerial sprays, locust control, warning systems, import and standardization of pesticides, fertilizer imports, and issues of domestic and international trade in foodgrains and other foodstuffs; and the Ministry of Science and Technology (MST) gained agricultural research and its provincial coordination as well as seed certification and testing.

23
WORKING PAPER | September 2011
MST was also assigned the Agriculture Policy Institute (API). There was, however, subsequent confusion as to whether API’s main role in the changed scenario is to undertake policy-related studies and advise the government about policy-related issues, a job that has also been assigned to the Planning and Development Division. Furthermore, the function of economic studies for framing agricultural policies has been transferred to the provinces. It should also be mentioned in this context that the Inter-Provincial Coordination Division now has responsibility for price stabilization by fixing procurement and issue prices. The aftermath of devolving food- and agriculture-related areas is still unfolding. On October 26, 2011, the prime minster constituted four new ministries, including the Ministry of Food Security and Research, which includes the National Food Security and Research Division. The functions assigned to this ministry include economic coordination and planning related to food, imports/exports of foodgrains and other foodstuffs, international cooperation and assistance in food, plant quarantine and protection, locust control and warning, seed certification and registration, fertilizer standardization and imports, and agricultural research. In this context, the following organizations and agencies have been placed under the administrative control of the National Food Security and Research Division of the Ministry of Food Security and Research: Pakistan Agricultural Research Council, API, Federal Seed Certification & Registration Department, Pakistan Agricultural Storage and Services Corporation, Pakistan Central Cotton Committee, Pakistan Dairy Development Company, the Live-stock and Dairy Development Board, and the Fisheries Development Board.
A careful reading of the functions and subjects originally assigned to the now-devolved MINFA suggests that a number of functions—including farm management studies, economic studies for framing agricultural policy, collection of statistics for agricultural research, delineation of underdeveloped areas and fields, and the Sugar Board—did not really belong to the domain of MINFA and that the ministry did not give serious attention to these subjects, at least in the last 10 years or so. With the devolution of the areas of agriculture, livestock, fisheries, and forestry, it would advisable to re-examine the list of functions to be retained at the ministerial, secretariat, and government levels, and engage universities and provincial research institutes in issues of importance for economic analysis and policy planning. There is also a need for revisiting the allocation of the functions and organizations placed under the administrative control of the Ministry of Food Security and Research. But what is most important is strengthening the capacity for economic analysis of issues affecting food security and the development of agriculture, fisheries, livestock, and poultry at the federal and provincial levels, as complex challeng-es emerging in the wake of globalization demand the urgent attention of policy planners. Due to their limited financial and human resources, the provincial research institutes need to be assigned priority areas of research in accordance with their resources and comparative advantages to avoid duplication of effort and inefficient use of resources. The federal research organizations may try to fill the gaps, in collaboration and cooperation with the provincial research agencies.
Review of input and output policies has highlighted the major weaknesses and challenges confronting agriculture in Pa-kistan. One of the major weaknesses of the agriculture sector has been discontinuity and policy shifts under the influence of donors but in the absence of adequate homework and indigenous evaluation, resulting in lot of wastage and squandering of valuable institutional experience. This has inter alia also resulted in deteriorating quality and lack of coordination among institutions that plan and analyze policy. With the devolution of agriculture to the provinces it is high time to develop the capacity in provincial government institutions to monitor, analyze, and evaluate the emerging challenges and examine various policy options.
It would also be in the fitness of things to organize provincial research institutions in accordance with provincial resource endowments and their comparative advantages rather than following a uniform model in all the provinces. It is understood that the research system is being evaluated. It would be useful to avail this opportunity not only to examine past performance and achievements but also to provide future goals and guidelines to achieve more. One of the major challenges in this area has been the failure of the system to attract and retain qualified scientists, leading to a thin spreading of available resources and their inefficient use. The system has also suffered from bureaucratic/political interferences and delays in recruiting leadership for the research and policy-planning organizations.
The system of collecting crop statistics on production and marketing aspects does not inspire much confidence, nor does it attract good professionals; it is therefore in need of a major overhaul. Without the availability of authentic statistics, use of sophisticated analytical techniques and tools is not of much help in policy analysis and planning. The provincial governments would be well advised to strengthen their crop reporting and market intelligence systems. There are large losses, quantitative as well as qualitative, in the marketing system. Some of these losses can be saved or avoided through improving the marketing infrastructure, including expanding and improving storage facilities, and timely dissemination of market information to producers.

24
WORKING PAPER | September 2011
CONCLUSIONS Pakistan has a long and varied history of intervening in farm input and output markets. In the wake of economic reforms launched during the 1980s, it has withdrawn from most of the commodity markets except wheat. In other commodity mar-kets, intervention is by and large notional and without much practical involvement. As discussed under output pricing, the government announces the support price of wheat, protecting it by purchasing a large quantity of the produce. The govern-ment has also opened the wheat trade to the private sector. Though policy pronouncements emphasize the free movement of wheat, there have been times when the government has restricted its movement through various administrative measures. The same has not been the case for rice (paddy), for which indicative prices in the recent past were announced but no efforts made to protect them. Maize marketing has not experienced any such intervention. The rolling back of the public sector from markets has certainly saved public funds, but the savings have come at a cost. Some of the cost, in terms of higher prices and variability stemming from the uncertain economic environment and supply, is borne by consumers, and some, in terms of lower producer prices at harvest, is borne by farmers, especially small and medium farmers, whose farms account for more than 50 percent of the area under cereals.
The marketing of farm inputs and outputs has become a major problem for farmers. Farm input supplies are irregular, characterized by shortages and high prices at critical times. Farmers face uncertain and low producer prices at the harvest stage; prices rise after they have sold their produce. The processors and other market players are well organized, have associations to coordinate them, and enjoy political and economic clout to influence the market. Farmers, unorganized as they are, also lack the physical facilities and economic capacity to store their produce if they do not find market prices to be right. Markets in general and commodity markets in particular must not be left to the dictates of powerful groups and proces-sors. There ought to be some effective mechanism to oversee and regulate the behavior of these powerful groups if the invisible hand of the market force is to be relied on.
The devolution of agriculture, food, livestock, and related disciplines to the provinces under the 18th amendment to the constitution, and the subsequent establishment of the federal-level Ministry of Food Security and Research with its National Food Security and Research Division, have provided an excellent opportunity to re-examine the functions to be retained at the ministerial, secretariat, and government levels, and to engage universities and provincial research institutes in issues of importance for economic analysis, research, and policy planning. There is also a need to revisit the allocation of the func-tions and organizations placed under the administrative control of the Ministry of Food Security and Research to prioritize and strengthen agricultural research at the provincial levels in accordance with the provinces’ respective resource endow-ments and comparative advantage. The role of the Pakistan Agricultural Research Council also needs to be redefined in the changed circumstances. In the wake of globalization, emerging challenges to food security and agricultural development are more complex and demanding. To transform these challenges into opportunities and address emerging issues, it is impera-tive to develop and strengthen the institutional capacity for technical and economic analyses at the federal and provincial levels.

25
WORKING PAPER | September 2011
APPENDIX: SUPPLEMENTARY TABLES Table A.1—Area, production, and yield of wheat, rice, and maize in Pakistan, 1996–2010
Year Wheat Rice Maize
Area Production Yield Area Production Yield Area Production Yield ’000 ha ’000 tons kg/ha ’000 ha ’000 tons kg/ha ’000 ha ’000 tons kg/ha
1995/96 8,377 16,907 2,018 2,162 3,967 1,835 939 1,504 1,602 1996/97 8,109 16,651 2,053 2,251 4,305 1,912 928 1,491 1,607 1997/98 8,355 18,694 2,238 2,317 4,333 1,870 933 1,517 1,627 1998/99 8,230 17,858 2,170 2,424 4,674 1,928 962 1,665 1,730 1999/2000 8,463 21,079 2,491 2,515 5,156 2,050 962 1,652 1,718 2000/01 8,181 19,024 2,325 2,377 4,803 2,021 944 1,643 1,741 2001/02 8,058 18,227 2,262 2,114 3,882 1,836 942 1,664 1,768 2002/03 8,034 19,183 2,388 2,225 4,479 2,013 936 1,737 1,857 2003/04 8,216 19,500 2,373 2,461 4,848 1,970 947 1,897 2,003 2004/05 8,358 21,612 2,586 2,520 5,025 1,994 973 2,797 2,875 2005/06 8,448 21,283 3,691 2,621 5,547 2,116 1,042 3,110 2,984 2006/07 8,578 23,295 2,716 2,581 5,438 2,107 1,017 3,088 3,037 2007/08 8,550 20,959 2,451 2,515 5,563 2,212 1,052 3,605 3,427 2008/09 9,046 24,033 2,657 2,963 6,952 2,347 1,052 3,593 3,415 2009/10 9,132 23,311 2,553 2,883 6,883 2,387 935 3,262 3,488
Sources: GOP 2006a; Pakistan, MINFA 2011.
Table A.2—Seed requirements and distribution of improved seed for wheat, rice (paddy), and maize in Pakistan
Year Total seed requirements Distribution of improved seed Distributed seed as % of require-
ments Wheat Paddy Maize Wheat Paddy Maize Wheat Paddy Maize
(metric tons) (percent) 1995/96 1,005,180 30,265 18,774 78,929 1,848 1,854 8 6 10 1996/97 973,092 31,515 18,554 73,618 1,378 1,961 8 4 11 1997/98 1,002,552 32,442 18,652 78,544 2,047 1,498 8 6 8 1998/99 987,588 33,930 19,244 104,213 2,281 3,028 11 7 16 1999/2000 1,015,560 35,216 19,234 106,379 3,845 2,564 10 11 13 2000/01 981,708 33,272 18,882 159,220 2,106 2,119 16 6 11 2001/02 966,900 29,599 18,832 134,954 3,541 2,636 14 12 14 2002/03 964,068 31,153 18,710 120,610 4,678 4,040 13 15 22 2003/04 985,944 34,448 18,942 135,499 7,547 5,321 14 22 28 2004/05 1,002,960 35,274 19,456 173,557 9,840 8,867 17 28 46 2005/06 1,013,748 36,700 20,840 166,627 12,157 9,063 16 33 43 2006/07 1,029,384 36,137 20,338 203,837 10,727 8,647 20 30 43 2007/08 1,025,976 35,216 21,034 188,879 11,474 9,951 18 33 47 2008/09 1,085,520 41,476 21,042 196,029 22,688 12,380 18 55 59 2009/10 1,095,792 40,363 18,702 284,344 16,014 9,771 26 40 52
Sources: Distributed seed adapted from Hussain 2011. Notes: Seed requirements for wheat and maize estimated at 120 and 20 kg/ha, respectively. For rice paddy seed requirements for raising nursery stock from fine basmati paddy and coarse varieties, reported at 7 and 20 kg/ha respectively, their weighted average works out to 14 kg; total paddy seed requirements estimated accordingly.

26
WORKING PAPER | September 2011
Table A.3—Average sales prices of certified seeds, 2001–10
Year Wheat Rice (paddy) Maize
Fine Coarse OPV Hybrids (Rs./kg)
2000/01 11.65 19.17 11.50 10.50 2001/02 11.80 20.75 13.00 12.75 2002/03 12.00 23.33 13.50 14.50 2003/04 12.50 24.38 14.50 11.60 2004/05 15.00 25.63 16.25 14.00 2005/06 16.37 25.25 17.00 16.80 150.00 2006/07 17.50 30.00 20.00 18.00 175.00 2007/08 18.50 62.50 25.00 21.00 220.00 2008/09 29.20 59.00 34.00 25.00 250–455 2009/10 38.50 52.50 32.50 28.00 250.00
Source: Data from Punjab Seed Corporation, cited in Hussain 2011. Note: OPV = open-pollinated varieties, Rs. = Pakistan rupees.
Table A.4—Domestic production and imports of fertilizers
Year Domestic production Imports
Total imports N P2O5 K2O Total N P2O5 K2O ’000 nutrient tons
1995/96 1,693.40 96.10 - 1,789.50 297.90 397.20 39.00 734.10 1996/97 1,681.50 80.70 - 1,762.20 472.90 381.00 24.30 878.10 1997/98 1,660.50 67.50 - 1,728.00 296.20 431.10 11.10 738.40 1998/99 1,795.20 90.70 - 1,885.90 424.40 430.30 5.00 859.70 1999/2000 2,039.60 223.50 - 2,263.20 233.00 416.10 13.80 662.80 2000/01 2,053.80 243.80 0.40 2,298.10 194.00 368.60 16.50 579.10 2001/02 2,113.90 142.70 8.90 2,285.50 178.50 429.50 17.70 625.70 2002/03 2,192.40 111.10 11.50 2,315.00 215.70 542.40 7.90 766.10 2003/04 2,272.50 253.90 12.90 2,539.30 204.20 553.50 6.40 764.10 2004/05 2,373.10 324.80 20.10 2,717.90 309.70 458.10 16.90 784.70 2005/06 2,476.00 341.40 14.70 2,832.20 603.40 639.80 25.10 1,268.30 2006/07 2,426.70 307.90 11.90 2,746.50 307.60 476.20 12.10 796.00 2007/08 2,513.00 293.60 15.50 2,822.00 286.60 565.80 23.90 876.30 2008/09 2,531.90 364.40 10.30 2,906.60 456.60 111.50 0.04 568.20 2009/10 2,668.70 403.30 10.40 3,082.40 900.90 522.40 20.90 1,444.10
Sources: NFDC 2008, 2011. Notes:Imports data relate to that as dispatched from the port and may not tally with imports on arrival. N = nitrogen, P2O5 = phosphorus pentoxide, K2O = potassium oxide.
Table A.5—Off take of fertilizer nutrients by crop
Year Wheat Rice Maize (’000 nutrient tons)
1995/96 1,182.00 251.50 100.60 1996/97 1,076.00 253.00 104.00 1997/98 1,186.00 279.00 114.00 1998/99 1,171.65 138.97 57.87 1999/2000 1,285.05 152.42 63.47 2000/01 1,344.02 159.41 66.37 2001/02 1,328.59 157.58 65.61 2002/03 1,369.87 162.48 67.65 2003/04 1,461.50 173.34 72.17 2004/05 1,847.00 221.64 55.41 2005/06 1,902.10 228.25 57.06 2006/07 1,835.80 220.29 55.07 2007/08 1,790.50 214.86 53.72 2008/09 1,855.50 222.70 55.70 2009/10 2,180.00 261.60 65.40
Sources: Based on NFDC 2000, 2005. Notes: Assumed for 1996/97 and 1997/98, wheat = 44.6%, rice = 10.5%, maize = 4.3%. Assumed for 1998/99 to 2003/04, wheat = 45.36%, others = 13.31% (based on NFDC 2000). Assumed for 2004/05 and onward, wheat = 50.0%, maize = 1.5%, rice = 6.0%;
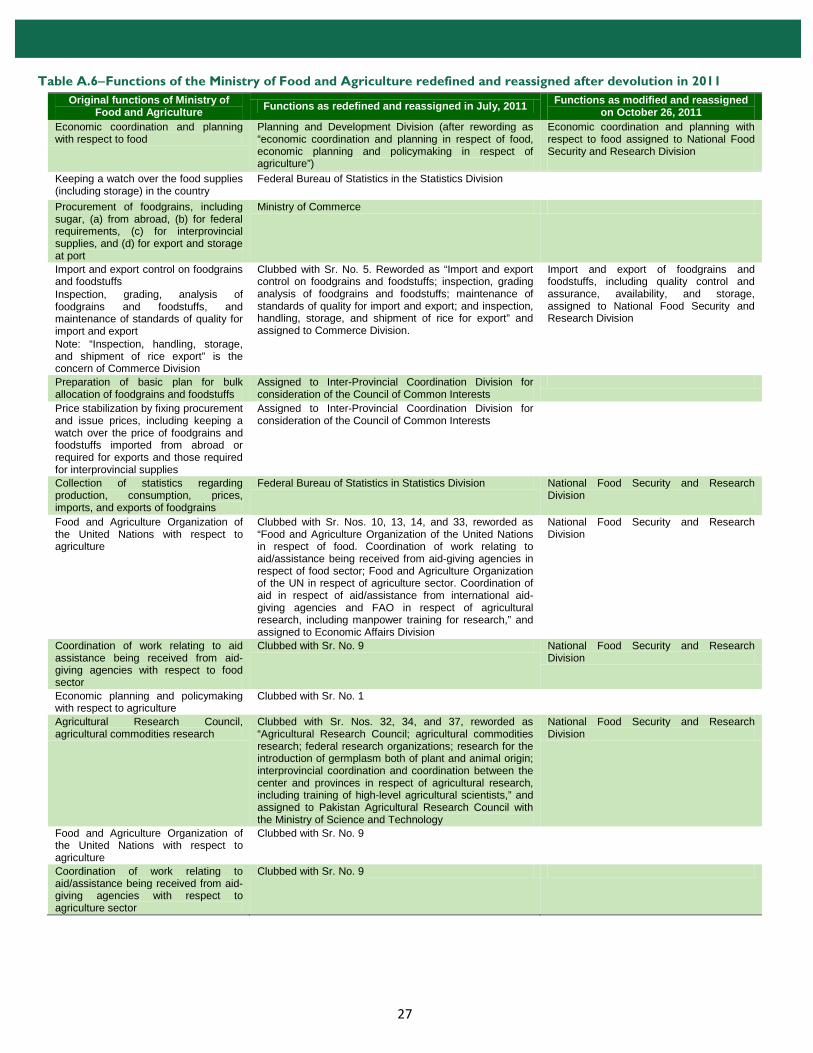
27
WORKING PAPER | September 2011
Table A.6−Functions of the Ministry of Food and Agriculture redefined and reassigned after devolution in 2011 Original functions of Ministry of
Food and Agriculture Functions as redefined and reassigned in July, 2011 Functions as modified and reassigned on October 26, 2011
Economic coordination and planning with respect to food
Planning and Development Division (after rewording as “economic coordination and planning in respect of food, economic planning and policymaking in respect of agriculture”)
Economic coordination and planning with respect to food assigned to National Food Security and Research Division
Keeping a watch over the food supplies (including storage) in the country
Federal Bureau of Statistics in the Statistics Division
Procurement of foodgrains, including sugar, (a) from abroad, (b) for federal requirements, (c) for interprovincial supplies, and (d) for export and storage at port
Ministry of Commerce
Import and export control on foodgrains and foodstuffs Inspection, grading, analysis of foodgrains and foodstuffs, and maintenance of standards of quality for import and export Note: “Inspection, handling, storage, and shipment of rice export” is the concern of Commerce Division
Clubbed with Sr. No. 5. Reworded as “Import and export control on foodgrains and foodstuffs; inspection, grading analysis of foodgrains and foodstuffs; maintenance of standards of quality for import and export; and inspection, handling, storage, and shipment of rice for export” and assigned to Commerce Division.
Import and export of foodgrains and foodstuffs, including quality control and assurance, availability, and storage, assigned to National Food Security and Research Division
Preparation of basic plan for bulk allocation of foodgrains and foodstuffs
Assigned to Inter-Provincial Coordination Division for consideration of the Council of Common Interests
Price stabilization by fixing procurement and issue prices, including keeping a watch over the price of foodgrains and foodstuffs imported from abroad or required for exports and those required for interprovincial supplies
Assigned to Inter-Provincial Coordination Division for consideration of the Council of Common Interests
Collection of statistics regarding production, consumption, prices, imports, and exports of foodgrains
Federal Bureau of Statistics in Statistics Division National Food Security and Research Division
Food and Agriculture Organization of the United Nations with respect to agriculture
Clubbed with Sr. Nos. 10, 13, 14, and 33, reworded as “Food and Agriculture Organization of the United Nations in respect of food. Coordination of work relating to aid/assistance being received from aid-giving agencies in respect of food sector; Food and Agriculture Organization of the UN in respect of agriculture sector. Coordination of aid in respect of aid/assistance from international aid-giving agencies and FAO in respect of agricultural research, including manpower training for research,” and assigned to Economic Affairs Division
National Food Security and Research Division
Coordination of work relating to aid assistance being received from aid-giving agencies with respect to food sector
Clubbed with Sr. No. 9 National Food Security and Research Division
Economic planning and policymaking with respect to agriculture
Clubbed with Sr. No. 1
Agricultural Research Council, agricultural commodities research
Clubbed with Sr. Nos. 32, 34, and 37, reworded as “Agricultural Research Council; agricultural commodities research; federal research organizations; research for the introduction of germplasm both of plant and animal origin; interprovincial coordination and coordination between the center and provinces in respect of agricultural research, including training of high-level agricultural scientists,” and assigned to Pakistan Agricultural Research Council with the Ministry of Science and Technology
National Food Security and Research Division
Food and Agriculture Organization of the United Nations with respect to agriculture
Clubbed with Sr. No. 9
Coordination of work relating to aid/assistance being received from aid-giving agencies with respect to agriculture sector
Clubbed with Sr. No. 9

28
WORKING PAPER | September 2011
Table A.6—Continued Original functions of Ministry of
Food and Agriculture Functions as redefined and reassigned in July,
2011 Functions as modified and reassigned on October
26, 2011 Plant protection: Standardization and import of pesticides, aerial spray, plant quarantine, and locust control in its international aspect and maintenance of locust warning organizations
Assigned to Ministry of Commerce National Food Security and Research Division
Economic studies for framing agricultural policy Farm management research for project planning, formulating, and evaluation
Devolved Devolved
Seed testing and seed certification Assigned to Ministry of Science and Technology National Food Security and Research Division Crops forecast and estimation, crop insurance
Devolved
Collection and compilation of agricultural statistics
Assigned to Federal Bureau of Statistics
Marketing Intelligence Devolved
Grading of agricultural commodities other than foodgrains for exports
Assigned to Ministry of Commerce
Agricultural commodity research (marketing research and laboratory research for laying down national grades)
Devolved
Soil survey, comprehensive inventory of the soil resources of the country and their proper utilization
Devolved
Standardization and import of fertilizers for meeting provincial requirements
Assigned to Ministry of Commerce
National Food Security and Research Division
Introduction of special crops like jute, tea, olives, and so on Standardization of agricultural machinery Underdeveloped areas: (a) identification of underdeveloped areas, (b) identification of fields in which an area is underdeveloped, (c) measures necessary to remove the causes of underdevelopment in different areas Economic planning and coordination with respect to cooperatives
Devolved Devolved Devolved Devolved
Administrative control of Pakistan Agricultural Storage and Services Corporation
Assigned to the Ministry of Commerce National Food Security and Research Division
Sugar Board Deleted Socioeconomic studies for framing agricultural research policies
Deleted
Agricultural commodities research, federal agricultural research organizations
Clubbed with Sr. No. 12
Coordination of aid/assistance from international aid-giving agencies and FAO with respect to agricultural research, including manpower training for research
Clubbed with Sr. No. 9 National Food Security and Research Division
Research for the introduction of improved germplasm of plant origin
Clubbed with Sr. No. 12 National Food Security and Research Division
Collection of statistics on agricultural research
Assigned to the Federal Bureau of Statistics
High-level manpower training for agricultural research
Clubbed with Sr. No. 12 National Food Security and Research Division

29
WORKING PAPER | September 2011
Table A.6—Continued Original functions of Ministry of
Food and Agriculture Functions as redefined and reassigned in July,
2011 Functions as modified and reassigned on October
26, 2011 Interprovincial coordination, and coordination between the center and the provinces, with respect to agricultural research, including training of high-level agriculture scientists
Clubbed with Sr. No. 12
Administrative control of Pakistan Central Cotton Committee with participation and inputs of Textile Industry Division
Assigned to Ministry of Textile Industry
Sources: Pakistan, Division of Cabinet 2011a, 2011b; Pakistan, Division of Planning and Development 2011.

30
WORKING PAPER | September 2011
WORKING PAPER | September 2011
REFERENCES Ahmad, B. 1975. “The Economics of Tractor Mechanization in the Pakistan Punjab.” Food Research Institute Studies 14 (1):
47–64.
Ali, M. 2011. “Knowledge- and Technology-Based Agriculture.” Power point presentation at “Policy Dialogue” organized at Forman Christian University, Lahore , March 2011.
APCOM (Agricultural Prices Commission). 1984. Agricultural Prices Commission: Role and Functions. Islamabad, Pakistan.
________. 2005. Support Price Policy for Wheat 2005-06 Crop. APCOM series No. 216. Islamabad, Pakistan.
API (Agriculture Policy Institute). 2011. “Statistical Appendix.” Pakistan Journal of Agricultural Economics. Vol 7.( May 2011), 123-143.
Ashfaq, M., G. Griffith, and I. Hussain. 2009. Economics of Water Resources in Pakistan. Pakistan: Pak TM.
Beintema, N. M., and G-J. Stads. 2008. Agricultural R&D Capacity and Investments in the Asia-Pacific Region. IFPRI Research Brief 11. Washington, DC: International Food Policy Research Institute.
Beintema, N. M., W. Malik, M. Sharif, G-J. Stads, and U. Mustafa. 2007. Agricultural Research and Development in Pakistan: Policy, Investments, and Institutional Profile. ASTI Country Report. Washington, DC; Islamabad, Pakistan: International Food Policy Research Institute; Pakistan Agricultural Research Council.
Binswanger, H. 1978. The Economics of Tractors in South Asia. New York: Agricultural Development Council.
Cornelisse, P. A., and S. N. H. Naqvi. 1987. The Wheat Marketing Activity in Pakistan. Islamabad, Pakistan; Rotterdam, Netherlands: Pakistan Institute of Development Economics; Centre for Development Planning, Erasmus University.
Dorosh, P. A., and A. Salam. 2006. Wheat Markets and Price Stabilization in Pakistan: An Analysis of Policy Options. PIDE Working Papers 2006:5. Islamabad, Pakistan: Pakistan Institute of Development Economics.
________. 2009. “Pakistan.” In Distortions to Agricultural Incentives in Asia, edited by K. Anderson and W. Martin, 379–408. Washington, DC: World Bank.
Dorosh, P. A., and A. Valdes. 1990. Effects of Exchange Rate and Trade Policies on Agriculture in Pakistan. Research Report 84. Washington, DC: International Food Policy Research Institute.
Evenson, R. E., and E. A. Bloom. 1993. “Research and Productivity in Pakistan Agriculture.” In Agricultural Strategies in the 1990s: Issues and Policies, edited by A. S. Haider, Z. Hussain, R. McConnen, and S. J. Malik, 152–182. Islamabad, Pa-kistan: Pakistan Association of Agricultural Social Scientists.
Evenson, R. E., and Y. Kislev. 1973. “Research and Productivity in Wheat and Maize.” Journal of Political Economy 81:1309–1329.
Hamid, N., I. Nabi, and A. Nasim. 1990. Trade, Exchange Rate and Agricultural Pricing Policies in Pakistan. Washington, DC: World Bank.
Hussain, A. 2011. “Seed Industry in Pakistan.” Presentation at World Bank Roundtable Discussion on Agriculture and Water, Islamabad, Pakistan, March 10–11.
John Mellor Associates and Asianics. 1994. Institutional Reforms to Accelerate Irrigated Agriculture. Islamabad, Pakistan.
Khan, M. J. 2011. “Agricultural Growth and Productivity Enhancement.” Presentation at World Bank Roundtable Discussion on Agriculture and Water, Islamabad, Pakistan, March 10–11.
Malik, S. J., M. Mushtaq, and M. A. Gill. 1989. “Differential Access and the Rural Credit Market in Pakistan: Some Recent Evidence.” The Pakistan Development Review 28 (4): 43–56.
McInerney, J. P., and G. F. Donaldson. 1975. The Consequences of Farm Tractors in Pakistan. World Bank Staff Working Paper 210. Washington, DC: World Bank.
NFDC (National Fertilizer Development Centre). 2000. Fertilizer Use Survey 1998/99. Islamabad, Pakistan.
________. 2005. Fertilizer Use Survey. NFDC publication no. 2/2005. Islamabad, Pakistan.

31
WORKING PAPER | September 2011
WORKING PAPER | September 2011
________. 2008. Pakistan Fertilizer Related Statistics. NFDC publication no. 1/2008. Islamabad, Pakistan.
________. 2011. Fertilizer Development Review 2009–10. NFDC publication no. 1/2011. Islamabad, Pakistan.
NFDC and FAO (Food and Agriculture Organization of the United Nations). 2006. The Impact of Deregulation on the Fertiliz-er Sector and Crop Productivity in Pakistan. Islamabad, Pakistan.
Niaz, M. S. 1995. Pricing of Farm Produce in Pakistan: Objective, Practices and Experience. Islamabad, Pakistan: Print Associates International.
Pakistan, Agricultural Census Organization. 2003. Pakistan Agricultural Census 2000. Lahore, Pakistan.
________. 2005. Pakistan Agricultural Machinery Census 2004. Lahore, Pakistan.
Pakistan, Cabinet Division . 2011a. Notification No. 4-9/2011—Min I, June 29.
________. 2011b. Notification No. 4-14/2011—Min I, October 26.
Pakistan, Planning and Development Division. 2011. Notification No. 1 (197) Admin. VIII/PD/2010, July 1.
Pakistan, MINFA (Ministry of Food and Agriculture). 1988. Report of the National Commission on Agriculture. Islamabad, Pakistan.
________. 2004. Agricultural Statistics of Pakistan 2002–03. Islamabad, Pakistan.
________. 2008. Agricultural Statistics of Pakistan 2007–08. Islamabad, Pakistan.
________. 2011. Agricultural Statistics of Pakistan 2009–10. Islamabad, Pakistan.
Pakistan, MOF (Ministry of Finance). 1999. Pakistan Economic Survey (Statistical Supplement) 1998-99. Islamabad, Pakistan.
Pakistan, MOF (Ministry of Finance). 2002. Pakistan Economic Survey (Statistical Supplement) 2001–02. Islamabad, Pakistan.
________. 2010a. Pakistan Economic Survey 2009–10. Islamabad, Pakistan.
________. 2010b. Pakistan Economic Survey (Statistical Supplement) 2009–10. Islamabad, Pakistan.
________. 2011. Pakistan Economic Survey 2010–11. Islamabad, Pakistan.
Pakistan, PC (Planning Commission). 2009. Final Report of the Working Group on Agricultural Inputs and Support Services: 10th Five-Year People’s Plan 2010–15. Islamabad, Pakistan.
Parthasarthy, G. 1977. “Employment, Wages and Poverty of Hired Labor within Indian Agriculture: Evidence on Selected Issues from Micro Surveys in West Godavari District, Andhra Pradesh, India.” In Hired Labor in Rural Asia, edited by A. K. Kenkyūjo and S. Hirashima, Tokyo: Institute of Developing Economies.
Salam, A. 1981. “Farm Tractorization, Fertilizer Use and Productivity of Mexican Wheat in Pakistan.” The Pakistan Develop-ment Review 20 (3): 323–345.
________. 1986. “Farm Labour Use and its Determinants.” The Pakistan Economic and Social Review 24 (1): 1–21.
________. 2001. Support Price Policy in Pakistan: Rationale, Practice and Future Options. Islamabad, Pakistan: Agricultural Prices Commission.
________. 2008. “Current Food Security Situation: Challenges and Opportunities.” In Socio-Economic Challenges Faced by Pakistan, edited by M. Irfan and H. M. Yasin, 147-164. Islamabad, Pakistan: International Institute of Islamic Economics, International Islamic University.
________. 2009a. “Distortions in Incentives to Production of Major Crops in Pakistan: 1991–2008.” The Journal of Interna-tional Agricultural Trade and Development 5 (2): 185–207.
________. 2009b. “Nominal and Real Prices of Principal Food and Cash Crops in Pakistan: 1991–2008.” Nust Journal of Business and Economics 2 (1): 24–30.

WORKING PAPER | September 2011
WORKING PAPER | September 2011
INTERNATIONAL FOOD POLICY RESEARCH INSTITUTE
2033 K Street, NW | Washington, DC 20006-1002 USA | T+1.202.862.5600 | F+1.202.457.4439 | Skype: ifprihomeoffice | [email protected]
This Working Paper has been prepared as an output for the Pakistan Strategy Support Program, funded by USAID, and has not been peer reviewed. Any opinions stated herein are those of the author(s) and do not necessarily reflect the policies or opinions of IFPRI.
Copyright © 2012, International Food Policy Research Institute. All rights reserved. To obtain permission to republish, contact [email protected].
Salam, A., and M. M. Mukhtar. 2008. “The Public Intervention in Pakistan’s Wheat Market: The Story of Two Agencies.” In From Parastatals to Private Trade: Lessons from Asian Agriculture, edited by S. Rashid, A. Gulati, and R. Cummings, 77-102 Baltimore: Johns Hopkins University Press.
Salam, A., S. Ghayyur, and M. A. Hussain. 1980. “Farm Tractorization, Use of Modern Inputs and Agricultural Productivity.” The Muslim Scientist 9 (1&2): 1–16.
Zuberi, H. A. 1989. “Production Function, Institutional Credit and Agricultural Development in Pakistan.” The Pakistan Development Review 28 (1): 43–56.
About the Authors
Abdul Salam is a Professor of Economics, School of Economic Sciences at the Federal Urdu University of Arts, Science and Technology ([email protected])