Embed Size (px)
Citation preview

© 2012 HORIBA, Ltd. All rights reserved.
Mark [email protected]
www.horiba.com/particle
Review:ISO 13099 Colloidal systems —
Methods for zeta potentialdetermination

© 2012 HORIBA, Ltd. All rights reserved.
New ISO Standards
www.iso.org

© 2012 HORIBA, Ltd. All rights reserved.
Outline
ISO standardsZeta potential backgroundCellsOperational and dilution proceduresReference materialsSystem verification

© 2012 HORIBA, Ltd. All rights reserved.
ISO TC 24/SC 4 Published StandardsTC 24/SC 4 - Particle characterization32 standards published so far
ISO 9276:1998 Representation of results of particle size analysisPart 1: Graphical representationPart 2: Calculation of average particle sizes/diameters and moments from particle size distributionsPart 3: Adjustment of an experimental curve to a reference modelPart 4: Characterization of a classification processPart 5: Methods of calculation relating to particle size analyses using logarithmic normal
probability distributionPart 6: Descriptive and quantitative representation of particle shape and morphology
ISO 9277:2010 Determination of the specific surface area of solids by gas adsorption-- BET method
ISO 13099-1:2012 Colloidal systems -- Methods for zeta-potential determination Part 1: Electroacoustic and electrokinetic phenomenaPart 2: Optical methods

© 2012 HORIBA, Ltd. All rights reserved.
ISO TC 24/SC 4 Published StandardsISO 13317-1:2001: Determination of particle size distribution by gravitational liquid sedimentation methodsPart 1: General principles and guidelinesPart 2: Fixed pipette methodPart 3: X-ray gravitational technique
ISO 13318-1:2001: Determination of particle size distribution by centrifugal liquid Sedimentation methodsPart 1: General principles and guidelinesPart 2: Photocentrifuge methodPart 3: Centrifugal X-ray method
ISO 13319:2007 Determination of particle size distributions -- Electrical sensing zone method
ISO 13320:2009 Particle size analysis -- Laser diffraction methods
ISO 13321:1996 Particle size analysis -- Photon correlation spectroscopy
ISO 13322-1:2004Particle size analysis -- Image analysis methodsPart 1: Static image analysis methodsPart 2: Dynamic image analysis methods

© 2012 HORIBA, Ltd. All rights reserved.
ISO TC 24/SC 4 Published StandardsISO 14488:2007 Particulate materials -- Sampling and sample splitting for the determination of particulate properties
ISO 14887:2000 Sample preparation -- Dispersing procedures for powders in liquids
ISO 15900:2009 Determination of particle size distribution -- Differential electrical mobility analysis for aerosol particles
ISO 15901-1:2005 Pore size distribution and porosity of solid materials by mercury porosimetry and gas adsorptionPart 1: Mercury porosimetryPart 2: Analysis of mesopores and macropores by gas adsorptionPart 3: Analysis of micropores by gas adsorption
ISO 20998-1:2006 Measurement and characterization of particles by acoustic methodsPart 1: Concepts and procedures in ultrasonic attenuation spectroscopy

© 2012 HORIBA, Ltd. All rights reserved.
ISO 21501-1:2009 Determination of particle size distribution Single particle light interaction methodsPart 1: Light scattering aerosol spectrometerPart 2: Light scattering liquid-borne particle counterPart 3: Light extinction liquid-borne particle counterPart 4: Light scattering airborne particle counter for clean spaces
ISO 22412:2008 Particle size analysis -- Dynamic light scattering (DLS)
ISO TC 24/SC 4 Published Standards

© 2012 HORIBA, Ltd. All rights reserved.
Why Colloidal Systems?
Zeta potential often used in colloidal stability studies
Want stable dispersion Suspensions sediment
& flocculate Emulsions phase
separate, creaming or coalescence
good
bad
good
bad

© 2012 HORIBA, Ltd. All rights reserved.
Stabilization Steric stabilization: coat
surface with polymers Particles can’t touch so
they don’t interact
Electrostatic stabilization: alter surface chemistry to put charge on particle surface
Repel like magnets

© 2012 HORIBA, Ltd. All rights reserved.
Zeta Potential If surface has -
charge, then + ions attracted to surface
- ions attracted to + ions, builds electric double layer
Slipping plane: distance from particle surface where ions move with particle
ZP = potential (mV) at slipping plane

© 2012 HORIBA, Ltd. All rights reserved.
Zeta Potential Predicts Stability
Different guidelines
+30 mV
0 mV
-30 mV
stable
stable
not stable
positive zp
negative zp
Sample Dependency
Oil/water emulsions > 10 mV Polymer latices > 15 mV Oxides > 30 mV Metal sols > 40 mV

© 2012 HORIBA, Ltd. All rights reserved.
Zeta Potential: Emulsion Isoelectric Point (IEP)
Isoelectric point:pH where zetapotential = 0
Automate IEPstudies withauto titrator

© 2012 HORIBA, Ltd. All rights reserved.
Emulsion IEP Study: Stability

© 2012 HORIBA, Ltd. All rights reserved.
Zeta Potential: Measurement
OpticalMicroscope
Electrophoretic light scattering– (ELS)
Acoustic

© 2012 HORIBA, Ltd. All rights reserved.
Zeta Potential: ELS Measurement
Apply electric fieldMeasure particle
motionDirection tells + or – + particles move to – - particles move to +
Speed tells amplitudeGet speed from
frequency shift from motion of particles
distance
-measurement zone
* Figure 1, part 2
*

© 2012 HORIBA, Ltd. All rights reserved.
Optical Configuration
Figure 3 from 13099-2* SZ-100 optics
Reference beam Heterodyne @ 17°
* Figure 3, part 2

© 2012 HORIBA, Ltd. All rights reserved.
Zeta Potential MeasurementMobility*
- +
ν0 ν0+νd
U
Zeta potential*
Particle motion causes Doppler shiftFrequency mobilityMobility zeta potential
µ electrophoretic mobility Doppler frequency shift0 laser wavelengthn medium refractive index E electric field strength angle between incident & scattered light zeta potential dielectric permitivityo medium viscosityfa) ratio of the particle radius to the EDL* Equations 1 and 2, part 2, section 6.6

© 2012 HORIBA, Ltd. All rights reserved.
Thin vs. Thick Double Layer
Debye length = -1
Particle radius = aViscosity = Dielectric permitivity =

© 2012 HORIBA, Ltd. All rights reserved.
SZ-100 Software
Default is Smoluchowski
Selection for Huckel
Or enter manually for other model

© 2012 HORIBA, Ltd. All rights reserved.
Advanced Theories*
* Discussed in part 1, but graph from IUPAC technical report MEASUREMENT AND INTERPRETATION OF ELECTROKINETIC PHENOMENA Pure Appl. Chem., Vol. 77, No. 10, pp. 1753–1805, 2005

© 2012 HORIBA, Ltd. All rights reserved.
Measurement Details
First measure conductivity Then decide applied electric
fieldAuto or manually
Reverse electric field to avoid polarization & electroosmosis
To avoid electroosmotic effect near cell walls “Uzgiris” type cells avoid this
problem* Figure 6, part 2
*

© 2012 HORIBA, Ltd. All rights reserved.
Zeta Potential Cells
-10
-5
0
5
10
15
20
0 2 4 6 8 10 12 14
pH
zeta
pot
entia
l
Gold coated electrodes (ruined) Carbon coated electrodes
IEP 3.4 nm protein 800 measurements with one cell

© 2012 HORIBA, Ltd. All rights reserved.
Section 8 Operational Procedures
Instrument location Place the instrument in a clean environment on a surface without vibration
Dispersion liquids Ensure chemical compatibility between the medium and the cell
Measurement cell Clean cells that have been previously used, control the temperature
Sample inspection Look for sedimentation, if visible then the measurement is questionable
© 2012 HORIBA, Ltd. All rights reserved.
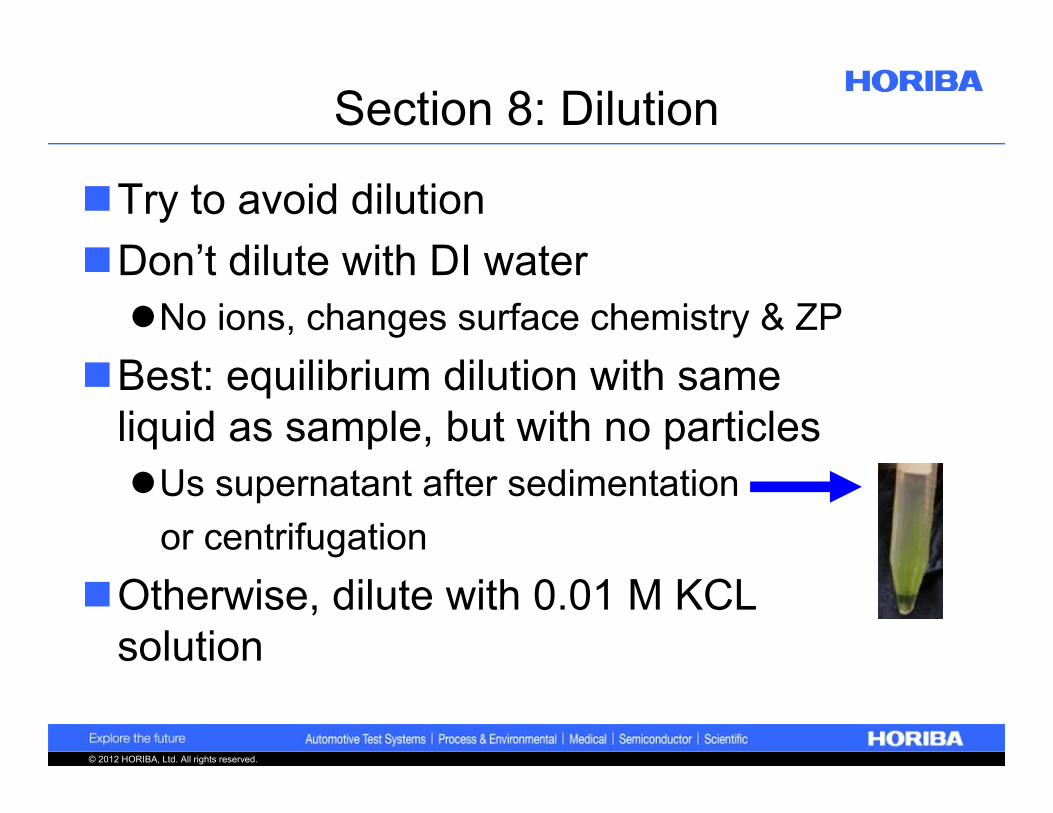
Section 8: Dilution
Try to avoid dilutionDon’t dilute with DI waterNo ions, changes surface chemistry & ZP
Best: equilibrium dilution with same liquid as sample, but with no particlesUs supernatant after sedimentation
or centrifugationOtherwise, dilute with 0.01 M KCL
solution

© 2012 HORIBA, Ltd. All rights reserved.
Section 8.2: Verification
8.2.1 reference Materials Be sufficiently homogeneous and stable for
the stated time and temperature range The accepted electrophoretic mobility value
was obtained by several operators and rigorously proven.
The material should be well documented in terms of sampling procedure, dilution, if required, and measurement protocol.

© 2012 HORIBA, Ltd. All rights reserved.
Section 8.2: Verification
8.2.2 Repeatability Prepare sample following provided procedureMeasure same portion three times Pass if mean value CV <10%Assuming 2 × 10⁻⁸ m2/V•s
Note: expect most customers to use zeta potential values

© 2012 HORIBA, Ltd. All rights reserved.
Section 8.2: Verification
8.2.3 Intermediate Precision Same procedure as 8.2.2 but using different
portions of sample Pass if Repeatability; CV <15%Assuming 2 × 10⁻⁸ m2/V•s
Doubt this is done often In pharmaceutical industry intermediate
precision implies multiple systems, multiple operators, different days

© 2012 HORIBA, Ltd. All rights reserved.
Section 8.2: Verification
8.2.4 Trueness (accuracy) Prepare, measure same portion 3 times Pass if mean value within 10% of published
electrophoretic mobility value, assuming > 2 ×10⁻⁸ m2/V•s.
Note: when calculating pass/fail criteria it is OK to include the uncertainty of the sample
Note: most customers use the zeta potential value, not the mobility

© 2012 HORIBA, Ltd. All rights reserved.
NIST SRM1980 on SZ-100Pass criteria:Mean within 10% of reference valueCOV<10%
Reference value 2.53 μm·cm/V·s ± 0.12 μm·cm/V·s
Upper limit:(2.53 + 0.12)*1.1 = 2.92
Lower limit:(2.53 – 0.12)* 0.9 = 2.17
Pass

© 2012 HORIBA, Ltd. All rights reserved.
Section 8.3: Sources of Error
Contamination from previous samplePoor sample preparation Inappropriate sample Inappropriate liquid mediumPoor temperature stabilizationCondensation on the illuminated
surfacesToo large a potential applied

© 2012 HORIBA, Ltd. All rights reserved.
Section 8.3: Sources of Error
Particles, fingerprints or scratches on the optical surfaces Incorrect entry of parameters by the
operatorAir bubblesCell coating damage Inappropriate theory for calculating
zeta-potential from the measured electrophoretic mobility

© 2012 HORIBA, Ltd. All rights reserved.
Summary ISO 13099 part 1 and 2 useful for chemists new
to zeta potential Some theoretical background Some operational advice Agreed upon pass/fail verificationBut most customers use zeta potential, not
electrophoretic mobility How we suggest you comply: use an SZ-100
from HORIBABest cells, lower cost of ownership

© 2012 HORIBA, Ltd. All rights reserved.
Resources: www.horiba.com/particle
View application notes,webinars, etc.
Receive news of updates