Embed Size (px)
Citation preview

1H and 13C highresolution NMRspectroscopy ofcarrageenans:application inresearch and
industry
F. van de Velde,*,y,{
S.H. Knutsen,x A.I. Usov,k
H.S. Rollemay and A.S. Cerezo{
yNIZO food research, Product TechnologyDepartment,POBox20,6710BAEde,TheNetherlands(Tel.:+31-318-659-582;fax:+31-318-650-400.;e-mail:
[email protected]){Wageningen Centre for Food Sciences, PO Box 557,
6700 AN Wageningen, The NetherlandsxMATFORSK, Norwegian Food Research Institute,
Osloveien 1, N-1430 As, NorwaykN.D.Zelinsky InstituteofOrganicChemistry,RussianAcademy of Sciences, Leniskii Prospect 47, Moscow
119991, Russia{Universidad de Buenos Aires, Facultad de Ciencias
Exactas y Naturales, Departamento de QuimicaOrganica, Pabellon 2, Ciudad Universitaria 1428,
Buenos Aires, Argentina
Carrageenans represent one of the major texturising ingre-dients in the food industry. They are natural ingredients,which are used for decades in food applications. Carrageenan
is a generic name for a family of linear, sulfated galactans,obtained by extraction from certain species of red seaweeds(Rhodophyta). Since natural carrageenans are mixtures ofdifferent sulfated polysaccharides, their composition differsfrom batch to batch. Therefore, the quantitative analysis ofcarrageenan batches is of greatest importance for bothingredient suppliers and food industries to deliver a con-stant consumer product and to develop new applicationsbased on their unique intrinsic properties. Nowadays NMRspectroscopy is one of the standard tools for the determi-nation of the chemical structure of carrageenan samples.This review gives an overview of NMR-spectroscopy (both1H- and 13C-NMR) as a powerful tool for the qualitative andquantitative analysis of carrageenan samples. In additionto tables containing chemical shift data for both 1H- and13C-spectra, details about sample preparation, selectivedegradation and fractionation techniques are included.# 2002 Elsevier Science Ltd. All rights reserved.
IntroductionCarrageenans represent one of the major texturising
ingredients in the food industry. They are naturalingredients, which are used for decades in food applica-tions and regaded as save (Van de Velde & De Ruiter,2002). Carrageenan is a generic name for a family ofpolysaccharides, obtained by extraction from certainspecies of red seaweeds (Rhodophyta). During the lastfew years, the total carrageenan market showed a growrate of 3% per year reaching an estimated worldwidesales of US$ 310 million in 2000. The dairy sectoraccounts for a large part of the carrageenan applicationsin food products, such as frozen desserts, chocolate milk,cottage cheese, and whipped cream. In addition to this,carrageenans are used in various non-dairy food products,such as instant products, jellies, pet foods, sauces, andnon-food products, such as pharmaceutical formula-tions, cosmetics and oil well drilling fluid (Imeson, 2000;Therkelsen, 1993; Van de Velde & De Ruiter, 2002). Ingeneral, carrageenan serves as a gelling, stabilising andviscosity-building agent.Since natural carrageenans are mixtures of different
sulfated polysaccharides, their composition differs frombatch to batch. Therefore, the quantitative analysisof carrageenan batches is of greatest importance forboth ingredient suppliers and food industries to delivera constant consumer product and to develop new
0924–2244/02/$ - see front matter # 2002 Elsevier Science Ltd. All rights reserved.PI I : S0924-2244 (02 )00066-3
Trends in Food Science & Technology 13 (2002) 73–92
Review
* Corresponding author at first address.
applications based on their unique intrinsic properties.Nowadays NMR spectroscopy (both 1H- and 13C-NMR) is one of the standard tools for the determina-tion of the chemical structure of carrageenan samples.The NMR spectroscopy of carrageenans is used inindustry and for research with different approachescorresponding to different ultimate goals or interests. Inthe first case this technique is seen as a screening tool todetermine the possible commercial or industrial value ofraw extracts obtained from still unexploited red sea-weeds and also used to control the quality of carragee-nan products and to study the influence of processingparameters, such as temperature and pH, on the struc-ture. A different approach is used when the interest iscentred in the system of carrageenans biosynthesised bythe seaweed or in the determination of the fine structureof a carrageenan or a carrageenan fraction. This reviewgives an overview of NMR-spectroscopy as a powerfultool for the analysis of carrageenan samples.
Structure of carrageenansCarrageenans are a family of water soluble, linear,
sulfated galactans. They are composed of alternating3-linked b-d-galactopyranose (G-units) and 4-linked a-
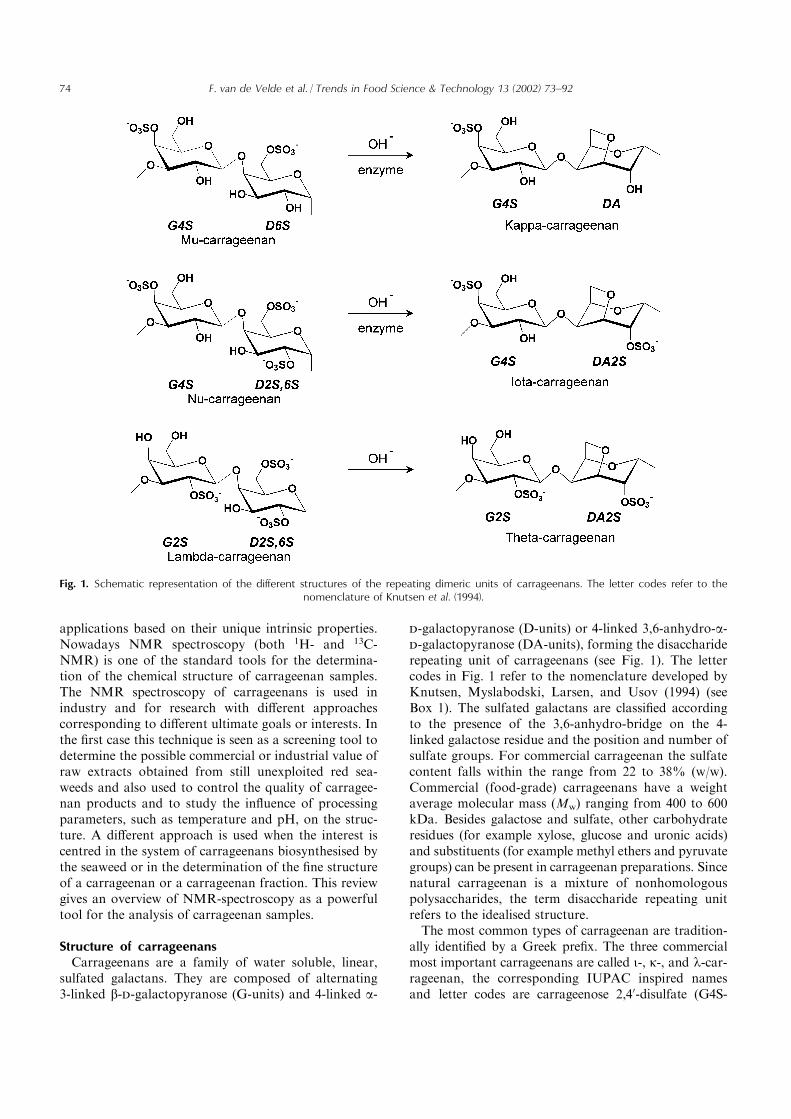
d-galactopyranose (D-units) or 4-linked 3,6-anhydro-a-d-galactopyranose (DA-units), forming the disacchariderepeating unit of carrageenans (see Fig. 1). The lettercodes in Fig. 1 refer to the nomenclature developed byKnutsen, Myslabodski, Larsen, and Usov (1994) (seeBox 1). The sulfated galactans are classified accordingto the presence of the 3,6-anhydro-bridge on the 4-linked galactose residue and the position and number ofsulfate groups. For commercial carrageenan the sulfatecontent falls within the range from 22 to 38% (w/w).Commercial (food-grade) carrageenans have a weightaverage molecular mass (Mw) ranging from 400 to 600kDa. Besides galactose and sulfate, other carbohydrateresidues (for example xylose, glucose and uronic acids)and substituents (for example methyl ethers and pyruvategroups) can be present in carrageenan preparations. Sincenatural carrageenan is a mixture of nonhomologouspolysaccharides, the term disaccharide repeating unitrefers to the idealised structure.The most common types of carrageenan are tradition-
ally identified by a Greek prefix. The three commercialmost important carrageenans are called i-, k-, and l-car-rageenan, the corresponding IUPAC inspired namesand letter codes are carrageenose 2,40-disulfate (G4S-
Fig. 1. Schematic representation of the different structures of the repeating dimeric units of carrageenans. The letter codes refer to thenomenclature of Knutsen et al. (1994).
74 F. van de Velde et al. / Trends in Food Science & Technology 13 (2002) 73–92

DA2S), carrageenose 40-sulfate (G4S-DA), and carragee-nan 2,6,20-trisulfate (G2S-D2S,6S). Besides these threemajor carrageenan types, two other types, called m- and n-carrageenan (letter code G4S-D2S,6S and G4S-D6S,respectively), are often encountered in commercial carra-geenan samples. m- And n-carrageenan are the biologicalprecursors of respectively k- and i-carrageenan. The dif-ferent types of carrageenan are obtained from differentspecies of the Rhodophyta. k-Carrageenan is pre-dominantly obtained by extraction of the tropical seaweedKappaphycus alvarezii, known in trade as Eucheumacottonii (or simply cottonii) (Rudolph, 2000). Eucheumadenticulatum (trade name Eucheuma spionosum or sim-ply spinosum) is the main species for the production ofi-carrageenan. For the production of the k- and i-car-rageenan, mixtures of plants of both sexual stages of sea-weeds of the above species are used. The seaweeds areusually extracted with alkali at elevated temperatures totransform the biological precursors, m- and n-carrageenaninto k- and i-carrageenans (see below). l-Carrageenan isobtained from different species from the Gigartina andChondrus genera. The sporophytic plants of these sea-weeds produce l-carrageenan (McCandlers, West, &
Guiry, 1982), whereas the gametophytic plants produce ak/i-hybrid type of carrageenan. These k/i-hybrid carra-geenans consist of a mixed chain containing both k- andi-units (Van de Velde, Peppelman, Rollema, & Tromp,2001) and range from almost pure i-carrageenan toalmost pure k-carrageenan (Bixler, 1996). The produc-tion of l-carrageenan implies the selection of samples inthe sporophyte stage while the extraction can be carriedout with hot water as the cyclization, in alkaline medium,to y-carrageenan is difficult (Ciancia, Noseda, Matule-wicz, & Cerezo, 1993) and this product has essentially thesame properties as l-carrageenan (Glicksman, 1983).k- And i-carrageenan are gel forming carrageenans,
whereas l-carrageenan is a thickener. The difference inrheological behaviour between i- and k-carrageenan onone side and l-carrageenan on the other side resultsfrom the fact that the DA-units of the gelling ones havethe 1C4-conformation and the D-units in l-carrageenando not. The 1C4-conformation of the 3,6-anhydro-d-galactopyranosyl units in i- and k-carrageenan allows ahelical secundary structure, which is essential for the gelforming properties. The natural precursors of i- andk-carrageenan, n- and m-carrageenan, are also non-
Box 1. Nomenclature of carrageenans
Traditionally carrageenans are identified by a Greek prefix, indicating the major component of the sample. This nomen-clature is used universally in trade, science, and legislation. However, this system is not suitable to describe more complexpolymers unambiguously. To describe more complex structures, Knutsen, Myslabodski, Larsen, and Usov (1994) proposed analternative nomenclature for carrageenan and agar. This letter code based nomenclature (see Table 1) is founded on theworldwide accepted IUPAC nomenclature (McNaught, 1997) and allows a systematic description of complex polymer mole-cules. The structure based on a perfect alternating sequence of b-(1!3)-linked d-galactopyranose residues and a-(1!4)-linked3,6-anhydro-d-galactopyranose or a-(1!4)-linked d-galactopyranose residues is called the ‘ideal’ structure. Based on theKnutsen-nomenclature, the names and letter codes of the dimeric structures of k, i, and l-carrageenan are carrageenose 40-sulfate (G4S-DA), carrageenose 2,40-disulfate (G4S-DA2S), and carrageenan 2,6,20-trisulfate (G2S-D2S,6S), respectively.This letter code nomenclature is gaining importance in scientific publications dealing with carrageenans and agars. Most
authors describing complex structures adopt this nomenclature. In addition to the notation (S) for the sulfate ester distribu-tion, methyl ethers (M), pyruvate acetal (P), and glycosyl units such as xylose (X) are introduced to describe carrageenans withdifferent substituents (Miller, 1998). Agars differ from carrageenans as they have the l-configuration for the 4-linked galactoseresidue. Incidentally this configuration is observed in carrageenans (Storz & Cerezo, 2000) and in the corresponding lettercodes the letter d is replaced by the letter l.
Table 1. Alternative letter code nomenclature of the different carrageenans, as developed by Knutsen et al. (1994)
Letter code Found in carrageenans IUPAC namea
G b 3-linked b-d-galactopyranoseD Not foundb 4-linked a-d-galactopyranoseDA k,b 4-linked 3,6-anhydro-a-d-galactopyranoseS k,i,l,m,n,y Sulfate ester (O-SO3
�)G2S l,y 3-linked b-d-galactopyranose 2-sulfateG4S k,i,m,n 3-linked b-d-glactopyranose 4-sulfateDA2S i,y 4-linked 3,6-anhydro-a-d-galactopyranose 2-sulfateD2S,6S l,n 4-linked a-d-galactopyranose 2,6-disulfateD6S m 4-linked a-d-galactopyranose 6-sulfate
a International Union of Pure and Applied Chemistry nomenclature as recommended in 1996 (McNaught, 1997).b Not found in natural occurring carrageenans, but can be found in desulfated carrageenan samples.
F. van de Velde et al. / Trends in Food Science & Technology 13 (2002) 73–92 75

gelling carrageenans with the D-units in the 4C1-con-formation. Occurrence of disaccharide units without the3,6-anhydro ring and having a 4C1-conformation causes‘‘kinks’’ in the regular chain and prevents the formationof helical strands and by consequence prevents gelationof the carrageenan. In vivo, i- and k-carrageenan areformed enzymatically from their precursors, by a sulfo-hydrolase (Wong & Craigie, 1978, De Ruiter et al.,2000). The usual presence of considerable amounts ofprecursor units in commercial carrageenan preparationshas a strong negative effect on the functional (e.g. gel-ling) properties (Hansen, Larsen, & Grøndal, 2000; Vande Velde et al., in press). Therefore, in industrial pro-cessing, prior to use crude carrageenan is submitted toan alkaline treatment or alkaline extraction, catalysingthe cyclisation reaction with OH� (Therkelsen, 1993;Van de Velde & De Ruiter, 2002) (Table 1).
Analysis of carrageenansAt present, there is still lack of adequate analytical
techniques to determine the amounts, the polydispersity,and the purity of carrageenans in food products and rawmaterials. Different techniques and approaches used forthis type of analysis are, for example colorimetry andimmunoassays, HPLC and electrophoresis (Roberts &Quemener, 1999). To reveal the (detailed) molecularstructure of carrageenans, a chemical analysis is mostlydone on isolated and purified carrageenan samples. Inthe beginning, chemical modification and degradationmethods were time-consuming and tedious analyticaltechniques. In the mid 1970s a real boost was given bythe introduction of NMR spectroscopy. NowadaysNMR spectroscopy (both 1H- and 13C-NMR) is one ofthe standard tools for the determination of the chemicalstructure of carrageenan samples (Roberts & Quemener,1999; Usov, 1998). In addition to NMR spectroscopy,other analytical techniques, such as sulfate contentanalysis, monosaccharide composition analysis (Jol,Neiss, Penninkhof, Rudolph, & De Ruiter, 1999) andmethylation analysis (Falshaw, Bixler, & Johndro, 2001;Falshaw & Furneaux, 1994) are applied.
NMR spectroscopy of the major carrageenan typesIn general, carrageenan samples are sonicated prior to
recording the spectra and the NMR experiments are car-ried out at elevated temperature to reduce the viscosity ofthe solution (high viscosity results in line broadening).Due to the low natural abundance of the 13C isotope,samples for 13C-NMR are prepared at relatively highconcentrations (5–10% w/w in D2O) compared to
1H-NMR samples (0.5–1.0% w/w in D2O). Overviews ofthe 1H and 13C-NMR spectra of the most importantcarrageenan types are shown in respectively, Figs. 2 and3. Both the 1H- and 13C-NMR spectra reveal that‘‘pure’’ carrageenan samples are rare. The k- and i-car-rageenan samples may contain extraneous units of i- andk-carrageenan respectively, which is quite well knownfor carrageenans extracted from K. alvarezii and E.denticulatum. Samples containing precursor carragee-nans are always hybrids containing low percentages ofthe precursor units.
13C-NMR spectroscopyProton-decoupled 13C-NMR spectra of highly regular
red algal galactans resemble the spectra of correspondingsubstituted disaccharides. Since the pairs of diads G-Dand G-L, as well as G-DA and G-LA, are diaster-eoisomeric, they give different spectra, the differencesbeing especially noticeable for the anomeric carbonresonances (Table 2). This observation made it possibleto recommend the 13C-NMR spectroscopy as the sim-plest tool for distinguishing the polysaccharides of theagar and carrageenan groups (Bhattacharjee, Yaphe, &Hamer, 1978; Yaroysky, Shashkov, & Usov, 1977).The 13C-NMR spectra of gel forming k- and i-carragee-
nan were studied, using model synthetic monosaccharidederivatives (Usov, 1984) or oligomeric polysaccharidefragments (Greer, Rochas, & Yaphe, 1985; Rochas,Rinaudo, & Vincendon, 1983), and interpreted, as indi-cated in Table 3. Later on this interpretation was con-firmed by various 2D NMR experiments (Chiovitti etal., 1997; Falshaw et al., 1996). These assignments weresuccessfully used to identify the corresponding poly-
Table 2. 13C-NMR chemical shifts of basic agar and carrageenan structures
Diad Unit Chemical shifts (ppm) Ref.
C-1 C-2 C-3 C-4 C-5 C-6
G–L G 103.7 70.0 81.0 68.9 75.6 61.4 Lahaye, Yaphe and Rochas (1985)L 100.9 69.4 71.0 79.3 72.2 61.2
G–LA G 102.4 70.2 82.2 68.8 75.3 61.4 Lahaye, Yaphe, Viet, and Rochas (1989)LA 98.3 69.9 80.1 77.4 75.7 69.4
G–D G 104.8 70.6 78.9 65.8 75.3 61.3 Usov, Yarotsky, and Shashkov (1980)D 96.3 69.3 71.0 78.7 70.5 61.5
G–DA G 102.5 69.5 80.4 66.4 75.3 61.3 Usov and Shashkov (1985)DA 94.7 70.2 79.4 78.0 76.8 69.5
76 F. van de Velde et al. / Trends in Food Science & Technology 13 (2002) 73–92

Fig. 2. 1H-NMR spectra of the major carrageenan types from bottom to top: k-carrageenan from Kappaphycus alvarezii (with permissionof Elsevier adopted from Van de Velde et al., 2001); i-carrageenan from Eucheuma denticulatum (with permission of Elsevier adoptedfrom Van de Velde et al., 2001); n/i-hybrid carrageenan containing 25% n-carrageenan (spectrum published with permission of CP Kelco);
l-carrageenan from Iridaea undulosa (with permission of Elsevier adopted from Storz et al., 1994).
Table 3. 13C-NMR chemical shifts for the main structural units of commercial carrageenans
Carrageenan Unit Chemical shifts (ppm) Ref.
C-1 C-2 C-3 C-4 C-5 C-6
k G4S 102.5 69.6 78.9 74.1 74.8 61.3 Usov and Shashkov (1985)DA 95.3 69.9 79.2 78.3 76.8 69.5
i G4S 102.2 69.3 76.8 72.2 74.8 61.3 Usov and Shashkov (1985)DA2S 92.1 75.0 77.8 78.3 77.0 69.8
l G2S 103.4 77.4 75.8 64.2 74.2 61.3 Falshaw and Furneaux (1994)D2S,6S 91.6 74.8 69.5 80.3 68.7 68.1
F. van de Velde et al. / Trends in Food Science & Technology 13 (2002) 73–92 77
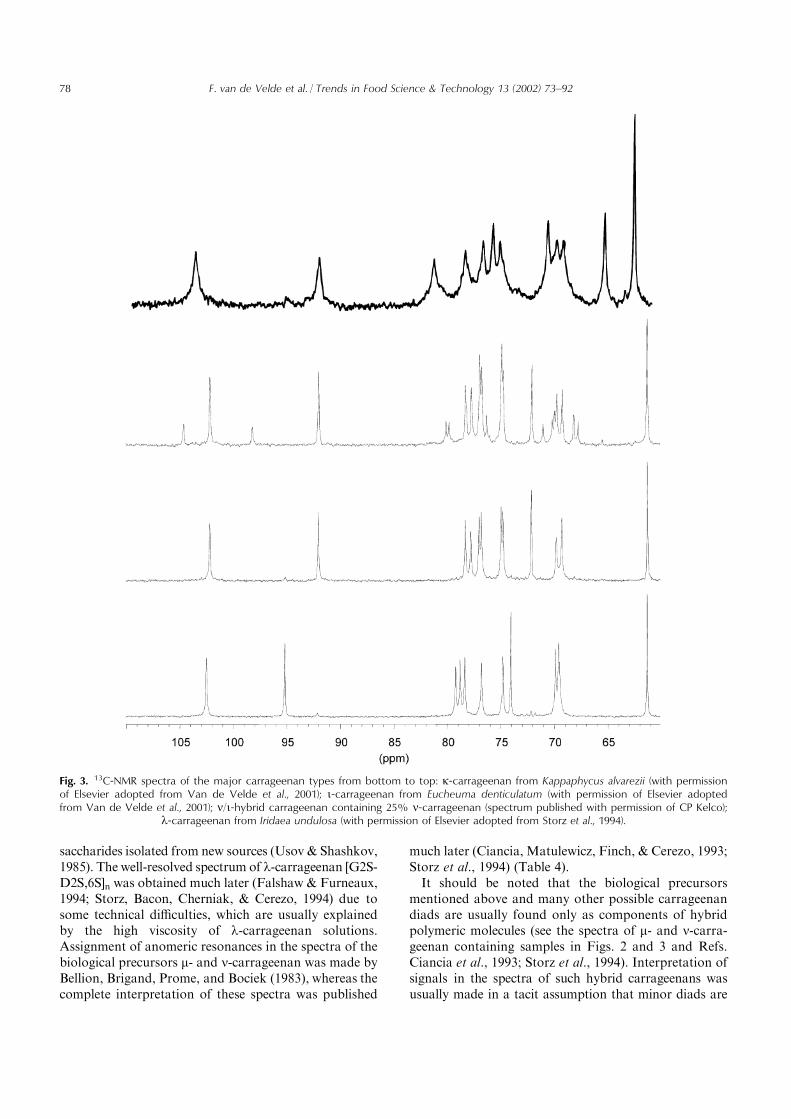
saccharides isolated from new sources (Usov & Shashkov,1985). The well-resolved spectrum of l-carrageenan [G2S-D2S,6S]n was obtained much later (Falshaw & Furneaux,1994; Storz, Bacon, Cherniak, & Cerezo, 1994) due tosome technical difficulties, which are usually explainedby the high viscosity of l-carrageenan solutions.Assignment of anomeric resonances in the spectra of thebiological precursors m- and n-carrageenan was made byBellion, Brigand, Prome, and Bociek (1983), whereas thecomplete interpretation of these spectra was published
much later (Ciancia, Matulewicz, Finch, & Cerezo, 1993;Storz et al., 1994) (Table 4).It should be noted that the biological precursors
mentioned above and many other possible carrageenandiads are usually found only as components of hybridpolymeric molecules (see the spectra of m- and n-carra-geenan containing samples in Figs. 2 and 3 and Refs.Ciancia et al., 1993; Storz et al., 1994). Interpretation ofsignals in the spectra of such hybrid carrageenans wasusually made in a tacit assumption that minor diads are
Fig. 3. 13C-NMR spectra of the major carrageenan types from bottom to top: k-carrageenan from Kappaphycus alvarezii (with permissionof Elsevier adopted from Van de Velde et al., 2001); i-carrageenan from Eucheuma denticulatum (with permission of Elsevier adoptedfrom Van de Velde et al., 2001); n/i-hybrid carrageenan containing 25% n-carrageenan (spectrum published with permission of CP Kelco);
l-carrageenan from Iridaea undulosa (with permission of Elsevier adopted from Storz et al., 1994).
78 F. van de Velde et al. / Trends in Food Science & Technology 13 (2002) 73–92

arranged in blocks, e.g. the given diad has the neighboursof the same structure on its right and left. Evidently, thisassumption may not be valid for many real poly-saccharides, and hence, the signal assignment for minordiads suggested in the literature [see, for example Cian-cia et al. (1993)] should be regarded only as tentative.Most carrageenans differ only in 3,6-anhydrogalactose
content, degree of sulfation and positions of sulfategroups. An attempt was made to calculate the 13C-NMRspectra of many possible carrageenan structures, includ-ing those, which were not isolated at that time fromnatural sources, using spectral features of the knownpolysaccharides (Storz & Cerezo, 1992). However, theexperimental spectra of a- and l-carrageenan, showedinsufficient coincidence with the predicted values. Evi-dently the amount and specific position of charged sulfategroups may result in conformational changes of poly-saccharide chains, which are not taken into considera-tion by additive schemes in calculations of chemical shifts.
1H-NMR spectroscopyThe 1H NMR spectra of monomeric methyl b-d-
galactopyranoside and methyl 3,6-anhydro-a-d-galac-topyranoside have initially been used as the basis of theinterpretation of the proton spectra of the gelling k- andi-carrageenan (Welti, 1977). Later on these assignments
have been confirmed by the spectra of the neocarrabioseoligosaccharides (Knutsen & Grasdalen, 1992a). For thebiological precursor units, n- and m-carrageenan, onlythe a-anomeric protons were assigned (Ciancia et al.,1993; Storz et al., 1994), due to the complexity of thehybrid samples containing these precursors. The viscos-ity of l-carrageenan samples allows only the assignmentof the a-anomeric protons in a pure sample (Storz et al.,1994). Nowadays, quantification of different carragee-nan types in a sample by 1H-NMR spectroscopy isbased on the resonances of the a-anomeric protons (D-and DA-units) in the region from 5.1 to 5.7 ppm (seeTable 5). The signals for the b-anomeric protons (G-units) are less suitable for either identification or quan-tification purposes.
NMR spectroscopy of minor substituents incarrageenansSeveral carrageenans have additional substituents,
which may be identified by NMR spectroscopy. Thus, asmall amount of 3-linked 6-O-methyl-d-galactose resi-dues was found in k-carrageenan from Kappaphycusalvarezii (Bellion et al., 1983) and in several other poly-saccharides (Chiovitti et al., 1998). These residues givespecific signals for OMe at 59.0, for the substituted C-6at 71.8, and for the neighbouring C-5 at 73.3 ppm in13C-NMR. Small amounts of terminal xylose residueswere also detected in many carrageenans, but theirlocation usually remains uncertain. In the case of anunusual polysaccharide [G4,6S-DA]n from Phacelo-carpus peperocarpos (Liao et al., 1996) NMR spectraldata indicated the attachment of xylose residues atposition 3 of some 4-linked a-d-galactose residues. Ini-carrageenan from Eucheuma denticulatum this mono-saccharide probably occupies position 6 of 3-linked b-d-galactose residues (Usov and Knutsen, unpublished).
Table 4. 13C-NMR chemical shifts for the most common carrageenan structural units encountered in hybrid molecules
Carrageenan Unit Chemical shifts (ppm) Ref.
C-1 C-2 C-3 C-4 C-5 C-6
a G 102.7 69.6 81.9 66.9 75.3 61.6 Falshaw et al. (1996)D2S 94.7 75.4 78.1 78.3 77.1 70.0
b G 102.7 69.7 80.5 66.5 75.5 61.4 Liao, Kraft, Munro, Craik, & Bacic (1993)DA 94.7 70.3 79.5 78.3 77.0 69.7
y G2S 100.3 77.6 77.2 67.8 74.7 61.1 Falshaw and Furneaux (1994)DA2S 95.6 74.7 77.4 79.5 77.0 69.8
o G6S 102.7 69.4 80.3 66.0 72.9 67.2 Usov and Shashkov (1985)DA 94.7 70.1 79.5 78.5 76.9 69.4
(?) D4S,6S 102.8 69.6 78.9 74.0 72.7 68.2 Liao et al. (1996)DA 95.3 69.9 79.5 78.9 77.0 69.6
m G4S 105.3 70.7 78.8 73.8 75.4 61.9 Storz et al. (1994); Ciancia et al. (1993)D6S 98.2 68.9 70.7 79.5 68.9 68.4
n G4S 105.3 70.7 80.4 73.8 75.4 61.9 Ciancia et al. (1993); Storz et al. (1994)D2S,6S 98.8 76.8 68.9 79.5 68.9 68.4
Table 5. 1H-NMR chemical shifts of the �-anomeric protons ofcarrageenans (Ciancia et al., 1993; Storz et al., 1994)
Carrageenan Monosaccharide Chemical shift (ppm)
i DA2S 5.32k DA 5.11l D2S,6S 5.59n D2S,6S 5.52m D6S 5.26
F. van de Velde et al. / Trends in Food Science & Technology 13 (2002) 73–92 79

Pyruvic acid is a common component of many com-plex carrageenans. It forms a cyclic acetal at positions 4and 6 of 3-linked galactose residues and may be foundin diads related to a- and y-carrageenans. This sub-stituent can be identified by characteristic signals of itscarbons together with specific substitution effects on thecorresponding carbon atoms of 3-linked d-galactose(Chiovitti et al., 1998; Falshaw & Furneaux, 1995) (Table6). The pyruvic acid ketals are also detected in the 1H-NMR spectra by methyl proton resonances with a chemi-cal shift of 1.45 ppm (Chiovitti et al., 1997). This signaldoes not overlap with other proton resonances in thesecarbohydrate derivatives. In addition, specific substitioneffects on the chemical shifts of the other protons areobserved in the 1H-NMR spectra (Chiovitti et al., 1997).According to the structure of sulfated galactans, red
algae are traditionally divided into agarophytes andcarrageenophytes. However, galactan sulfates of inter-mediate structure, which may be termed as d/l-hybrids,have been found recently in many species. They seem tobe characteristic to representatives of Cryptonemialesand Rhodymeniales, may be isolated from severalspecies of Ceramiales, and surprisingly are also presentas minor components in many species of Gigartinalesknown as ‘‘classical’’ carrageenan sources (Miller,1997). These d/l-hybrids are no more carrageenans,and their structural analysis will not be discussed here,but it should be noted that their 13C-NMR spectra arerather complex and, as a rule, can not be interpretedunambiguously without additional evidence obtained bychemical methods (Estevez, Ciancia, & Cerezo, 2001).
NMR spectroscopy of contaminants and additives incarrageenan samplesCarrageenan preparations may contain admixtures of
two different origins. Some of them are components of
red algal biomass, which were not removed in the car-rageenan isolation procedure (Rudolph, 2000; Van deVelde & De Ruiter, 2002). Other compounds (inorganicsalts, sucrose, galactomannans) can be added by manu-facturers to improve and/or control some functionalproperties of carrageenan samples (solubility, viscosity,gel strength, etc.). Small contaminations and additives,such as inorganic salts and sugars, can be removed bydialysis, prior to recording the spectra.Floridean starch, a branched (1–4,1–6)-a-d-glucan
structurally related to plant amylopectins and animalglycogens, is a reserve polysaccharide of red seaweeds.It is soluble in water and can accompany carrageenansin the extraction and precipitation steps. Apart from thedetection of glucose in an acid hydrolysate, the presenceof floridean starch can be confirmed by the well-knownset of signals of 4-linked a-d-glucopyranose residues inthe 13C-NMR spectrum (see Table 7) (Colson, Jennings,& Smith, 1974; Knutsen & Grasdalen, 1987). In the 1H-NMR spectra, floridean starch is detected by the signalof the anomeric proton of the a(1!4)-linked d-gluco-pyranosyl at 5.37 ppm (Knutsen & Grasdalen, 1987).The resonance of the anomeric proton of the a(1!6)-linked d-glucopyranosyl appears at 4.98 ppm. Florideanstarch can be removed by starch degrading enzymes orby any procedure of separation of acid and neutralpolysaccharides.Galactans of the agar group may be present in carra-
geenans, when mixed algal populations containing bothagarophytes and carrageenophytes are used for carra-geenan manufacture. As in the case of d/l-hybrids,unambiguous identification of agar-like structures mayrequire chemical evidence to complement the 13C-NMRspectral data. Some red algae contain water-solublesulfated xylomannans and neutral xylans, but thesepolysaccharides are usually absent from the common
Table 6. 13C-NMR chemical shifts for several pyruvated carrageenans
Unit Chemical shifts (ppm) Ref.
Polysaccharide backbone Pyruvate acetal
C-1 C-2 C-3 C-4 C-5 C-6 Methyl Acetal Carboxyl
GP 104.4 67.6 76.1 66.7 Falshaw and Furneaux et al. (1995)DA 95.2GP 102.0 69.2 76.7 67.5 66.7 65.6 25.5 101.7 175.9 Chiovitti et al. (1998)DA2S 91.4 75.2 77.9 78.4 77.2 70.0
Table 7. 13C NMR chemical shifts of amylose and sucrose
Substance Residue Chemical shifts (ppm) Ref.
C-1 C-2 C-3 C-4 C-5 C-6
Amylose 4-linked a-d-glucopyranose 100.7 72.7 74.4 78.5 72.4 61.8 Colson et al. (1974)Sucrose a-d-glucopyranose 92.9 71.9 73.4 70.0 73.2 61.0 Bock et al. (1984)
b-d-fructofuranose 62.2 104.5 77.3 74.8 82.2 63.2
80 F. van de Velde et al. / Trends in Food Science & Technology 13 (2002) 73–92

carrageenophytes and only accidentally may be found incarrageenans. Red algal xylans are abundant in repre-sentatives of the orders Nemaliales and Palmariales,whereas sulfated xylomannans were found only in sev-
eral species of the order Nemaliales. 13C-NMR spectraof both types of polysaccharides were published(Kolender, Pujol, Damonte, Matulewicz, & Cerezo,1997; Kovac, Hitsch, Shashkov, Usov, & Yarotsky,
Fig. 4. 1H-NMR spectra of the major carrageenan variants, sucrose and glucose. From bottom to top: k-carrageenan from Kappaphycusalvarezii (400 MHz, 75�C), i-carrageenan from Eucheuma denticulatum (400 MHz, 75�C), sucrose (10% w/w, 600 MHz, 80�C) and glucose
(0.5% w/w, 600 MHz, 56�C).
F. van de Velde et al. / Trends in Food Science & Technology 13 (2002) 73–92 81

1980; Usov & Dobkina, 1991) and may be used for theiridentification.Additives such as sucrose and glucose are often used
to adjust the viscosity of the commercial carrageenan
preparations. Sucrose interferes with colorimetric pro-cedures of determination of carrageenans based on spe-cific color reactions of 3,6-anhydrogalactose, sincefructose and 3,6-anhydrogalactose behave similarly in
Fig. 5. 13C-NMR spectra of the major carrageenan variants, sucrose and glucose. From bottom to top: k-carrageenan from Kappaphycusalvarezii (100 MHz, 75�C), i-carrageenan from Eucheuma denticulatum (100 MHz, 75�C), sucrose (10% w/w, 150 MHz, 80�C) and glucose
(10% w/w, 150 MHz, 80�C).
82 F. van de Velde et al. / Trends in Food Science & Technology 13 (2002) 73–92
these procedures (Anderson & Bowtle, 1974; Yaphe &Arsenoult, 1965). In addition, the anomeric signal of a-d-glucopyranose residue in the 13C-NMR spectrum ofsucrose (Bock, Pedersen, & Pedersen, 1984) may overlapwith that of DA2S residue of i-carrageenan at about 92ppm (see Fig. 5 and Turquois, Acquistapace, Arce-Vera,& Welti, 1996). Nevertheless, the presence of sucrosecan be unambiguously detected by its other signals inthe 13C-NMR spectrum of the mixture (Table 7). Theseadditives do not disturb the NMR analysis and can ingeneral be detected besides the different carrageenanforms (see Figs. 4 and 5). Only the resonance of theanomeric proton of glucose overlaps with the resonanceof m-carrageenan in 1H-NMR. If necessary, glucose andsucrose together with inorganic salts can be removed bydialysis or ethanol precipitation.The gelling properties of carrageenans can be con-
siderably improved by addition of several galacto-mannans or mannans of some higher plants (Imeson,2000; Therkelsen, 1993). NMR studies were used toelucidate the possible modes of interaction betweenpolysaccharide components in these blends (Rochas,Taravel, & Turquois, 1990). Since the 13C-NMR spectraof galactomannans are well-known (Grasdalen & Pain-ter, 1980), the corresponding spectra of mixed prepara-tions recorded at elevated temperatures (above themelting points of gels) can be used to detect the presenceof galactomannan additives and to calculate their con-tent relative to carrageenan. In 1H-NMR spectra theanomeric proton of the a-d-galactopyranose is observedat 5 ppm and that of the b-d-mannopyranose at 4.8ppm (Grasdalen & Painter, 1980).
Analysis and quantification of the composition ofcarrageenan blends by NMR spectroscopyIn industrial applications the composition of carra-
geenan blends is very important with respect to thedesired functionality. The type of carrageenan presentin a commercial preparation and possible additives canto a large extent determine the functional properties ofthe final product. Carrageenan preparations, mixturesof carrageenans and commercial carrageenan blends canqualitatively and quantitatively be characterised byNMR spectroscopy. NMR techniques allow the identi-fication of various carrageenan forms and the determi-nation of the molar ratios and the content of the
individual components in the mixture. Both 1H- and13C-NMR spectroscopy are applicable for these pur-poses. 1H-NMR has the advantage of a relatively highsensitivity. 1H-NMR spectra of samples with low carra-geenan concentration (0.5–1.0% w/w) can be recordedin a couple of minutes. The analysis of the 1H-NMRspectra is based on the position and intensity of theresonances of the a-anomeric protons of the repeatingunit (see Table 5). 13C-NMR has the advantage of ahigh information content. Due to the high chemicalshift dispersion, in a 13C-NMR spectrum each carbonatom of the repeating unit of a carrageenan variantgives rise to one single signal and the various carragee-nan variants show unique and characteristic patterns(see Tables 3 and 4). Quantitative determination of thecomposition of a mixture of carrageenans can be basedon the intensity of the resonances of the anomeric car-bons of both rings of the repeating unit. A disadvantageof 13C-NMR is its low sensitivity. For the recording of13C-NMR spectra samples with high carrageenan con-centration (7–10% w/w) have to be used. Even then a13C-NMR experiment takes approximately 12–18 h toreach a reasonable signal to noise ratio (S/N).In most cases 1H-NMR will suffice for the character-
isation of a carrageenan blend. In cases where initially1H-NMR is not conclusive and additional identificationis required, 13C-NMR spectroscopy can be applied.Additives such as sucrose and glucose which are oftenused to adjust the viscosity of the carrageenan prepara-tions, do not disturb the NMR analysis and can in gen-eral be detected in addition to the different carrageenanforms (see Figs. 4 and 5). Only the resonance of theanomeric proton of glucose overlaps with the resonanceof m-carrageenan in 1H-NMR.Quantitative applications of NMR techniques require
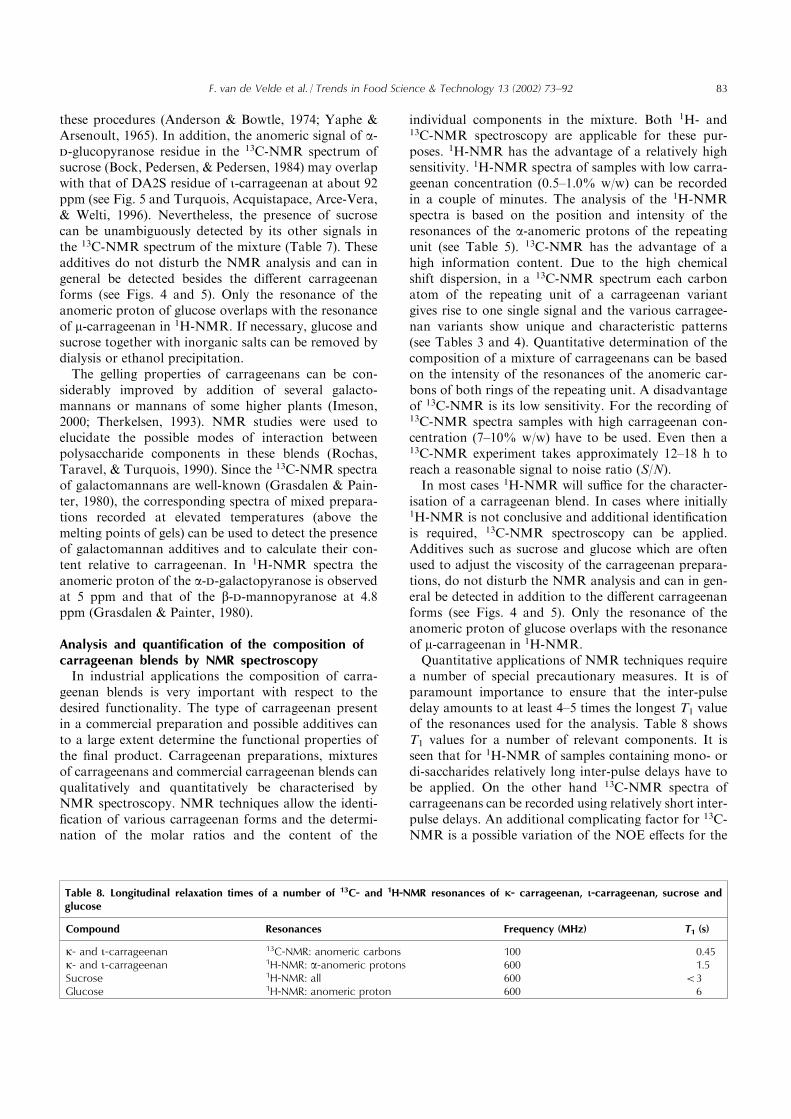
a number of special precautionary measures. It is ofparamount importance to ensure that the inter-pulsedelay amounts to at least 4–5 times the longest T1 valueof the resonances used for the analysis. Table 8 showsT1 values for a number of relevant components. It isseen that for 1H-NMR of samples containing mono- ordi-saccharides relatively long inter-pulse delays have tobe applied. On the other hand 13C-NMR spectra ofcarrageenans can be recorded using relatively short inter-pulse delays. An additional complicating factor for 13C-NMR is a possible variation of the NOE effects for the
Table 8. Longitudinal relaxation times of a number of 13C- and 1H-NMR resonances of �- carrageenan, �-carrageenan, sucrose andglucose
Compound Resonances Frequency (MHz) T1 (s)
k- and i-carrageenan 13C-NMR: anomeric carbons 100 0.45k- and i-carrageenan 1H-NMR: a-anomeric protons 600 1.5Sucrose 1H-NMR: all 600 <3Glucose 1H-NMR: anomeric proton 600 6
F. van de Velde et al. / Trends in Food Science & Technology 13 (2002) 73–92 83

different carbons. However in the case of carrageenansall carbon atoms of the repeating unit have one protonattached. Based on this one would expect little variancein the NOE effect for the different carbons. Experimentswith a mixture of kappa- and iota-carrageenan usingcontinuous composite pulse decoupling and gateddecoupling produced apart from S/N, the same resultfor the intensity ratio of the anomeric carbon reso-nances (Rollema, unpublished).Table 9 illustrates that reasonable agreement is obtained
between results obtained by 1H- and 13C-NMR spectro-
scopy with respect to the determination of the quantitativecomposition of carrageenan mixtures. It should be men-tioned that the relatively low S/N of 13C-NMR spectraimplicates that minor components can either not be detec-ted or if their signals are detectable, the content determinedby 13C-NMR will have a limited accuracy.Finally if use is made of an appropriate internal or
external reference, using 1H-NMR spectroscopy themolar ratios and the absolute contents of carrageenanforms and added mono- or di-saccharides can be deter-mined in a single experiment.
Table 9. Comparison of the composition of three different carrageenan preparations obtained by 13C- and 1H-NMR spectroscopy
Carrageenan form(s) Composition (mol%)
Sample 1 Sample 2 Sample 3
13C-NMR 1H-NMR 13C-NMR 1H-NMR 13C-NMR 1H-NMR
k 44.8 40 4.9 5.8 37.2 36.6i 21.2 23.2 80.6 73.8 26.7 23.3m+n 23.8 25.5 11.4 16.9 20.6 21.8l 0 0 0 0 9 14.7Unidentified 10.3 11.3 3.4 3.5 6.6 3.9
Sample 1: neutrally extracted carrageenan from Sarcothalia crispata. Sample 2: neutrally extracted carrageenan from Eucheuma denticula-tum. Sample 3: commercial carrageenan sample, called l-carrageenan.
Fig. 6. The most useful 1H-region of neocarrabiose type oligosaccharides represented by 500 MHz-spectra at 25�C of the two tetra-saccharides; (A) DA–G4S–DA–G4S and (B) DA–G–DA–G4S. Please note that due to space DA residues are denoted as A only and theposition of the residues is denoted by reducing end side (r) or non-reducing end side (nr) exemplified by Anr–G4Snr–Ar–G4Sr, and whereappropriate a or b. Arrows are indicating sulfate-induced shifts. Results presented in (Knutsen, 1992) and partly in (Knutsen & Grasdalen,
1992a).
84 F. van de Velde et al. / Trends in Food Science & Technology 13 (2002) 73–92

1H-NMR spectroscopy of carrageenan fragmentsKnowledge about the different oligosaccharides in
the different fractions can be used to deduce thestructure of the original carrageenan sample. In thisfragment analysis approach, 1H-NMR spectroscopy isused for its high sensitivity and possibilities to resolvethe fine structure of carrageenan oligosaccharides.Carrageenan oligosaccharides are prepared by chemicalor enzymatic hydrolysis. The higher and lower mole-cular mass fractions are separated by precipitationmethods and further fractionated by gel permeationchromatography (GPC) or size exclusion chromato-graphy (SEC), see Box 2. High field 1H-NMR spec-troscopy is than used to elucidate the detailedmolecular structure of the different di-, tetra-, andoligosaccharides.
NMR-elucidated sequence informationA sulfation of a certain carbon will influence not only
the chemical shift on its attached proton but also theprotons on other ring carbon atoms and even neigh-
bouring sugar residues. Therefore the identity of theactual carrageenan residue as well as some sequenceinformation can be obtained. Minimal sequence infor-mation for the partly desulfated carrageenan from alkalitreated Furcellaria lumbricalis was obtained by 400MHz 1H-NMR spectroscopy, documented by anapproximately 0.02 ppm upfield shift of the resonanceof AH1–G compared to AH1–G4S (Knutsen, Mysla-bodski, & Grasdalen, 1990). Sequential informationregarding the distribution of O-methyl groups (G4M) inagar from Porphyra umbilicalis had much earlier beendemonstrated with 90 MHz 13C- NMR spectroscopy(360 MHz for 1H) (Morrice, McLean, Long, & Wil-liamson, 1983). Even at a very low field strength of 2.35T, the effect of a desulfated reducing end neighbour of3,6 anhydrogalactose i.e. DAC1–G (94.6 ppm) as com-pared to DAC1–G4S (95.2 ppm) (Knulsen & Grasdalen,1987) were noticed. However it is likely that somesequence information beyond this might be obtained byobserving the anomeric region characteristic for both the3-linked and 4-linked residues in well resolved spectra at
Box 2. Preparation of carrageenan fragments
DepolymerizationChemical depolymerisationIn general a slight degradation of the molecular weight will reduce the viscosity in a sample and hence improve its NMR-
spectrum especially due to less line broadening. This can be achieved by non-specific methods such as ultrasonic degradation(Van de Velde et al., 2001) and acid hydrolysis (Caram-Lelham, Sundelof, & Andersson, 1995; Rochas & Heyraud, 1981). Thelatter is difficult to control since selective degradation of 3,6-anhydro units (DA2S or DA) and removal of sulfate groups ismost likely to occur. A strategy based on autohydrolysis (Storz & Cerezo, 1991) has been developed with quite promisingresults but has so far not been used by many workers. Another depolymerisation tool, which might be useful in combinationwith NMR, is oxidative radical depolymerisation. Treatment of a polysaccharide solution with ferrous ions plus ascorbic acidat room temperature will induce random depolymerisation (Hjerde, Kristiansen, Stokke, Smidsrød, & Christensen, 1994;Yamada et al., 1997). The use of chemical fragmentation must be done very carefully, taken into account the possibility oflateral reactions concomitant with the lytic ones, i.e. autohydrolysis will produce the splitting of the a-(3,6-anhy-dro)galactosidic linkages flanked by sulfate groups (Ciancia, Matulewicz, Storz, & Cerezo, 1991) but also will produce thehydrolysis of the b-galactose 2-sulfate, as a result of the loss of this sulfate group the resonance of the a-galactose 2,6-sulfateswill displaced from 92.0 ppm to 94.7 ppm (Noseda, 1994; Noseda & Cerezo, 1993).
Enzymatic depolymerisation
As for polysaccharides in general, the use of specific enzymes is an ultimate tool for structural analysis of carrageenans. Byselecting a suitable enzyme, i.e. carrageenase, well-defined oligosaccharides with characteristic structural elements can beobtained in reasonable high quantities (Bellion et al., 1983; Greer, Shomer, Goldstein, & Yaphe, 1984; Rochas & Heyraud,1981). On the other hand molecules enriched with uncommon irregularities or non carrageenan constituents might be retainedand subsequently isolated by a proper fractionation technique (see below). In this way, cryptic structures, that otherwise wouldbe masked below the noise level in the 13C-NMR spectra can be identified. Carrageenases are endo-b-galactanases, cleaving theinternal b-(1!4) linkages with sulfate substitution pattern related specificity, reviewed by De Ruiter & Rudolph (1997). Oli-gosaccharides of the neocarrabiose series (DA–G4S)n or (DA2S–G4S)n are the main products from molecules or molecularregions that possess structural regularities of a certain length. By far the most popular enzyme is k-carrageenase, which mightbe obtained from several bacteria. It has successfully been produced in a stable form by large-scale fermentation of Pseudo-monas carrageenovora on k-carrageenan from Kappaphycus alvarezii (mostly DA–G4S type) (Østgaard,Wangen, Knutsen, &Aasen, 1993). In general it has been quite well established among researchers that stable enzyme preparations with otheractivities than k-carrageenase have been harder to achieve. However, quite recently these enzymes have successfully been pre-pared by cloning in E. coli (Barbeyron, Flament, Michel Potin, & Kloareg, 2001; Potin et al., 1995), giving more stableenzymes, especially important for i-carrageenase (Michel et al., 2000). Unfortunately at the moment carrageenases are notcommercially available for routine structure analysis.
(continued on next page)
F. van de Velde et al. / Trends in Food Science & Technology 13 (2002) 73–92 85

FractionationSeparation based on solubility in ethanol
Carrageenans are never occurring structurally pure but with a varying ratio of characteristic structural elements as men-tioned in Fig. 1. In order to isolate specific structural motives occurring in low quantity the use of specific carrageenasescombined with some fractionation procedure is required. For the subsequent analysis NMR-spectroscopy is the most preferredtool (see below). Adding alcohol to an aqueous hydrolysate has been used to precipitate the high polymeric weight fraction,often containing a high content of irregular structures such as 6-sulfated precursor units or 3,6-anhydro units with ‘‘wrong’’sulfate substitution on itself or its neighbouring residues. The term enzyme resistant fraction (ERF) was introduced for suchfractions (Bellion et al., 1983).In principle it is possible to produce pure oligosaccharides of a certain type, i.e. (DA2S–G4S)n or (DA–G4S)n provided such
sequences occur in separate molecules or in long blocks. At this point it must be noted that if irregularities along the carra-geenan chain occur close to the linkage subjected to enzymatic hydrolysis, but not so close to hinder an enzymatic attack on theactual beta 1–4 linkage, oligosaccharides carrying both precursor or unsulfated 3-linked units might be produced and hencesolubilised in the 60–80% ethanol fraction (Knutsen & Grasdalen, 1992b). So far there is no literature describing enzymes withcapability to specifically remove all corresponding sugar units from a certain carrageenan sample.Nevertheless, alcohol precipitation might be used for a rough estimate of the apparent kappa-content in different samples
after a treatment with k-carrageenase (Fig. 9). The results of such a fractionation combined with the gross composition of thedifferent major structural elements as obtained with 1H-NMR, some indication of the occurrence of sequences of a certainlength (block size) could be obtained. As opposed to precipitation, leaching of a previously dried hydrolysate into increasinglywater diluted ethanol solutions was shown to give more defined fractions of oligosaccharide, which easily can be subjected toNMR analysis (Knutsen et al., 1995).
Fig. 9.
The apparent (DA–G4S)n character of some carrageenans as estimated after the digestion with k-carrageenase. The contentis estimated as the percentage of oligosaccharides as compared to the alcohol insoluble fraction. ERF was estimated grav-imetically after precipitation in 70% ethanol, dialysis and lyophilization. Where EC: a commercial extract from Kappaphycusalvarezii (LITEX 171505), AP: a commercial extract from Furcellaria lumbricalis (LITEX AP641), FLHI: the KCl-insolublefraction of a hot water extract from Furcellaria lumbricalis, FLCS: the KCl-soluble fraction of a cold-water extract of Furcel-laria lumbricalis, EG: the hot water extract of Eucheuma gelatinae, EM: the hot water extract of Endocladia muricata and iota:
a commercial extract from Eucheuma denticulatum (SIGMA). Unpublished results from (Knutsen, 1992).
Separation based on chromatography
In order to obtain pure fractions, or hopefully to isolate the individual oligosaccharides obtained by the enzymatic hydro-lysis, some chromatographic step is needed. At first Size Exclusion Chromatography (SEC) was performed on Sephadex(McLean & Williamsson, 1979) and Bio Gel type materials (Knutsen & Grasdalen, 1992b; Rochas & Heyraud, 1981). How-ever, at present materials such as Superdex (Pharmacia) (Knutsen & Grasdalen, 1992b; Caram-Zelham et al., 1995), which can
86 F. van de Velde et al. / Trends in Food Science & Technology 13 (2002) 73–92
relatively high field (>11.7 T). To achieve a properresolution of the C1 signals the polysaccharides shouldbe subjected to a previous depolymerisation (see Box 2),conserving the sulfate and 3,6-anhydro residues and thespectra must be subjected to some statistical analyses asdone for alginates (Grasdalen, 1983).
Special information obtained by spectroscopicanalysis of oligosaccharidesThe additional information obtained from spectra
recorded from oligosaccharide samples as compared topolymeric samples (Van de Velde et al., 2001; Welti,1977) is related to resolved resonances from reducingand non-reducing end residues. This is only achieved aslong as the level of residual water is minimised by repe-ated freeze drying in D2O. In general by applying car-rageenases and a suitable fractionation, the resultingoligosaccharide spectra are less complex due to the pre-eminence of neocarrabiose type oligosaccharides, givingnon reducing end 3,6 anhydrogalactose and 3-linkedgalactose on the reducing end respectively. Furthermoresome of the 1H-resonances of a DA-unit neighbouringthe 3-linked reducing end unit will be split due to theanomeric equilibrium and may be used as diagnosticpeaks in high field spectra. Although in some cases forpolymer spectra a few resonances may be easily assignedby their characteristic coupling constants. The spectra
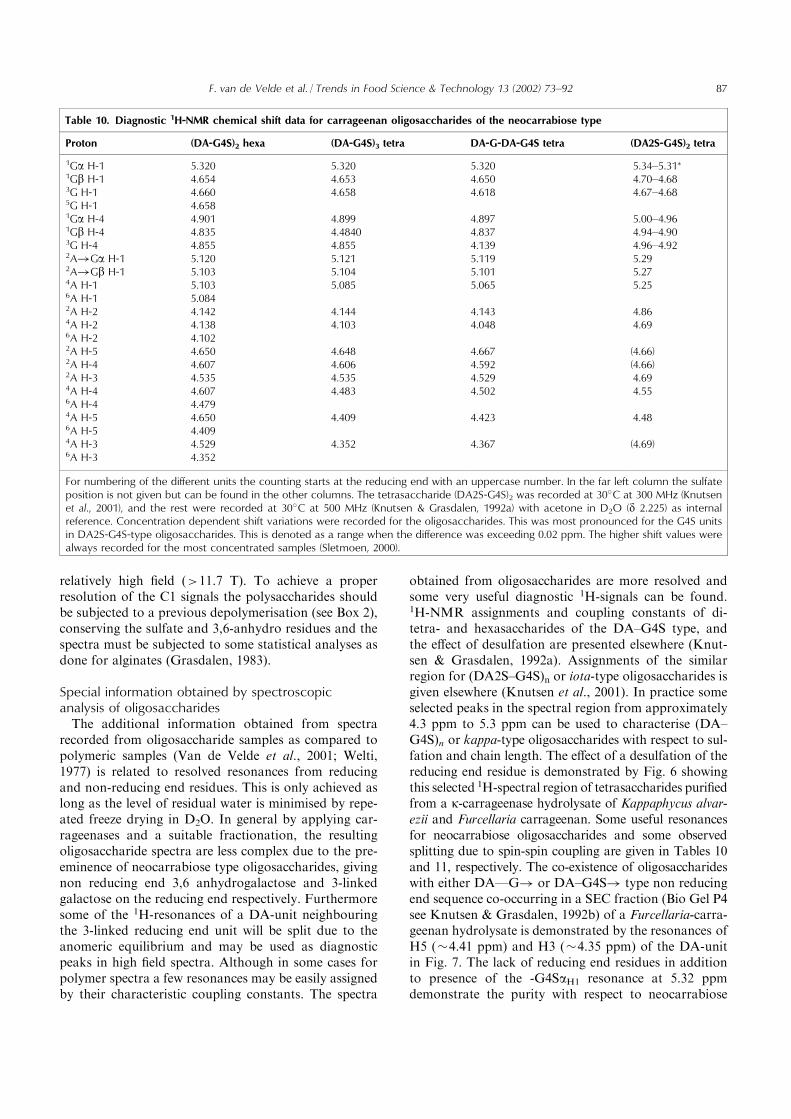
obtained from oligosaccharides are more resolved andsome very useful diagnostic 1H-signals can be found.1H-NMR assignments and coupling constants of di-tetra- and hexasaccharides of the DA–G4S type, andthe effect of desulfation are presented elsewhere (Knut-sen & Grasdalen, 1992a). Assignments of the similarregion for (DA2S–G4S)n or iota-type oligosaccharides isgiven elsewhere (Knutsen et al., 2001). In practice someselected peaks in the spectral region from approximately4.3 ppm to 5.3 ppm can be used to characterise (DA–G4S)n or kappa-type oligosaccharides with respect to sul-fation and chain length. The effect of a desulfation of thereducing end residue is demonstrated by Fig. 6 showingthis selected 1H-spectral region of tetrasaccharides purifiedfrom a k-carrageenase hydrolysate of Kappaphycus alvar-ezii and Furcellaria carrageenan. Some useful resonancesfor neocarrabiose oligosaccharides and some observedsplitting due to spin-spin coupling are given in Tables 10and 11, respectively. The co-existence of oligosaccharideswith either DA—G! or DA–G4S! type non reducingend sequence co-occurring in a SEC fraction (Bio Gel P4see Knutsen & Grasdalen, 1992b) of a Furcellaria-carra-geenan hydrolysate is demonstrated by the resonances ofH5 (4.41 ppm) and H3 (4.35 ppm) of the DA-unitin Fig. 7. The lack of reducing end residues in additionto presence of the -G4SaH1 resonance at 5.32 ppmdemonstrate the purity with respect to neocarrabiose
Table 10. Diagnostic 1H-NMR chemical shift data for carrageenan oligosaccharides of the neocarrabiose type
Proton (DA-G4S)2 hexa (DA-G4S)3 tetra DA-G-DA-G4S tetra (DA2S-G4S)2 tetra
1Ga H-1 5.320 5.320 5.320 5.34–5.31*1Gb H-1 4.654 4.653 4.650 4.70–4.683G H-1 4.660 4.658 4.618 4.67–4.685G H-1 4.6581Ga H-4 4.901 4.899 4.897 5.00–4.961Gb H-4 4.835 4.4840 4.837 4.94–4.903G H-4 4.855 4.855 4.139 4.96–4.922A!Ga H-1 5.120 5.121 5.119 5.292A!Gb H-1 5.103 5.104 5.101 5.274A H-1 5.103 5.085 5.065 5.256A H-1 5.0842A H-2 4.142 4.144 4.143 4.864A H-2 4.138 4.103 4.048 4.696A H-2 4.1022A H-5 4.650 4.648 4.667 (4.66)2A H-4 4.607 4.606 4.592 (4.66)2A H-3 4.535 4.535 4.529 4.694A H-4 4.607 4.483 4.502 4.556A H-4 4.4794A H-5 4.650 4.409 4.423 4.486A H-5 4.4094A H-3 4.529 4.352 4.367 (4.69)6A H-3 4.352
For numbering of the different units the counting starts at the reducing end with an uppercase number. In the far left column the sulfateposition is not given but can be found in the other columns. The tetrasaccharide (DA2S-G4S)2 was recorded at 30�C at 300 MHz (Knutsenet al., 2001), and the rest were recorded at 30�C at 500 MHz (Knutsen & Grasdalen, 1992a) with acetone in D2O (d 2.225) as internalreference. Concentration dependent shift variations were recorded for the oligosaccharides. This was most pronounced for the G4S unitsin DA2S-G4S-type oligosaccharides. This is denoted as a range when the difference was exceeding 0.02 ppm. The higher shift values werealways recorded for the most concentrated samples (Sletmoen, 2000).
F. van de Velde et al. / Trends in Food Science & Technology 13 (2002) 73–92 87

type oligosaccharides and can be used to evaluateenzyme specificity (Knutsen & Grasdalen, 1992b). Itshould be noted that by comparing the area of abovementioned resolved signals from the non-reducing end 3,6anhydrogalactose with the resonances for all H1 of all 3,6anhydrogalactose units (5.1 ppm) the degree of poly-merisation can be estimated.To minimise the obscuring of certain resonances in
the spectra of the oligosaccharides by residual water, thetemperature must be set to an appropriate value. Atroom temperature the residual water peak is occurringin the region of H4 of G4S (i.e. 4.8 ppm) units whereasat elevated temperature this signals shifts upfield toabout 4.2 ppm. An alternative approach is selectiveirradiation of the water peak by a pre saturation tech-nique or applying a double pulse sequence taking intoaccount the relative long relaxation time of small mole-cules such as water. However, such techniques mightinfluence the areas of neighbouring resonances (unpub-lished results). Temperature induced shift in some reso-nances might occur even for small oligosaccharides. Ingeneral, the effects were largest for the protons attachedto carbons involved in the glycoside linkages, smallerfor the protons attached to their neighbouring carbonsand very small for the most distant ones. This is drama-tically demonstrated for the spectrum of the oligosacchar-ide mixture originating from Furcellaria-carrageenan (Fig.7). Finally the temperature induced shifts are illustratedfor the pure tetrasaccharide DA–G4S–DA–G4S in Fig.8. It is evident that a more detailed spectral informationis obtained at 25�C compared to 90�C and that moreresonances coalesce at the elevated temperature.
Outlook and perspectivesThe role of NMR spectroscopy of carrageenans inindustry and researchFor industrial purpose NMR-spectra are obtained
without further purification and/or fractionation of the
sample, as primarily the overall composition is impor-tant. Resonances in the anomeric region of the 13C- and1H-NMR spectra reflect the main diad components,which determine the type of the possible major carra-geenans in the sample. It is important to remember thata pair of correlated resonances determines a diad. Thespectrum is a superposition of the resonances of thesediads and, therefore, represents only an average com-position of the structural units present in the sample,without any indication whether these units are presentin the same molecule or in different ones (see for exam-ple Van de Velde et al., 2001). When substituents occurthat not affect characteristic chemical shift pattern ofthe annomeric region, for 13C or 1H-NMR spectro-scopy, they might be identified by typical resonances inother regions of the spectra.1H-NMR spectroscopy with all its advantages, such
as low sample concentrations and short analysis times inparticular is suitable for the quantification of the differ-ent carrageenan types. The a-anomeric protons of themajor carrageenans types (k, i, l, m and n) give signalsin the region 5.1–5.7 ppm, which are easily separated ina high-field instrument. Routine rheological analysis ofthe raw extract completes the commercial-value analysisof the original or alkali-treated carrageenan.In summary, the NMR spectra (1H and 13C) of raw
extracts give good identification of the major type ofcarrageenans produced by the seaweed when comparedwith spectra of ‘‘model’’ carrageenans (Turquois et al.,1996). The availability of equipment with enhanced reso-lution will promote the 1H-NMR spectroscopy for thisuse even more. It is possible that the spectra show minoror trace signals originating from non-precursor ‘‘kinks’’(i.e. non-sulfated a-d-galactose units) which withoutchanging the ‘‘type’’ of carrageenan can modulate itsrheological behaviour.A different approach is used when one focusses on the
system of carrageenans biosynthesised by the seaweed
Table 11. Some of the characteristic splittings due to spin-spin couplings in 1H-NMR spectra of carrageenan oligosaccharides
Proton In residue/sequence Splitting (Hz) Contributing coupling
H1 -G4S- and-G4Sb 7.9 J1,2-G4Sa 3.9 J1,2
H4 -G4S- and-G4Sb 3.3 J3,4-G4Sa 3.1 J3,4-Ga 2.5 J3,4
H1 DA 2.4 J1,2DA2S 2.3 J1,2
H2 DA2S 5.9 J2,3DA 5.4 J2,3
H3 DA 5.4 J2,3H4 DA 1.9 J4,5H5 DA Broad Combinations
A hyphen denotes the remaining chain whereas Greek letters specify the anomeric form. Positions in the chains do only affect shift value.The signals for H5 of 3,6 anhydrogalactose units appear as broad peaks. For actual shift positions see Table 10 and for all coupling con-stants see Knutsen & Grasdalen (1992a). Values for DA2S unpublished.
88 F. van de Velde et al. / Trends in Food Science & Technology 13 (2002) 73–92

or in the determination of the fine structure of a carra-geenan or a carrageenan fraction. The identification of acarrageenan mixture produced by a seaweed requires anelaborate process of extraction and fractionation. Thecomposition and yield of the fractions obtained indicatethe presence of minor components, the dispersion of
structures in the system and the strength of the interac-tion of these molecules in the seaweed tissue. Sub-fractionation, when necessary, gives the different‘‘pieces’’ of a jigsaw puzzle, the solution of which willshow an overall picture of the carrageenan system syn-thesised by the seaweed. In the study of this puzzle,
Fig. 7. (A) 1H-region of the 500 MHz-spectra of a mixture of partly desulfated neocarrbiose type oligosaccharides from Furcellaria-carragee-nan recorded at 25�C. Only selected assignments are denoted on the figure. (B) For comparison a spectrum of the same sample recorded at90�C is included. R-is indicating a remaining part of an oligosaccharide chain towards the non-reducing end and R0 towards the reducing
end. Presented only in (Knutsen, 1992).
Fig. 8. The 1H 500 MHz-spectra of DA–G4S–DA–G4S at 25 and 90�C. Note temperature induced shifts resulting in a less resolved spectrumat high temperature. For assignments see Fig. 6 and Table 10. Presented in (Knutsen, 1992) and partly in (Knutsen & Grasdalen, 1992a).
F. van de Velde et al. / Trends in Food Science & Technology 13 (2002) 73–92 89
NMR spectroscopy plays an important but not allwaysa conclusive role as in the industrial approach. Themain drawback of this methodology in the determina-tion of fine structural details in carrageenans is due tothe complexity of these polymers, their molecular inter-actions and their high molecular weight. Due to its lowsensitivity, 13C-NMR spectroscopy can not detect lowpercentages of minor components. Negative results donot exclude the presence of minor components, forexample the presence of a-l-galactose and/or 3,6-anhy-dro a-l-galactose and the corresponding d/l-hybridsand/or agarans (Estevez et al., 2001). The 1H-NMRspectra of complex polysaccharides usually show broadresonances, sometimes overlapping and difficult to inte-grate. In the case of carrageenans the diads can berecognised by the resonances of the a-anomeric protons(Feldman, Storz, Vigna, & Cerezo, 1994).A new approach to evaluate 13C-NMR spectro-
scopical data for the structural analysis of red algalgalactans was suggested recently (Miller & Blunt,2000a,b). This approach is based on the availability of alarge number of 13C-NMR spectra of different wellcharacterised galactans. The 13C-NMR spectrum of apolysaccharide with an unknown structure is assignedby a mathematical procedure that determines the best fitbetween the experimental spectrum and the elements ofthe database of spectra of characterised galactans. Inspite of rather complicated mathematical terminologyused, in principle the approach seems to be fruitful, buthas some marked experimental limitations, since it isdifficult to carry out desulfation and methylation stepsquantitatively. Incomplete chemical modifications may,of course, result in undesirable complication of spectra.Nevertheless, several examples of successful applicationof this approach to the elucidation of structures ofcomplex galactans, including d/l-hybrids (Miller,2001a; Miller & Blunt, 2000c) and an unusual carragee-nan (Miller,2001b), are found in the literature.Most of these problems can be overcome by selective
modification of the molecules (i.e. desulfation) or byselective, if not specific, fragmentation of the carrageenanmolecule. These fragmentations can be carried outthrough enzymatic or chemical methods (see Box 2). Bydegrading carrageenans with structure-specific enzymes aseries of sulfated oligosaccharides of known structure isformed. However, since carrageenan molecules in generalare hybrids and also may contain ‘‘abnormal’’ unitsinterspersed in the backbone some larger fragments,resistant to enzymolysis and with a size depending on inwhich sequence they occur will be enriched. These aresuitable samples for NMR analysis as they concentratethese unusual minor details. However this might be achallenging task, since complex molecules stronglydeviating from a regular sequence might occur, especiallyin carrageenan precursor rich molecules. In such cases theapplication of 1H-NMR spectroscopy, will result in higher
sensitivity, more reliable integration of the signals andhence the best possible quantitative results. In mostcases some complementary methods for identification ofconstituents in the sample like methylation analysis (Fal-shaw et al., 2001; Falshaw& Furneaux, 1994) or reductivehydrolysis (Jol, Neiss, Penninkhof, Rudolf, & DeRuiter,1999) or the use 13C NMR or 2D-NMR techniques mustbe performed simultaneously. Finally if high resolved 13C-NMR spectra can be obtained from such fractions somecrucial insight into the sequential nature of a carrageenanand its biosynthesis might be obtained.
AcknowledgementsThe authors gratefully acknowledge Dr. Brian
Rudolph (CPKelco, Lille Skensved, Denmark) for pro-viding the n-carrageenan sample. Dr. Henk A. Schols(Wageningen University and Wageningen Centre forFood Sciences, The Netherlands) and Dr. Gerhard A.de Ruiter (NIZO food research, The Netherlands) areacknowledged for their helpful discussions and criticalreading of the manuscript.
References
Anderson, W., & Bowtle, W. (1974). Determination of iota-carrageenan with 2-thiobarbituric acid. Analyst, 99, 178–183.
Barbeyron, T., Flament, D., Michel, G., Potin, P., & Kloareg, B. (2001).The sulphated-galactan hydrolases, agarases and carrageenases:structural biology and molecular evolution. Cahiers de BiologicMarine, 42, 169–183.
Bellion, C., Brigand, G., Prome, J.-C., & Bociek, D. W. S. (1983).Identification et caracterisation des precurseurs biologiques descarraghenanes par spectroscopie de RMN-13C. CarbohydrateResearch, 119, 31–48.
Bhattacharjee, S. S., Yaphe, W., & Hamer, G. K. (1978). 13C-NMRspectroscopic analysis of agar, kappa-carrageenan and iota-carrageenan. Carbohydrate Research, 60, C1–C3.
Bixler, H. J. (1996). Recent developments in manufacturing andmarketing carrageenan. Hydrobiologia, 326/327, 35–57.
Bock, K., Pedersen, C., & Pedersen, H. (1984). Carbon-13 nuclearmagnetic resonance data for oligosaccharides. Advances inCarbohydrate Chemistry and Biochemistry, 42, 193–225.
Caram-Lelham, N., Sundelof, L. O., & Andersson, T. (1995). Pre-prative separation of oligosaccharides from kappa-carrageenan,sodium hyaluronate, and dextran by Superdex (TM) 30 prepgrade. Carbohydrate Research, 273, 71–76.
Chiovitti, A., Bacic, A., Craik, D. J., Munro, S. L. A., Kraft, G. T., &Liao, M.-L. (1997). Cell-wall polysaccharides from Australian redalgae of the family Solieriaceae (Gigartinales, Rhodophyta):novel, highly pyruvated carrageenans from the genusCallophycus. Carbohydrate Research, 299, 229–243.
Chiovitti, A., Bacic, A., Craik, D. J., Kraft, G. T., Liao, M.-L., Falshaw,R., & Furneaux, R. H. (1998). A pyruvated carrageenan fromAustralian specimens of the red alga Sacronema filiforme.Carbohydrate Research, 299, 229–243.
Chiovitti, A., Bacic, A., Craik, D. J., Munro, S. L. A., Kraft, G. T., &Liao, M.-L. (1998). Carrageenans with complex substitution pat-terns from red algae of the genus Erythroclonium. CarbohydrateResearch, 305, 243–252.
Ciancia, M., Matulewicz, M. C., Finch, P., & Cerezo, A. S. (1993).Determination of the structures of cystocarpic carrageenansfrom Gigartina skottsbergii by methylation analysis and NMRspectroscopy. Carbohydrate Research, 238, 241–248.
90 F. van de Velde et al. / Trends in Food Science & Technology 13 (2002) 73–92

Ciancia, M., Matulewicz, M. C., Stortz, C. A., & Cerezo, A. S. (1991).Room temperature, low field 13C NMR spectra of degraded car-rageenans. Part II. On the specificity of the autohydrolysis reac-tion in kappa/iota and mu/nu structures. International Journal ofBiological Macromolecules, 13, 337–340.
Ciancia, M., Noseda, M. D., Matulewicz, M. C., & Cerezo, A. S.(1993). Alkali-modification of carrageenans: mechanism andkinetics in the kappa/iota-, mu/nu- and lambda-series. Carbo-hydrate Polymers, 20, 95–98.
Colson, P., Jennings, H. J., & Smith, J. C. P. (1974). Composition,sequence, and conformation of polymers and oligomers ofglucose as reveal by carbon-13 nuclear magnetic resonance.Journal of the American Chemistry Society, 96, 8081–8087.
De Ruiter, G. A., Richard, O., Rudolph, B., Genicot, S., Kloareg, B.,Penninkhof, B., and Potin, P. (2000). Sulfohydrolases, corre-sponding amino acid and nucleotide sequences, sulfohydrolasepreparations, processes, and products thereof. World Patentapplication: WO0068395.
De Ruiter, G. A., & Rudolph, B. (1997). Carrageenan biotechnology.Trends in Food Science & Technology, 8, 389–395.
Estevez, J. M., Ciancia, M., & Cerezo, A. S. (2001). dl-Galactanhybrids and agarans from gametophytes of the red seaweedGymnogongrus torulosus. Carbohydrate Research, 331, 27–41.
Falshaw, R., Bixler, H. J., & Johndro, K. (2001). Structure and perfor-mance of commercial kappa-2 carrageenan extracts I. Structureanalysis. Food Hydrocolloids, 15, 441–452.
Falshaw, R., & Furneaux, R. (1994). Carrageenan from the tetra-sporic stage of Gigartina decipiens (Gigartinaceae, Rhodophyta).Carbohydrate Research, 252, 171–182.
Falshaw, R., & Furneaux, R. H. (1995). Carrageenans from thetetrasporic stages of Gigartina clavifera and Gigartina alveata(Gigartinaceae, Rhodophyta). Carbohydrate Research, 276,155–165.
Falshaw, R., Furneaux, R. H., Wong, H., Liao, M.-L., Bacic, A., &Chandrkrachang, S. (1996). Structural analysis of carrageenansfrom Burnese and Thai samples of Catenella nipae Zanardini.Carbohydrate Research, 285, 81–98.
Feldman, S. C., Stortz, C. A., Vigna, M. S., & Cerezo, A. S. (1994).Carrageenans in the ‘‘sterile’’ stage from Gigartina skottsbergii.Anales de la Asociacion Quimica Argentina, 82, 117–124.
Glicksman, M. (1983). Food Hydrocolloids, Vol. 2: Seaweed Extracts(pp. 89). Boca Raton: CRC Press Inc.
Grasdalen, H. (1983). High-field, 1H-n.m.r. spectroscopy of alginate:Sequential structure and linkage conformations. CarbohydrateResearch, 118, 255–260.
Grasdalen, H., & Painter, T. J. (1980). NMR studies of compositionand sequence in legume-seed galactomannans. CarbohydrateResearch, 81, 59–66.
Greer, C. W., Rochas, C., & Yaphe, W. (1985). Iota-carrageenanoligosaccharides as model compounds for structural analysis ofiota-carrageenan by 13C-NMR spectroscopy. Botanica Marina, 28,9–14.
Greer, C. W., Shomer, I., Goldstein, M. E., & Yaphe, W. (1984).Analysis of carrageenan from Hypnea musciformis by usingkappa- and iota-carrageenases and 13C-N. M.R. spectroscopy.Carbohydrate Research, 129, 189–196.
Hansen, J.H., Larsen, H., & Grøndal, J. (2000). Carrageenan compo-sitions and methods for their production. US patent application:US 6,063,915.
Hjerde, T., Kristiansen, T. S., Stokke, B. T., Smidsrød, O., &Christensen, B. E. (1994). Conformation dependent depolymer-ization kinetics of polysaccharides studied by viscositymeasurements. Carbohydrate Polymers, 24, 265–275.
Imeson, A. P. (2000). Carrageenan. In G. O. Phillips, & P. A. Williams(Eds.), Handbook of hydrocolloids (pp. 87–102). Cambridge:Woodhead Publishing Ltd.
Jol, C. N., Neiss, T. G., Penninkhof, B., Rudolph, B., & De Ruiter, G. A.
(1999). A novel high-performance anion-exchange chromato-graphic method for the analysis of carrageenans and agarscontaining 3,6-anhydrogalactose. Analytical Biochemistry, 268,213–222.
Knutsen, S.H. (1992). Isolation and analysis of red algal galactans.PhD thesis, Univerisy of Trondheim, Trondheim, Norway
Knutsen, S. H., & Grasdalen, H. (1987). Characterization of water-extractable polysaccharides from Norwegian Furcellarialumbricalis (Huds) L. (Gigartinales, Rhodophyceae) by IR andNMR spectroscopy. Botanica Marina, 30, 497–505.
Knutsen, S. H., & Grasdalen, H. (1992a). The use of neocarrabioseoligosaccharides with different length and sulphate substitutionas model compounds for 1H-NMR spectroscopy. CarbohydrateResearch, 229, 233–244.
Knutsen, S. H., & Grasdalen, H. (1992b). Analysis of carrageenans byenzymic degradation, gel filtration and 1H NMR spectroscopy.Carbohydrate Polymers, 19, 199–210.
Knutsen, S. H., Murano, E., D’Amato, M., Toffanin, R., Rizzo, R., &Paoletti, S. (1995). Modified procedures for extraction andanalysis of carrageenan applied to the red alga Hypneamusciformis. Journal of Applied Phycology, 7, 565–576.
Knutsen, S. H., Myslabodski, D. E., & Grasdalen, H. (1990). Char-acterization of carrageenan fractions from Norwegian Furcellarialumbricalis (Huds) L. by 1H-NMR spectroscopy. CarbohydrateResearch, 206, 367–372.
Knutsen, S. H., Myslabodski, D. E., Larsen, B., & Usov, A. I. (1994).A modified system of nomenclature for red algal galactans.Botanica Marina, 37, 163–169.
Knutsen, S. H., Sletmoen, M., Kristensen, T., Barbeyron, T.,Kloareg, B., & Potin, P. (2001). A rapid method for theseparation and analysis of carrageenan oligosaccharidesreleased by iota- and kappa-carrageenase. CarbohydrateResearch, 331, 101–106.
Kolender, A. A., Pujol, C. A., Damonte, E. B., Matulewicz, M. C., &Cerezo, A. S. (1997). The system of sulfated alpha-(1->3)-linkedD-mannans from the red seaweed Nothogenia fastigiata: struc-tures, antiherpetic and anticoagulant properties. CarbohydrateResearch, 304, 53–60.
Kovac, P., Hitsch, J., Shashkov, A. S., Usov, A. I., & Yarotsky, S. V.(1980). 13C-NMR spectra of xylo-oligosaccharides and theirapplication to the elucidation of xylan structure. CarbohydrateResearch, 85, 177–185.
Lahaye, M., Yaphe, W., & Rochas, C. (1985). 13C NMR spectralanalysis of sulfated and desulfated polysaccharides of the agartype. Carbohydrate Research, 143, 240–245.
Lahaye, M., Yaphe, W., Viet, M. T. P., & Rochas, C. (1989). 13C NMRspectroscopic investigation of methylated and charged agaroseoligosaccharides and polysaccharides. Carbohydrate Research,190, 249–265.
Liao, M.-L., Chiovitti, A., Munro, S. L. A., Craik, D. J., Kraft, G. T., &Bacic, A. (1996). Sulfated galactans from Australian specimensof the red alga Phacelocarpus peperocarpos (Gigartinales,Rhodophyta). Carbohydrate Research, 296, 237–247.
Liao, M.-L., Kraft, G.-T., Munro, S.-L. A., Craik, D.-J., & Bacic, A.(1993). Beta/kappa-carrageenans as evidence for continuedseparation of the families Dicranemataceae and Sarcodiaceae(Gigartinales, Rhodophyta). Journal of Phycology, 29, 833–844.
McCandless, E. L., West, J. A., & Guiry, M. D. (1982). Carrageenanpatterns in the Gigartinaceae. Biochemical Systematics andEcology, 10, 275–284.
McLean, M. W., & Williamson, F. B. (1979). kappa-Carrageenasefrom Pseudomonas carrageenovora. European Journal ofBiochemistry, 93, 553–558.
McNaught, A. D. (1997). Nomenclature of carbohydrates.Carbohydrate Research, 297, 1–92.
Michel, G., Flament, D., Barbeyron, T., Vernet, T., Kloareg, B., &Dideberg, O. (2000). Expression, purification, crystallization and
F. van de Velde et al. / Trends in Food Science & Technology 13 (2002) 73–92 91
preliminary X-ray analysis of the i-carrageenase fromAlteromonas fortis. Acta Crystallographica Section D – BiologicalCrystallography, 56, 766–768.
Miller, I. J. (1997). The chemotaxonomic significance of the water-soluble red algal polysaccharides. Recent Research Develop-ments in Phytochemistry, 1, 531–565.
Miller, I. J. (1998). The structure of a pyruvylated carrageenanextracted from Stenogramme interrupta as determined by13C NMR spectroscopy. Botanica Marina, 41, 305–315.
Miller, I. J. (2001a). The structure of the polysaccharide fromHymenocladia sanguinea through 13C NMR spectroscopy.Botanica Marina, 44, 245–251.
Miller, I. J. (2001b). The structure of the carrageenan extracted fromthe tetrasporophytic form of Stenogramme interrupta. BotanicaMarina, 44, 583–587.
Miller, I. J., & Blunt, J. W. (2000a). New C-13 NMR methods fordetermining the structure of algal polysaccharides. Part 1. Theeffect of substitution on the chemical shifts of simple diadgalactans. Botanica Marina, 43, 239–250.
Miller, I. J., & Blunt, J. W. (2000b). New C-13 NMR methods fordetermining the structure of algal polysaccharides. Part 2.Galactans consisting of mixed diads. Botanica Marina, 43,251–261.
Miller, I. J., & Blunt, J. W. (2000c). New C-13 NMR methods fordetermining the structure of algal polysaccharides. Part 3. Thestructure of the polysaccharide from Cladhymenia oblongifolia.Botanica Marina, 43, 263–271.
Morrice, L. M., McLean, M. W., Long, W. F., & Williamson, F. B.(1983). Porphyran primary structure. An investigation usingß-agarase I from Pseudomonas atlantica and 13C NMR spectro-scopy. European Journal of Biochemistry, 673–684.
Noseda, M.D. (1994). Polissacarideos sulfatados isolados da fasetetrasporofitica de Gigartina skottsbergii. PhD thesis, Uni-versidade Federal do Parana, Brasil
Noseda, M. D., & Cerezo, A. S. (1993). Room temperature, low filed13C NMR spectra of degraded carrageenans. Part III. Auto-hydrolysis of a lambda carrageenan and of its alkali-treatedderivative. International Journal of Biological Macromolecules, 15,177–181.
Østgaard, K., Wangen, B. F., Knutsen, S. H., & Aasen, I. M. (1993).Large-scale production and purification of kappa-carrageenasefrom Pseudomonas carrageenovora for applications in seaweedbiotechnology. Enzyme and Microbial Technology, 15, 326–333.
Potin, P., Richard, C., Barbeyron, T., Henrissat, B., Gey, C., Petillot,Y., Forest, E., Dideberg, O., Rochas, C., & Kloareg, B. (1995). Pro-cessing and hydrolytic mechanism of the cgkA-encoded kappa-carrageenase of Alteromonas carrageenovora. European Journalof Biochemistry, 228, 971–975.
Roberts, M. A., & Quemener, B. (1999). Measurement of carragee-nans in food: challenges, progress, and trends in analysis. Trendsin Food Science & Technology, 10, 169–181.
Rochas, C., & Heyraud, A. (1981). Acid and enzymic hydrolysis ofkappa-carrageenan. Polymer Bulletin, 5, 17–21.
Rochas, C., Rinaudo, M., & Vincendon, M. (1983). Spectroscopiccharacterization and conformation of oligo kappa carrageenans.International Journal of Biological Macromolecules, 5, 111–115.
Rochas, C., Taravel, F.-R., & Turquois, T. (1990). NMR studies ofsynergistic kappa-carrageenan-carob galactomannan gels.International Journal of Biological Macromolecules, 12, 353–358.
Rudolph, B. (2000). Seaweed product: red algae of economic sig-nificance. In R. E. Martin, E. P. Carter, L. M. Davis, & G. J. Flich(Eds.), Marine and Freshwater Products Handbook (pp. 515–529).Lancaster, USA: Technomic Publishing Company, Inc.
Sletmoen, M. (2000). Structural investigation of oligosaccharidesusing gel filtration, NMR and MS. A study of carrageenan andspecific carrageenases. Master-thesis, Agricultural University ofNorway, As, Norway
Stortz, C. A., Bacon, C. E., Cherniak, R., & Cerezo, A. S. (1994). High-field NMR spectroscopy of cystocarpic and tetrasporic carra-geenans form Iridaea undulosa. Carbohydrate Research, 261,317–326.
Stortz, C. A., & Cerezo, A. S. (1991). Room-temperature, low-fieldC-13-NMR spectra of degraded kappa-iota-carrageenans.International Journal of Biological Macromolecules, 13,101–104.
Stortz, C. A., & Cerezo, A. S. (1992). The 13C NMR spectroscopy ofcarrageenans: calculation of chemical shifts and computer-aidedstructural determination. Carbohydrate Polymers, 18, 237–242.
Stortz, C. A., & Cerezo, A. S. (2000). Novel findings in carrageenans,agaroids and ‘‘hybrid’’ red seaweed galactans. Current TopicsPhytochemistry, 4, 121–133.
Therkelsen, G. H. (1993). Carrageenan. In R. L. Whistler, & J.N. BeMiller (Eds.), Industrial Gums: Polysaccharides and theirDerivatives (pp. 145–180). San Diego: Academic Press Inc.
Turquois, T., Acquistapace, S., Arce-Vera, F., & Welti, D. H. (1996).Composition of carrageenan blends inferred from 13C-NMRand infrared spectroscopy. Carbohydrate Polymers, 31,269–278.
Usov, A. I. (1984). NMR spectroscopy of red seaweed poly-saccharides: agars, carrageenans, and xylans. Botanica Marina,27, 189–202.
Usov, A. I. (1998). Structural analysis of red seaweed galactansof agar and carrageenan groups. Food Hydrocolloids, 12,301–308.
Usov, A. I., & Dobkina, I. M. (1991). Polysaccharides of algae. 43.Neutral xylan and sulfated xylomannan from the red alga Liagoravalida. Bioorganiceskaja Khimija, 17, 1051–1058.
Usov, A. I., & Shashkov, A. S. (1985). Polysaccharides of algae. 34.Detection of iota-carrageenan in Phyllophora brodiaei (Turn.)J.Ag. (Rhodophyta) using 13C-NMR spectroscopy. BotanicaMarina, 28, 367–373.
Usov, A. I., Yarotsky, S. V., & Shashkov, A. S. (1980). 13C-NMRspectroscopy of red algal galactans. Biopolymers, 19, 977–990.
Van de Velde, F., & De Ruiter, G. A. (2002). Carrageenan. InA. Steinbuchel, S. DeBaets, & E. J. VanDamme (Eds.), Biopolymers(Vol. 6) Polysaccharide II Polysaccharides from Eukaryotes(pp. 245–274). Weinheim: Wiley-VCH.
Van de Velde, F., Peppelman, H. A., Rollema, H. S., & Tromp, R. H.(2001). On the structure of kappa/iota-hybrid carrageenans.Carbohydrate Research, 331, 271–283.
Van de Velde, F., Rollema, H.S., Grinberg, N.V.,Burova, T.V.Grinberg, V.Ya., & Tromp, R.H. (in press). Coil-helix transitionof iota-carrageenan as a function of chain regularity.Biopolymers
Welti, D. (1977). Carrageenans. Part 12. The 300 MHz proton mag-netic resonance spectra of methyl beta-d-galactopyranoside,methyl 3,6-anhydro-alpha-d-galactopyranoside, agarose,kappa-carrageenan, and segments of iota-carrageenanand agarose sulfate. Journal of Chemical Research (M),3566–3587.
Wong, K. F., & Craigie, J. S. (1978). Sulfohydrolase activity andcarrageenan biosynthesis in Chondrus crispus (Rhodophyceae).Plant Physiology, 61, 663–666.
Yaphe, W., & Arsenault, G. P. (1965). Improved resorcinolreagent for the determination of fructose, and3,6-anhydrogalactose in polysaccharides. AnalyticalBiochemistry, 13, 143–148.
Yamada, T., Ogamo, A., Saito, T., Watanabe, J., Uchiyama, H., &Nakagawa, Y. (1997). Preparation and anti-HIV activity of low-molecular-weight carrageenans and their sulfated derivatives.Carbohydrate Polymers, 32, 51–55.
Yarotsky, S. V., Shashkov, A. S., & Usov, A. I. (1977). Analysis of13C-NMR spectra of some red seaweed galactans. Bioorgani-ceskaja Khimija, 4, 1135–1137.
92 F. van de Velde et al. / Trends in Food Science & Technology 13 (2002) 73–92