Embed Size (px)
Citation preview

Journal of Membrane Science 182 (2001) 77–90
Reverse osmosis filtration for space mission wastewater:membrane properties and operating conditions
Sangho Lee, Richard M. Lueptow∗Department of Mechanical Engineering, Northwestern University, Evanston, IL, 60208, USA
Received 16 May 2000; received in revised form 20 July 2000; accepted 8 August 2000
Abstract
Reverse osmosis (RO) is a compact process that has potential for the removal of ionic and organic pollutants for recyclingspace mission wastewater. Seven candidate RO membranes were compared using a batch stirred cell to determine the membraneflux and the solute rejection for synthetic space mission wastewaters. Even though the urea molecule is larger than ions suchas Na+, Cl−, and NH4
+, the rejection of urea is lower. This indicates that the chemical interaction between solutes andthe membrane is more important than the size exclusion effect. Low pressure reverse osmosis (LPRO) membranes appearto be most desirable because of their high permeate flux and rejection. Solute rejection is dependent on the shear rate,indicating the importance of concentration polarization. A simple transport model based on the solution–diffusion modelincorporating concentration polarization is used to interpret the experimental results and predict rejection over a range ofoperating conditions. © 2001 Elsevier Science B.V. All rights reserved.
Keywords:Water treatment; Reverse osmosis; Concentration polarization; Rejection
1. Introduction
For long-duration space missions, a Water Recov-ery and Management System (WRMS) will be neces-sary to reduce the dependency on resupply of waterand provide an ongoing safe and healthy water sup-ply [1]. Early space missions were of such short du-ration that stored water was used for the mission. Butthis approach cannot be applied to missions of longduration or having large crews [2]. Thus, recycling ofwastewater to produce potable water as well as wa-ter for washing will be crucial in long term spacemissions.
However, it is quite difficult to produce high qua-lity water from the space mission wastewater. Fig. 1
∗ Corresponding author.E-mail address:[email protected] (R.M. Lueptow).
shows the contribution to the wastewater streams inmanned spacecraft [3]. The inputs to the wastewaterstream include waste hygiene water, condensate wa-ter, and urine. The pollutants in the wastewater canpose a threat to human health. Organic and inorganiccontaminants such as urea, ammonia, halogenatedcarbons, and heavy metals are of concern becauseof their harmful effects on humans. Microorganismsthat may be pathogenic or clog water lines are alsoof concern. Furthermore, design requirements of theWRMS are very stringent [4]. The WRMS should beinherently reliable, capable, and efficient. The use ofexpendables should be minimal. Minimizing the totalweight, volume, power consumption, and cost of thesystem while ensuring safe operation is necessary.Mass loop closure, in which nearly all water is re-claimed, is essential for long-term missions. Althoughvarious technologies have been attempted for the
0376-7388/01/$ – see front matter © 2001 Elsevier Science B.V. All rights reserved.PII: S0376-7388(00)00553-6

78 S. Lee, R.M. Lueptow / Journal of Membrane Science 182 (2001) 77–90
Nomenclature
Am Membrane area (m2)Cb Solute concentration in the bulk
phase (kg/m3)Cf Feed concentration (kg/m3)Cm Solute concentration at membrane
surface (kg/m3)Cp Solute concentration at permeate
side (kg/m3)Dsw Diffusion coefficient of solute (m2/s).fc Concentration factorJs Solute flux (m/s)Jv Solvent flux (m/s)k Mass transfer coefficient on high
pressure side of membraneLs Solute transport parameter (m/s)Lv Solvent transport parameter (m2-s/kg)1P Transmembrane pressure (Pa)1Peff Effective transmembrane pressure (Pa)r Radius of stirred cell (m)R Solute rejectiont Time (s)Vc Volume of concentrate (m3)Vf Volume of initial feed (m3)Vp Volume of total permeate (m3)
Greek lettersΠ (Cm) Osmotic pressures at the solute
concentration ofCm (Pa)Π (Cp) Osmotic pressures at the solute
concentration ofCp (Pa)ρ Solution density (kg/m3)µ Solvent viscosity (kg/m-s)ω Stirring velocity (rad/s)
wastewater recycling in space [5–8], few technologiesmeet the stringent requirements for space application.
Recently, reverse osmosis (RO) membrane techno-logy has drawn attention because of its advantagesover other processes. RO membrane filtration is aregenerable technology that requires replacement farless often than conventional filtration (usually 1–2 peryear in commercial membrane plants). RO filtrationalso removes ions, proteins, and organic chemicals
which are generally very difficult to remove using con-ventional treatment. Moreover, RO is an absolute fil-tration method, so its treatment efficiency and perfor-mance are stable and predictable.
However, there are several problems to be resolvedin the application of RO membranes to a WRMS. Thephysico-chemical basis for RO is much more complexthan for other filtration techniques. Rejection by ROdepends on the physical chemistry of the solvent, so-lute, and membrane as well as physical size differencebetween solute and membrane pore. For ionic solutes,the degree of separation depends not only on the hy-drated size of the ion, but also on the ionic charge. Fororganic solutes, the chemical affinity of the solute forthe membrane material is as important as the molec-ular weight of the solute. Therefore, a fundamentalunderstanding of the chemical and physical mecha-nisms governing the rejection of pollutants in spacemission wastewater by RO is of paramount practicalimportance.
Determination of the optimum operating condi-tion is another important issue, especially for theapplication of wastewater recycle and reuse [9–11].Since space and energy are quite restricted in spacemissions, the operating conditions such as transmem-brane pressure and shear rate should be carefullyselected.
The objective of this research is to establish thecharacteristics of RO membranes for the rejection oforganic and inorganic compounds in space missionwastewater. The results are analyzed in terms of thecombined film theory/solution–diffusion theory.
2. Experimental methods
Seven RO membranes were compared in terms oftheir effectiveness in treating synthetic wastewaterusing a batch stirred cell. Two wastewater solutionswere used as model synthetic wastewater, as shownin Table 1. The chemical composition of the syn-thetic wastewater was based on analysis of actualwastewater in spacecraft [6,12]. Wastewater A rep-resents the wastewater before ammonification. Thewastewater includes a high concentration of urea aswell as NaCl and NASA body soap (sodium–coconutacid–N-methyl taurate). Wastewater B represents thewastewater after ammonification. Urea and crea-

S. Lee, R.M. Lueptow / Journal of Membrane Science 182 (2001) 77–90 79
Fig. 1. Daily wastewater inputs to the Water Recovery and Management System for one person [3].
tine were replaced by ammonium carbonate so thatthe total concentration of nitrogen was the same asWastewater A. All other compounds (NASA bodysoap and NaCl) were maintained at the same con-centration in both wastewater solutions. All syntheticwastewater was used within 8 h to prevent any changein composition.
Membrane characteristics for the seven RO mem-branes that were tested are listed in Table 2. All mem-branes were of the thin film composite (TFC) type.The polymer make-up of the membranes accordingto the manufacturers is polyamide except NTR729HF,which is made of polyvinyl alcohol.
The experiments were performed in batch mode us-ing a stirred cell as shown in Fig. 2. A stirred cell mod-ule was used because the shear stress could be easilycontrolled. The stirred cell was made of aluminum
Table 1Composition of synthetic wastewater
Components Dosage (mg/l) Theoretical TOC (mg/l) Theoretical total nitrogen (mg/l)
Wastewater AUrea 2000 400 932Creatine 200 85 74NASA body soap 2000a 100 38NaCl 1000 0 0Total 5200 585 1044
Wastewater B(NH4)2CO3 3429 0 1000NASA body soap 2000a 100 38NaCl 1000 0 0Total 6429 100 1038
a 2000 mg/l dosage of the NASA soap corresponds to 162.6 mg/l as linear alkylbenzene sulfonate (LAS) according to HACH detergentanalysis method (crystal violet method).
and coated with Teflon to improve chemical stability.The diameter of the stirred cell was 54 mm and theworking volume was 50 ml. A magnetic stirrer (Stirrerassembly 8200, Millipore, USA) was positioned justabove the membrane. The length of the stirring barwas 52 mm. The working pressure was controlled by ahigh pressure nitrogen cylinder and by a gas pressureregulator. The stirring speed was controlled by a mag-netic stirrer plate. The temperature of the feed solutionwas adjusted to 20–25◦C and the effect of tempera-ture on viscosity and density was corrected. Since theexperiment was performed in a short time (normallyless than 30 min), the variations of the temperatureduring an experiment were smaller than±1◦C.
A fresh membrane was first rinsed by letting it floatskin-side down in distilled water for 30 min. Then itwas placed in the stirred cell. The stability of the mem-

80 S. Lee, R.M. Lueptow / Journal of Membrane Science 182 (2001) 77–90
Table 2List of RO membranes and their characteristics obtained from manufacturers
Type of RO Membrane pH range Normal/maximum operating pressure (kPa)
Product name Manufacture
Brackish water BW30 Dow 2–11 1550/6000Low pressure ESPA Hydranautics 3–10 1050/4160Nanofiltration NTR729HF Hydranautics 3–10 1550/4000Brackish water ATFRO AMT 3–10 1550/5480Brackish water ATFRO-HR AMT 3–10 1550/5480Brackish water HR95 DDS 3–10 –Low pressure ACM4 TriSep corp. 4–11 680/4100
brane permeability during the experiment was checkedby comparing pure water flux before and after the ex-periment. Only those membranes for which perme-ability changes were less than 10% were included inthe data presented here.
The permeate flux was measured using a graduatedcylinder and is expressed in terms of concentrationfactor (fc). The concentration factor, defined as a ratioof the feed volume to concentrate volume, indicatesthe extent of concentration:
fc = Vf
Vc= 1 + Vp
Vc(1)
whereVf , Vc, and Vp are defined as the volume offeed, concentrate, and permeate, respectively. The so-lute concentrations of the permeate were measured atdifferent concentration factors.
After filtration tests, all samples were acidifiedbelow the pH of 2.0 by adding 10% sulfuric acid toprevent the loss of nitrogen compounds for analysis.
Fig. 2. Schematic diagram of stirred cell RO device.
Analysis of ammonium ions was conducted usingthe procedures described in Standard Methods [13].A total organic carbon (TOC) analyzer (DC-180,Dohrmann, USA) was used for measurement of or-ganic contents in the synthetic wastewater and per-meates. The spectrophotometric method of Hach[14] was adapted to measure the total nitrogen con-centration, detergent concentration, and chloride ionconcentration in feed and permeate. In addition, theconcentrations of other ionic compounds were deter-mined by conductivity measurements and were auto-matically corrected for temperature influence. Theseconcentrations were used to calculate the rejectionR,according to
R = 1 − Cp
Cf(2)
whereCp is the concentration in the permeate andCfthe concentration in the feed.
3. Results and discussion
3.1. RO membrane characterization
In order to compare the basic properties of theRO membranes, salt rejection measurements based onelectrical conductivity were carried out for Na2SO4,NaCl and CaCl2 under the following operating con-ditions: the transmembrane pressure, 800 kPa; stirringspeed, 400 rpm; recovery (the ratio of total permeatevolume to initial feed volume), 60%. The results areshown in Fig. 3. These salt rejection measurementspermit the classification of most of the membranesinto two categories, as suggested by Peeters et al. [15]for nanofiltration (NF) membranes:

S. Lee, R.M. Lueptow / Journal of Membrane Science 182 (2001) 77–90 81
Fig. 3. Rejection of different salts for various RO membranes.Operating conditions:1P, 800 kPa; stirring speed, 400 rpm; saltconcentration: 0.02 M; 60% recovery. ((d): ESPA; (j): BW30;(m): NTR729HF; (s): ATFRO; (h): ATFRO-HR; (4): HR95;(e): ACM4).
• Category I: Membranes for which electrostatic in-teraction such as Donnan exclusion plays an impor-tant role.
• Category II: Membranes for which the rejection isdetermined by differences in diffusion coefficientsbetween the salts.
Since the difference between two categories resultsfrom the Donnan effect, this classification represents acharge property of RO membranes: Category I mem-branes have more charge density than Category IImembranes. Membranes falling into Category I havethe salt rejection order typical for a negatively chargedmembrane: R(Na2SO4) > R(NaCl) > R(CaCl2). Themembranes of this category are ESPA, BW30 andNTR729HF, which are designated by filled symbols inFig. 3. The high rejection for the Na2SO4 and the lowrejection for CaCl2 are in accordance to the Donnanexclusion model. This type of rejection sequence hasbeen reported by several other authors and is attributedto the strong negative charge of the membranes [16].
The rejection sequence for Category II mem-branes is caused by differences in diffusion coeffi-cients between the salts. The diffusion coefficientsdecrease from NaCl (1.61 × 10⁻⁹ m2/s) to CaCl2(1.45 × 10⁻⁹ m2/s) to Na2SO4 (1.23 × 10⁻⁹ m2/s)
Fig. 4. Pure water flux for various RO membranes. Operatingconditions:1P, 800 kPa.
[15]. This order of diffusion coefficients is inverselyreflected in the salt rejection order: R(Na2SO4) >
R(CaCl2) > R(NaCl). This salt rejection order ischaracteristic of ATFRO, ATFRO-HR, HR95, andACM4 membranes, designated by open symbols inFig. 3.
The pure water flux for the membranes is shown inFig. 4. The measured pure water flux is 1.2–3-timeshigher than the flux from membrane manufactures,because the flux data from the manufacturers aremeasured in spiral wound modules under differentconditions from those we used. The water fluxes ofthe ESPA and ACM4 membranes are high comparedto other membranes. These membranes also have rel-atively high salt rejection, as indicated in Fig. 3. TheNTR729HF membrane also has high water permeabi-lity, but its salt rejection is low, especially in case ofa divalent cation (CaCl2).
3.2. Comparison of RO membranes using syntheticWastewater A (containing urea)
Fig. 5 shows the decline in the flux with increas-ing concentration factor for the filtration of syntheticWastewater A, which contains urea. The permeate fluxfor the wastewater was significantly reduced comparedto the pure water flux. The flux at a concentration fac-tor of 2.5 was in the range of 13–56%, that for pure

82 S. Lee, R.M. Lueptow / Journal of Membrane Science 182 (2001) 77–90
Fig. 5. Flux decline for reverse osmosis of synthetic Wastewater A(containing urea and creatine) for different membranes. Operatingconditions:1P, 800 kPa; stirring speed, 400 rpm ((d): ESPA; (j):BW30; (m): NTR729HF; (s): ATFRO; (h): ATFRO-HR; (4):HR95; (e): ACM4).
water. Most likely, the osmotic pressure plays a majorrole in the lower flux by reducing the effective trans-membrane pressure.
The compositions of the permeate for the ROmembranes are summarized in Table 3. The rejec-tions are indicated in parentheses. The rejection of
Table 3Comparison of permeate qualities in various RO treatments for synthetic Wastewater Aa
TOC (mg/l) TN (mg/l) Conductivity (mS/cm) Chloride (mg/l) Detergent (mg/l) Average flux (l/m2/h)
Feed 570 980 2.1 553 162.6BW30 183 540 0.24 56.7 2.88 3.9
(0.68) (0.45) (0.88) (0.89) (0.98)ATFRO 193 585 0.185 29.8 1.62 22.1
(0.66) (0.40) (0.91) (0.95) (0.99)ATFRO-HR 113 285 0.063 7.8 0.99 22.0
(0.80) (0.71) (0.97) (0.99) (0.99)ESPA 121 315 0.058 12.65 1.44 31.8
(0.79) (0.68) (0.97) (0.98) (0.99)HR95 238 555 0.111 18.6 1.53 24.8
(0.58) (0.43) (0.94) (0.97) (0.99)NTR729HF 318 735 0.434 130.6 5.46 33.0
(0.44) (0.25) (0.79) (0.76) (0.97)ACM4 117 254 0.109 35 1.53 28.4
(0.79) (0.74) (0.95) (0.94) (0.99)
a Concentration factor: 2.5; ( ): rejection.
detergent was over 0.97 for all membranes. This isbecause the detergent molecules in NASA body soap(mainly sodium–coconut acid–N-methyl taurate) arelarge enough to be rejected via size exclusion formost RO membranes. According to Archer et al. [17],over 0.95 detergent rejection can be obtained evenusing NF membranes. The ion rejection, measuredas conductivity and chloride rejection, was also high.The exception is the NTR729HF membrane, which isa NF membrane and is thus expected to have a largersalt permeability.
Rejections of total organic carbon (TOC) and to-tal nitrogen (TN) were not as high as the rejectionof detergent and ions. TOC rejections ranged from0.44 (NTR729HF) to 0.80 (ATFRO-HR) and TN rejec-tions were from 0.25 (NTR729HF) to 0.74 (ACM4).This indicates that the organic nitrogen compounds,(mainly urea), are rather difficult to reject using ROmembranes. The lower rejection of urea is probablyrelated to the chemical affinity of the urea moleculesto the membrane material.
There is little difference between Category I (ESPA,BW30 and NTR729HF) and Category II membranes(ATFRO, ATFRO-HR, HR95 and ACM4). This isprobably a consequence of the wastewater containingmostly monovalent ions and non-charged organics.Because the Donnan effect becomes important withdivalent ions, the membrane charge properties are oflittle importance for treating the wastewater.
S. Lee, R.M. Lueptow / Journal of Membrane Science 182 (2001) 77–90 83
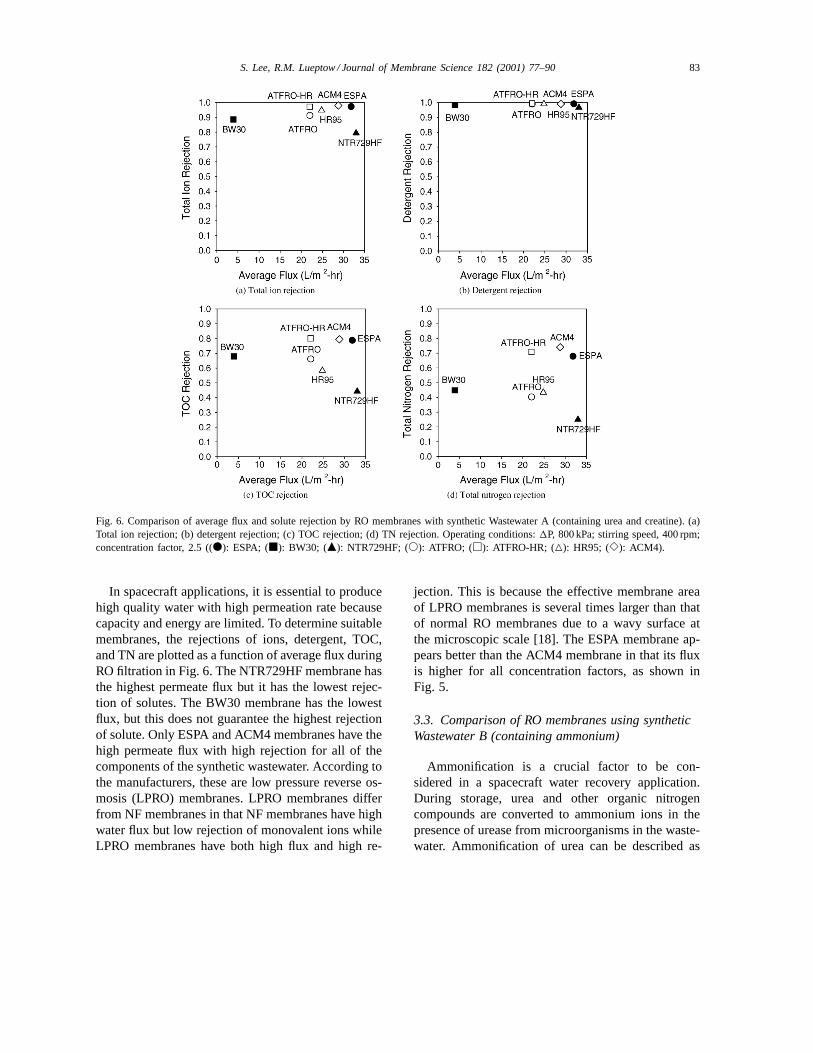
Fig. 6. Comparison of average flux and solute rejection by RO membranes with synthetic Wastewater A (containing urea and creatine). (a)Total ion rejection; (b) detergent rejection; (c) TOC rejection; (d) TN rejection. Operating conditions:1P, 800 kPa; stirring speed, 400 rpm;concentration factor, 2.5 ((d): ESPA; (j): BW30; (m): NTR729HF; (s): ATFRO; (h): ATFRO-HR; (4): HR95; (e): ACM4).
In spacecraft applications, it is essential to producehigh quality water with high permeation rate becausecapacity and energy are limited. To determine suitablemembranes, the rejections of ions, detergent, TOC,and TN are plotted as a function of average flux duringRO filtration in Fig. 6. The NTR729HF membrane hasthe highest permeate flux but it has the lowest rejec-tion of solutes. The BW30 membrane has the lowestflux, but this does not guarantee the highest rejectionof solute. Only ESPA and ACM4 membranes have thehigh permeate flux with high rejection for all of thecomponents of the synthetic wastewater. According tothe manufacturers, these are low pressure reverse os-mosis (LPRO) membranes. LPRO membranes differfrom NF membranes in that NF membranes have highwater flux but low rejection of monovalent ions whileLPRO membranes have both high flux and high re-
jection. This is because the effective membrane areaof LPRO membranes is several times larger than thatof normal RO membranes due to a wavy surface atthe microscopic scale [18]. The ESPA membrane ap-pears better than the ACM4 membrane in that its fluxis higher for all concentration factors, as shown inFig. 5.
3.3. Comparison of RO membranes using syntheticWastewater B (containing ammonium)
Ammonification is a crucial factor to be con-sidered in a spacecraft water recovery application.During storage, urea and other organic nitrogencompounds are converted to ammonium ions in thepresence of urease from microorganisms in the waste-water. Ammonification of urea can be described as

84 S. Lee, R.M. Lueptow / Journal of Membrane Science 182 (2001) 77–90
Fig. 7. Variation of solute rejection with respect to feed pH incase of the Wastewater B (containing NH4
+) for the ESPA mem-brane ((s): total ion rejection; (5): chloride rejection; (h): nitro-gen rejection). Operating conditions:1P, 800 kPa; stirring speed,400 rpm; concentration factor, 2.5.
follows [19]:
CO(NH2)2 + 3H2OUrease→ 2NH4
+ + HCO3− + OH−
(11)
Unlike other biological nitrogen conversions such asnitrification and denitrification, the decomposition ofurea to ammonium is a relatively fast process [12,19].Consequently, the rejection of ammonium ions byRO membranes must also be examined. In order tosimulate the wastewater after ammonification, Waste-water B, which contains ammonium ions insteadof urea and creatine, was tested under experimentalconditions identical to those used for Wastewater A.
The synthetic wastewater containing (NH4)2CO3has a pH of 9.5 because of the bicarbonate ion. Thus,it is important to consider the effect of solution pHon solute rejection. To adjust the pH, 2N sulfuric acidwas added to the wastewater. As shown in Fig. 7, therejection of solutes by the ESPA membrane is depen-dent on the wastewater pH. As the pH of the feed so-lution decreases from 9.5 to 5, the nitrogen rejectionand total ion rejection increase. A further decrease inthe pH, however, results in decreased rejection. Simi-lar results were obtained for the other membranes.
Fig. 8. Flux decline for reverse osmosis of synthetic WastewaterB (containing NH4
+). Operating conditions: DP, 800 kPa; stirringspeed, 400 rpm; concentration factor, 2.5 ((d): ESPA; (j): BW30;(m): NTR729HF; (s): ATFRO; (h): ATFRO-HR; (4): HR95;(e): ACM4).
This result can be explained by considering the equi-librium characteristics of ammonia (NH3) and ammo-nium ions (NH4
+). At high pH, the dominant formof nitrogen compounds is ammonia, which is a neu-tral molecule and difficult to reject by RO. But as thesolution pH decreases, the dominant form is the am-monium ion, because the ammonium ion is weak acid(pKa = 9.3). Since ions can be rejected more easilyby RO, the rejection increases as the pH is decreased.Since the pH adjustment prior to RO filtration resultsin better rejection, all subsequent experiments with thewastewater containing (NH4)2CO3 were conducted af-ter the pH was adjusted to 6.0.
Fig. 8 shows the flux as a function of concentrationfactor for RO filtration of Wastewater B. Comparingto Fig. 5, the initial flux is lower and the flux de-cline is more severe than for Wastewater A. This canbe attributed to a higher osmotic pressure for ammo-nium ions than for urea, which reduces the effectivetransmembrane pressure. The osmotic pressure of thesynthetic Wastewater A is 160 kPa while that of thesynthetic Wastewater B 340 kPa. Not only does thisincrease the rate of decline of flux with concentrationfactor, it reduces the overall flux for Wastewater B.
The rejection of ions, detergent, organic carbon, andnitrogen is illustrated as a function of the permeate

S. Lee, R.M. Lueptow / Journal of Membrane Science 182 (2001) 77–90 85
Fig. 9. Comparison of average flux and solute rejection by RO membranes with synthetic Wastewater B (containing NH4+). (a) Total
ion rejection; (b) detergent rejection; (c) TOC rejection; (d) TN rejection. Operating conditions:1P, 800 kPa; stirring speed, 400 rpm,concentration factor, 2.5; pH, 6.0 ((d): ESPA; (j): BW30; (m): NTR729HF; (s): ATFRO; (h): ATFRO-HR; (4): HR95; (e): ACM4).
flux in Fig. 9 for synthetic Wastewater B. The rejec-tion of nitrogen is significantly increased comparedwith the synthetic wastewater containing urea. Thisreflects the better rejection of ammonium ions thanurea even though ammonium ions are smaller, sinceionic compounds have less affinity to the membranematerial than organic molecules. Like Wastewater A,ions and detergent have high rejection. The rejectionof total organic carbon is also high because the to-tal organic carbon in Wastewater B is in the detergentwhich is easily rejected. Like Wastewater A, there wasalso no significant difference between Category I andII membranes in treating Wastewater B, because thewastewaters contain mostly monovalent ions and or-ganics which are less influenced by the Donnan effect.Again, the charge property of the membrane is nota significant factor to be considered in treating thesewastewaters
As shown in Figs. 5 and 8, the flux for syntheticWastewater B (containing ammonium) is much lowerthan that for synthetic Wastewater A (containing urea).However, the rejection is higher for ammonium thanurea, as demonstrated in Fig. 6(d) and 9(d). The im-provement of nitrogen rejection is much more impor-tant than the decrease in flux, since the ultimate goal isdrinking water production. Thus, naturally occurringhydrolysis of urea is advantageous for production ofpotable water using RO. It also appears that the ESPAmembrane provides the best combination of high re-jection and high flux, regardless of the form of thenitrogen compounds in the wastewater.
4. Theoretical model to predict performance
Although the focus of this research was experimen-tal, we applied the classical solution–diffusion (SD)

86 S. Lee, R.M. Lueptow / Journal of Membrane Science 182 (2001) 77–90
model modified with the concentration polarizationtheory to aid in interpreting the experimental resultsand to predict membrane performance over a widerange of conditions. The solvent flux (Jv) and the so-lute flux (Js) through the membrane are [20]:
Jv = Lv(1P − Π(Cm) + Π(Cp)) (3)
Js = Ls(Cm − Cp) (4)
whereLv andLs are the solvent and solute transportparameters,Cm andCp are the solute concentrationsat membrane surface and permeate side,Π (Cm) andΠ (Cp) are the osmotic pressures at the solute concen-trations ofCm andCp, respectively, and1P the trans-membrane pressure.
The difference betweenCm andCb (the bulk con-centration of solute) results from the concentration po-larization phenomenon. On the basis of the film theoryand from Fick’s law for diffusion, the concentrationprofile near the membrane surface is:
Cm − Cp
Cb − Cp= eJv/k (5)
wherek is the mass transfer coefficient for the backdiffusion of the solute from the membrane to the bulksolution on high pressure side of membrane [21]. Ina stirred cell, the growth of the concentration bound-ary layer is limited by stirring according to the masstransfer coefficient [22]:
k = 0.104
(Dsw
r
) (ωr2ρ
µ
)2/3 (µ
ρDsw
)1/3
(6)
wherer is the stirring radius,ω the stirring speed,ρ thesolution density, andDsw the diffusion coefficient ofsolute. Rearranging Eq. (5), the solute concentrationat the membrane surface can be estimated from thesolute concentration of bulk phase.
In stirred cell filtration,Jv, Cb, andCp are not con-stant because the volume of concentrate (Vc) changescontinuously. The time rate of change ofCb and Vcfor a membrane of areaAm are given by
d(CbVc)
dt= −JvAmCp (7)
dVc
dt= −JvAm (8)
Table 4Comparison of experimental values of solvent transport parameterwith vendor data
Membrane Lv (Measured) Lv (Manufacture)m2-s/kg
BW30 5.21× 10⁻¹² 3.00 × 10⁻¹²
ATFRO 2.03× 10⁻¹¹ 1.37 × 10⁻¹¹
ATFRO-HR 1.12× 10⁻¹¹ 8.14 × 10⁻¹²
ESPA 1.17× 10⁻¹¹ 8.14 × 10⁻¹²
HR95 1.08× 10⁻¹¹ 8.33 × 10⁻¹²
NTR729HF 1.42× 10⁻¹¹ 5.55 × 10⁻¹²
ACM4 1.81 × 10⁻¹¹ 9.92 × 10⁻¹²
with the initial conditionsCb = Cf andV c = V f att = 0, whereCf andVf are the initial feed concentra-tion of solute and feed volume, respectively.
Using the average value of permeate concentrationdefined asCp = Js/Jv, the average rejection fromt1to t2 can be written as using Eq. (2):
R = 1 −[1/(t2 − t1)]
∫ t2t1
Ls(Cm − Cp)dt
[Cf /(t2 − t1)]∫ t2t1
Lv1Peffdt(9)
where1Peff is the effective transmembrane pressure(1P − Π(Cm) + Π(Cp)).
Using the above equations,Lv and Ls can be ob-tained from experimental data to model the rejectionunder a variety of conditions.Lv is easily determinedfrom the measured pure water flux and Eq. (3). Themeasured transport property is compared with vendorperformance data in Table 4. The measuredLv is some-what greater than that specified by the manufacturer,but reasonable given that the manufacturers’ data arefor spiral wound modules which typically have addi-tional pressure losses compared to a stirred cell. It iswell known that the properties of the membrane candeviate substantially from the manufacturer’s specifi-cation [21].
Ls is somewhat more difficult to estimate becausethe solute concentration at the membrane surface (Cm)is not known. To begin, a line is fit to the experimen-tally measured solvent flux to obtain an expressionfor Jv as a function of time, andk is calculated usingEq. (6). Next, Eq. (5) is solved forCm using the mea-sured value forJ v(t = 0) with initial conditions thatthe permeate concentration is zero (Cp = 0) and thebulk concentration is equal to the initial solute con-centration of the feed (Cb = Cf ). Then an iterativeprocess is used to find the value forLs with the goal

S. Lee, R.M. Lueptow / Journal of Membrane Science 182 (2001) 77–90 87
to match the measured rejection. An initial guess forLs is used in Eq. (4) to calculateJs. This is used tocalculateCp = J s/J v at the next time step. Then fi-nite difference forms of Eqs. (7) and (8) are used tocalculateVc andCb at the next time step.Cm is calcu-lated using Eq. (5). The calculations at this time stepare completed with the calculation of the integrands ofEq. (9). This process is repeated for the next time stepbeginning with the calculation ofJs from Eq. (4). Theiterative process is repeated for enough time steps tomodel the full duration of the experiment and providethe value of integrands of Eq. (9) as a function of time.These are integrated according to Eq. (9) to calculatethe rejection corresponding to the initial guess forLs.This process is repeated using a new guess forLs un-til the calculated rejection matches the experimentallymeasured rejection. OnceLv and Ls are found for aset of experimental conditions, they can be used tocalculate the rejection at other conditions.
Lv andLs were calculated for a standard operatingcondition of1P = 800 kPa andω = 400 rpm for theESPA membrane, which appears to be the optimalmembrane for the wastewaters considered here. Thesolvent transport parameter is 2.0 × 10⁻¹¹ m/Pa-s.The solute transport parameters for NaCl and urea forWastewater A are 1.0 × 10⁻⁷ and 2.4 × 10⁻⁶ m/s,respectively. The solute transport parameters for NaCland (NH4)2CO3 and for Wastewater B are 1.6× 10⁻⁷
and 8.5 × 10⁻⁸ m/s, respectively. Using the empi-rical values forLv and Ls, the rejections estimatedfrom the model were compared to the experimen-tal rejections under different operating conditions.The transmembrane pressure ranged from 600 to1200 kPa, and the stirring speed was varied from 100to 600 rpm. As demonstrated in Fig. 10, the mea-sured rejection matches the model results quite wellfor all experimental conditions (points are very nearthe diagonal line), indicating that the model workswell.
The rejections of NaCl and total nitrogen were cal-culated based on the model as a function of stirringspeed and effective transmembrane pressure, whichis defined as the difference between transmembranepressure and osmotic pressure at concentration factorof 2.5. (The effective transmembrane pressure as wedefined here can be less than 0. In this case, a concen-tration factor of 2.5 cannot be achieved). The osmoticpressures at a concentration factor of 2.5 were esti-
Fig. 10. Comparison of experimental and theoretically estimatedrejection for synthetic Wastewaters B (containing NH4
+). Thefilled symbol corresponds to the condition at which the modelingparameter (Ls) was determined. ((s): NaCl; (h): TN).
mated to be 410 kPa for Wastewater A and 560 kPafor Wastewater B.
Fig. 11 shows contours of constant rejection ofions and nitrogen for both wastewaters as a functionof stirring speed and effective transmembrane pres-sure. As expected, the best rejection occurs at highstirring speeds and high transmembrane pressures.However, the dependence of rejection on stirringspeed and transmembrane pressure is not linear. Theclosely spaced contours at low stirring speeds and lowtransmembrane pressures indicate a much strongerdependence under these conditions. This suggeststhat optimal operating conditions are near the elbowof the contours at moderate stirring speeds and trans-membrane pressures rather than at extreme values forthese conditions. For instance, the ion rejection forWastewater B (Fig. 11(c)) is about 0.94 at 300 kPatransmembrane pressure and 300 rpm. Tripling theeffective transmembrane pressure increases the re-jection by less than 1%. Likewise, tripling the stir-ring speed only raises rejection to a little over 0.95.Tripling both transmembrane pressure and stirringspeed only brings the rejection to a little over 0.97.
The ion rejection is similar for both WastewatersA and B. However, nitrogen rejection is quite differ-ent, reflecting the inherently better rejection of ions

88 S. Lee, R.M. Lueptow / Journal of Membrane Science 182 (2001) 77–90
Fig. 11. Contour diagrams of NaCl and total nitrogen rejection at different pressures and stirring speeds. Modeling condition: Membrane,ESPA; concentration factor, 2.5 (a) NaCl rejection for Wastewater A; (b) TN rejection for Wastewater A; (c) NaCl rejection for WastewaterB; (d) TN rejection for Wastewater B.
than organic molecules by the membrane. Regardlessof operating condition the rejection of ammonium iswell over 0.90 for Wastewater B. The rejection ofurea is substantially less. It ranges from below 0.40at low transmembrane pressures and stirring speedsto 0.74 at high transmembrane pressures and stirringspeeds.
An increase in the stirring speed always results inhigher rejection for both wastewaters, although the ef-fect is more important in Wastewater A than Waste-
water B. For example, an increase of stirring speedfrom 200 to 400 rpm at effective transmembrane pres-sure of 400 kPa shows an increase of TN rejectionfrom 0.53 to 0.61 for Wastewater A and that from 0.96to 0.973 for Wastewater B (Fig. 11(b) and (d)). Ofcourse, the increased rejection occurs because the so-lute concentration polarization near membrane surfacedecreases with an increase in stirring speed. The differ-ence between Wastewaters A and B can be attributedto the different values of permeate flux. The flux for

S. Lee, R.M. Lueptow / Journal of Membrane Science 182 (2001) 77–90 89
Fig. 12. Effect of stirring speed on concentration polarization.Modeling condition: membrane, ESPA; concentration factor, 2.5;TN for Wastewater B.
Wastewater A is higher than that for Wastewater B, re-sulting in higher transport of solute to the membraneand greater concentration polarization. Consequently,increased stirring speed is more effective in improv-ing rejection by reducing the concentration polariza-tion for Wastewater A than for Wastewater B.
Increasing the transmembrane pressure at highstirring speeds results in increased rejection for bothwastewaters. However, increasing the transmembranepressure does not improve the rejection at low stir-ring speed. For example, NaCl rejection at 100 rpmfor Wastewater A (Fig. 11(a)) decreases for trans-membrane pressures higher than 200 kPa. This canbe attributed to the permeate flux being an impor-tant factor in addition to concentration polarization.According to solution–diffusion model, the solute re-jection should be increased by an increase in solventflux related to an increased transmembrane pressure.But increased solvent flux also results in greater con-centration polarization. The effect of permeate fluxwithout concentration polarization dominates at highstirring speeds. However, the effect of increased con-centration polarization with increased permeate fluxbecomes important at low stirring speeds.
Fig. 12 shows the effect of stirring rate on the con-centration polarization ratio (Cm/Cb) at the membranesurface based on the model calculation. The calcula-
tion for TN rejection for Wastewater B is presentedas an example. The concentration polarization ratiosin the figure are averaged values over the course ofsimulated experiments. If there were no concentra-tion polarization, the concentration polarization ratiowould be unity. For high transmembrane pressures theconcentration polarization is quite high at low stirringspeeds. But the concentration polarization is sharplyreduced at stirring speeds above 300 rpm. Even at lowtransmembrane pressures, stirring reduces the concen-tration polarization significantly. The practical limitof the stirred batch cell is 600 rpm, so even at themaximum stirring speed, the solute concentration onmembrane surface is three times higher than bulk con-centration when effective transmembrane pressure is1000 kPa. The mass transfer coefficient of the stirredcell at 600 rpm is smaller than some commercial mem-brane modules but has same order of magnitude. Thus,other means of introducing a high shear could be usedin order to further reduce concentration polarization toobtain higher rejection. Dynamic rotating membranefiltration, which can produce a high shear rate [23],may be helpful to obtain high rejection of organic pol-lutants. The rotation of the filter gives rise to a highshear (equivalent to a high stirring speed), which couldsignificantly lower the concentration polarization inRO filtration.
5. Conclusion
In this work, a preliminary study of the applica-tion of RO membranes to a wastewater reuse sys-tem for spacecraft use was performed using laboratoryscale experiments. The following conclusions can bedrawn:
1. Several RO membranes were compared in termsof permeate flux and solute rejection. LPRO mem-branes are most effective to recover wastewaterwith high flux and high solute rejection, regardlessof whether they are Category I or II membranes.
2. Even though very high rejection of detergent anddissolved ions was obtained by RO, the rejectionof TOC and urea was lower. This is because thechemical affinity between solutes and the mem-brane is much more important than the size exclu-sion effect.

90 S. Lee, R.M. Lueptow / Journal of Membrane Science 182 (2001) 77–90
3. Urea hydrolysis, which is a common process duringstorage, plays a significant role in nitrogen rejec-tion. The nitrogen rejection increased significantlyafter urea hydrolysis, since ammonium ions aremore easily rejected by RO membranes than urea.
4. Hydrodynamic operating conditions greatly affectthe rejection of solutes in RO treatment. The re-jection of organic nitrogen compounds should in-crease with increased shear rates near membranesurface. This suggests that the rejection will be fur-ther improved using dynamic membrane filtration.
Acknowledgements
This work was supported by NASA (NASA grantNAG9-1053). The authors thank Ms. Karen Pickeringfor her support and advice regarding the filtration ex-periments. The authors also thank Dr. Deanna Hurumand Ms. Tanita Sirivedhin for their help in chemicalanalysis at the Civil and Environmental EngineeringDepartment, Northwestern University. The authorsalso thank Hydranautics Inc. and Advanced Mem-brane Technology, Inc. for their donation of membranesamples.
References
[1] NASA Lyndon B. Johnson Space Center, Advancedlife support program requirements definition and designconsiderations, CTSD-ADV-245 (Rev A), Houston, TX77058, 1998.
[2] P. Weiland, Design for human presence in space, NASARP-1324, 1995.
[3] T.J. Salavin, M.W. Oleson, Technology tradeoffs related toadvanced mission wastewater processing, Waste Manage. Res.9 (1991) 401–414.
[4] R.C. Cooper, The hygiene aspects of wastewater reuse, WasteManage. Res. 9 (1991) 373–377.
[5] R.B. Dean, Processes for water reclaimation, Waste Manage.Res. 9 (1991) 425–430.
[6] B.W. Finger, L.N. Supra, L. DallBauman, K.D. Pickering,Development and testing of membrane biological wastewaterprocessors, in: Proceedings of International Conference onEnvironmental Systems, SAE paper 1999-01-1947, 1999.
[7] A.D. Williams, C.S. Slater, Recovery of wastewaterin microgravity (space) applications using pervaporationprocesses and volatile rejection membranes, in: Proceedings
of the Fifth International Conference on PervaporationProcesses, Bakish Materials Publishers, Englewood, NJ, 1991,pp. 383–391.
[8] D. Parker, ISS water reclamation system design, in:Proceedings of International Conference on EnvironmentalSystems, July 1999, Denver, CO, USA, Session: InternationalSpace Station ECLSS I System Aspects & Water,1999-01-1950.
[9] C.S. Slater, C.A. Brooks, III Development of a simulationmodel predicting performance of reverse osmosis batchsystems, Separation Sci. Technol. 27 (11) (1992) 1361–1388.
[10] D.J. Demboski, J.H. Benson, G.E. Rossi, N.S. Leavitt,M.A. Mull, Evolutions in U S navy shipboard sewageand graywater programs, in: Proceedings of the ASNEEnvironmental Symposium Environmental Stewardship: Shipsand Shorelines, November 1997.
[11] S. Lee, C.H. Lee, Effect of operating conditions on scaleformation in nanofiltration for water treatment, Water Res.34 (15) (2000) 156–168.
[12] K.D. Pickering, NASA Johnson Space Center, Houston, TX,Personal communication, 1999.
[13] APHA, AWWA and WEF, Standard Methods for theExamination of Water and Wastewater, 18th Edition,American Public Health Association, Washington, DC,1992.
[14] Hach Company, Hach Water Analysis Handbook, 2nd Edition,Hach Company, CO, USA, 1992.
[15] J.M.M. Peeters, J.P. Boom, M.H.V. Mulder, H. Strathmann,Retention measurements of nanofiltration membranes withelectrolyte solutions, J. Membr. Sci. 145 (1998) 199–209.
[16] J. Schaep, C. Vandecasteele, A.W. Mohammad, W.R. Bowen,Analysis of the salt retention of nanofiltration membranesusing the donnan-steric partitioning pore model, SeparationSci. Technol. 34 (15) (1999) 3009–3030.
[17] A.C. Archer, A.M. Mendes, R.A.R. Boaventura, Separation ofan anionic surfactant by nanofiltration, Envrion. Sci. Technol.33 (1999) 2758–2764.
[18] M. Hirose, H. Ito, M. Maeda, K. Tanaka, Highly permeablecomposite reverse osmosis membrane, method of producingthe same, and method of using the same, United States Patent5, 614, 099, 1997.
[19] V.H. Varel, Use of urease inhibitors to control nitrogen lossfrom livestock waste, Biores. Technol. 62 (1997) 11–17.
[20] J.G. Wijmans, R.W. Baker, The solution–diffusion model: areview, J. Membr. Sci. 107 (1995) 1–21.
[21] M. Cherayan, Ultrafiltration and Microfiltration Handbook,Technomic Publishing Co., Lancaster, Basel, 1998.
[22] S. Nicolas, B. Balannec, F. Beline, B. Bariou, Ultrafiltrationand reverse osmosis of small non-charged molecules: acomparison study of rejection in a stirred and an unstirredbatch cell, J. Membr. Sci. 164 (2000) 141–155.
[23] R.M. Lueptow, A. Hajiloo, Flow in a rotating membraneplasma separator, Am. Soc. Artif. Int. Organs J. 41 (1995)182–188.


![Electrocoagulation Technique Used To Treat Wastewater: A ... · chemical precipitation, reverse osmosis, photocatalysis, chemical coagulation and electrocoagulation [6][7]. Most of](https://img.dokumen.tips/doc/110x75/5e2278ebc2fd9658e31b39a7/electrocoagulation-technique-used-to-treat-wastewater-a-chemical-precipitation.jpg)