Embed Size (px)
Citation preview
w a t e r r e s e a r c h 4 3 ( 2 0 0 9 ) 2 3 1 7 – 2 3 4 8
Avai lab le a t www.sc iencedi rec t .com
journa l homepage : www.e lsev ie r . com/ loca te /wat res
Review
Reverse osmosis desalination: Water sources, technology,and today’s challenges
Lauren F. Greenleea, Desmond F. Lawlerb, Benny D. Freemana, Benoit Marrotc,Philippe Moulinc,*aThe University of Texas at Austin, Center for Energy and Environmental Resources, 10100 Burnet Road, Bldg 133, Austin,
TX 78758, USAbThe University of Texas at Austin, Department of Civil, Architectural, and Environmental Engineering, 1 University Station C1786,
Austin, TX 78712, USAcUniversite Paul Cezanne, Europole de l’Arbois-Pavillon Laennec BP80, Laboratoire Mecanique, Modelisation et Procedes Propres,
13545 Aix en Provence Cedex 4, France
a r t i c l e i n f o
Article history:
Received 30 June 2008
Received in revised form
2 March 2009
Accepted 6 March 2009
Published online 18 March 2009
Keywords:
Desalination
Reverse osmosis
Brackish water
Seawater
Drinking water
Membranes
* Corresponding author. Tel.: þ33 (0)4 42 90 8E-mail addresses: lauren_greenlee@yaho
(B.D. Freeman), benoit.marrot@univ-cezann0043-1354/$ – see front matter ª 2009 Elsevidoi:10.1016/j.watres.2009.03.010
a b s t r a c t
Reverse osmosis membrane technology has developed over the past 40 years to a 44%
share in world desalting production capacity, and an 80% share in the total number of
desalination plants installed worldwide. The use of membrane desalination has increased
as materials have improved and costs have decreased. Today, reverse osmosis membranes
are the leading technology for new desalination installations, and they are applied to
a variety of salt water resources using tailored pretreatment and membrane system design.
Two distinct branches of reverse osmosis desalination have emerged: seawater reverse
osmosis and brackish water reverse osmosis. Differences between the two water sources,
including foulants, salinity, waste brine (concentrate) disposal options, and plant location,
have created significant differences in process development, implementation, and key
technical problems. Pretreatment options are similar for both types of reverse osmosis and
depend on the specific components of the water source. Both brackish water and seawater
reverse osmosis (RO) will continue to be used worldwide; new technology in energy
recovery and renewable energy, as well as innovative plant design, will allow greater use of
desalination for inland and rural communities, while providing more affordable water for
large coastal cities. A wide variety of research and general information on RO desalination
is available; however, a direct comparison of seawater and brackish water RO systems is
necessary to highlight similarities and differences in process development. This article
brings to light key parameters of an RO process and process modifications due to feed
water characteristics.
ª 2009 Elsevier Ltd. All rights reserved.
5 01; fax: þ33 (0)4 42 90 85 15.o.com (L.F. Greenlee), [email protected] (D.F. Lawler), [email protected] (B. Marrot), [email protected] (P. Moulin).er Ltd. All rights reserved.
w a t e r r e s e a r c h 4 3 ( 2 0 0 9 ) 2 3 1 7 – 2 3 4 82318
Contents
1. Introduction . . . . . . . . . . . . . . . . . . . . . . . . . . . . . . . . . . . . . . . . . . . . . . . . . . . . . . . . . . . . . . . . . . . . . . . . . . . . . . . . . . . . . . . . . . . . . . 23182. History of desalination . . . . . . . . . . . . . . . . . . . . . . . . . . . . . . . . . . . . . . . . . . . . . . . . . . . . . . . . . . . . . . . . . . . . . . . . . . . . . . . . . . . . . 23203. Reverse osmosis: basic principles . . . . . . . . . . . . . . . . . . . . . . . . . . . . . . . . . . . . . . . . . . . . . . . . . . . . . . . . . . . . . . . . . . . . . . . . . . . 23224. Reverse osmosis desalination: feed waters . . . . . . . . . . . . . . . . . . . . . . . . . . . . . . . . . . . . . . . . . . . . . . . . . . . . . . . . . . . . . . . . . . . 2325
4.1. Seawater RO . . . . . . . . . . . . . . . . . . . . . . . . . . . . . . . . . . . . . . . . . . . . . . . . . . . . . . . . . . . . . . . . . . . . . . . . . . . . . . . . . . . . . . . . 23254.2. Brackish water RO . . . . . . . . . . . . . . . . . . . . . . . . . . . . . . . . . . . . . . . . . . . . . . . . . . . . . . . . . . . . . . . . . . . . . . . . . . . . . . . . . . . 2326
5. Feed water contaminants . . . . . . . . . . . . . . . . . . . . . . . . . . . . . . . . . . . . . . . . . . . . . . . . . . . . . . . . . . . . . . . . . . . . . . . . . . . . . . . . . . 23265.1. Seawater RO . . . . . . . . . . . . . . . . . . . . . . . . . . . . . . . . . . . . . . . . . . . . . . . . . . . . . . . . . . . . . . . . . . . . . . . . . . . . . . . . . . . . . . . . 23265.2. Brackish water RO . . . . . . . . . . . . . . . . . . . . . . . . . . . . . . . . . . . . . . . . . . . . . . . . . . . . . . . . . . . . . . . . . . . . . . . . . . . . . . . . . . . 2326
6. Membrane fouling . . . . . . . . . . . . . . . . . . . . . . . . . . . . . . . . . . . . . . . . . . . . . . . . . . . . . . . . . . . . . . . . . . . . . . . . . . . . . . . . . . . . . . . . . 23276.1. Seawater RO . . . . . . . . . . . . . . . . . . . . . . . . . . . . . . . . . . . . . . . . . . . . . . . . . . . . . . . . . . . . . . . . . . . . . . . . . . . . . . . . . . . . . . . . 23286.2. Brackish water RO . . . . . . . . . . . . . . . . . . . . . . . . . . . . . . . . . . . . . . . . . . . . . . . . . . . . . . . . . . . . . . . . . . . . . . . . . . . . . . . . . . . 2328
7. Membrane cleaning . . . . . . . . . . . . . . . . . . . . . . . . . . . . . . . . . . . . . . . . . . . . . . . . . . . . . . . . . . . . . . . . . . . . . . . . . . . . . . . . . . . . . . . . 23298. RO pretreatment for seawater and brackish water . . . . . . . . . . . . . . . . . . . . . . . . . . . . . . . . . . . . . . . . . . . . . . . . . . . . . . . . . . . . 2329
8.1. Conventional pretreatment . . . . . . . . . . . . . . . . . . . . . . . . . . . . . . . . . . . . . . . . . . . . . . . . . . . . . . . . . . . . . . . . . . . . . . . . . . . 23298.2. Membrane pretreatment . . . . . . . . . . . . . . . . . . . . . . . . . . . . . . . . . . . . . . . . . . . . . . . . . . . . . . . . . . . . . . . . . . . . . . . . . . . . . 2330
9. Reverse osmosis system design . . . . . . . . . . . . . . . . . . . . . . . . . . . . . . . . . . . . . . . . . . . . . . . . . . . . . . . . . . . . . . . . . . . . . . . . . . . . . 23319.1. Typical operational parameter ranges . . . . . . . . . . . . . . . . . . . . . . . . . . . . . . . . . . . . . . . . . . . . . . . . . . . . . . . . . . . . . . . . . 23319.2. Seawater RO system design . . . . . . . . . . . . . . . . . . . . . . . . . . . . . . . . . . . . . . . . . . . . . . . . . . . . . . . . . . . . . . . . . . . . . . . . . . 23319.3. Alternative seawater RO plant design . . . . . . . . . . . . . . . . . . . . . . . . . . . . . . . . . . . . . . . . . . . . . . . . . . . . . . . . . . . . . . . . . 23349.4. Brackish water RO system design . . . . . . . . . . . . . . . . . . . . . . . . . . . . . . . . . . . . . . . . . . . . . . . . . . . . . . . . . . . . . . . . . . . . . 23349.5. Alternative brackish water RO plant design . . . . . . . . . . . . . . . . . . . . . . . . . . . . . . . . . . . . . . . . . . . . . . . . . . . . . . . . . . . . 2335
10. RO permeate post-treatment . . . . . . . . . . . . . . . . . . . . . . . . . . . . . . . . . . . . . . . . . . . . . . . . . . . . . . . . . . . . . . . . . . . . . . . . . . . . . . 233610.1. Seawater RO . . . . . . . . . . . . . . . . . . . . . . . . . . . . . . . . . . . . . . . . . . . . . . . . . . . . . . . . . . . . . . . . . . . . . . . . . . . . . . . . . . . . . . . 233610.2. Brackish water RO . . . . . . . . . . . . . . . . . . . . . . . . . . . . . . . . . . . . . . . . . . . . . . . . . . . . . . . . . . . . . . . . . . . . . . . . . . . . . . . . . . 2337
11. RO concentrate disposal . . . . . . . . . . . . . . . . . . . . . . . . . . . . . . . . . . . . . . . . . . . . . . . . . . . . . . . . . . . . . . . . . . . . . . . . . . . . . . . . . . 233711.1. Seawater RO . . . . . . . . . . . . . . . . . . . . . . . . . . . . . . . . . . . . . . . . . . . . . . . . . . . . . . . . . . . . . . . . . . . . . . . . . . . . . . . . . . . . . . . 233711.2. Brackish water RO . . . . . . . . . . . . . . . . . . . . . . . . . . . . . . . . . . . . . . . . . . . . . . . . . . . . . . . . . . . . . . . . . . . . . . . . . . . . . . . . . . 2337
12. Alternative energy sources . . . . . . . . . . . . . . . . . . . . . . . . . . . . . . . . . . . . . . . . . . . . . . . . . . . . . . . . . . . . . . . . . . . . . . . . . . . . . . . . 233812.1. Seawater RO . . . . . . . . . . . . . . . . . . . . . . . . . . . . . . . . . . . . . . . . . . . . . . . . . . . . . . . . . . . . . . . . . . . . . . . . . . . . . . . . . . . . . . . 233812.2. Brackish Water RO . . . . . . . . . . . . . . . . . . . . . . . . . . . . . . . . . . . . . . . . . . . . . . . . . . . . . . . . . . . . . . . . . . . . . . . . . . . . . . . . . . 2339
13. Costs . . . . . . . . . . . . . . . . . . . . . . . . . . . . . . . . . . . . . . . . . . . . . . . . . . . . . . . . . . . . . . . . . . . . . . . . . . . . . . . . . . . . . . . . . . . . . . . . . . . . 233913.1. Seawater RO . . . . . . . . . . . . . . . . . . . . . . . . . . . . . . . . . . . . . . . . . . . . . . . . . . . . . . . . . . . . . . . . . . . . . . . . . . . . . . . . . . . . . . . 234013.2. Brackish water RO . . . . . . . . . . . . . . . . . . . . . . . . . . . . . . . . . . . . . . . . . . . . . . . . . . . . . . . . . . . . . . . . . . . . . . . . . . . . . . . . . . 2341
14. Technological challenges and the future of RO . . . . . . . . . . . . . . . . . . . . . . . . . . . . . . . . . . . . . . . . . . . . . . . . . . . . . . . . . . . . . . 234215. Conclusions . . . . . . . . . . . . . . . . . . . . . . . . . . . . . . . . . . . . . . . . . . . . . . . . . . . . . . . . . . . . . . . . . . . . . . . . . . . . . . . . . . . . . . . . . . . . . . 2342
Acknowledgements . . . . . . . . . . . . . . . . . . . . . . . . . . . . . . . . . . . . . . . . . . . . . . . . . . . . . . . . . . . . . . . . . . . . . . . . . . . . . . . . . . . . . . . 2342References . . . . . . . . . . . . . . . . . . . . . . . . . . . . . . . . . . . . . . . . . . . . . . . . . . . . . . . . . . . . . . . . . . . . . . . . . . . . . . . . . . . . . . . . . . . . . . . 2343
1. Introduction methods to cope with increasing demand and, in many cases,
The U.S. Geological Survey (Gleick, 1996) found that 96.5% of
Earth’s water is located in seas and oceans and 1.7% of
Earth’s water is located in the ice caps. Approximately 0.8% is
considered to be fresh water. The remaining percentage is
made up of brackish water, slightly salty water found as
surface water in estuaries and as groundwater in salty
aquifers. Water shortages have plagued many communities,
and humans have long searched for a solution to Earth’s
meager fresh water supplies. Thus, desalination is not a new
concept; the idea of turning salt water into fresh water has
been developed and used for centuries.
Today, the production of potable water has become
a worldwide concern; for many communities, projected pop-
ulation growth and demand exceed conventional available
water resources. Over 1 billion people are without clean
drinking water and approximately 2.3 billion people (41% of
the world population) live in regions with water shortages
(Service, 2006). For most, solutions such as water conservation
and water transfer or dam construction are not sufficient
decreasing supply. Traditional fresh water resources such as
lakes, rivers, and groundwater are overused or misused; as
a result, these resources are either diminishing or becoming
saline. As countries continue to develop and cities expand,
few new water resources are available to support daily fresh
water needs. As a result, solutions such as water reuse and
salt water desalination have emerged as the keys to sustaining
future generations across the globe.
Both water reuse and desalination have been incorporated
successfully to provide additional fresh water production for
communities using conventional water treatment and fresh
water resources (Nicot et al., 2007; Reahl, 2004; Sanz et al.,
2007; Sauvet-Goichon, 2007; U.S. EPA, 2004). Water reuse has
been used to provide water for uses such as irrigation, power
plant cooling water, industrial process water, and ground-
water recharge and has been accepted as a method for indirect
drinking water production (Focazio et al., 2008; Fono et al.,
2006; Sedlak et al., 2000). Desalination has become an impor-
tant source of drinking water production, with thermal desa-
lination processes developing over the past 60 years and
Nomenclature
C concentration
CAPS compact accelerated precipitation softening
CF concentration factor
D water diffusivity
DOC dissolved organic carbon
DAB binary diffusion coefficient
Ds salt diffusivity
ED electrodialysis
EDR electrodialysis reversal
IAP ion activity product
Ks salt partition coefficient
Ksp,x solubility product constant
l membrane thickness
MED multi-effect distillation
MF microfiltration
MSF multi-stage flash distillation
MWCO molecular weight cut off
N mass flux
NF nanofiltration
p hydrostatic pressure
dp/dx pressure gradient, x-direction
Q volumetric flow rate
R ideal gas constant
RO reverse osmosis
Rs salt rejection
Rt total flow resistance
Rw recovery
S water solubility
SDI silt density index
SIx saturation index
t time
T temperature
TDS total dissolved solids (mg/L)
TFC thin film composite
UF ultrafiltration
V partial molar volume
VC vapor compression
ZLD zero liquid discharge
k permeability
rA mass density
m viscosity
p osmotic pressure
L permeability coefficient
6P transmembrane pressure difference
w a t e r r e s e a r c h 4 3 ( 2 0 0 9 ) 2 3 1 7 – 2 3 4 8 2319
membrane processes developing over the past 40 years
(Gleick, 2006).
Desalination is a general term for the process of removing
salt from water to produce fresh water. Fresh water is defined
as containing less than 1000 mg/L of salts or total dissolved
solids (TDS) (Sandia, 2003). Above 1000 mg/L, properties such
as taste, color, corrosion propensity, and odor can be
adversely affected. Many countries have adopted national
drinking water standards for specific contaminants, as well as
for TDS, but the standard limits vary from country to country
or from region to region within the same country. For
example, the World Health Organization (WHO, 1970) has
a drinking water taste threshold of 250 mg/L, and the U.S.
Environmental Protection Agency (EPA) has secondary (non-
enforceable) standards of 250 mg/L chloride and 500 mg/L TDS
(U.S. EPA, 2002). Each U.S. state can set a primary, enforceable
standard. The state of Utah currently has a TDS limit of
2000 mg/L (Utah Rule R309–200, 2006), while California has
a standard of 1000 mg/L TDS (California Code of Regulations,
2007), and Florida has a standard of 500 mg/L TDS (F.A.C.,
2007). The WHO and the Gulf Drinking Water standards
recommend a drinking water standard of 1000 mg/L TDS for
drinking water (Fritzmann et al., 2007). Australia has
a drinking water standard of 1000 mg/L TDS (Australian
Drinking Water Guidelines, 2004). The European Union does
not have a drinking water standard for TDS, although stan-
dards for other drinking water contaminants have been
established (WHO, 1970). In comparison to governmental
standards, most desalination facilities are designed to achieve
a TDS of 500 mg/L or less (Gaid and Treal, 2007; Petry et al.,
2007; Sanz et al., 2007; Xu et al., 2007). Desalinated water used
for other purposes, such as crop irrigation, may have a higher
TDS concentration; irrigation water standards often include
concentration limits for TDS, chloride, sodium, and boron.
Depending on the type of crop, the chloride standard can
range from 350 mg/L to more than 2000 mg/L (Fipps, 2003).
The feed water salinity for desalination facilities ranges
from approximately 1000 mg/L TDS to 60,000 mg/L TDS,
although feed waters are typically labeled as one of two types:
seawater or brackish water. Although most seawater sources
contain 30,000–45,000 mg/L TDS, seawater reverse osmosis
membranes are used to treat waters within the TDS range
10,000 – 60,000 mg/L. Brackish water reverse osmosis
membranes are used to treat water sources (often ground-
water sources) within a range of 1000–10,000 mg/L TDS
(Mickley, 2001). The feed water type can dictate several design
choices for a treatment plant, including desalination method,
pretreatment steps, waste disposal method, and product
recovery (the fraction of influent water that becomes product).
Desalination processes fall into two main categories,
thermal processes or membrane processes. Thermal desali-
nation (distillation) has been used for hundreds of years to
produce fresh water, but large-scale municipal drinking water
distillation plants began to operate during the 1950s (Gleick,
2006). Countries in the Middle East pioneered the design and
implementation of seawater thermal desalination, first using
a process called multi-effect distillation (MED) and later using
a process called multi-stage flash (MSF) distillation (Van der
Bruggen and Vandecasteele, 2002). Today, the Middle East
collectively holds 50% of the world’s desalination capacity
(Henthorne, 2003) and primarily uses MSF technology. While
thermal desalination has remained the primary technology of
choice in the Middle East, membrane processes have rapidly
developed since the 1960s (Loeb and Sourirajan, 1963) and now
surpass thermal processes in new plant installations. Outside
of the Middle East, new RO desalination installations have
l P
ro
du
ctio
n C
ap
acity (m
illio
n m
3/d
ay)
10
20
30
40
w a t e r r e s e a r c h 4 3 ( 2 0 0 9 ) 2 3 1 7 – 2 3 4 82320
been steadily increasing; in 2001, 51% of new installed desa-
lination capacity used RO desalination, and in 2003, RO
desalination accounted for 75% of new production capacity
(Wolfe, 2005). Countries in the Middle East continue to use
thermal desalination due to easily accessible fossil fuel
resources and the poor water quality of the local feed water.
Water bodies such as the Persian Gulf and the Gulf of Oman
have extremely high salinities, high temperatures, and high-
fouling potential for membrane systems. At high salinities
and high recoveries (55,000 mg/L TDS and above 35%
recovery), the pressure required for membrane desalination
can be greater than the maximum allowable pressure of
membrane modules, and thermal desalination must be used
(Kim et al., 2007; Mandil et al., 1998). High feed water
temperatures and foulants can also cause problems in
membrane desalination that can be avoided by using thermal
desalination.
Reverse osmosis (RO), nanofiltration (NF), and electrodial-
ysis (ED) are the three membrane processes available for
desalination. ED membranes operate under an electric current
that causes ions to move through parallel membranes and are
typically only used for brackish water desalination (Reahl,
2004). NF membranes are a newer technology developed in the
mid-1980s (Singh, 1997) and have been tested on a range of
salt concentrations (Hilal et al., 2005; Tanninen et al., 2006;
Wang et al., 2005, 2006). Research has shown that NF, as
a singular process, cannot reduce seawater salinity to
drinking water standards, but NF has been used successfully
to treat mildly brackish feed water (Bohdziewicz et al., 1999;
Lhassani et al., 2001; M’nif et al., 2007). Coupled with RO, NF
can be used to treat seawater (Hamed, 2005; Hassan et al.,
1998; Hilal et al., 2005). In particular, NF membranes are used
to remove divalent ions, such as calcium and magnesium that
contribute to water hardness, as well as dissolved organic
material (Choi et al., 2001; Gorenflo et al., 2002; Wilf, 2003).
RO membranes, however, are able to reject monovalent
ions, such as sodium and chloride. Today, seawater RO
membranes have salt rejections greater than 99% (Bates and
Cuozzo, 2000; Brehant et al., 2003; Reverter et al., 2001); some
membranes, when operated under standard test conditions
(32,000 mg/L NaCl, 5.5 MPa, 25 �C, pH 8, 8% recovery), can
achieve as high as 99.7–99.8% salt rejection (Hydranautics,
2007; Reverberi and Gorenflo, 2007). RO membrane technology
has developed for both brackish and seawater applications.
Brackish water RO membranes typically have higher product
water (permeate) flux, lower salt rejection, and require lower
operating pressures (due to the lower osmotic pressures of
less saline waters), while seawater RO membranes require
maximum salt rejection. Membranes designed for higher salt
rejection, have lower permeate fluxes, due to the trade-off
between membrane selectivity (salt rejection) and membrane
permeability (permeate flux). In addition, seawater RO
membranes must operate at higher pressures to compensate
for the higher osmotic pressure of seawater.
Year
1940 1950 1960 1970 1980 1990 2000 2010To
ta 0
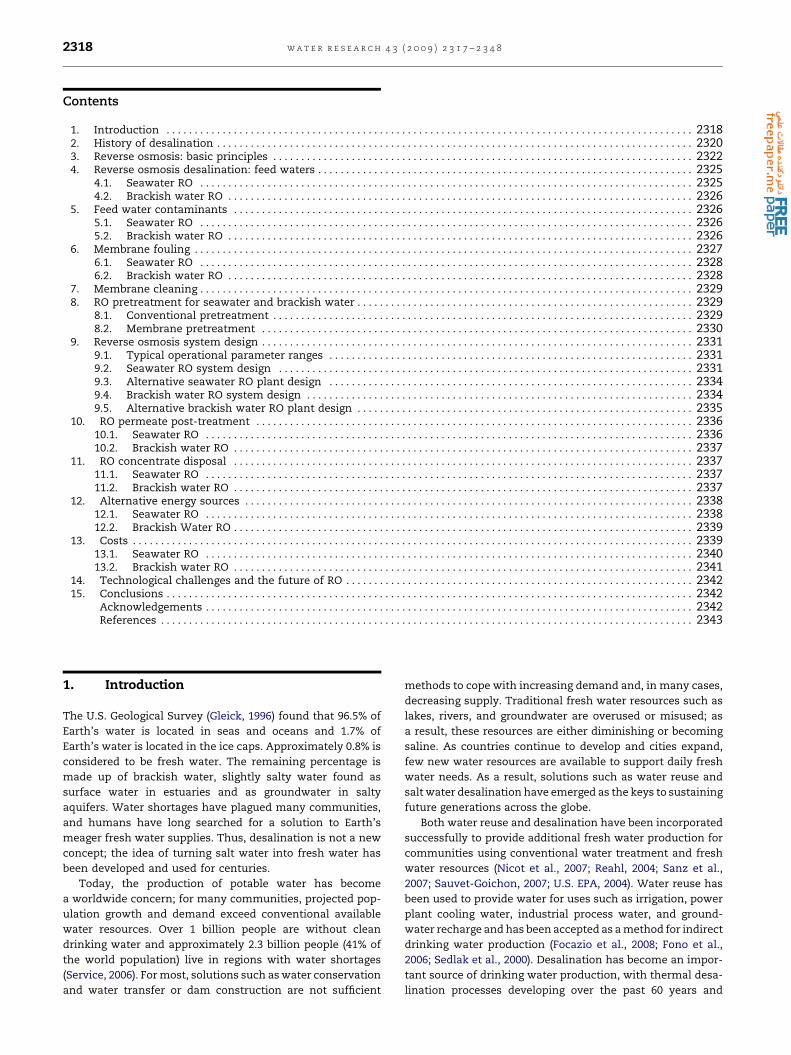
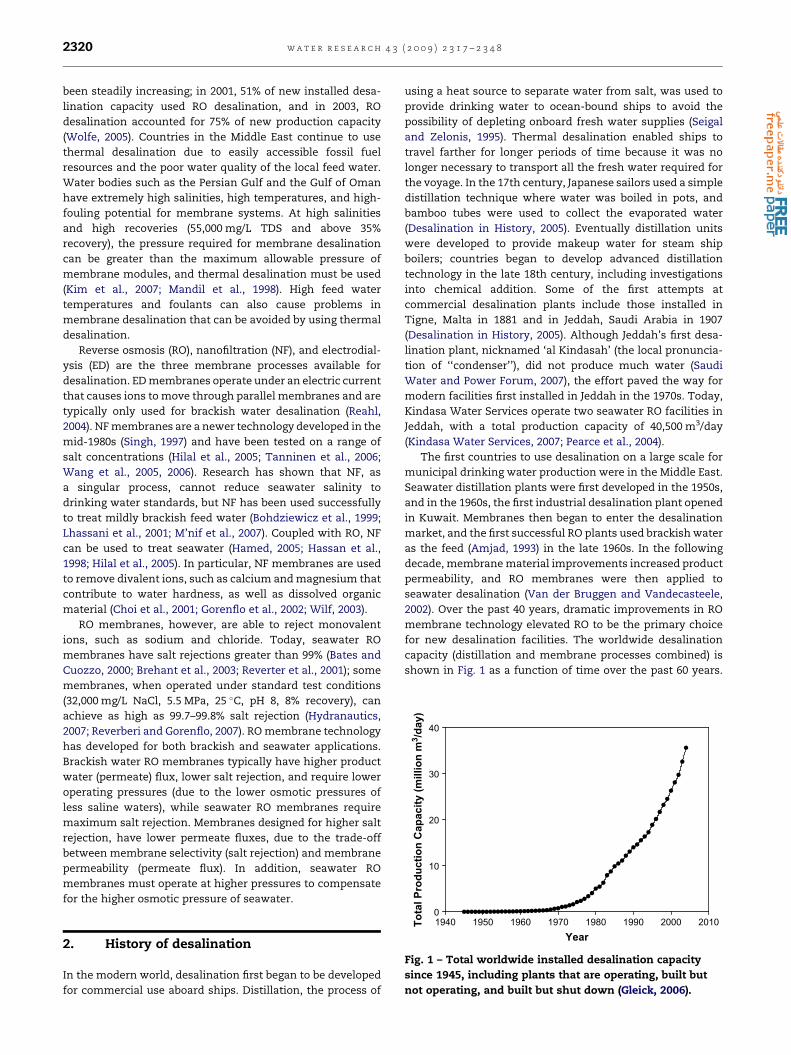
Fig. 1 – Total worldwide installed desalination capacity
since 1945, including plants that are operating, built but
not operating, and built but shut down (Gleick, 2006).
2. History of desalination
In the modern world, desalination first began to be developed
for commercial use aboard ships. Distillation, the process of
using a heat source to separate water from salt, was used to
provide drinking water to ocean-bound ships to avoid the
possibility of depleting onboard fresh water supplies (Seigal
and Zelonis, 1995). Thermal desalination enabled ships to
travel farther for longer periods of time because it was no
longer necessary to transport all the fresh water required for
the voyage. In the 17th century, Japanese sailors used a simple
distillation technique where water was boiled in pots, and
bamboo tubes were used to collect the evaporated water
(Desalination in History, 2005). Eventually distillation units
were developed to provide makeup water for steam ship
boilers; countries began to develop advanced distillation
technology in the late 18th century, including investigations
into chemical addition. Some of the first attempts at
commercial desalination plants include those installed in
Tigne, Malta in 1881 and in Jeddah, Saudi Arabia in 1907
(Desalination in History, 2005). Although Jeddah’s first desa-
lination plant, nicknamed ‘al Kindasah’ (the local pronuncia-
tion of ‘‘condenser’’), did not produce much water (Saudi
Water and Power Forum, 2007), the effort paved the way for
modern facilities first installed in Jeddah in the 1970s. Today,
Kindasa Water Services operate two seawater RO facilities in
Jeddah, with a total production capacity of 40,500 m3/day
(Kindasa Water Services, 2007; Pearce et al., 2004).
The first countries to use desalination on a large scale for
municipal drinking water production were in the Middle East.
Seawater distillation plants were first developed in the 1950s,
and in the 1960s, the first industrial desalination plant opened
in Kuwait. Membranes then began to enter the desalination
market, and the first successful RO plants used brackish water
as the feed (Amjad, 1993) in the late 1960s. In the following
decade, membrane material improvements increased product
permeability, and RO membranes were then applied to
seawater desalination (Van der Bruggen and Vandecasteele,
2002). Over the past 40 years, dramatic improvements in RO
membrane technology elevated RO to be the primary choice
for new desalination facilities. The worldwide desalination
capacity (distillation and membrane processes combined) is
shown in Fig. 1 as a function of time over the past 60 years.

Fig. 2 – New installed desalination capacity each year
worldwide from 1945 to 2004 (Gleick, 2006).
w a t e r r e s e a r c h 4 3 ( 2 0 0 9 ) 2 3 1 7 – 2 3 4 8 2321
From the late 1960s and 1970s, developments in both distil-
lation and membrane technology led to exponential growth in
world desalination capacity.
Today, over 15,000 desalination plants are in operation
worldwide, and approximately 50% of those are RO plants. The
Middle East holds approximately 50% of the world’s production
capacity (and 2.9% of the world’s population) and has forged
ahead as the leader in large-scale seawater desalination. In
2005, Israel opened the world’s largest seawater RO desalina-
tion plant, with a production capacity of 330,000 m3/day, or 100
million m3/yr (Sauvet-Goichon, 2007). The United Arab Emir-
ates (UAE) opened its Fujairah desalination plant in 2005; the
plant combines MSF and RO technology to produce 454,000 m3/
day of fresh water (Sanz et al., 2007). The yearly worldwide new
desalination production capacity (distillation and membrane
processes) is shown in Fig. 2. The annual increase in new
installations corresponds to technology advances in the late
1960s and 1970s; large jumps in new capacity during recent
years signify a new trend in seawater desalination plants with
productions of 100,000 m3/day or more.
Saudia Arabia is currently the world leader with approxi-
mately 26% of global production capacity, and the United
States ranks second, with 17% of the world’s desalination
production (Gleick, 2006; Miller, 2003; Wangnick/GWI, 2005;
Wolff, 2006). In addition, six of the 11 countries with the
greatest desalination production capacity are located in the
Fig. 3 – Distribution of desalination production capacity by proce
the Middle East (countries include Saudi Arabia, Kuwait, United A
Wolff, 2006; Zhou and Tol, 2005).
Middle East (Miller, 2003). However, statistics on production
capacity only touch the surface of desalination use. For
example, in Saudia Arabia, thermal desalination is the typical
process choice, and most plants are coastal seawater desali-
nation plants. In the United States, 69% of plants use reverse
osmosis and only 7% of desalination plants use seawater
(Shoaiba Desalination Plant, 2003; Wolff, 2006). In addition,
the U.S. represents 4.5% of the world’s population, while Saudi
Arabia represents just 0.4%. While only 20% of the total
number of desalination plants worldwide use thermal tech-
nologies, 50% of the desalination production capacity can be
attributed to thermal processes (Frenkel, 2000). Such differ-
ences illustrate the wide applicability of desalination to
countries with very different resources and water needs.
The distribution of desalination production capacity for
different separation technologies is shown in Fig. 3 for the
entire world, the United States, and Saudia Arabia. Membrane
processes include reverse osmosis (RO), electrodialysis (ED),
and nanofiltration (NF), and distillation processes include
vapor compression (VC), multi-stage flash (MSF), and multiple
effect distillation (MED). The statistics for the world (Fig. 3a)
show membrane and distillation processes equally sharing
production capacity, with RO dominating the membrane
processes and MSF dominating distillation. However, the
statistics change dramatically when the number of plants is
considered; RO membrane plants represent 80% of the
number of desalination plants worldwide, with thermal
processes representing just 20% (Frenkel, 2000). In addition, in
Saudi Arabia (Fig. 3c), more than 86% of production is achieved
using MSF technology, while in the United States, RO is the
dominant desalination technology, with membrane processes
(ROþNF) representing 84% of the country’s desalination
capacity.
Many other countries have begun to utilize desalination for
drinking water production, but no other region of the world
has implemented desalination on as large a scale as the
Middle East. Spain has been using desalination since 1964
(Graber, 2006) to provide drinking water in the Canary Islands,
the Balearic Islands, and along the southern and eastern
coasts (Reverter et al., 2001; Rybar et al., 2005). Spain and Italy
hold the majority of the European desalination capacity, with
each country holding 2.6% of world production capacity; 69%
of desalination plants in Spain use RO technology, while only
20% of plants in Italy use RO (Miller, 2003). Japan holds 3.7% of
global production (Miller, 2003) and has been using seawater
ss technology for (a) the world, (b) the United States, and (c)
rab Emirates, Qatar, Bahrain, and Oman) (Murakami, 1995;

Fig. 4 – Range of nominal pore diameters for commercially
available membranes (Perry and Green, 1997).
w a t e r r e s e a r c h 4 3 ( 2 0 0 9 ) 2 3 1 7 – 2 3 4 82322
RO technology since 1974 (Magara et al., 2000). China has seen
an explosion in population, along with modern development
and industrialization, with little control over or protection of
water resources. As a result, the current water transfer
strategy (from Southern water resources to water-poor
Northern China) is no longer sufficient (Zhou and Tol, 2004),
and the country is beginning to investigate desalination
technologies (Xu et al., 2007; Zhou and Tol, 2004). In particular,
a feasibility study is currently underway for a thermal desa-
lination (MED) plant coupled with a nuclear power plant in the
Yantai region (Uranium Information Centre, 2007). Countries
in North Africa and the Middle East, such as Algeria, Tunisia,
and Jordan, have limited fresh water resources and have
investigated using both brackish and seawater desalination
(Afonso et al., 2004; Bouchekima et al., 2001; M’nif et al., 2007;
Mandil and Bushnak, 2002; Walha et al., 2007). The world’s
largest brackish water RO desalination plant was finished in
2006 in Wadi Ma’in in Jordan, operating at 129,000 m3/day,
with a maximum capacity of over 150,000 m3/day (Mohsen,
2007). Algeria plans to increase its number of plants from 10 to
43 by the year 2019, with a production goal of 2 million m3/day;
in 2007, the largest RO desalination plant in Africa started
production (200,000 m3/day) in Algeria’s capital city, Algers
(Mooij, 2007). Countries in South America, such as Chile, have
recently implemented large desalination plants (Petry et al.,
2007), and Australia has been battling a water crisis with new
RO installations from Melbourne to the Gold Coast (Degre-
mont, 2005; Veolia, 2006; Veolia, 2007). England will construct
its first desalination plant in East London, using the Thames
Estuary as the brackish water source; production of drinking
water is planned to start in 2009 (Thames Water Desalination
Plant, 2007).
Although membrane and distillation processes equally
share current desalination production capacity worldwide, RO
has emerged as the leader in future desalination installations.
RO will be the key to increasing water supplies for drinking
water production throughout the world. Although wealthy
Middle Eastern countries have been able to afford distillation
processes, RO technology can now produce fresh water (from
seawater) at one-half to one-third of the cost of distillation
(Miller, 2003). Brackish water desalination is even less
expensive than seawater desalination.
3. Reverse osmosis: basic principles
RO membranes do not have distinct pores that traverse the
membrane and lie at one extreme of commercially available
membranes. The polymer material of RO membranes forms
a layered, web-like structure, and water must follow
a tortuous pathway through the membrane to reach the
permeate side. RO membranes can reject the smallest
contaminants, monovalent ions, while other membranes,
including nanofiltration (NF), ultrafiltration (UF), and micro-
filtration (MF), are designed to remove materials of increasing
size, as indicated in Fig. 4. UF and NF membranes are also
categorized by the molecular weight cut off (MWCO) of the
membrane, or the molecular weight where the membrane will
retain 90% of the solute in solution. The general MWCO ranges
for UF and NF are 2000–500,000 Da and 250–2000 Da,
respectively. MF is usually characterized by a nominal pore
size (0.05 mm–10 mm) or by the membrane’s rejection (90%
rejection of a specific size in mm).
Membranes can be used in either dead-end or crossflow
filtration. RO membranes are typically operated in crossflow
mode and are most commonly available as spiral wound
modules, where the membrane sheets are wound around an
inner tube that collects the permeate (Baker, 2004). Most
membranes allow filtration through pore flow, where the fluid
is forced through the membrane by a positive hydrostatic
pressure. The fluid flow depends upon the membrane
porosity, the fraction of membrane volume that is void space
and can contain liquid, and tortuosity, the distance a molecule
must travel through the membrane divided by the thickness
of the membrane. Fluid flux through membranes also occurs
due to diffusion. The general relationship that describes
transport due to pore flow and diffusion can be expressed as
follows (Bird et al., 2002):
NAx ¼rAk
m
dpdx� DAB
drA
dx(1)
where NAx is the mass flux of A in the x-direction (perpen-
dicular to the membrane surface), rA is the mass density of A,
k is the permeability, m is the viscosity, dp/dx is the pressure
gradient in the x-direction, and DAB is the binary diffusion
coefficient for the diffusion of A in B (the membrane). For MF
and UF membranes, the diffusion term is negligible compared
to the convection term. Solvent transport through NF
membranes occurs through a combination of convective flow
and diffusion (Bowen and Welfoot, 2002; Otero et al., 2008),
while recent studies show that solute transport through NF
membranes is primarily controlled by diffusion (Kedem and
Freger, 2008).
Transport through RO membranes, however, is controlled
by diffusion, and no open channels exist for pore flow; the RO
transport mechanism has been termed solution-diffusion
(Lonsdale et al., 1965; Merten, 1963; Paul, 1972, 2004; Wijmans
and Baker, 1995). In the solution-diffusion model, water
transport across an RO membrane occurs in three separate
steps: absorption onto the membrane surface, diffusion
through the thickness of the membrane, and desorption from
the permeate surface of the membrane. Once a water mole-
cule has absorbed onto the membrane surface, the water
concentration gradient (of the water-membrane system)
across the membrane causes the water molecules to diffuse
down the concentration gradient to the permeate side of the
w a t e r r e s e a r c h 4 3 ( 2 0 0 9 ) 2 3 1 7 – 2 3 4 8 2323
membrane. The water molecule then desorbs from the
membrane and becomes part of the bulk permeate. A
complete development and explanation of the solution-
diffusion model for transport through RO membranes can be
found elsewhere (Lonsdale et al., 1965; Paul, 2004). An RO
membrane is operated by achieving a hydrostatic pressure
greater than the osmotic pressure of the solution. The positive
difference in pressure creates a chemical potential difference
(concentration gradient) across the membrane that drives the
liquid through the membrane against the natural direction of
osmosis (the movement of water molecules from an area of
high concentration to an area of low concentration), while the
salts are retained and concentrated on the influent surface of
the membrane. Some salt passage through the membrane
does occur; salt passage for the same membrane increases
with salt concentration and temperature. Mass transport
through RO membranes can be described as follows:
NA ¼ LðDp� DpÞ (2)
where NA is liquid (water) flux through the membrane, L is the
permeability coefficient, Dp is the transmembrane pressure
difference, and Dp is the osmotic pressure difference between
the influent and the product water (permeate). The osmotic
pressure, p, depends on the solution concentration and the
solution temperature. For a thermodynamically ideal solu-
tion, the relationship is described as follows:
p ¼ CRT (3)
where C is the ion concentration (molar units), R is the ideal
gas constant, and T is the operating temperature.
The permeability coefficient, L, depends on characteristics
of the membrane and is described by (Wijmans and Baker,
1995):
L ¼ DSVRTl
(4)
where D is the water diffusivity, S is the water solubility, V is
the water partial molar volume, R is the ideal gas constant, T is
the operating temperature, and l is the membrane thickness.
This definition of L is based on the solution-diffusion model of
water transport across a RO membrane (Bird et al., 2002).
The osmotic pressure of seawater is typically 2300–
2600 kPa and can be as high as 3500 kPa (Perry and Green,
1997; Sagle and Freeman, 2004). Osmotic pressures of brackish
water are much smaller that those of seawater; for a concen-
tration range of 2000–5000 mg/L, the osmotic pressure ranges
from 100 to 300 kPa (Sagle and Freeman, 2004). The osmotic
pressure, p, in the concentrate is related to the recovery, Rw, by
(Perry and Green, 1997):
pconcentrate ¼�
11� Rw
�(5)
To overcome the osmotic pressure, feed pressures in
seawater applications range from 6000 to 8000 kPa, whereas
those in brackish water are 600–3000 kPa.
Recovery is an important indicator of RO performance. The
recovery of a membrane or an overall RO system is given by:
Rw ¼QP
QF
(6)
where QP is the permeate volumetric flow rate and QF is the
feed volumetric flow rate (Rahardianto et al., 2007). Reverse
osmosis recovery varies from 35% to 85%, depending on feed
water composition, feed water salinity, pretreatment,
concentrate disposal options, and optimum energy design
configuration. Slight changes in recovery can significantly
affect the overall cost of the RO system, as well as the extent of
typical limiting factors, such as osmotic pressure, fouling
propensity, and mineral scaling (Morenski, 1992; Wilf and
Klinko, 2001).An increase in recovery requires an increase in feed pres-
sure and an increase in permeate flux; increased membrane
area may also be necessary to optimize the higher recovery.
When permeate flux increases, permeate salinity decreases
due to a dilution increase (Wilf and Klinko, 2001). However,
operating an RO module at a higher permeate flux often results
in flux decline, and operating an RO module at higher recovery
without an increase in flux causes an increase in salt passage
(Wilf and Klinko, 2001). During RO operation, concentration
polarization occurs at the surface of the membrane where
dissolved ions accumulate in a thin later of the feed water;
concentration polarization is the ratio of the salt concentration
at the membrane surface and the salt concentration in the bulk
solution (Kim and Hoek, 2005; Song and Elimelech, 1995). At
any recovery, concentration polarization causes greater salt
permeation through the membrane than what would be
expected based on the bulk solution salinity. When
a membrane module is operated at higher recovery, the
concentrate or reject stream becomes more concentrated, thus
increasing the concentration at the membrane surface. As the
salinity increases at the membrane surface, the local osmotic
pressure increases as well. Consequently, the overall pressure
difference between the hydrostatic pressure and the osmotic
pressure decreases, decreasing permeate flow, and the
increase in salinity at the membrane surface increases salt
transport through the membrane. In addition, phenomena
such as salt precipitation and fouling can increase due to the
higher local salinity. Models are available to calculate the
actual salt concentration at the RO membrane surface (Bacchin
et al., 2002; Gekas and Hallstrom, 1987; Kim and Hoek, 2005;
Sutzkover et al., 2000; Zydney, 1997) and predict precipitation.
RO membrane performance can also be measured by salt
flux through the membrane, but it is more often measured by
salt rejection. Salt flux is a function of salt concentration, and
salt transport occurs from a region of high salt concentration
to a region of low salt concentration. Salt flux is described by
(Baker, 2004):
Ns ¼ B�Cfeed � Cpermeate
�(7)
where Ns is the salt flux across the membrane, B is a constant
(similar to L in the water flux equation) that depends on
membrane characteristics, Cfeed is the ion concentration in
the feed solution, and Cpermeate is the ion concentration in the
permeate. B is described by:
B ¼ DsKs
l(8)
where Ds is the salt diffusivity through the membrane, Ks is
the salt partition coefficient between the solution and
membrane phases, and l is the membrane thickness.
w a t e r r e s e a r c h 4 3 ( 2 0 0 9 ) 2 3 1 7 – 2 3 4 82324
Membrane salt rejection is a measure of overall membrane
system performance, and membrane manufacturers typically
state a specific salt rejection for each commercial membrane
available. Salt rejection through an RO membrane (crossflow
operation) is nominally given by:
Rs ¼�
1� Cpermeate
Cfeed
�� 100% (9)
However, RO membranes are typically packed in a spiral
wound element, where several membranes are wound around
a central tube and separated by spacers. In a spiral wound
element, the feed becomes increasingly concentrated from
the beginning to the end of the tube and the salt rejection is
described by:
Rs ¼
1� Cpermeate�CfeedþCconcentrate
2
�!� 100% (10)
where Cconcentrate is the ion concentration in the concentrate
(Bartels et al., 2005). When membranes are tested using dead-
end operation, Eq. (9) becomes:
Rs ¼�
1� Cpermeate
Cconcentrate
�� 100% (11)
RO membranes achieve NaCl rejections of 98–99.8% (Bartels
et al., 2005), while NF membranes exhibit rejection values
greater than 90% for multivalent ions and between 60 and 70%
for monovalent ions (Choi et al., 2001; Hilal et al., 2004). NF salt
rejection, particularly for monovalent ions, is highly depen-
dent on the total dissolved solid (TDS) concentration and the
presence of other ions (Hilal et al., 2005; Lhassani et al., 2001;
Wang et al., 2005).
While membrane manufacturers offer high salt rejection
membranes for RO plants, the membranes do not retain the
initial salt rejection throughout the membrane’s lifetime (up
to 7 years with effective pretreatment). Normal membrane
aging causes the salt passage (salt passage %¼ 100� Rs) to
increase approximately 10% per year (Wilf and Klinko, 2001),
and other factors, such as temperature, salinity, target
recovery, and cleaning methods, can also affect salt passage.
As temperature increases, both the water and the salt
permeability increase. Changes in temperature can have
a negative or positive overall effect on the RO system. For
example, at temperatures below 30 �C, a feed water temper-
ature increase allows the system to operate at a lower feed
pressure (or at the same feed pressure and a higher permeate
flux) (Wilf and Bartels, 2004). However, the effect of temper-
ature increase on feed pressure decrease is nonlinear. Further
increases in temperature increase the osmotic pressure (thus
increasing the required feed pressure) and can adversely
affect the power consumption if a second RO stage is required
to meet permeate quality standards. Typically, RO plants are
operated at constant permeate flux, and the permeate salinity
varies proportionally with temperature. Even if a plant is
operated at constant pressure (increasing permeate flux with
increasing temperature), the permeate salinity will increase
with temperature due to a greater increase in salt perme-
ability than water permeability.
Increases in feed water salinity increase membrane salt
passage. The salt passage is affected by both the TDS
concentration and the composition of bivalent ions in solu-
tion, due to interactions between the ions and the membrane
surface. RO membranes have an overall negative surface
charge and repel negatively charged ions or molecules (Zhao
et al., 2005). As negative ions are repelled, more cations than
anions are present near the membrane surface; this
phenomenon creates an electric potential known as the
Donnan potential (Bartels et al., 2005; Tanninen et al., 2006).
The Donnan potential helps repel ions from the membrane,
but an increase in salinity or divalent ions decreases the
Donnan potential effect on membrane salt rejection. The
magnitude of the change in salt rejection on specific
membranes can vary greatly depending on water composition
and membrane charge strength. Bartels et al. found an
increase in salt passage (for several different brackish water
RO membranes) from approximately 0.4% to between 1.2% and
4% for a salinity increase of 1000 mg/L NaCl–10,000 mg/L NaCl.
The membrane surface charge will increase with
increasing pH, with a resulting increase in salt rejection (Yoon
et al., 2005). While all RO membranes have an isoelectric point
where the overall membrane charge is zero, polar groups
within the polyamide membrane material provide local
dipoles that allow salt rejection. However, most commercial
RO membranes have isoelectric points at relatively low pH
values (3–4) when tested with a standard electrolyte solution
(0.01 M NaCl or KCl) (Childress and Deshmukh, 1998; Desh-
mukh and Childress, 2001; Elimelech et al., 1994; Liu et al.,
2008) and have a negative surface charge at typical RO oper-
ating pH (5–7). Other water components, such as divalent ions
and dissolved organic matter (humic acids) can change the
isoelectric point (Childress and Deshmukh, 1998; Elimelech
et al., 1994).
The salt rejection, Rs, and the recovery, Rw, can be used to
calculate the concentration factor (CF) of the concentrate
stream (Le Gouellec and Elimelech, 2002; Rahardianto et al.,
2006; Shih et al., 2005):
CF ¼�
11� Rw
�½1� Rwð1� RsÞ� (12)
CF can also be calculated as the ratio of the concentrate TDS
concentration to the feed TDS concentration (CC/CF) (Rahar-
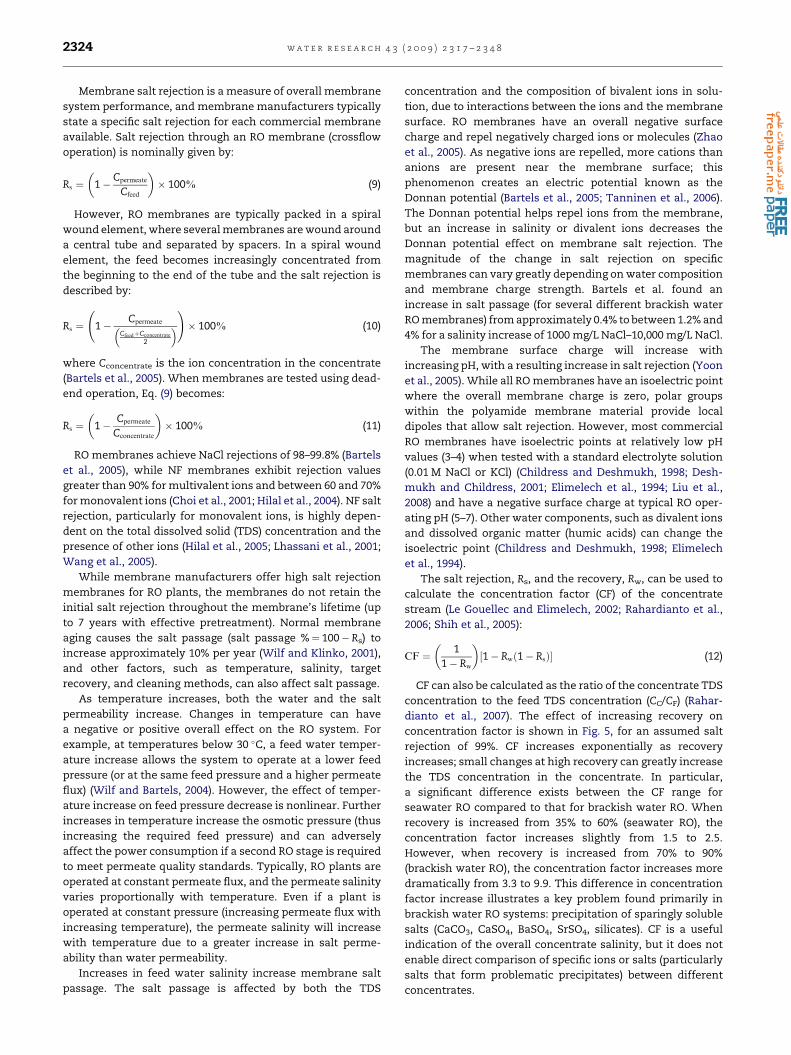
dianto et al., 2007). The effect of increasing recovery on
concentration factor is shown in Fig. 5, for an assumed salt
rejection of 99%. CF increases exponentially as recovery
increases; small changes at high recovery can greatly increase
the TDS concentration in the concentrate. In particular,
a significant difference exists between the CF range for
seawater RO compared to that for brackish water RO. When
recovery is increased from 35% to 60% (seawater RO), the
concentration factor increases slightly from 1.5 to 2.5.
However, when recovery is increased from 70% to 90%
(brackish water RO), the concentration factor increases more
dramatically from 3.3 to 9.9. This difference in concentration
factor increase illustrates a key problem found primarily in
brackish water RO systems: precipitation of sparingly soluble
salts (CaCO3, CaSO4, BaSO4, SrSO4, silicates). CF is a useful
indication of the overall concentrate salinity, but it does not
enable direct comparison of specific ions or salts (particularly
salts that form problematic precipitates) between different
concentrates.
Fractional Recovery
0.0 0.2 0.4 0.6 0.8 1.0
Co
ncen
tratio
n F
acto
r (C
F)
0
20
40
60
80
100
Fractional Recovery
0.30 0.35 0.40 0.45 0.50 0.55 0.60 0.65
Co
ncen
tratio
n F
acto
r (C
F)
1.4
1.6
1.8
2.0
2.2
2.4
2.6
Fractional Recovery
0.65 0.70 0.75 0.80 0.85 0.90 0.95
Co
ncen
tratio
n F
acto
r (C
F)
2
4
6
8
10
12
a
b
Fig. 5 – The effect of increasing recovery on concentrate concentration factor (Rs [ 99%). Insets: (a) the typical range of
recoveries for seawater RO operation and (b) the typical range of recoveries for brackish water operation.
w a t e r r e s e a r c h 4 3 ( 2 0 0 9 ) 2 3 1 7 – 2 3 4 8 2325
Reverse osmosis desalination plants typically operate
using 1–4 passes (the permeate of one is the feed to the next
RO in series) or stages (the concentrate is the feed to the next
RO in series) (Afonso et al., 2004; Atwater et al., 1995; Petry
et al., 2007; Reverberi and Gorenflo, 2007; Rybar et al., 2005;
Sanz et al., 2007; Sauvet-Goichon, 2007; Singh, 1997). Each pass
or stage contains multiple pressure vessels (between 100 and
200 modules in large systems) operating in parallel, with each
pressure vessel containing 6–8 membrane elements con-
nected in series (Wilf, 2003). The parallel system of pressure
vessels is often referred to as an RO train (Reverberi and
Gorenflo, 2007; Sanz et al., 2007; Wilf, 2003; Zidouri, 2000).
Recovery and concentration factor can be used to describe
each pass or stage of an RO process, as well as the combined
RO system (including all passes or stages).
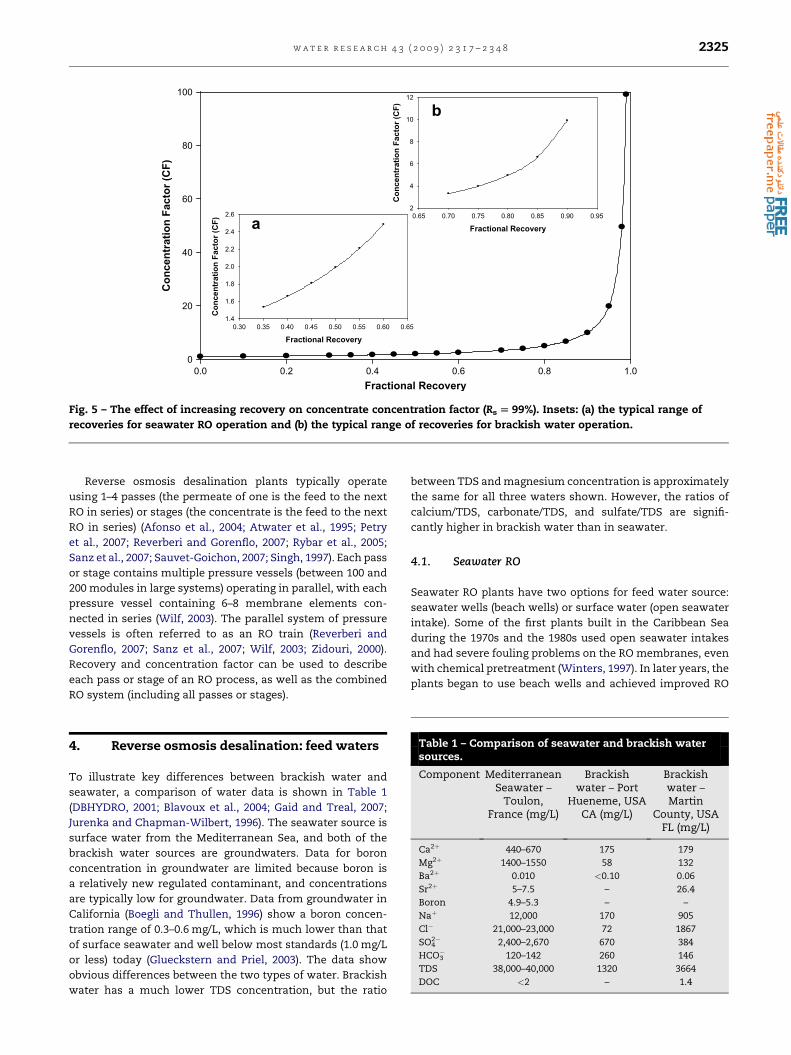
Table 1 – Comparison of seawater and brackish watersources.
Component MediterraneanSeawater –
Toulon,France (mg/L)
Brackishwater – Port
Hueneme, USACA (mg/L)
Brackishwater –Martin
County, USAFL (mg/L)
Ca2þ 440–670 175 179
Mg2þ 1400–1550 58 132
Ba2þ 0.010 <0.10 0.06
Sr2þ 5–7.5 – 26.4
Boron 4.9–5.3 – –
Naþ 12,000 170 905
Cl� 21,000–23,000 72 1867
SO42� 2,400–2,670 670 384
HCO3� 120–142 260 146
TDS 38,000–40,000 1320 3664
DOC <2 – 1.4
4. Reverse osmosis desalination: feed waters
To illustrate key differences between brackish water and
seawater, a comparison of water data is shown in Table 1
(DBHYDRO, 2001; Blavoux et al., 2004; Gaid and Treal, 2007;
Jurenka and Chapman-Wilbert, 1996). The seawater source is
surface water from the Mediterranean Sea, and both of the
brackish water sources are groundwaters. Data for boron
concentration in groundwater are limited because boron is
a relatively new regulated contaminant, and concentrations
are typically low for groundwater. Data from groundwater in
California (Boegli and Thullen, 1996) show a boron concen-
tration range of 0.3–0.6 mg/L, which is much lower than that
of surface seawater and well below most standards (1.0 mg/L
or less) today (Glueckstern and Priel, 2003). The data show
obvious differences between the two types of water. Brackish
water has a much lower TDS concentration, but the ratio
between TDS and magnesium concentration is approximately
the same for all three waters shown. However, the ratios of
calcium/TDS, carbonate/TDS, and sulfate/TDS are signifi-
cantly higher in brackish water than in seawater.
4.1. Seawater RO
Seawater RO plants have two options for feed water source:
seawater wells (beach wells) or surface water (open seawater
intake). Some of the first plants built in the Caribbean Sea
during the 1970s and the 1980s used open seawater intakes
and had severe fouling problems on the RO membranes, even
with chemical pretreatment (Winters, 1997). In later years, the
plants began to use beach wells and achieved improved RO

w a t e r r e s e a r c h 4 3 ( 2 0 0 9 ) 2 3 1 7 – 2 3 4 82326
membrane performance (Winters, 1997). The key difference
between water sources from open seawater intakes and beach
wells is the concentration of organic and particulate material
in the water. Similar to fresh water resources (groundwater
versus lakes and rivers), water obtained from wells is natu-
rally filtered through porous media (sand, clay, stone, etc.),
and much of the organic material typically present in surface
waters is removed. Today, as larger and larger RO plants are
designed, beach wells cannot always provide enough water,
and open seawater intakes are the only feed source option
(Bonnelye et al., 2004; Brehant et al., 2003).
Typical seawater concentrations around the world can
range from less than 35,000 mg/L to greater than 45,000 mg/L.
A summary of several feed water sources and associated TDS
concentrations is shown in Table 2 (Gaid and Treal, 2007;
Ravizky and Nadav, 2007; Wilf and Klinko, 2001; Zidouri, 2000).
4.2. Brackish water RO
Brackish water sources are often groundwaters; these
groundwaters can be naturally saline aquifers or groundwater
that has become brackish due to seawater intrusion or
anthropogenic influences (e.g., overuse and irrigation).
Surface brackish waters are less common but may occur
naturally or through anthropogenic activities. Brackish waters
can have a wide range of TDS (1000–10,000 mg/L) and are
typically characterized by low organic carbon content and low
particulate or colloidal contaminants. Some brackish water
components, such as boron and silica, have concentrations
that can vary widely from source to source; an important
factor in brackish water RO system optimization is accurate
characterization of the specific feed water.
5. Feed water contaminants
5.1. Seawater RO
Seawater sources often have particulate and colloidal
contaminants, as well as hydrocarbons from oil contamina-
tion and biological contaminants (algal blooms and other
microorganisms).
One of the most difficult seawater components to remove
is boron, an inorganic molecule shown to cause adverse
reproductive and developmental effects, as well as plant and
crop damage (Desotelle, 2001; Magara et al., 1998; Nadav et al.,
Table 2 – Total dissolved salt concentrations for selectedsalt water bodies around the world.
Water body TDS concentration (mg/L)
Tampa Bay 18,000–31,000
Pacific Ocean 34,000
Mediterranean Sea 38,000–40,500
Atlantic Ocean 38,500–40,000
Red Sea 41,000–42,000
Gulf of Oman 40,000–48,000
Persian Gulf 42,000–45,000
Dead Sea 275,000
2005). In general, ions are rejected better by RO membranes
than respective neutral counterparts. Boron naturally exists
as boric acid (B(OH)3) in aqueous solution and is typically
found in seawater within the concentration range of 4.5–
6.0 mg/L (Gaid and Treal, 2007; Glueckstern and Priel, 2003;
Magara et al., 2000). Due to a relatively high pKa, boron
(pKa¼ 9.2 for fresh water, 8.5 for seawater), has limited ion
dissociation at neutral or low pH values. In addition, drinking
water standards for boron have become increasingly stringent
(Glueckstern and Priel, 2003, 2007; Sauvet-Goichon, 2007).
Boron ionization and, thus, boron rejection can be increased
by increasing the pH of the feed water, but increasing the pH
can cause salt precipitation and subsequent membrane
scaling (deposition of salt precipitates on the RO membrane).
Therefore, boron removal often requires multiple RO stages
with different pH values, where the first stage (at lower pH)
achieves salt removal and a second stage (at higher pH)
achieves boron removal (Glueckstern and Priel, 2003; Sauvet-
Goichon, 2007; Wilf and Bartels, 2004).
While a standard seawater RO membrane will reject up to
99.7% of sodium (Naþ) and chloride (Cl�), operating at neutral
pH, the membrane will only reject approximately 75–80% of
boron (Glueckstern and Priel, 2003; Magara et al., 2000; Wilf
and Bartels, 2004). For a boron concentration of 4.5 mg/L with
a rejection of 80% and a recovery of 45%, the boron concen-
tration in the permeate would be 2.0 mg/L. This permeate
concentration is at least double the concentration of the
minimum boron concentration for many drinking water
standards (0.3–1.0 mg/L) (Glueckstern and Priel, 2003; Magara
et al., 1998, 2000; Sauvet-Goichon, 2007). Boron rejection
increases as pH increases, and can reach 98–99% at pH 11
(Glueckstern and Priel, 2003; Magara et al., 1998); however,
even a second pass RO unit treating first pass permeate cannot
operate much above pH 10, due to salt precipitation (Glueck-
stern and Priel, 2003).
5.2. Brackish water RO
Boron can also be a contaminant in brackish water RO systems.
As a consequence of the lower general salt rejection of brackish
water RO membranes (compared to seawater RO), boron is
typically rejected at 65–80% at manufacturer test conditions
(25 �C, 15% recovery, pressure of 1030 kPa, 1500 mg/L NaCl feed
solution, pH 6.5–7.0) (Glueckstern and Priel, 2003, Hydranau-
tics, 2002). However, in real systems, boron rejection can be as
low as 15–20% (Glueckstern and Priel, 2007). Due to this low
boron removal by brackish water membranes, the higher
overall recovery of brackish water RO systems, and the pres-
ence of scaling ions in the permeate, a second RO pass at high
pH (>10) is not feasible. Therefore, brackish water RO systems
utilize another boron removal strategy: boron-specific ion
exchange (Glueckstern and Priel, 2007; Jacob, 2007).
Other contaminants exist in certain water resources, due
to either natural occurrence or human pollution. Contami-
nants such as radionuclides and fluoride naturally exist in
some brackish groundwater resources. Human-impacted
water sources also have artificially increased levels of nitrates
(fertilizers), pesticides (agricultural land use), arsenic (mining
operations), and endocrine disrupters (pharmaceuticals in
wastewater) (Mickley, 2001). During RO membrane filtration,
w a t e r r e s e a r c h 4 3 ( 2 0 0 9 ) 2 3 1 7 – 2 3 4 8 2327
these contaminants are retained in the concentrate, and the
concentrate must be treated before disposal. Specific water
contaminants can also dictate the type of concentrate
disposal used; deep well injection is used for some brackish
water RO plants in Florida that have radionuclides in the
concentrate.
SDI (%/min)
0 1 2 3 4 5 6 7
Flo
w resistan
ce o
f fo
ulan
t, Rt (p
si)
0
50
100
150
200
250
300
Fig. 6 – The effect of increasing SDI on the permeate flow
resistance of water foulant, indicating a higher fouling
propensity (Kremen and Tanner, 1998).
6. Membrane fouling
Two fouling mechanisms are generally observed for
membrane processes: surface fouling and fouling in pores.
However, RO membranes do not have distinguishable pores
and are considered to be essentially non-porous. Thus, the
main fouling mechanism for RO membranes is surface
fouling. Surface fouling can occur from a variety of contami-
nants, including suspended particulate matter (inorganic or
organic), dissolved organic matter, dissolved solids, and
biogenic material (Amiri and Samiei, 2007). In addition, fouling
can develop unevenly through a membrane module or
element and can occur between the membrane sheets of
a module, where spacers are located to create space for the
concentrate stream (Tran et al., 2007). Overall, seawater RO
plants, particularly those treating water from an open water
intake, are primarily fouled by organic and particulate mate-
rial, while brackish water RO plants are fouled by dissolved
inorganic salts and precipitation. However, both types of RO
can experience both general groups of contaminants. In
addition, the types of problematic foulants are site-specific,
particularly for brackish water RO, and can depend on
pretreatment processes.
The capacity of a water to foul RO membranes is often
described using the silt density index, or SDI. The SDI of
a water is determined from the fouling rate of a 0.45 mm filter
at a pressure of 207 kPa (30 psi) and is described in the ASTM
standard method D4189 (ASTM, 2007). The equation used to
calculate SDI is as follows:
SDI ¼ 100%� ð1� t1=t2Þt
(13)
where t is the total elapsed flow time, and t1 and t2 are the
times (in seconds) required to filter 500 mL of water initially
and after t minutes, respectively (ASTM, 2007; Wilf and Bar-
tels, 2006). The experiment is setup as a dead-end filtration
with continuous flow under pressure, and the membrane is
perpendicular to the permeate flow. The total time t is chosen
(the standard is 15 min), and the sample flows though the
filter during the entire 15 min. As water flows through the
membrane, foulants will continuously accumulate on and
foul the membrane; therefore, t1 is expected to be smaller than
t2. Both conventional and membrane pretreatment lower the
SDI of feed water, but each pretreatment choice may have
negative and positive aspects (technologically and finan-
cially). An SDI of 3 or less (Bonnelye et al., 2004; Reverter et al.,
2001; Rybar et al., 2005) is preferred for RO influent. However,
many plants tolerate SDI values between 4 and 5, which is
often the achievable range through conventional pretreat-
ment (Bonnelye et al., 2004; Bu-Rashid and Czolkoss, 2007;
Chua et al., 2003; Isaias, 2001; Morenski, 1992; Petry et al.,
2007).
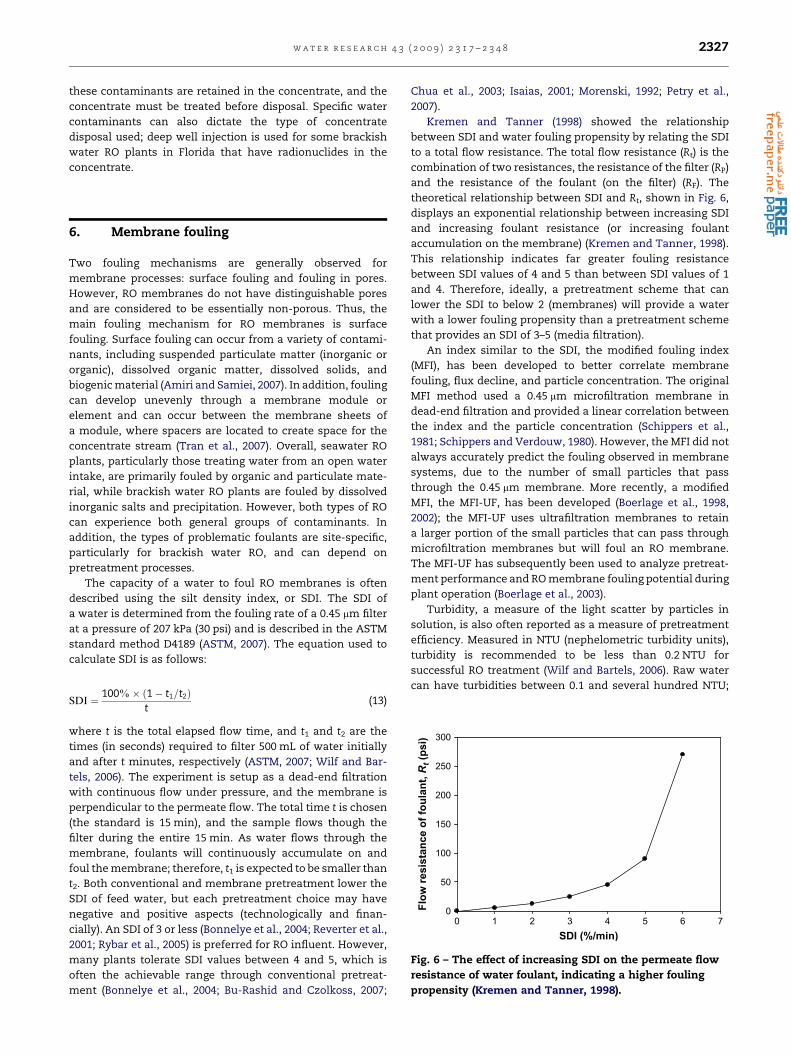
Kremen and Tanner (1998) showed the relationship
between SDI and water fouling propensity by relating the SDI
to a total flow resistance. The total flow resistance (Rt) is the
combination of two resistances, the resistance of the filter (RP)
and the resistance of the foulant (on the filter) (RF). The
theoretical relationship between SDI and Rt, shown in Fig. 6,
displays an exponential relationship between increasing SDI
and increasing foulant resistance (or increasing foulant
accumulation on the membrane) (Kremen and Tanner, 1998).
This relationship indicates far greater fouling resistance
between SDI values of 4 and 5 than between SDI values of 1
and 4. Therefore, ideally, a pretreatment scheme that can
lower the SDI to below 2 (membranes) will provide a water
with a lower fouling propensity than a pretreatment scheme
that provides an SDI of 3–5 (media filtration).
An index similar to the SDI, the modified fouling index
(MFI), has been developed to better correlate membrane
fouling, flux decline, and particle concentration. The original
MFI method used a 0.45 mm microfiltration membrane in
dead-end filtration and provided a linear correlation between
the index and the particle concentration (Schippers et al.,
1981; Schippers and Verdouw, 1980). However, the MFI did not
always accurately predict the fouling observed in membrane
systems, due to the number of small particles that pass
through the 0.45 mm membrane. More recently, a modified
MFI, the MFI-UF, has been developed (Boerlage et al., 1998,
2002); the MFI-UF uses ultrafiltration membranes to retain
a larger portion of the small particles that can pass through
microfiltration membranes but will foul an RO membrane.
The MFI-UF has subsequently been used to analyze pretreat-
ment performance and RO membrane fouling potential during
plant operation (Boerlage et al., 2003).
Turbidity, a measure of the light scatter by particles in
solution, is also often reported as a measure of pretreatment
efficiency. Measured in NTU (nephelometric turbidity units),
turbidity is recommended to be less than 0.2 NTU for
successful RO treatment (Wilf and Bartels, 2006). Raw water
can have turbidities between 0.1 and several hundred NTU;
w a t e r r e s e a r c h 4 3 ( 2 0 0 9 ) 2 3 1 7 – 2 3 4 82328
most RO plants are reported to have raw water turbidities of
below 45 NTU (Bonnelye et al., 2004; Petry et al., 2007; Xu et al.,
2007).
Both SDI and turbidity have limitations in predicting the
quality and fouling ability of a RO feed water. The SDI test
uses a dead-end filtration cell, whereas most commercial RO
membrane modules operate in crossflow mode. In addition,
the membrane (0.45 mm) used for SDI does not retain
contaminants such as biological polymers (Fritzmann et al.,
2007); biofouling, often a critical concern for RO operation,
cannot be predicted by SDI. In addition, SDI values do not
correlate linearly with colloidal or suspended matter, two
important foulant groups. Research has shown varying
fouling problems that do not necessarily correlate to the SDI
value of the feed water (Park et al., 2006; Yiantsios et al.,
2005); therefore, SDI can be used as one indicator of a water’s
fouling potential but should not be relied upon as the sole
indicator for fouling (Fritzmann et al., 2007). No direct
relationship between SDI and turbidity is possible, although
low SDI values often correspond to low turbidity (Wilf and
Bartels, 2006).
6.1. Seawater RO
Calcium carbonate is usually the sole problematic precipitate
in seawater RO, and often the lower seawater RO recoveries
(limited by osmotic pressure) prevent any precipitation prob-
lems. Therefore, precipitation is not likely to occur in seawater
RO applications (Magara et al., 2000; Reverter et al., 2001), and
fouling during seawater RO is primarily caused by particulate
matter, organic compounds, and biological growth.
Membrane fouling is caused by the deposition of organic
and inorganic water contaminants and can occur in several
layers. Suspended and colloidal particles foul a membrane by
coagulating together and forming a cake-like layer on the
membrane surface, while dissolved organics will interact
directly with the membrane surface and with each other to
cause fouling (Tran et al., 2007). Colloidal particles are often
composed of clay, organics, and metal inorganics, such as
aluminum and iron silicates (Amjad et al., 1996). Biological
fouling occurs when microbial cells accumulate and attach to
surfaces (membranes and spacers), forming biofilms. As
membrane fouling occurs, basic membrane functions deteri-
orate, including salt passage through the membrane,
permeate flow, and pressure drop across the membrane
(Morenski, 1992). To reverse this fouling, chemical cleaning
(acid or base) is used, and operational downtime is often
required (Amjad et al., 1996).
6.2. Brackish water RO
The critical fouling problem in brackish water RO systems is
salt precipitation and membrane scaling. The higher relative
concentrations of calcium, carbonate, and sulfate, combined
with the higher recoveries possible for brackish water, cause
calcium sulfate and carbonate precipitates to be typical
concerns in brackish water RO. An important factor in the
membrane fouling potential of dissolved inorganics is
concentration polarization. While calcium carbonate is often
the primary precipitate of concern, many other salts can be
problematic in brackish water RO. Some groundwater sulfate
concentrations, such as those found in southern California
(450–670 mg/L) (Leitz and Boegli, 2001), can reach high levels
due to farming and fertilization. Calcium sulfate precipitation
and membrane scaling have been extensively studied (Hasson
et al., 2001; Lee et al., 2003; Oner et al., 1998; Rahardianto et al.,
2006; Shih et al., 2004); barium sulfate, strontium sulfate, and
silicates, have low solubilities and can become limiting factors
in brackish water RO recovery (Rahardianto et al., 2007).
However, barium and strontium precipitates tend to be less
important because the cations are present in low concentra-
tions, as compared to calcium.
The process of membrane scaling occurs in several
stages (Darton, 2000). The first stage of homogeneous
precipitation occurs when ions of opposite charge associate
and begin to cluster together in large groups (>1000 atoms).
In the second stage, the ion clusters begin to form nuclei,
characterized by more orderly association and aligning of
ions. The third, and final, stage is the growth of salt crystals
on the formed nuclei (seed crystals). While the first two
stages are reversible, the third stage is irreversible and will
continue to occur until the ion concentrations decrease to
reach the solubility limit. Heterogeneous precipitation may
also occur, where nuclei or ion clusters precipitate associate
with suspended or colloidal particles in solution (Boffardi,
1997). In addition, metals such as magnesium, barium, and
strontium often coprecipitate when salts such as calcium
carbonate precipitate.
Chemicals called antiscalants are used in brackish water
RO systems to prevent precipitation. Antiscalants prevent
precipitation by disrupting one or more aspects of the crys-
tallization stages. In particular, antiscalants are able to be
used at relatively low concentrations (<10 mg/L), where the
ion concentrations are stoichiometrically much higher. Anti-
scalants are effective in increasing the ion concentration
threshold required for clustering, as well as disrupting the
nuclei ordering and crystal structure. Some antiscalants also
will adsorb onto crystal surfaces and repel other ions in
solution or fully chelate with dissolved ions. Of all of the
possible actions between antiscalants and ions, only the
chelation mechanism requires equimolar amounts of ion and
antiscalant.
Antiscalants were originally developed in the 1800s for use
in boilers and cooling water (Darton, 2000); today, the chem-
icals have been adapted for use in RO systems. Antiscalants
are organophosphonate-, polyphosphate- or polymer-type
compounds that are added to the feed water before the feed
enters the RO modules. Antiscalants do not completely
prevent precipitation at high ion concentrations, and as the
salt concentration increases, precipitation will eventually
occur.
Antiscalants themselves can become foulants if used at
excessive concentrations (Rahardianto et al., 2007); typical
antiscalant concentrations in the RO feed do not exceed
35 mg/L and are often less than 10 mg/L (Boffardi, 1997; Has-
san et al., 1998; Hasson et al., 2001; Rahardianto et al., 2006;
Shih et al., 2004; Vrouwenvelder et al., 2000). Some anti-
scalants have additional limitations: polyacrylic acid anti-
scalants will foul membranes in the presence of high iron
concentrations, and hexametaphosphate (SHMP) will

w a t e r r e s e a r c h 4 3 ( 2 0 0 9 ) 2 3 1 7 – 2 3 4 8 2329
eventually hydrolyze in the presence of air, producing inor-
ganic phosphate, possibly leading to calcium phosphate
precipitation (Hydranautics, 2003). High concentrations of
antiscalants in feed tanks or dosing systems can promote
precipitation and biological growth, and the placement of the
antiscalant dosing system is critical to avoid unwanted reac-
tions with other chemical additions (Malekar, 2005). Research
has shown that biological growth varies with antiscalant type,
and some antiscalants can increase biological growth up to
4–10 times the normal rate (Vrouwenvelder et al., 2000).
In addition, chemicals such as alum (potassium aluminum
sulfate), ferric chloride, and lime (calcium hydroxide) are used
in pretreatment coagulation and can carry through the system
and cause RO membrane fouling. Other water components,
such as silica, can cause membrane fouling in association
with added pretreatment chemicals; aluminum silicates will
precipitate during RO operation.
Tran et al. (2007) conducted a study of a spiral wound RO
membrane after it had been used for one year in a desalina-
tion plant (surface brackish water: 900 mg/L TDS), using
advanced analytical and microscopic techniques to determine
the composition of the foulant cake deposited on the
membrane surface. The results showed that foulants initially
deposited on the membrane surface as a thin, amorphous
layer (<1 mm thick) containing particulate matter. Layered on
top was another amorphous layer (w3 mm thick) containing
mostly extracellular polymeric material from organisms and
some aluminum silicate. A third and final layer formed in
areas where the first two layers were thicker (w10 mm total)
and consisted solely of aluminum silicate crystals; in this
case, the second amorphous layer contained no aluminum
silicate. Further analysis showed high concentrations of
calcium, chloride, aluminum, and phosphorus, indicating
sparingly soluble salt precipitation (CaCO3), hindered diffu-
sion or entrapment of dissolved ions, and the presence of
pretreatment chemicals (aluminum coagulant and phospho-
nate antiscalant), respectively. The amorphous matrices
contained high levels of carbon, oxygen, phosphorus, and
aluminum, indicating organic and biologic material and sili-
cate crystals.
7. Membrane cleaning
A combination of acidic and/or basic (alkaline) chemicals is
used to clean RO membranes. Common acidic solutions (pH
w2) include hydrochloric acid, phosphoric acid, sodium
hydrosulfate (Na2S2O4) and sulfamic acid (NH2SO3H), while
alkaline (pH w12) chemicals include sodium lauryl sulfate,
sodium hydroxide, sodium ethylenediamine tetraacetic acid
(Na4EDTA), and proprietary cleaners (e.g., Permaclean 33)
(Bonne et al., 2000; Fritzmann et al., 2007; Reverberi and Gor-
enflo, 2007). Most cleaning solutions are made from stock
chemical solutions to a final concentration of 0.03–2.0% (wt).
Membrane cleaning helps restore permeate flux and thus
decrease salt passage; Reverberi et al. decreased RO
membrane salt passage from 1.9% to 1.2% with alkaline
cleaning (0.025% (wt) sodium lauryl sulfate/NaOH, pH 12.5).
8. RO pretreatment for seawater andbrackish water
The primary goal of any RO pretreatment system (for seawater
or brackish water) is to lower the fouling propensity of the
water in the RO membrane system. Surface water resources
(seawater and brackish water) typically have a greater
propensity for membrane fouling and require more extensive
pretreatment systems than groundwater resources (Morenski,
1992). In general, seawater RO tends to use surface water
sources, while brackish water RO often uses groundwater
sources.
8.1. Conventional pretreatment
Conventional pretreatment typically consists of acid addition,
coagulant/flocculant addition, disinfection, media filtration,
and cartridge filtration. The first chemical additions, including
acid, coagulant, and flocculant, prepare the feed water for
granular media filtration (Isaias, 2001; Sauvet-Goichon, 2007).
Acid treatment reduces the pH of the feed water (typical pH
range 5–7), which increases the solubility of calcium
carbonate, the key potential precipitate in many feed waters.
The most common acid used to lower feed water pH is sulfuric
acid (H2SO4) (Bonnelye et al., 2004). However, hydrochloric acid
(HCl) is used when sulfuric acid addition has the potential to
cause sulfate precipitates (Hydranautics, 2003).
Aqueous particulate and colloidal matter are typically
negatively charged, and thus stay separated because like
charges repel one another. The role of coagulants is to effec-
tively neutralize like charges and allow the suspended solids
to group together in flocs (large groups of loosely bound sus-
pended particles). Therefore, coagulants are typically small,
positively charged molecules. Inorganic coagulants are
commonly iron or aluminum salts such as ferric chloride or
aluminum sulfate, while organic coagulants are typically
cationic, low molecular weight (<500,000 Da) polymers (i.e.,
dimethyldiallylammonium chloride or polyamines) (Sweet-
water Technologies, 2006). Aluminum is not as commonly
used in pretreatment coagulation prior to membrane filtra-
tion due to potential damage to the membrane system.
Typical dosing for an inorganic coagulant (5–30 mg/L) is larger
than the dose required for a polymer coagulant (0.2–1.0 mg/L)
(Wilf and Bartels, 2006). If the feed water is a moderately poor
quality water and does not require flocculation and sedi-
mentation, inline coagulation can be used just prior to media
filtration (Morenski, 1992). The primary objective of inline
coagulation is to change the surface chemistry of the sus-
pended particles so that they attach well to the media filter. It
is also possible to use both types of coagulants together to take
advantage of the different characteristics of each coagulant.
When a feed water has a high SDI (greater than 10) (Bon-
nelye et al., 2004), flocculation is often used with coagulation
before media filtration. The process of flocculation and sedi-
mentation is a well-known method of particle removal in
water treatment (Morenski, 1992). Flocculants are often high
molecular weight (>1� 107 Da), anionic polymers.
Granular media filtration includes materials such as sand,
anthracite, pumice, gravel, and garnet (Bonnelye et al., 2004;

Table 3 – Effectiveness of antiscalants: concentrationlimits (as SI) for selected salts in solution with anantiscalant (Hydranautics, 2003).
Salt Precipitate SI limit (–)
BaSO4 80
CaSO4 4
SrSO4 12
CaCO3 102.9 (LSI¼ 2.9)
Silica (SiO2) 1.6
w a t e r r e s e a r c h 4 3 ( 2 0 0 9 ) 2 3 1 7 – 2 3 4 82330
Elguera and Baez, 2005), and often, a combination of materials
is used in layers in the filtration bed to take advantage of
materials’ different effective sizes. Filtration beds can be open
to the atmosphere, using gravity to cause permeate flow, or
filters can be closed to the atmosphere and pressurized
(Elguera and Baez, 2005). Although more expensive and energy
intensive, pressurized media filtration is more common in RO
pretreatment and can typically reduce the feed water SDI by
a factor of 2 (Morenski, 1992). The turbidity of media filtration
permeate is often around 0.1 NTU (Bonnelye et al., 2004; Sanz
et al., 2007). Media filtration can be sensitive to feed water
changes, and the permeate SDI can vary several units during
events such as algal blooms and oil contamination. Oil
contamination is a particularly difficult problem, and most
often removed using dissolved air flotation (DAF) during
membrane pretreatment (Bonnelye et al., 2004; Peleka and
Matis, 2008).
Cartridge filtration is used as a last pretreatment step in
conventional RO pretreatment. The filter cartridges are
usually 1–10 mm (Elguera and Baez, 2005; Morenski, 1992; Petry
et al., 2007) and act as a final polishing step to remove larger
particles that passed through media filtration. Particulate
matter greater than 5–10 mm can foul the channels used to
remove RO concentrate (Morenski, 1992); therefore, filter
cartridges are a necessary final step before RO treatment.
Antiscalants are primarily used as pretreatment to
brackish water RO systems and are typically dosed after
granular media filtration, either before or after cartridge
filtration (Isaias, 2001; Sauvet-Goichon, 2007). The choice of
a specific antiscalant depends on the composition of the feed
water; many antiscalants are commercially available and are
designed to target specific problematic precipitates. Optimi-
zation of antiscalant type and dose is as important as coagu-
lant optimization; higher antiscalant doses do not necessarily
decrease salt precipitation, and the presence of certain
potential precipitates can change the effectiveness of
a particular antiscalant (Ghafour, 2002; Plottu-Pecheux et al.,
2002; Semiat et al., 2003).
The use of antiscalants is not recommended if the
concentration of certain potential precipitates is too high.
Supersaturation of a salt can be described by the saturation
index (SI) of the salt. The saturation index is the ratio
(SIx¼ IAP/Ksp,x) of the ion activity product (the product of the
activities of each ion in the salt) to the solubility product for
the salt (tabulated values found in Stumm and Morgan)
(Rahardianto et al., 2007; Stumm and Morgan, 1996). The limit
for calcium carbonate (CaCO3) is often expressed as the LSI, or
the Langlier Saturation Index, which is the logarithm of the SI
(log10(IAP/Ksp,CaCO3)). A list of common SI or LSI limits for
antiscalant use is shown in Table 3.
Disinfection is achieved through addition of a strong
oxidant, such as ozone, chlorine (gas, chlorine dioxide, or
sodium hypochlorite), chloramine, or potassium permanga-
nate (Morenski, 1992). The oxidant is typically dosed at a high
enough concentration to allow residual disinfectant through
the rest of the pretreatment system and prevent biological
growth. For example, chlorine is typically dosed to allow for
a residual concentration of 0.5–1.0 mg/L (Reverter et al., 2001).
If chlorine is used as the disinfectant, activated carbon (typi-
cally contained in a filter) or sodium bisulfite is used at the end
of the pretreatment system to remove (chemically reduce) the
chlorine (Hydranautics, 2003). Sodium bisulfite is less expen-
sive and more commonly used for large desalination facilities
(Morenski, 1992). The majority of RO membranes on the
market today are made of aromatic polyamides, and such
structures are known to be sensitive to chemical attack by
chlorine. Extended chlorine exposure will cause membrane
deterioration and a decrease in salt rejection (Hydranautics,
2003). Other oxidants, such as ozone, can be used to disinfect,
but will cause the formation of bromate, a known and
regulated carcinogen, in waters containing bromide. All
disinfection processes cause the formation of disinfection by-
products, which are potentially toxic oxidation products
formed by reactions between the disinfectant and organic and
inorganic water components.
8.2. Membrane pretreatment
Although conventional pretreatment has been widely used for
seawater and brackish water RO plants, variations in feed
water can cause variations in conventional pretreatment
effectiveness. Often, colloids and suspended particles pass
through conventional pretreatment and contribute to difficult
to remove (and possibly irreversible) RO membrane fouling
(Brehant et al., 2003).
A new trend in pretreatment has been a movement
towards the use of larger pore size membranes (MF, UF, and
NF) to pretreat RO feed water. Installations and pilot-scale
testing of MF and UF membranes have increased; however,
pilot tests show successful implementation of NF pretreat-
ment to RO as well. Both MF and UF modules have backwash
(cleaning) and near dead-end modes of operation that give
these membranes more operational flexibility than NF
modules. UF membranes seem to be, by far, the most common
choice in research studies and pilot testing (Brehant et al.,
2003; Bu-Rashid and Czolkoss, 2007; Kamp et al., 2000; Pearce,
2007; Pearce et al., 2003; Teuler et al., 1999; Tiwari et al., 2006;
Vedavyasan, 2007; Wilf and Bartels, 2006; Xu et al., 2007); UF
membranes represent perhaps the best balance between
contaminant removal and permeate production of the three
membrane types; UF membranes have smaller pore sizes than
MF membranes and higher flux than NF membranes.
However, all three membranes have advantageous charac-
teristics, and each treatment plant must choose pretreatment
based on specific contaminant removal issues. MF
membranes are the appropriate choice for removal of larger
particulate matter at higher permeate fluxes, while NF
membranes are used to remove dissolved contaminants, as
well as particulate and colloidal material.
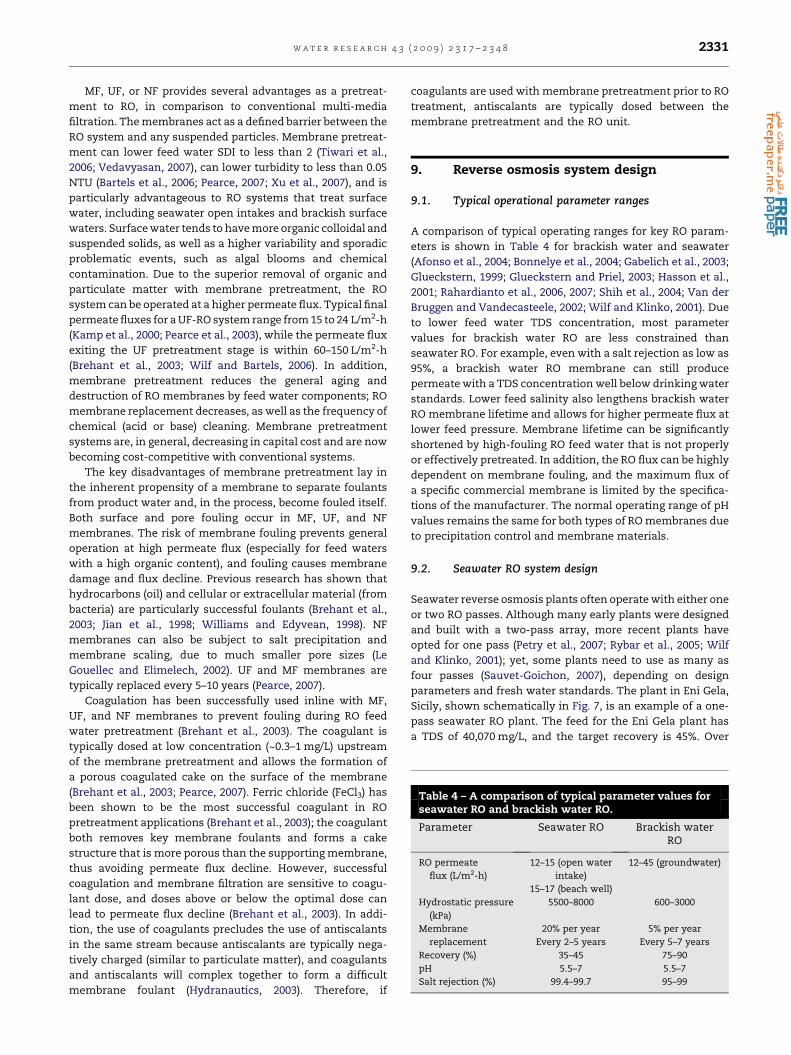
Table 4 – A comparison of typical parameter values forseawater RO and brackish water RO.
Parameter Seawater RO Brackish waterRO
RO permeate
flux (L/m2-h)
12–15 (open water
intake)
12–45 (groundwater)
15–17 (beach well)
Hydrostatic pressure
(kPa)
5500–8000 600–3000
Membrane
replacement
20% per year 5% per year
Every 2–5 years Every 5–7 years
Recovery (%) 35–45 75–90
pH 5.5–7 5.5–7
Salt rejection (%) 99.4–99.7 95–99
w a t e r r e s e a r c h 4 3 ( 2 0 0 9 ) 2 3 1 7 – 2 3 4 8 2331
MF, UF, or NF provides several advantages as a pretreat-
ment to RO, in comparison to conventional multi-media
filtration. The membranes act as a defined barrier between the
RO system and any suspended particles. Membrane pretreat-
ment can lower feed water SDI to less than 2 (Tiwari et al.,
2006; Vedavyasan, 2007), can lower turbidity to less than 0.05
NTU (Bartels et al., 2006; Pearce, 2007; Xu et al., 2007), and is
particularly advantageous to RO systems that treat surface
water, including seawater open intakes and brackish surface
waters. Surface water tends to have more organic colloidal and
suspended solids, as well as a higher variability and sporadic
problematic events, such as algal blooms and chemical
contamination. Due to the superior removal of organic and
particulate matter with membrane pretreatment, the RO
system can be operated at a higher permeate flux. Typical final
permeate fluxes for a UF-RO system range from 15 to 24 L/m2-h
(Kamp et al., 2000; Pearce et al., 2003), while the permeate flux
exiting the UF pretreatment stage is within 60–150 L/m2-h
(Brehant et al., 2003; Wilf and Bartels, 2006). In addition,
membrane pretreatment reduces the general aging and
destruction of RO membranes by feed water components; RO
membrane replacement decreases, as well as the frequency of
chemical (acid or base) cleaning. Membrane pretreatment
systems are, in general, decreasing in capital cost and are now
becoming cost-competitive with conventional systems.
The key disadvantages of membrane pretreatment lay in
the inherent propensity of a membrane to separate foulants
from product water and, in the process, become fouled itself.
Both surface and pore fouling occur in MF, UF, and NF
membranes. The risk of membrane fouling prevents general
operation at high permeate flux (especially for feed waters
with a high organic content), and fouling causes membrane
damage and flux decline. Previous research has shown that
hydrocarbons (oil) and cellular or extracellular material (from
bacteria) are particularly successful foulants (Brehant et al.,
2003; Jian et al., 1998; Williams and Edyvean, 1998). NF
membranes can also be subject to salt precipitation and
membrane scaling, due to much smaller pore sizes (Le
Gouellec and Elimelech, 2002). UF and MF membranes are
typically replaced every 5–10 years (Pearce, 2007).
Coagulation has been successfully used inline with MF,
UF, and NF membranes to prevent fouling during RO feed
water pretreatment (Brehant et al., 2003). The coagulant is
typically dosed at low concentration (~0.3–1 mg/L) upstream
of the membrane pretreatment and allows the formation of
a porous coagulated cake on the surface of the membrane
(Brehant et al., 2003; Pearce, 2007). Ferric chloride (FeCl3) has
been shown to be the most successful coagulant in RO
pretreatment applications (Brehant et al., 2003); the coagulant
both removes key membrane foulants and forms a cake
structure that is more porous than the supporting membrane,
thus avoiding permeate flux decline. However, successful
coagulation and membrane filtration are sensitive to coagu-
lant dose, and doses above or below the optimal dose can
lead to permeate flux decline (Brehant et al., 2003). In addi-
tion, the use of coagulants precludes the use of antiscalants
in the same stream because antiscalants are typically nega-
tively charged (similar to particulate matter), and coagulants
and antiscalants will complex together to form a difficult
membrane foulant (Hydranautics, 2003). Therefore, if
coagulants are used with membrane pretreatment prior to RO
treatment, antiscalants are typically dosed between the
membrane pretreatment and the RO unit.
9. Reverse osmosis system design
9.1. Typical operational parameter ranges
A comparison of typical operating ranges for key RO param-
eters is shown in Table 4 for brackish water and seawater
(Afonso et al., 2004; Bonnelye et al., 2004; Gabelich et al., 2003;
Glueckstern, 1999; Glueckstern and Priel, 2003; Hasson et al.,
2001; Rahardianto et al., 2006, 2007; Shih et al., 2004; Van der
Bruggen and Vandecasteele, 2002; Wilf and Klinko, 2001). Due
to lower feed water TDS concentration, most parameter
values for brackish water RO are less constrained than
seawater RO. For example, even with a salt rejection as low as
95%, a brackish water RO membrane can still produce
permeate with a TDS concentration well below drinking water
standards. Lower feed salinity also lengthens brackish water
RO membrane lifetime and allows for higher permeate flux at
lower feed pressure. Membrane lifetime can be significantly
shortened by high-fouling RO feed water that is not properly
or effectively pretreated. In addition, the RO flux can be highly
dependent on membrane fouling, and the maximum flux of
a specific commercial membrane is limited by the specifica-
tions of the manufacturer. The normal operating range of pH
values remains the same for both types of RO membranes due
to precipitation control and membrane materials.
9.2. Seawater RO system design
Seawater reverse osmosis plants often operate with either one
or two RO passes. Although many early plants were designed
and built with a two-pass array, more recent plants have
opted for one pass (Petry et al., 2007; Rybar et al., 2005; Wilf
and Klinko, 2001); yet, some plants need to use as many as
four passes (Sauvet-Goichon, 2007), depending on design
parameters and fresh water standards. The plant in Eni Gela,
Sicily, shown schematically in Fig. 7, is an example of a one-
pass seawater RO plant. The feed for the Eni Gela plant has
a TDS of 40,070 mg/L, and the target recovery is 45%. Over
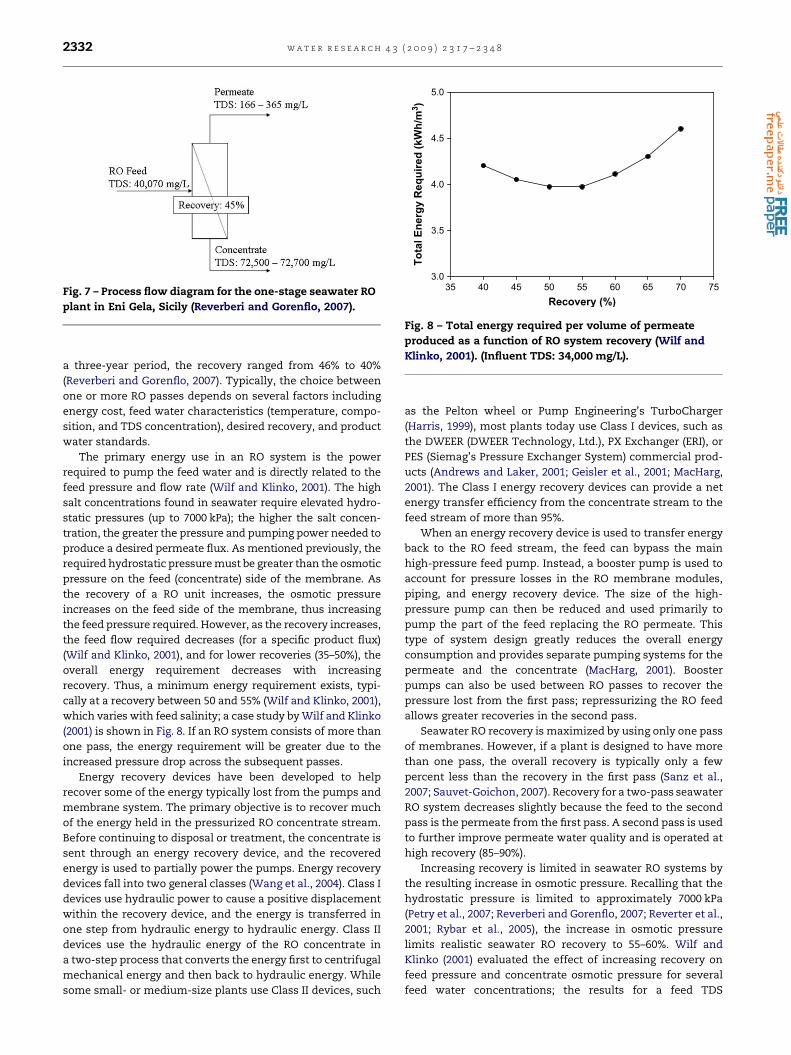
Recovery (%)
35 40 45 50 55 60 65 70 75
To
tal E
nerg
y R
eq
uired
(kW
h/m
3)
3.0
3.5
4.0
4.5
5.0
Fig. 8 – Total energy required per volume of permeate
produced as a function of RO system recovery (Wilf and
Klinko, 2001). (Influent TDS: 34,000 mg/L).
Fig. 7 – Process flow diagram for the one-stage seawater RO
plant in Eni Gela, Sicily (Reverberi and Gorenflo, 2007).
w a t e r r e s e a r c h 4 3 ( 2 0 0 9 ) 2 3 1 7 – 2 3 4 82332
a three-year period, the recovery ranged from 46% to 40%
(Reverberi and Gorenflo, 2007). Typically, the choice between
one or more RO passes depends on several factors including
energy cost, feed water characteristics (temperature, compo-
sition, and TDS concentration), desired recovery, and product
water standards.
The primary energy use in an RO system is the power
required to pump the feed water and is directly related to the
feed pressure and flow rate (Wilf and Klinko, 2001). The high
salt concentrations found in seawater require elevated hydro-
static pressures (up to 7000 kPa); the higher the salt concen-
tration, the greater the pressure and pumping power needed to
produce a desired permeate flux. As mentioned previously, the
required hydrostatic pressure must be greater than the osmotic
pressure on the feed (concentrate) side of the membrane. As
the recovery of a RO unit increases, the osmotic pressure
increases on the feed side of the membrane, thus increasing
the feed pressure required. However, as the recovery increases,
the feed flow required decreases (for a specific product flux)
(Wilf and Klinko, 2001), and for lower recoveries (35–50%), the
overall energy requirement decreases with increasing
recovery. Thus, a minimum energy requirement exists, typi-
cally at a recovery between 50 and 55% (Wilf and Klinko, 2001),
which varies with feed salinity; a case study by Wilf and Klinko
(2001) is shown in Fig. 8. If an RO system consists of more than
one pass, the energy requirement will be greater due to the
increased pressure drop across the subsequent passes.
Energy recovery devices have been developed to help
recover some of the energy typically lost from the pumps and
membrane system. The primary objective is to recover much
of the energy held in the pressurized RO concentrate stream.
Before continuing to disposal or treatment, the concentrate is
sent through an energy recovery device, and the recovered
energy is used to partially power the pumps. Energy recovery
devices fall into two general classes (Wang et al., 2004). Class I
devices use hydraulic power to cause a positive displacement
within the recovery device, and the energy is transferred in
one step from hydraulic energy to hydraulic energy. Class II
devices use the hydraulic energy of the RO concentrate in
a two-step process that converts the energy first to centrifugal
mechanical energy and then back to hydraulic energy. While
some small- or medium-size plants use Class II devices, such
as the Pelton wheel or Pump Engineering’s TurboCharger
(Harris, 1999), most plants today use Class I devices, such as
the DWEER (DWEER Technology, Ltd.), PX Exchanger (ERI), or
PES (Siemag’s Pressure Exchanger System) commercial prod-
ucts (Andrews and Laker, 2001; Geisler et al., 2001; MacHarg,
2001). The Class I energy recovery devices can provide a net
energy transfer efficiency from the concentrate stream to the
feed stream of more than 95%.
When an energy recovery device is used to transfer energy
back to the RO feed stream, the feed can bypass the main
high-pressure feed pump. Instead, a booster pump is used to
account for pressure losses in the RO membrane modules,
piping, and energy recovery device. The size of the high-
pressure pump can then be reduced and used primarily to
pump the part of the feed replacing the RO permeate. This
type of system design greatly reduces the overall energy
consumption and provides separate pumping systems for the
permeate and the concentrate (MacHarg, 2001). Booster
pumps can also be used between RO passes to recover the
pressure lost from the first pass; repressurizing the RO feed
allows greater recoveries in the second pass.
Seawater RO recovery is maximized by using only one pass
of membranes. However, if a plant is designed to have more
than one pass, the overall recovery is typically only a few
percent less than the recovery in the first pass (Sanz et al.,
2007; Sauvet-Goichon, 2007). Recovery for a two-pass seawater
RO system decreases slightly because the feed to the second
pass is the permeate from the first pass. A second pass is used
to further improve permeate water quality and is operated at
high recovery (85–90%).
Increasing recovery is limited in seawater RO systems by
the resulting increase in osmotic pressure. Recalling that the
hydrostatic pressure is limited to approximately 7000 kPa
(Petry et al., 2007; Reverberi and Gorenflo, 2007; Reverter et al.,
2001; Rybar et al., 2005), the increase in osmotic pressure
limits realistic seawater RO recovery to 55–60%. Wilf and
Klinko (2001) evaluated the effect of increasing recovery on
feed pressure and concentrate osmotic pressure for several
feed water concentrations; the results for a feed TDS
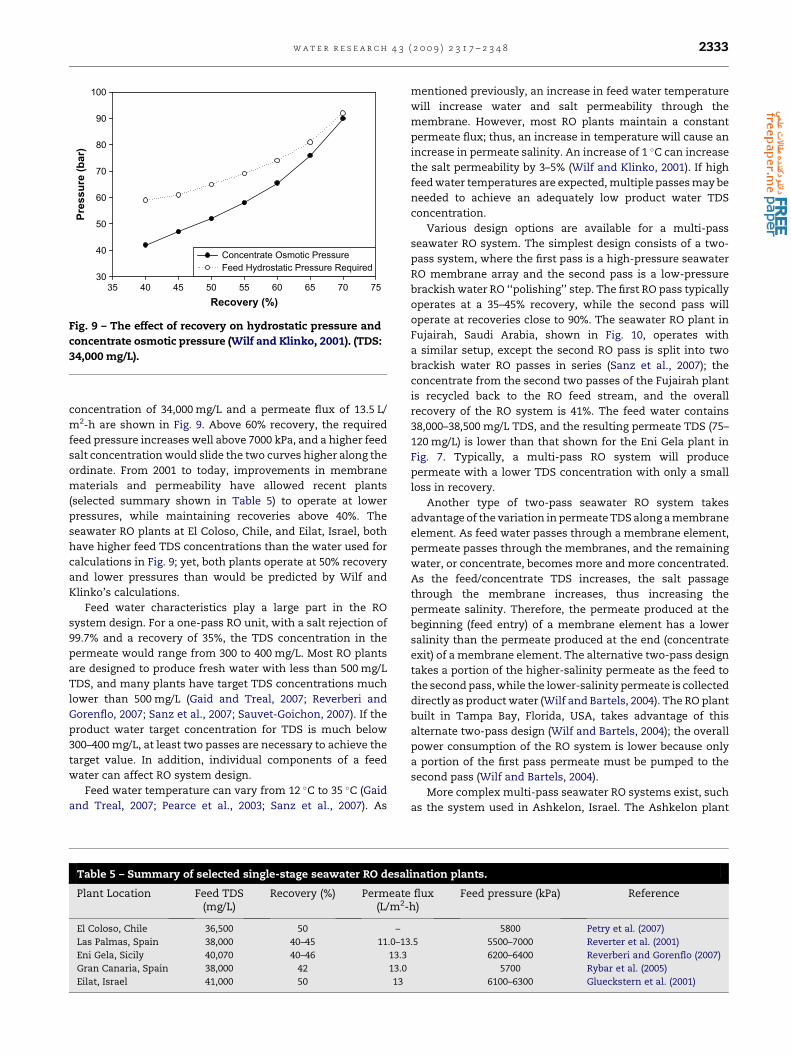
Recovery (%)
35 40 45 50 55 60 65 70 75
Pressu
re (b
ar)
30
40
50
60
70
80
90
100
Concentrate Osmotic PressureFeed Hydrostatic Pressure Required
Fig. 9 – The effect of recovery on hydrostatic pressure and
concentrate osmotic pressure (Wilf and Klinko, 2001). (TDS:
34,000 mg/L).
w a t e r r e s e a r c h 4 3 ( 2 0 0 9 ) 2 3 1 7 – 2 3 4 8 2333
concentration of 34,000 mg/L and a permeate flux of 13.5 L/
m2-h are shown in Fig. 9. Above 60% recovery, the required
feed pressure increases well above 7000 kPa, and a higher feed
salt concentration would slide the two curves higher along the
ordinate. From 2001 to today, improvements in membrane
materials and permeability have allowed recent plants
(selected summary shown in Table 5) to operate at lower
pressures, while maintaining recoveries above 40%. The
seawater RO plants at El Coloso, Chile, and Eilat, Israel, both
have higher feed TDS concentrations than the water used for
calculations in Fig. 9; yet, both plants operate at 50% recovery
and lower pressures than would be predicted by Wilf and
Klinko’s calculations.
Feed water characteristics play a large part in the RO
system design. For a one-pass RO unit, with a salt rejection of
99.7% and a recovery of 35%, the TDS concentration in the
permeate would range from 300 to 400 mg/L. Most RO plants
are designed to produce fresh water with less than 500 mg/L
TDS, and many plants have target TDS concentrations much
lower than 500 mg/L (Gaid and Treal, 2007; Reverberi and
Gorenflo, 2007; Sanz et al., 2007; Sauvet-Goichon, 2007). If the
product water target concentration for TDS is much below
300–400 mg/L, at least two passes are necessary to achieve the
target value. In addition, individual components of a feed
water can affect RO system design.
Feed water temperature can vary from 12 �C to 35 �C (Gaid
and Treal, 2007; Pearce et al., 2003; Sanz et al., 2007). As
Table 5 – Summary of selected single-stage seawater RO desal
Plant Location Feed TDS(mg/L)
Recovery (%) Permeate(L/m2-
El Coloso, Chile 36,500 50 –
Las Palmas, Spain 38,000 40–45 11.0–13
Eni Gela, Sicily 40,070 40–46 13.3
Gran Canaria, Spain 38,000 42 13.0
Eilat, Israel 41,000 50 13
mentioned previously, an increase in feed water temperature
will increase water and salt permeability through the
membrane. However, most RO plants maintain a constant
permeate flux; thus, an increase in temperature will cause an
increase in permeate salinity. An increase of 1 �C can increase
the salt permeability by 3–5% (Wilf and Klinko, 2001). If high
feed water temperatures are expected, multiple passes may be
needed to achieve an adequately low product water TDS
concentration.
Various design options are available for a multi-pass
seawater RO system. The simplest design consists of a two-
pass system, where the first pass is a high-pressure seawater
RO membrane array and the second pass is a low-pressure
brackish water RO ‘‘polishing’’ step. The first RO pass typically
operates at a 35–45% recovery, while the second pass will
operate at recoveries close to 90%. The seawater RO plant in
Fujairah, Saudi Arabia, shown in Fig. 10, operates with
a similar setup, except the second RO pass is split into two
brackish water RO passes in series (Sanz et al., 2007); the
concentrate from the second two passes of the Fujairah plant
is recycled back to the RO feed stream, and the overall
recovery of the RO system is 41%. The feed water contains
38,000–38,500 mg/L TDS, and the resulting permeate TDS (75–
120 mg/L) is lower than that shown for the Eni Gela plant in
Fig. 7. Typically, a multi-pass RO system will produce
permeate with a lower TDS concentration with only a small
loss in recovery.
Another type of two-pass seawater RO system takes
advantage of the variation in permeate TDS along a membrane
element. As feed water passes through a membrane element,
permeate passes through the membranes, and the remaining
water, or concentrate, becomes more and more concentrated.
As the feed/concentrate TDS increases, the salt passage
through the membrane increases, thus increasing the
permeate salinity. Therefore, the permeate produced at the
beginning (feed entry) of a membrane element has a lower
salinity than the permeate produced at the end (concentrate
exit) of a membrane element. The alternative two-pass design
takes a portion of the higher-salinity permeate as the feed to
the second pass, while the lower-salinity permeate is collected
directly as product water (Wilf and Bartels, 2004). The RO plant
built in Tampa Bay, Florida, USA, takes advantage of this
alternate two-pass design (Wilf and Bartels, 2004); the overall
power consumption of the RO system is lower because only
a portion of the first pass permeate must be pumped to the
second pass (Wilf and Bartels, 2004).
More complex multi-pass seawater RO systems exist, such
as the system used in Ashkelon, Israel. The Ashkelon plant
ination plants.
fluxh)
Feed pressure (kPa) Reference
5800 Petry et al. (2007)
.5 5500–7000 Reverter et al. (2001)
6200–6400 Reverberi and Gorenflo (2007)
5700 Rybar et al. (2005)
6100–6300 Glueckstern et al. (2001)
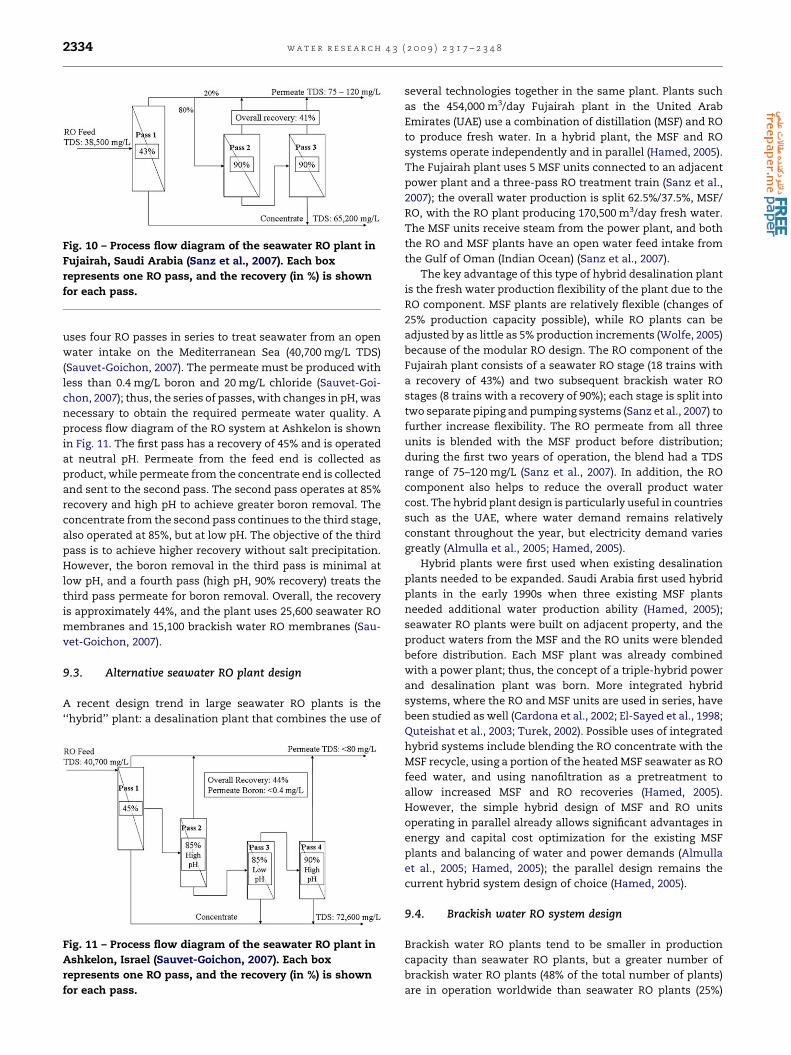
Fig. 10 – Process flow diagram of the seawater RO plant in
Fujairah, Saudi Arabia (Sanz et al., 2007). Each box
represents one RO pass, and the recovery (in %) is shown
for each pass.
w a t e r r e s e a r c h 4 3 ( 2 0 0 9 ) 2 3 1 7 – 2 3 4 82334
uses four RO passes in series to treat seawater from an open
water intake on the Mediterranean Sea (40,700 mg/L TDS)
(Sauvet-Goichon, 2007). The permeate must be produced with
less than 0.4 mg/L boron and 20 mg/L chloride (Sauvet-Goi-
chon, 2007); thus, the series of passes, with changes in pH, was
necessary to obtain the required permeate water quality. A
process flow diagram of the RO system at Ashkelon is shown
in Fig. 11. The first pass has a recovery of 45% and is operated
at neutral pH. Permeate from the feed end is collected as
product, while permeate from the concentrate end is collected
and sent to the second pass. The second pass operates at 85%
recovery and high pH to achieve greater boron removal. The
concentrate from the second pass continues to the third stage,
also operated at 85%, but at low pH. The objective of the third
pass is to achieve higher recovery without salt precipitation.
However, the boron removal in the third pass is minimal at
low pH, and a fourth pass (high pH, 90% recovery) treats the
third pass permeate for boron removal. Overall, the recovery
is approximately 44%, and the plant uses 25,600 seawater RO
membranes and 15,100 brackish water RO membranes (Sau-
vet-Goichon, 2007).
9.3. Alternative seawater RO plant design
A recent design trend in large seawater RO plants is the
‘‘hybrid’’ plant: a desalination plant that combines the use of
Fig. 11 – Process flow diagram of the seawater RO plant in
Ashkelon, Israel (Sauvet-Goichon, 2007). Each box
represents one RO pass, and the recovery (in %) is shown
for each pass.
several technologies together in the same plant. Plants such
as the 454,000 m3/day Fujairah plant in the United Arab
Emirates (UAE) use a combination of distillation (MSF) and RO
to produce fresh water. In a hybrid plant, the MSF and RO
systems operate independently and in parallel (Hamed, 2005).
The Fujairah plant uses 5 MSF units connected to an adjacent
power plant and a three-pass RO treatment train (Sanz et al.,
2007); the overall water production is split 62.5%/37.5%, MSF/
RO, with the RO plant producing 170,500 m3/day fresh water.
The MSF units receive steam from the power plant, and both
the RO and MSF plants have an open water feed intake from
the Gulf of Oman (Indian Ocean) (Sanz et al., 2007).
The key advantage of this type of hybrid desalination plant
is the fresh water production flexibility of the plant due to the
RO component. MSF plants are relatively flexible (changes of
25% production capacity possible), while RO plants can be
adjusted by as little as 5% production increments (Wolfe, 2005)
because of the modular RO design. The RO component of the
Fujairah plant consists of a seawater RO stage (18 trains with
a recovery of 43%) and two subsequent brackish water RO
stages (8 trains with a recovery of 90%); each stage is split into
two separate piping and pumping systems (Sanz et al., 2007) to
further increase flexibility. The RO permeate from all three
units is blended with the MSF product before distribution;
during the first two years of operation, the blend had a TDS
range of 75–120 mg/L (Sanz et al., 2007). In addition, the RO
component also helps to reduce the overall product water
cost. The hybrid plant design is particularly useful in countries
such as the UAE, where water demand remains relatively
constant throughout the year, but electricity demand varies
greatly (Almulla et al., 2005; Hamed, 2005).
Hybrid plants were first used when existing desalination
plants needed to be expanded. Saudi Arabia first used hybrid
plants in the early 1990s when three existing MSF plants
needed additional water production ability (Hamed, 2005);
seawater RO plants were built on adjacent property, and the
product waters from the MSF and the RO units were blended
before distribution. Each MSF plant was already combined
with a power plant; thus, the concept of a triple-hybrid power
and desalination plant was born. More integrated hybrid
systems, where the RO and MSF units are used in series, have
been studied as well (Cardona et al., 2002; El-Sayed et al., 1998;
Quteishat et al., 2003; Turek, 2002). Possible uses of integrated
hybrid systems include blending the RO concentrate with the
MSF recycle, using a portion of the heated MSF seawater as RO
feed water, and using nanofiltration as a pretreatment to
allow increased MSF and RO recoveries (Hamed, 2005).
However, the simple hybrid design of MSF and RO units
operating in parallel already allows significant advantages in
energy and capital cost optimization for the existing MSF
plants and balancing of water and power demands (Almulla
et al., 2005; Hamed, 2005); the parallel design remains the
current hybrid system design of choice (Hamed, 2005).
9.4. Brackish water RO system design
Brackish water RO plants tend to be smaller in production
capacity than seawater RO plants, but a greater number of
brackish water RO plants (48% of the total number of plants)
are in operation worldwide than seawater RO plants (25%)
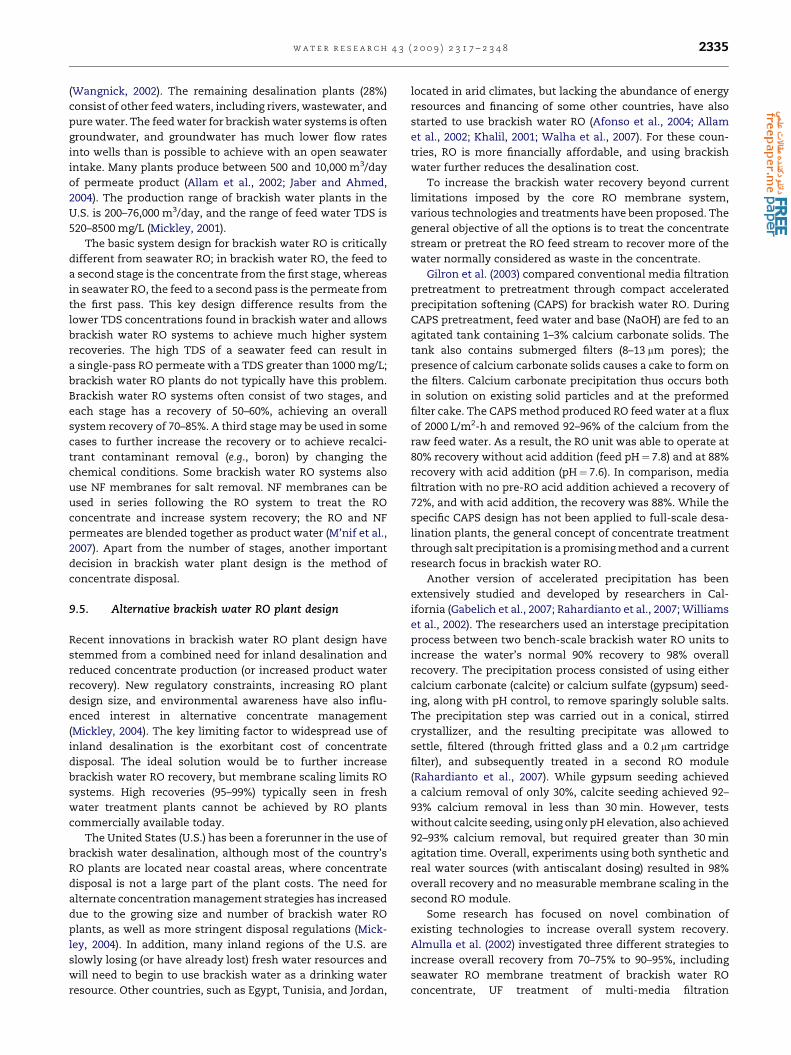
w a t e r r e s e a r c h 4 3 ( 2 0 0 9 ) 2 3 1 7 – 2 3 4 8 2335
(Wangnick, 2002). The remaining desalination plants (28%)
consist of other feed waters, including rivers, wastewater, and
pure water. The feed water for brackish water systems is often
groundwater, and groundwater has much lower flow rates
into wells than is possible to achieve with an open seawater
intake. Many plants produce between 500 and 10,000 m3/day
of permeate product (Allam et al., 2002; Jaber and Ahmed,
2004). The production range of brackish water plants in the
U.S. is 200–76,000 m3/day, and the range of feed water TDS is
520–8500 mg/L (Mickley, 2001).
The basic system design for brackish water RO is critically
different from seawater RO; in brackish water RO, the feed to
a second stage is the concentrate from the first stage, whereas
in seawater RO, the feed to a second pass is the permeate from
the first pass. This key design difference results from the
lower TDS concentrations found in brackish water and allows
brackish water RO systems to achieve much higher system
recoveries. The high TDS of a seawater feed can result in
a single-pass RO permeate with a TDS greater than 1000 mg/L;
brackish water RO plants do not typically have this problem.
Brackish water RO systems often consist of two stages, and
each stage has a recovery of 50–60%, achieving an overall
system recovery of 70–85%. A third stage may be used in some
cases to further increase the recovery or to achieve recalci-
trant contaminant removal (e.g., boron) by changing the
chemical conditions. Some brackish water RO systems also
use NF membranes for salt removal. NF membranes can be
used in series following the RO system to treat the RO
concentrate and increase system recovery; the RO and NF
permeates are blended together as product water (M’nif et al.,
2007). Apart from the number of stages, another important
decision in brackish water plant design is the method of
concentrate disposal.
9.5. Alternative brackish water RO plant design
Recent innovations in brackish water RO plant design have
stemmed from a combined need for inland desalination and
reduced concentrate production (or increased product water
recovery). New regulatory constraints, increasing RO plant
design size, and environmental awareness have also influ-
enced interest in alternative concentrate management
(Mickley, 2004). The key limiting factor to widespread use of
inland desalination is the exorbitant cost of concentrate
disposal. The ideal solution would be to further increase
brackish water RO recovery, but membrane scaling limits RO
systems. High recoveries (95–99%) typically seen in fresh
water treatment plants cannot be achieved by RO plants
commercially available today.
The United States (U.S.) has been a forerunner in the use of
brackish water desalination, although most of the country’s
RO plants are located near coastal areas, where concentrate
disposal is not a large part of the plant costs. The need for
alternate concentration management strategies has increased
due to the growing size and number of brackish water RO
plants, as well as more stringent disposal regulations (Mick-
ley, 2004). In addition, many inland regions of the U.S. are
slowly losing (or have already lost) fresh water resources and
will need to begin to use brackish water as a drinking water
resource. Other countries, such as Egypt, Tunisia, and Jordan,
located in arid climates, but lacking the abundance of energy
resources and financing of some other countries, have also
started to use brackish water RO (Afonso et al., 2004; Allam
et al., 2002; Khalil, 2001; Walha et al., 2007). For these coun-
tries, RO is more financially affordable, and using brackish
water further reduces the desalination cost.
To increase the brackish water recovery beyond current
limitations imposed by the core RO membrane system,
various technologies and treatments have been proposed. The
general objective of all the options is to treat the concentrate
stream or pretreat the RO feed stream to recover more of the
water normally considered as waste in the concentrate.
Gilron et al. (2003) compared conventional media filtration
pretreatment to pretreatment through compact accelerated
precipitation softening (CAPS) for brackish water RO. During
CAPS pretreatment, feed water and base (NaOH) are fed to an
agitated tank containing 1–3% calcium carbonate solids. The
tank also contains submerged filters (8–13 mm pores); the
presence of calcium carbonate solids causes a cake to form on
the filters. Calcium carbonate precipitation thus occurs both
in solution on existing solid particles and at the preformed
filter cake. The CAPS method produced RO feed water at a flux
of 2000 L/m2-h and removed 92–96% of the calcium from the
raw feed water. As a result, the RO unit was able to operate at
80% recovery without acid addition (feed pH¼ 7.8) and at 88%
recovery with acid addition (pH¼ 7.6). In comparison, media
filtration with no pre-RO acid addition achieved a recovery of
72%, and with acid addition, the recovery was 88%. While the
specific CAPS design has not been applied to full-scale desa-
lination plants, the general concept of concentrate treatment
through salt precipitation is a promising method and a current
research focus in brackish water RO.
Another version of accelerated precipitation has been
extensively studied and developed by researchers in Cal-
ifornia (Gabelich et al., 2007; Rahardianto et al., 2007; Williams
et al., 2002). The researchers used an interstage precipitation
process between two bench-scale brackish water RO units to
increase the water’s normal 90% recovery to 98% overall
recovery. The precipitation process consisted of using either
calcium carbonate (calcite) or calcium sulfate (gypsum) seed-
ing, along with pH control, to remove sparingly soluble salts.
The precipitation step was carried out in a conical, stirred
crystallizer, and the resulting precipitate was allowed to
settle, filtered (through fritted glass and a 0.2 mm cartridge
filter), and subsequently treated in a second RO module
(Rahardianto et al., 2007). While gypsum seeding achieved
a calcium removal of only 30%, calcite seeding achieved 92–
93% calcium removal in less than 30 min. However, tests
without calcite seeding, using only pH elevation, also achieved
92–93% calcium removal, but required greater than 30 min
agitation time. Overall, experiments using both synthetic and
real water sources (with antiscalant dosing) resulted in 98%
overall recovery and no measurable membrane scaling in the
second RO module.
Some research has focused on novel combination of
existing technologies to increase overall system recovery.
Almulla et al. (2002) investigated three different strategies to
increase overall recovery from 70–75% to 90–95%, including
seawater RO membrane treatment of brackish water RO
concentrate, UF treatment of multi-media filtration

Fig. 12 – A possible configuration for a combined system of
brackish water RO and boron ion exchange (Glueckstern
and Priel, 2007).
Fig. 13 – Boron removal in a brackish water RO system
using seawater RO membranes in the second and third
stages.
w a t e r r e s e a r c h 4 3 ( 2 0 0 9 ) 2 3 1 7 – 2 3 4 82336
backwash, and crystallizer-UF treatment of brackish water RO
concentrate. The seawater RO membranes were operated at
a feed pressure of 2700 kPa and a recovery of 40%, increasing
the overall recovery from 73% to 83% (Almulla et al., 2002).
During this brackish water RO concentrate treatment,
precipitation of calcium carbonate, magnesium sulfate, and
silica dioxide limited the recovery. When UF was used to treat
media filter backwash, at least 92% of the backwash water was
recovered, and the overall system recovery increased to 85.4%.
Finally, the researchers showed, through jar tests, that crys-
tallization could remove significant portions of the silica
(83%), calcium (92%), and magnesium (92%) (Almulla et al.,
2002); the overall system recovery due to crystallizer-UF
concentrate treatment was estimated at 95%.
Another option to traditional concentrate disposal is the
treatment of the concentrate for specific salt recovery (Mick-
ley, 2004). Using the specific makeup of the concentrate,
individual salts can be removed in series using pH changes
and salt precipitation. The process has been developed by
companies such as Geo-Processors Pty Limited (Australia),
and has been used successfully to treat concentrate in pilot
and commercial applications. In Eilat, Israel, the concentrate
from a seawater RO plant is used to produce salt (Ravizky and
Nadav, 2007). The feed to the RO plant is a blend of seawater
and concentrate from a local brackish water RO plant. In this
way, the brackish water RO plant avoids seawater pollution
and discharge costs by ultimately using the concentrate to
produce a consumer product.
For brackish water resources with elevated boron concen-
trations, the conventional two-stage RO design is expanded to
include additional RO stages or an ion exchange system to
achieve boron removal. Although grouped within the general
treatment process of ion exchange, the resin used to remove
boron will complex with ionized or neutral boron (boric acid)
molecules (Jacob, 2007). Therefore, the resin is very specific
and can be used at the same neutral or acidic pH designed for
the subsequent RO system. No other ions in solution are
affected by the boron-specific resin, and a typical ion
exchange column will reduce the boron concentration to less
than 0.05 mg/L. In comparison, the boron concentration after
a first pass seawater RO membrane is between 1 and 2 mg/L,
and a second pass at high pH can reduce the boron concen-
tration to below 0.5 mg/L (Jacob, 2007; Sauvet-Goichon, 2007).
The boron-specific ion exchange column is typically placed
after the RO system (Glueckstern and Priel, 2007; Jacob, 2007);
if there are several RO stages, which is common in brackish
water RO, boron ion exchange may be used to treat the
permeate from all or selected RO stages. The world’s first
brackish water RO plant using boron ion exchange started
operation (in Israel) in May 2006 (Jacob, 2007); as more and
more countries follow Israel’s lead in adopting strict boron
standards for drinking water, the ion exchange technology is
likely to be increasingly applied. A RO-ion exchange system
proposed by Glueckstern and Priel (2007) is shown in Fig. 12.
Another treatment option for boron removal in brackish
water RO systems is specially designed RO membranes for
removal at neutral or acidic pH or the use of seawater RO
membranes for the second and/or third stages of a brackish
water RO system (Glueckstern and Priel, 2007). However, the
first membrane option requires more energy, and the second
option requires pH elevation (Glueckstern and Priel, 2007); the
appropriate technology must be chosen after evaluation of the
specific plant design. A design for boron removal in a brackish
water RO system using seawater RO membranes in subse-
quent stages is shown in Fig. 13.
10. RO permeate post-treatment
10.1. Seawater RO
The permeate from seawater RO is often treated before
distribution. Depending on the permeate TDS, the permeate
may be blended with another water to either increase or
decrease the salinity (Sanz et al., 2007; Zidouri, 2000). Lime
(Ca(OH)2) or limestone contactors may be added to increase
the hardness, alkalinity and pH, as well as prevent the water
from causing calcium to leach from pipes in the distribution
system (Khawaji et al., 2007). Hardness is necessary to achieve

w a t e r r e s e a r c h 4 3 ( 2 0 0 9 ) 2 3 1 7 – 2 3 4 8 2337
the typical taste of drinking water and prevent corrosion,
while alkalinity is the primary buffering system of all natural
waters. Alkalinity (carbonate and bicarbonate) helps to stabi-
lize the water pH during distribution and use. If additional
hardness or alkalinity is not needed, another base, such as
caustic soda (NaOH), may be used for pH adjustment. The
permeate is also disinfected, typically through the use of
chlorine, sodium hypochlorite, or chloramines. Permeate
treatment may also include fluoride replacement (El-Ramly
and Peterson, 1999).
10.2. Brackish water RO
Similar to seawater RO, brackish water RO permeate has
extremely low levels of calcium and bicarbonate (alkalinity),
and these two components must be replenished before
distribution. In brackish water RO systems, a portion of the RO
feed water is often blended with the RO permeate to replace
hardness and alkalinity, and caustic soda is used for pH
adjustment. If feed water blending is not possible, typically
due to lower feed water quality, the addition of lime or the use
of limestone contactors is often used (Walker et al., 2007;
Watson et al., 1995). As with seawater RO permeate, brackish
water RO permeate is also disinfected before distribution.
11. RO concentrate disposal
11.1. Seawater RO
For seawater RO plants, the disposal method is usually
discharge back into the same body of water; the primary
concerns are only the pumping system and length of piping
needed to reach the chosen discharge point underwater (Mooij,
2007; Ravizky and Nadav, 2007). The feed water intake and the
concentrate discharge are positioned in separate locations,
and the concentrate is diluted into the large seawater body
without influencing the feed water composition.
11.2. Brackish water RO
If feasible, surface water disposal is the disposal method of
choice for brackish water plants due to higher costs of other
options. However, surface water discharge is often limited to
coastal RO plants; otherwise, the large amount of piping
needed to transport concentrate from an inland plant to the
sea is financially prohibitive. Some inland brackish water RO
plants discharge concentrate to local lakes and rivers. Unlike
seawater discharge, brackish water RO concentrate, if dis-
charged to surface water, can change the salinity of the
receiving water. The change in salinity can change the
concentration of dissolved oxygen in the water and negatively
affect aquatic life; the standard limit for surface water
discharge is a salinity difference of less than 10% (Mickley,
2004).
If the feed to a brackish water RO plant is groundwater, the
plant must often treat the RO concentrate before disposal.
Treatment is particularly important if the concentrate is dis-
charged to surface water. Groundwater can have high
concentrations of gases, such as carbon dioxide, ammonia,
and hydrogen sulfide, some of which are toxic to aquatic
animals (Kimes, 1995; Mickley, 2001). Concentrate treatment
can include pH adjustment, chlorination, dechlorination,
degasification, and aeration (Mickley, 2001). High levels of
fluoride and calcium in RO concentrate have also been shown
to be toxic to certain test organisms, although concentrate
treatment does not typically remove these contaminants.
With a growing need for inland desalination of brackish
water, other disposal options must be used, and thus far,
a wide range of methods have been put into practice
(Bloetscher et al., 2006; Mickley, 2001, 2004; Van der Bruggen
et al., 2003). Each method has advantages and disadvantages,
often representing a compromise between cost, local available
resources, environmental impact, and technology.
After surface water discharge, concentrate disposal to
a combined sewer is often the method of choice. A combined
sewer transports concentrate and other wastewaters to a local
municipal wastewater treatment plant, where the mix of both
waters is treated; some of the salt from the concentrate flow
becomes part of the sludge (dewatered solid waste product
from the wastewater treatment plant), while the rest remains
dissolved and becomes a part of the plant effluent. High
salinity can negatively affect biological treatment processes
and cause discharge permit violations (Mickley, 2004). Local
regulations, the size of the desalination plant, and availability
of a nearby wastewater treatment plant often dictate the
feasibility of this disposal option. If the concentrate flow is too
large or too saline, the desalination plant may not be able to
use sewer disposal.
Brackish water desalination plants located near green
(parks, golf courses) or agricultural areas can sometimes use
the RO concentrate as irrigation water. Although this disposal
option is advantageous to the desalination plant, as the
concentrate waste becomes a needed product, irrigation with
concentrate can cause several problems. The use of saline
water for crop irrigation adds salt to the soil and to the local
groundwater aquifers (Mickley, 2001). Build-up of the salt in
the soil can affect future crop growth, while the groundwater
will slowly increase in salinity over time. In addition, high
boron concentrations in the irrigation water can cause plant
damage (Glueckstern and Priel, 2003). While a useful concen-
trate disposal solution, the irrigation application eventually
creates the need for more desalination in areas that once had
fresh groundwater resources.
Evaporation ponds are often considered the basic,
conventional concentrate management option and were
originally relatively inexpensive to build, given adequate
space. However, today, regulations have been put in place to
protect the local soil and groundwater from the salts and other
potential chemicals that can leach into the ground from
evaporation ponds (Nicot et al., 2007). Evaporation ponds have
been primarily used in the Middle East and Australia, with
some use in the U.S. (Texas) (Glater and Cohen, 2003).
Research in the Middle East (Oman, United Arab Emirates,
Israel) has shown the need for pond leakage monitoring and
for enhanced evaporation strategies (Ahmed et al., 2001; Gil-
ron et al., 2003; Glater and Cohen, 2003). In the U.S., the
climate and land available in Texas has allowed this type of
disposal to be a viable option. In comparison to Texas, other
states considering brackish water RO in the U.S. (California,

w a t e r r e s e a r c h 4 3 ( 2 0 0 9 ) 2 3 1 7 – 2 3 4 82338
Florida, East Coast states) do not have the climate and/or land
necessary to build evaporations ponds. Both irrigation and
evaporation ponds are disposal methods typically used for
smaller size RO plants (<400 m3/day) (Mickley, 2004).
Deep well injection, where the concentrate is injected
several hundred to several thousand meters into the ground
below the fresh water aquifers, is another concentrate
disposal option. This disposal option is practiced worldwide
for all types of wastewater (Glater and Cohen, 2003; Mickley,
2001; Saripalli et al., 2000) and is often the most economical
solution for inland plants. The disposal method has been used
successfully in Florida for concentrate disposal. A plant
recently started up (2007) in El Paso, Texas has chosen deep
well injection, but the method remains controversial.
Complications include appropriate site selection, concentrate
conditioning with chemicals, corrosion and leakage from the
well, possible damaging seismic activity, and unknown well
lifetime, as well as sparingly soluble salt precipitation (Glater
and Cohen, 2003). The process has not been in use long
enough to know if the injected salt will eventually leach into
the fresh water aquifers above. However, if designed appro-
priately and used for a long period of time, deep well injection
could be the least costly disposal option for large inland
desalination plants (Mickley, 2001).
For a brackish drinking water RO plant, all of the disposal
options represent a loss of water and additional plant costs. In
addition to all of the individual negative aspects of each
disposal option described, each is costly in terms of water
recovery; all of the water in the concentrate is lost during the
disposal method. Whether by evaporation, wastewater
discharge, alternate use, or injection, the water in the
concentrate is not recovered as drinking water. In addition,
most of the conventional disposal methods, except for deep
well injection, are not applicable to large inland brackish
water RO desalination plants in design today (Glater and
Cohen, 2003).
The ultimate achievement in concentrate disposal and RO
recovery is to operate a system with zero liquid discharge, or
ZLD, where the recovery would approach 100%. In ZLD, most
of the water in the concentrate is recovered as product by
completely separating the salt from the water. ZLD systems
include thermal evaporators, crystallizers, brine concentra-
tors, and spray dryers (Mickley, 2001, 2004). A ZLD system
combined with a high recovery brackish water RO system can
produce permeate with as low as 10 mg/L TDS (Mickley, 2001).
ZLD systems can be used in any geographical location and
often are easily accepted by the local community due to
positive environmental effects and minimal waste production
(Mickley, 2001). While these systems are technologically
available, the capital cost of such a system is often higher than
the cost of the desalination plant alone (Mickley, 2004). In
addition, the energy required to achieve near 100% recovery in
a ZLD system is high and often not financially possible, except
for very small RO systems. Somewhat lower costs may be
achieved by combining a brine concentrator system with an
evaporation pond, but most often this concentrate disposal
method is the most expensive option (Mickley, 2004). Today,
efforts to reduce the cost of ZLD technology continue (Bond
and Veerapaneni, 2007; Sandia, 2003) bench- and pilot-scale
tests have shown that ZLD processes can be applied to
a variety of water compositions and community needs (Bond
and Veerapaneni, 2007).
A non-thermal process that approaches ZLD is electrodi-
alysis (ED) or electrodialysis reversal (EDR). ED and EDR use ion
exchange membranes and electric current to separate ions
from water and to create a permeate and a concentrate. ED
and EDR have lower salt rejections than RO membranes (up to
60% TDS reduction per stage) but can achieve recoveries of up
to 94% in one stage and 97% with multiple stages (Reahl, 2004).
EDR is the primary technology currently used; the electric field
within the membranes is alternated, reducing membrane
scaling. While EDR can operate at higher recoveries than RO,
has longer membrane lifetimes, and requires less pre- and
post-treatment, the higher capital and energy costs have
limited the expansion of EDR. RO remains the primary choice
for membrane desalination, while EDR is primarily used for
hardness removal of low salinity brackish waters, specific
industrial applications, and as a hybrid process with RO.
12. Alternative energy sources
12.1. Seawater RO
The coupling of alternative (renewable) energy sources with
RO desalination plants has had increased interest and devel-
opment. The plants in operation are small-scale (<10 m3/day)
plants and represent approximately 0.02% of the total world
desalination capacity (Mathioulakis et al., 2007). These plants
are largely demonstration or research plants and often oper-
ate non-continuously; in addition, renewable energy sources
are still more expensive than traditional resources (Helal
et al., 2008; Lamei et al., 2008). Therefore, the unit cost oper-
ation for RO coupled with renewable energy is higher than for
typical RO plants. Communities that would typically benefit
from coupled renewable energy–RO systems are located in
rural areas, where financial resources and system mainte-
nance personnel are limited. Factors including capital cost,
sustainable technology, technical operation, social accep-
tance, and energy resource availability, have contributed to
the slow growth of the renewable energy–RO market
(Mathioulakis et al., 2007).
The three main renewable energy sources available are
solar (photovoltaic and thermal), wind and geothermal
energy. The thermal energy sources are most often used with
distillation desalination, while wind and photovoltaic solar
energy are commonly paired with RO desalination. The
combined choices of energy and process take advantage of
matching the type of energy with the type of process (thermal
versus mechanical). These RO systems can use seawater or
brackish water as the feed source and are typically small to
medium plants. Overall, the energy source most often used
has been solar energy (70% of market), and RO has the
majority (62%) of the renewable energy desalination market
(Mathioulakis et al., 2007).
Solar-powered desalination is possibly the most promising
alternative energy choice, and both distillation and
membrane plants have been designed and operated. In
particular, countries already advanced in conventional RO
desalination, such as Spain, Italy, and Saudi Arabia, have
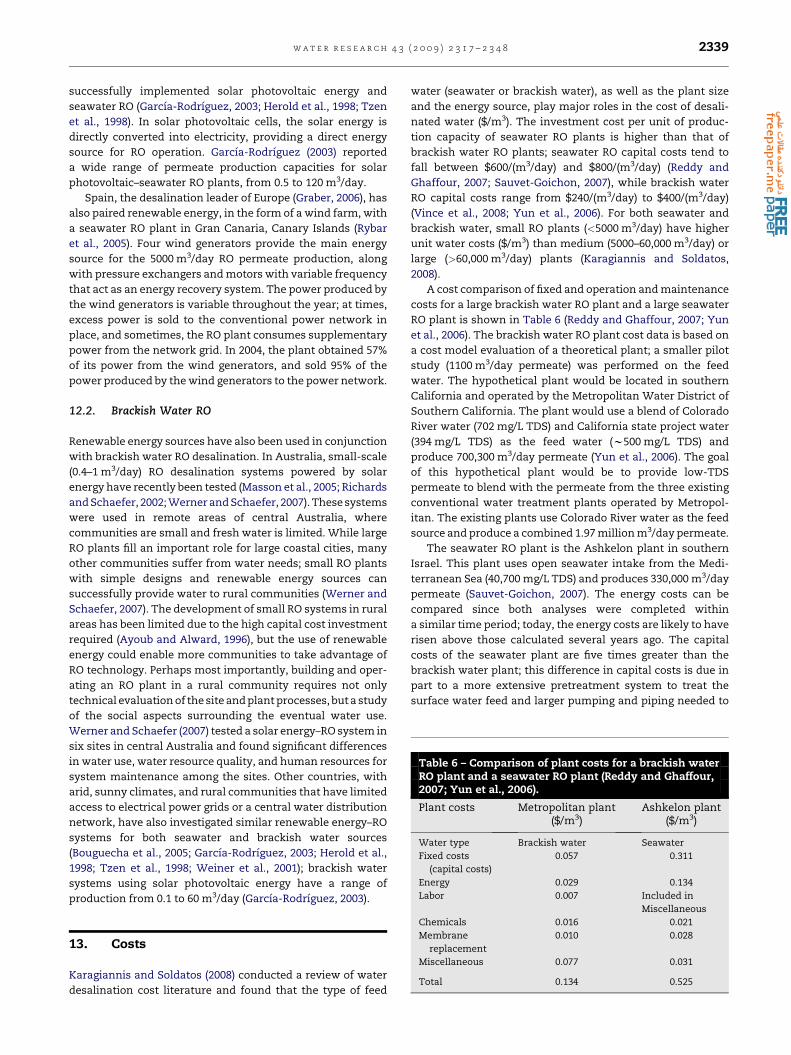
Table 6 – Comparison of plant costs for a brackish waterRO plant and a seawater RO plant (Reddy and Ghaffour,2007; Yun et al., 2006).
Plant costs Metropolitan plant($/m3)
Ashkelon plant($/m3)
Water type Brackish water Seawater
Fixed costs
(capital costs)
0.057 0.311
Energy 0.029 0.134
Labor 0.007 Included in
w a t e r r e s e a r c h 4 3 ( 2 0 0 9 ) 2 3 1 7 – 2 3 4 8 2339
successfully implemented solar photovoltaic energy and
seawater RO (Garcıa-Rodrıguez, 2003; Herold et al., 1998; Tzen
et al., 1998). In solar photovoltaic cells, the solar energy is
directly converted into electricity, providing a direct energy
source for RO operation. Garcıa-Rodrıguez (2003) reported
a wide range of permeate production capacities for solar
photovoltaic–seawater RO plants, from 0.5 to 120 m3/day.
Spain, the desalination leader of Europe (Graber, 2006), has
also paired renewable energy, in the form of a wind farm, with
a seawater RO plant in Gran Canaria, Canary Islands (Rybar
et al., 2005). Four wind generators provide the main energy
source for the 5000 m3/day RO permeate production, along
with pressure exchangers and motors with variable frequency
that act as an energy recovery system. The power produced by
the wind generators is variable throughout the year; at times,
excess power is sold to the conventional power network in
place, and sometimes, the RO plant consumes supplementary
power from the network grid. In 2004, the plant obtained 57%
of its power from the wind generators, and sold 95% of the
power produced by the wind generators to the power network.
12.2. Brackish Water RO
Renewable energy sources have also been used in conjunction
with brackish water RO desalination. In Australia, small-scale
(0.4–1 m3/day) RO desalination systems powered by solar
energy have recently been tested (Masson et al., 2005; Richards
and Schaefer, 2002; Werner and Schaefer, 2007). These systems
were used in remote areas of central Australia, where
communities are small and fresh water is limited. While large
RO plants fill an important role for large coastal cities, many
other communities suffer from water needs; small RO plants
with simple designs and renewable energy sources can
successfully provide water to rural communities (Werner and
Schaefer, 2007). The development of small RO systems in rural
areas has been limited due to the high capital cost investment
required (Ayoub and Alward, 1996), but the use of renewable
energy could enable more communities to take advantage of
RO technology. Perhaps most importantly, building and oper-
ating an RO plant in a rural community requires not only
technical evaluation of the site and plant processes, but a study
of the social aspects surrounding the eventual water use.
Werner and Schaefer (2007) tested a solar energy–RO system in
six sites in central Australia and found significant differences
in water use, water resource quality, and human resources for
system maintenance among the sites. Other countries, with
arid, sunny climates, and rural communities that have limited
access to electrical power grids or a central water distribution
network, have also investigated similar renewable energy–RO
systems for both seawater and brackish water sources
(Bouguecha et al., 2005; Garcıa-Rodrıguez, 2003; Herold et al.,
1998; Tzen et al., 1998; Weiner et al., 2001); brackish water
systems using solar photovoltaic energy have a range of
production from 0.1 to 60 m3/day (Garcıa-Rodrıguez, 2003).
MiscellaneousChemicals 0.016 0.021
Membrane
replacement
0.010 0.028
Miscellaneous 0.077 0.031
Total 0.134 0.525
13. Costs
Karagiannis and Soldatos (2008) conducted a review of water
desalination cost literature and found that the type of feed
water (seawater or brackish water), as well as the plant size
and the energy source, play major roles in the cost of desali-
nated water ($/m3). The investment cost per unit of produc-
tion capacity of seawater RO plants is higher than that of
brackish water RO plants; seawater RO capital costs tend to
fall between $600/(m3/day) and $800/(m3/day) (Reddy and
Ghaffour, 2007; Sauvet-Goichon, 2007), while brackish water
RO capital costs range from $240/(m3/day) to $400/(m3/day)
(Vince et al., 2008; Yun et al., 2006). For both seawater and
brackish water, small RO plants (<5000 m3/day) have higher
unit water costs ($/m3) than medium (5000–60,000 m3/day) or
large (>60,000 m3/day) plants (Karagiannis and Soldatos,
2008).
A cost comparison of fixed and operation and maintenance
costs for a large brackish water RO plant and a large seawater
RO plant is shown in Table 6 (Reddy and Ghaffour, 2007; Yun
et al., 2006). The brackish water RO plant cost data is based on
a cost model evaluation of a theoretical plant; a smaller pilot
study (1100 m3/day permeate) was performed on the feed
water. The hypothetical plant would be located in southern
California and operated by the Metropolitan Water District of
Southern California. The plant would use a blend of Colorado
River water (702 mg/L TDS) and California state project water
(394 mg/L TDS) as the feed water (w500 mg/L TDS) and
produce 700,300 m3/day permeate (Yun et al., 2006). The goal
of this hypothetical plant would be to provide low-TDS
permeate to blend with the permeate from the three existing
conventional water treatment plants operated by Metropol-
itan. The existing plants use Colorado River water as the feed
source and produce a combined 1.97 million m3/day permeate.
The seawater RO plant is the Ashkelon plant in southern
Israel. This plant uses open seawater intake from the Medi-
terranean Sea (40,700 mg/L TDS) and produces 330,000 m3/day
permeate (Sauvet-Goichon, 2007). The energy costs can be
compared since both analyses were completed within
a similar time period; today, the energy costs are likely to have
risen above those calculated several years ago. The capital
costs of the seawater plant are five times greater than the
brackish water plant; this difference in capital costs is due in
part to a more extensive pretreatment system to treat the
surface water feed and larger pumping and piping needed to
w a t e r r e s e a r c h 4 3 ( 2 0 0 9 ) 2 3 1 7 – 2 3 4 82340
move the seawater RO concentrate (because of the lower RO
recovery). Energy costs for the seawater RO plant are nearly
five times greater than those of the brackish water RO plant,
due to higher pressures and lower recovery. The chemical
costs are similar, while the membrane replacement costs are
greater for the seawater RO system. Seawater RO membranes
typically have shorter lifetimes and must be replaced more
often due to fouling.
Hafez and El-Manharawy and Yun et al., give more detailed
analyses of specific plant capital costs for a set of small
seawater RO plants and for a large brackish water RO plant,
respectively. The cost data include site-specific feed intake,
pretreatment, post-treatment, site development and concen-
trate treatment costs (Hafez and El-Manharawy, 2002; Yun
et al., 2006). A more detailed explanation of the factors
affecting seawater RO and brackish water RO costs is pre-
sented below.
13.1. Seawater RO
The key to widespread interest and implementation of
seawater RO plants has been a significant reduction in capital
and operation/maintenance costs over the past 30 years. The
unit cost of water from RO production has decreased from
close to $5.00/m3 in the late 1970s to less than $1.00/m3 in 2004
(Zhou and Tol, 2004). Plants built in the 1990s produced water
at a cost of $1.00/m3–$2.00/m3 (Wilf and Bartels, 2004), while
recent plants built in Israel (Ashkelon plant, production star-
ted in 2005) and the United Arab Emirates (Fujairah plant,
production started in 2005) cost $0.53/m3 (in 2005) (Sauvet-
Goichon, 2007) and $0.87/m3 (Dawoud, 2005), respectively. The
production capacities and water prices of several seawater RO
plants are presented in Table 7 (Reverse Osmosis Desalination
Plants Reference List, 2005; Dawoud, 2005; Glueckstern et al.,
Table 7 – Summary of production and water prices forseveral large seawater RO desalination plants.
Plant location 1st year ofproduction
ROproduction
capacity(m3/day)
Water price($/m3)
Galder-Agaete, Spain 1989 3500 1.94
Jeddah, Saudi Arabia 1989 23,000 1.31
Ad Dur, Bahrain 1990 45,000 1.30
Lanzarote III and
Agragua, Spain
1991 10,000� 2 1.62/1.34
Santa Barbara,
California, USA
1992 25,000 1.51
Dhkelia, Cyprus 1997 40,000 1.46
Mallorca and
Marbella, Spain
1998 42,000/56,400 1.03/1.00
Eilat, Israel 1998 10,000 0.72
Larnarca, Cyprus 2001 56,000 0.83
Eilat, Israel 2003 10,000 0.81
Tampa Bay,
Florida, USA
2003 94,600 0.55
Fujairah, United
Arab Emirates
2005 170,500 0.87
Ashkelon, Israel 2005 320,000 0.53
2001; Magara et al., 2000; Sauvet-Goichon, 2007; Tsiourtis,
2001; Wilf and Bartels, 2006; Wilf and Klinko, 2001).
Several factors have helped reduce RO energy consump-
tion and costs, including improvements in membrane mate-
rials and technology (higher flux, higher salt rejection, lower
hydrostatic pressure required, lower materials cost) and the
use of pressure recovery devices (Reddy and Ghaffour, 2007;
Zhou and Tol, 2004). RO has also become less expensive than
thermal processes, which require 10 times the electricity
(Service, 2006), as crude oil prices have risen from 20 US$/bbl
(per barrel) in 1997, to approximately 70 US$/bbl in 2007 (Blank
et al., 2007). More recently, oil prices have risen past 100 US$/
bbl (Lee, 2008; Martin, 2007; Pflimlin, 2007). While oil prices
increase, many project bids continue to base predicted energy
costs on a figure of 5 US$/bbl (Blank et al., 2007). This incon-
gruence in predicted verses actual energy costs allows
thermal desalination plants to still be compared to RO desa-
lination plants as economic options. However, RO desalina-
tion is more energy efficient, and the process will continue to
improve with new membrane materials and modifications.
While most RO plants still use fossil fuels as the electricity
source, future RO plants may take advantage of renewable
energy resources or nuclear energy to further reduce costs
(Mathioulakis et al., 2007; Reddy and Ghaffour, 2007; Rybar
et al., 2005; Werner and Schaefer, 2007).
Both the relative capital cost and the energy cost (per unit
of plant production capacity) of a RO plant decrease as plant
size increases (Almulla et al., 2005; Avlonitis et al., 2003). The
energy required by a RO system is primarily used to power
pumps; the larger the plant, the greater the required power for
larger pumping systems. For seawater RO plants, the power
costs can account for up to 50% of the total plant operating
and maintenance costs (Younos, 2003). The second largest
cost is typically fixed costs (approximately 37%), including
capital investment amortization and insurance (Miller, 2003;
Younos, 2003). Other costs include maintenance and parts
(7%), membrane replacement (5%), labor (4%), and consum-
able chemicals (3%) (Miller, 2003).
For a specific size plant, the choice in target recovery can
greatly affect the cost of the plant (Wilf and Klinko, 2001). Most
plants are designed to have a target permeate or product
(volumetric) flow (Nadav et al., 2005; Petry et al., 2007; Rever-
beri and Gorenflo, 2007; Reverter et al., 2001; Sauvet-Goichon,
2007). For a fixed permeate flow, as recovery increases, the
required feed flow decreases because more of the feed flow
passes through the membranes as permeate. Thus, for higher
recovery, all associated equipment (i.e., piping, pumps, storage
tanks, pretreatment equipment, chemical dosing systems,
concentrate outfall) can be sized smaller, and costs decrease.
However, the increasing osmotic pressure with increasing
recovery eventually overtakes the benefit of smaller feed flow,
and at seawater RO recoveries above 55–60%, total water cost
begins to increase (Wilf and Klinko, 2001). This optimal
recovery percent range increases for less saline feed water.
RO pretreatment contributes significantly to the overall
equipment cost of a plant. Conventional pretreatment (multi-
media filtration) has traditionally cost less than other recent
pretreatment alternatives (membrane filtration by MF, UF, or
NF). However, the capital investment required for membrane
pretreatment systems has decreased. While membrane

Table 8 – Cost comparison of membrane unit andconcentrate disposal options.
Cost Cost ($/m3) Critical factors
Membrane
replacement
0.008–0.05 Scaling, fouling
Chemicals 0.008–0.05 Cleaning frequency
Concentrate disposala
Surface Water 0.03–0.30 Piping, pumping,
and outfall construction
Evaporation pond 1.18–10.04 Pond size and depth,
salt concentration,
evaporation rate,
disposal rate, pond liner cost
Deep well injection 0.33–2.64 Tubing diameter and depth,
injection rate, chemical costs
Sewer 0.30–0.66 Disposal rate, salinity, sewer
capacity, fees
Brine concentrator
(ZLD)
0.66–26.41 Disposal rate, energy costs,
salinity
a Costs for concentrate disposal options include capital and
operations and maintenance (O&M)
costs.
w a t e r r e s e a r c h 4 3 ( 2 0 0 9 ) 2 3 1 7 – 2 3 4 8 2341
capital costs remain slightly higher than multi-media filtra-
tion capital costs, membrane pretreatment can substantially
lower RO operation and maintenance costs, particularly the
cost of RO membrane replacement. However, membrane
pretreatment still tends to be more expensive than conven-
tional pretreatment due to the higher cost of membrane
replacement relative to the operating and maintenance costs
of media filtration. As more and more seawater RO plants are
forced to use open water intake feed sources, membrane
pretreatment is likely to become the pretreatment method of
choice.
Some full-scale plants, particularly in the Middle East and
Asia, have already started using membrane pretreatment
(Bartels et al., 2006; Bu-Rashid and Czolkoss, 2007). These
plants, including those in Addur, Bahrain; Kindasa, Saudi
Arabia; Fukuoka, Japan; and Yu-Han, China, have all seen
consistent, improved water quality as a result of using
membrane pretreatment. Bartels et al. (2006) noted that the
capital cost of a RO plant utilizing membrane pretreatment
could be as much as 30% higher than if conventional
pretreatment had been chosen. The authors state that
reduced operational and chemical costs can reduce the overall
difference to between 2 and 3% (Bartels et al., 2006). Pearce
(2007) described potential areas of cost savings due to
improvements in RO operations. Membrane pretreatment can
decrease costs associated with the plant footprint, RO
membrane replacement, pre-RO cartridge filters, and chem-
ical costs, as well as allow increases in recovery and permeate
flux (due to lower fouling rates). In the case study presented,
data are based on an eastern Mediterranean Sea feed water,
and estimates are given for cost decreases for each of the
parameters mentioned above. RO permeate flux can increase
by 25%, while the plant footprint and RO membrane replace-
ment can decrease by 33%. Chemical costs can decrease by 45–
65% and pre-RO cartridge filters are not necessary. The total
water cost for both the conventional pretreatment-RO system
and the membrane pretreatment-RO system is $0.90/m3
(Pearce, 2007). While the Mediterranean Sea has relatively
good quality feed water and requires only one stage of media
filtration (for conventional pretreatment), other feed sources,
such as those in the Middle East (Persian Gulf), are poorer in
quality and require more extensive pretreatment (Bu-Rashid
and Czolkoss, 2007; Pearce, 2007).
13.2. Brackish water RO
The key difference in cost distribution between seawater RO
and brackish water RO plants is the electrical power required.
Brackish water RO plants require a much lower hydrostatic
pressure to produce permeate because of the lower salt
content of the feed water. In addition, brackish water RO
membranes often have a lower salt rejection and are more
permeable than seawater RO membranes. The power cost of
a typical brackish water RO represents only 11% of the total
cost (44% for seawater RO), and the largest costs are fixed costs
(capital amortization and insurance), at 54% (Miller, 2003;
Younos, 2003). Due to the decreased contribution of power in
the overall cost distribution, other factors, such as mainte-
nance (9%), membrane replacement (7%), labor (9%), and
consumable chemicals (10%), increase (Miller, 2003).
The unit water price for brackish water RO ranges between
$0.10/m3 and $1.00/m3 (Miller, 2003; Sethi, 2007); this price
range is lower than that of seawater RO ($0.53/m3–$1.50/m3).
Costs can increase due to pumping requirements (i.e.,
pumping groundwater from wells). Factors resulting from
lower feed salinity, including the lower energy requirements
noted above and less frequent membrane replacement, help
decrease the water cost. As in seawater RO, pretreatment
costs can represent a significant portion of the capital cost,
particularly if membrane pretreatment is chosen. However,
often conventional media filtration pretreatment is used
because many brackish feed waters are groundwaters.
A key cost for brackish water RO systems is concentrate
disposal. For brackish water RO plants, surface water outfall
(typically located in the same body of water providing the feed
water) is the least expensive disposal option. While still
considered an important cost to seawater RO plants (Ravizky
and Nadav, 2007), due to lower recoveries, surface water
disposal is relatively inexpensive for brackish water systems.
Apart from surface water disposal, combined sewer disposal
is often the next choice as a relatively low-cost disposal
option. This option is often not available, however, and plants
must choose from more expensive options, depending on
local regulations and available land. A summary of costs for
concentrate disposal and the RO membrane system is shown
in Table 8 (Graves and Choffel, 2004; Koyuncu et al., 2001;
Mickley, 2001, 2004; Miller, 2003; Sethi, 2007; Thomas, 2006);
the cost of producing desalinated water becomes more costly
as the concentrate disposal costs increase. Surface water
disposal is by far the least expensive option, although piping
and pumping costs can significantly increase when the plant
is not located on the coast. Evaporation ponds and brine
concentrators are the most expensive options due to stringent
groundwater regulations and energy requirements,
respectively.
w a t e r r e s e a r c h 4 3 ( 2 0 0 9 ) 2 3 1 7 – 2 3 4 82342
14. Technological challenges and thefuture of RO
An emerging application of RO membranes is in wastewater
treatment and trace organic contaminant removal. A host of
new organic contaminants have been identified (Richardson
et al., 2007), and RO technology is a potential treatment
candidate. Particularly for hydrophilic organic compounds,
including many disinfection by-products and pharmaceutical
compounds, traditional treatment processes (coagulation and
flocculation) are not effective at removal. However, RO
membranes may remove these compounds through both
charge repulsion and size exclusion phenomena. Using RO
membranes in wastewater treatment presents unique process
challenges; calcium phosphate precipitation can occur, and
wastewaters tend to have much higher organic carbon
content than drinking water feed streams. Membrane fouling
and pretreatment design will be primary concerns as RO
systems are developed for wastewater treatment.
The development of energy recovery devices and hybrid
desalination/power plants has allowed significant advances in
energy recovery. In addition, new RO membrane module
design, including larger diameter spiral wound modules (Yun
et al., 2006) and high-flux membranes, has provided cost and
energy efficiency improvements to the typical RO system
design. Further research and technology development in
energy recovery and system design will allow additional gains
in energy recovery and cost reduction.
A key limitation to commercial polyamide RO membranes
and treatment system design is membrane degradation
through contact with chlorine, one of the common disinfec-
tants used in water and wastewater treatment. Recent
research in novel membrane materials and polymer chem-
istry (Park et al., 2008) has resulted in the development of
sulfonated polysulfone composite membranes that are highly
resistant to chlorine attack. Commercial development of
chlorine-resistant membranes would eliminate the need for
dechlorination of the RO feed and rechlorination after the
membrane system, reducing the overall cost of RO.
The need for inland brackish water RO will continue to
increase in the future, and the primary limitations to further
application of RO inland are the cost and technical feasibility
of concentrate disposal. Research on novel concentrate
treatment options is ongoing (Rahardianto et al., 2007), and
pilot plant demonstrations have shown that significant
increases in RO recovery are possible. Optimization of anti-
scalant dosing, chemical addition, and pH control is necessary
to improve the cost of concentrate treatment. Full-scale use of
concentrate treatment is just beginning and will be necessary
to allow economic use of inland brackish water resources.
Increasingly stringent water quality standards will cause
further optimization and development in RO membrane tech-
nology. In particular, the standard for boron has been lowered,
and seawater RO plants may need more than one RO pass to
achieve the required water quality. Membrane manufacturers
are developing new RO membranes with higher boron
rejections; future technology may focus on other regulated and
emerging contaminants, including disinfection by-products,
pharmaceuticals, and endocrine disrupting compounds.
The extensive development of coastal desalination plants
that use surface water discharge as concentrate disposal has
the potential to negatively affect the local receiving water and
the larger surrounding sea. In particular, research and
modeling on salinity variations in the Arabian Gulf (Altayaran
and Madany, 1992; Purnama et al., 2005; Smith et al., 2007)
show that an increase in coastal desalination installations is
likely to increase the salinity in the Gulf and cause local
variations in oxygen content and temperature. As the use of
desalination continues to grow, the impact of desalination
plants on local water bodies must be evaluated, and negative
impacts must be minimized.
The use of membrane filtration in RO pretreatment will
continue to be investigated; as membrane costs decrease, the
use of membrane pretreatment will become a more viable
alternative to conventional pretreatment. Particularly for
surface water sources, membrane pretreatment is a constant
barrier to particulate and colloidal RO membrane fouling and
can greatly improve RO feed water quality. Research on SDI
values and membrane fouling has shown that SDI is not
always an appropriate indicator of RO fouling. An improved
method for prediction of fouling potential is needed.
15. Conclusions
The field of RO membrane desalination has rapidly grown over
the past 40 years to become the primary choice for new plant
installations. Membrane technology has improved, allowing
significant increases in product production and cost savings.
While the basic operating principles remain the same for all RO
applications, individualized applications have developed,
based on feed water quality. In particular, the two key types of
feed water, seawater and brackish water, have distinguishing
features that demand specific parameter adjustment and
system design. Seawater RO recovery is primarily limited by
osmotic pressure increase and organic material fouling; system
design typically consists of chemical and filtration pretreat-
ment and one RO stage. However, problematic components,
such as boron, can require more complex RO stage design.
Brackish water RO membrane systems typically consist of two
RO stages in series; key issues include salt precipitation and
concentrate management. While both seawater and brackish
water RO have been sufficiently developed to be used in large-
scale commercial plants, several significant challenges to the
RO field remain. Further improvements in membrane tech-
nology, energy use, and concentrate treatment will allow
a wider application of RO to inland and rural communities.
Acknowledgements
The author would like to thank the National Science Founda-
tion International Research and Education in Engineering (IREE)
program (NSF Award Title: Collaborative Research: A Polymer
Synthesis/Membrane Characterization Program on Fouling
Resistant Membranes for Water Purification, NSF Award
Number: CBET 0553957) for funding support during the prepa-
ration of this manuscript. This work was also supported by the
Office of Naval Research (ONR) (Grant # N00014-05-1-0771 and
w a t e r r e s e a r c h 4 3 ( 2 0 0 9 ) 2 3 1 7 – 2 3 4 8 2343
Grant # N00014-05-1-0772) and the National Science Founda-
tion/Partnerships for Innovation (PFI) Program (Grant # IIP-
0650277). The opinions in this article do not represent the
thinking or endorsement of the funding agencies.
r e f e r e n c e s
About Jeddah: When Water Was More Precious Than Oil. SaudiWater and Power Forum, 2007 Available from:. http://ksawpf.com/index.php?page ¼ jeddah (accessed 13.02.08.).
ASTM Standard D4189, 2007. Standard Test Method for SiltDensity Index (SDI) of Water. ASTM International, WestConshohocken, PA. www.astm.org.
Afonso, M.D., Jaber, J.O., Mohsen, M.S., 2004. Brackishgroundwater treatment by reverse osmosis in Jordan.Desalination 164, 157–171.
Ahmed, M., Shayya, W.H., Hoey, D., Al-Handaly, J., 2001. Brinedisposal from reverse osmosis desalination plants in Omanand United Arab Emirates. Desalination 133, 135–147.
Allam, A.R., Saaf, E.-J., Dawoud, M.A., 2002. Desalination ofbrackish groundwater in Egypt. Desalination 152, 19–26.
Almulla, A., Eid, M., Cote, P., Coburn, J., 2002. Developments in highrecovery brackish water desalination plants as part of thesolution to water quantity problems. Desalination 153, 237–243.
Almulla, A., Hamad, A., Gadalla, M., 2005. Integrating hybridsystems with existing thermal desalination plants.Desalination 174, 171–192.
Altayaran, A.M., Madany, I.M., 1992. Impact of a desalinationplant on the physical and chemical-properties of seawater,Bahrain. Water Research 26 (4), 435–441.
Amiri, M.C., Samiei, M., 2007. Enhancing permeate flux in a RO plantby controlling membrane fouling. Desalination 207, 361–369.
Amjad, Z. (Ed.), 1993. Reverse Osmosis: Membrane Technology,Water Chemistry, and Industrial Applications. Chapman &Hall, International Thomson Publishing, New York.
Amjad, Z., Pugh, J., Harn, J., 1996. Membranes: antiscalants anddispersants in reverse osmosis systems. Ultrapure Water, 48–52.
Andrews, W.T., Laker, D.S., 2001. A twelve-year history of largescale application of work exchanger energy recoverytechnology. Desalination 138 (1–3), 201–206.
Atwater, R.W., Palmquist, L., Onkka, J., 1995. The West Basindesalter project: a viable alternative. Desalination 103, 117–125.
Avlonitis, S.A., Kouroumbas, K., Vlachakis, N., 2003. Energyconsumption and membrane replacement cost for seawaterRO desalination plants. Desalination 157, 151–158.
Ayoub, J., Alward, R., 1996. Water requirements and remote aridareas: the need for small-scale desalination. Desalination 107,131–147.
Bacchin, P., Si-Hassen, D., Starov, V., Clifton, M.J., Aimar, P., 2002.A unifying model for concentration polarization, gel-layerformation and particle deposition in cross-flow membranefiltration of colloidal suspensions. Chemical EngineeringScience 57, 77–91.
Baker, R.W., 2004. Membrane Technology and Applications. JohnWiley & Sons, Ltd., Chichester.
Bartels, C., Franks, R., Rybar, S., Schierach, M., Wilf, M., 2005. Theeffect of feed ionic strength on salt passage through reverseosmosis membranes. Desalination 184, 185–195.
Bartels, C., Rybar, S., Franks, R., 2006. Integrated membranedesalination systems – potential benefits of combinedtechnology. Hydranautics Available from: http://www.membranes.com/docs/papers/New%20Folder/Gulf%20Industry%20Magazine%20-%20Hydranautics.pdf(accessed 17.05.08.).
Bates, W.T., Cuozzo, R., 2000. Integrated membrane systems.Hydranautics Available from: http://www.membranes.com/docs/papers/01_ims.pdf (accessed 17.05.08.).
Bird, R.B., Stewart, W.E., Lightfoot, E.N., 2002. TransportPhenomena. John Wiley & Sons, Inc., New York.
Blank, J.E., Tusel, G.F., Nisan, S., 2007. The real cost of desaltedwater and how to reduce it further. Desalination 205, 298–311.
Blavoux, B., Gilli, E, Rousset, C., 2004. Feed and salinity origin of themarine spring of Port-Miou (Marseille-Cassis). Principalemergence of a karstic network originating from the Messinianage. Comptes rendus Geoscience 336, 523–533 (in French).
Bloetscher, F., Meeroff, D.E., Wright, M.E., Yang, D., Rojas, R.,Polar, J., Laas, M., Bieler, B., Sakura-Lemessy, D.-M., Aziz, S.A.,Fiekle, C., 2006. Defining the concentrate disposal problem andidentifying potential solutions. Florida Water ResourcesJournal 58 (4), 25–30.
Boegli, W.J., Thullen, J.S., 1996. Eastern Municipal Water District,RO Treatment/Saline Vegetated Wetlands Pilot Study. WaterTreatment Technology Program Report No. 16. U.S.Department of the Interior, Bureau of Reclamation.
Boerlage, S.F.E., Kennedy, M.D., Aniye, M.P., Abogrean, E.M.,Galjaard, G., Schippers, J.C., 1998. Monitoring particulatefouling in membrane systems. Desalination 118 (1–3),131–142.
Boerlage, S.F.E., Kennedy, M.D., Dickson, M.R., El-Hodali, D.E.Y.,Schippers, J.C., 2002. The modified fouling index usingultrafiltration membranes (MFI-UF): characterisation,filtration mechanisms and proposed reference membrane.Journal of Membrane Science 197 (1–2), 1–21.
Boerlage, S.F.E., Kennedy, M., Aniye, M.P., Schippers, J.C., 2003.Applications of the MFI-UF to measure and predict particulatefouling in RO systems. Journal Of Membrane Science 220 (1–2),97–116.
Boffardi, B.P., February 23–26, 1997. Scale and deposit control forreverse osmosis systems. In: Membrane TechnologyConference. American Water Works Association, NewOrleans, LA, pp. 681–693.
Bohdziewicz, J., Bodzek, M., Wasik, E., 1999. The application ofreverse osmosis and nanofiltration to the removal of nitratesfrom groundwater. Desalination 121, 139–147.
Bond, R., Veerapaneni, S., 2007. Zero liquid discharge and volumeminimization for inland desalination. In: American WaterWorks Association Research Foundation Project #3010.California Energy Commission, Black & Veatch.
Bonne, P.A.C., Hofman, J.A.M.H., Hoekv.d, J.P., 2000. Scalingcontrol of RO membranes and direct treatment of surfacewater. Desalination 132, 109–119.
Bonnelye, V., Sanz, M.A., Durand, J.-P., Plasse, L., Gueguen, F.,Mazounie, P., 2004. Reverse osmosis on open intake seawater:pre-treatment strategy. Desalination 167, 191–200.
Bouchekima, B., Gros, B., Ouahes, R., Diboun, M., 2001. Brackishwater desalination with heat recovery. Desalination 138,147–155.
Bouguecha, S., Hamrouni, B., Dhahbi, M., 2005. Small scaledesalination pilots powered by renewable energy sources:case studies. Desalination 183, 151–165.
Bowen, W.R., Welfoot, J.S., 2002. Modelling the performance ofmembrane nanofiltration-critical assessment and modeldevelopment. Chemical Engineering Science 57, 1121–1137.
Brehant, A., Bonnelye, V., Perez, M., 2003. Assessment ofultrafiltration as a pretreatment of reverse osmosismembranes for surface seawater desalination. Water Scienceand Technology: Water Supply 3 (5–6), 437–445.
Bu-Rashid, K.A., Czolkoss, W., 2007. Pilot tests of multibore UFmembrane at Addur SWRO desalination plant, Bahrain.Desalination 203, 229–242.
California Code of Regulations, 2007. Title 22, Secondary DrinkingWater Standards, Divison 4, Chapter 15, Article 16. California
w a t e r r e s e a r c h 4 3 ( 2 0 0 9 ) 2 3 1 7 – 2 3 4 82344
Office of Administrative Law, California Code of Regulations.Available from: http://www.cdph.ca.gov/certlic/labs/Documents/ELAPRegulations.pdf (accessed 25.05.08.).
Cardona, E., Culotta, S., Piacentino, A., 2002. Energy saving withMSF-RO series desalination plants. Desalination 153, 167–171.
Childress, A.E., Deshmukh, S.S., 1998. Effect of humic substancesand anionic surfactants on the surface charge andperformance of reverse osmosis membranes. Desalination 118(1–3), 167–174.
Choi, S., Zuwhan, Y., Hong, S., Ahn, K., 2001. The effect of co-existing ions and surface characteristics of nanomembraneson the removal of nitrate and fluoride. Desalination 133, 53–64.
Chua, K.T., Hawlader, M.N.A., Malek, A., 2003. Pretreatment ofseawater: results of pilot trials in Singapore. Desalination 159,225–243.
Darton, E.G., 2000. Membrane chemical research: centuries apart.Desalination 132, 121–131.
Dawoud, M.A., 2005. The role of desalination in augmentation ofwater supply in GCC countries. Desalination 186, 187–198.
Degremont, 2005. Degremont (SUEZ Environnement) winsa desalination contract in Australia of more than 380 millioneuros for 25 years. Degremont/Suez. Available from: http://www.degremont.com/files/actualites/presse/files/2005/Perth_vf.pdf (in French) (accessed 22.01.08.).
Deshmukh, S.S., Childress, A.E., 2001. Zeta potential ofcommercial RO membranes: influence of source water typeand chemistry. Desalination 140, 87–95.
Desotelle, D., 2001. Groundwater and Your Health: Boron inDrinking Water. Minnesota Department of Health. Availablefrom: http://www.seagrant.umn.edu/groundwater/pdfs/MDH-Boron.pdf (accessed 25.05.08.).
Desalination in History, 2005. Halcrow Water Services. Availablefrom: http://www.hwsdesalination.com/history%20of%20Desalination.html (accessed 13.02.08.).
El-Ramly, N., Peterson, E., 1999. American Desalting Plants:Membrane Desalting Plants On the Web. University of HawaiiHonolulu. Available from: http://www2.hawaii.edu/~nabil/depow.htm (accessed 13.02.08.).
El-Sayed, E., Ebrahim, S., Al-Saffar, A., Abdel-Jawad, M., 1998. Pilotstudy of MSF/RO hybrid systems. Desalination 120, 121–128.
Elguera, A.M., Baez, S.O.P., 2005. Development of the most adequatepre-treatment for high capacity seawater desalination plantswith open intake. Desalination 184, 173–183.
Elimelech, M., Chen, W.H., Waypa, J.J., 1994. Measuring the zeta(electrokinetic) potential of reverse osmosis membranes bya streaming potential analyzer. Desalination 95, 269–286.
F.A.C., 2007. Chapter 62–550: F.A.C., Drinking Water Standards,Monitoring, and Reporting. Florida Administrative Code.Available from: http://www.dep.state.fl.us/water/drinkingwater/rules.htm (accessed 25.05.08.).
Fipps, G., 2003. Irrigation Water Quality Standards and SalinityManagement Strategies. Agricultural Communications, TexasCooperative Extension B-1667, pp. 1–20.
Focazio, M.J., Kolpin, D.W., Barnes, K.K., Furlong, E.T., Meyer, M.T.,Zaugg, S.D., Barber, L.B., Thurman, M.E., 2008. A nationalreconnaissance for pharmaceuticals and other organicwastewater contaminants in the United States – II) untreateddrinking water sources. Science of the Total Environment 402(2–3), 201–216.
Fono, L.J., Kolodziej, E.P., Sedlak, D.L., 2006. Attenuation ofwastewater-derived contaminants in an effluent-dominatedriver. Environmental Science and Technology 40 (23),7257–7262.
Frenkel, V., 2000. Desalination Methods, Technology, andEconomics. Kennedy/Jenks Consultants. Available from:http://www.idswater.com/Common/Paper/Paper_90/Desalination%20Methods,%20Technology,%20and%20Economics1.htm (accessed 13.12.07.).
Fritzmann, C., Lowenberg, J., Wintgens, T., Melin, T., 2007. State-of-the-art of reverse osmosis desalination. Desalination 216,1–76.
Gabelich, C., Williams, M.D., Rahardianto, A., Franklin, J.C.,Cohen, Y., 2007. High-recovery reverse osmosis desalinationusing intermediate chemical demineralization. Journal ofMembrane Science 301, 131–141.
Gabelich, C., Yun, T.I., Coffey, B.M., Suffet, I.H., 2003. Pilot-scaletesting of reverse osmosis using conventional treatment andmicrofiltration. Desalination 154, 207–223.
Gaid, K., Treal, Y., 2007. Reverse osmosis desalination: Theexperience of Veolia Water (original language: French).Desalination 203, 1–14.
Garcıa-Rodrıguez, L., 2003. Renewable energy applications indesalination: state of the art. Solar Energy 75, 381–393.
Geisler, P., Krumm, W., Peters, T.A., 2001. Reduction of the energydemand for seawater RO with the pressure exchange. systemPES. Desalination 135 (1–3), 205–210.
Gekas, V., Hallstrom, B., 1987. Mass transfer in the membraneconcentration polarization layer under turbulent cross flow I.Critical literature review and adaptation of existing sherwoodcorrelations to membrane operations. Journal of MembraneScience 30, 153–170.
Ghafour, E.E.A., 2002. Enhancing RO system performance utilizingantiscalants. Desalination 153, 149–153.
Gilron, J., Folkman, Y., Savliev, R., Waisman, M., Kedem, O., 2003.WAIV – wind aided intensified evaporation for reduction ofdesalination brine volume. Desalination 158, 205–214.
Glater, J., Cohen, Y., 2003. Brine Disposal from Land BasedMembrane Desalination Plants: a Critical Assessment(DRAFT). Metropolitan Water District of Southern California.Available from: http://www.polysep.ucla.edu/Publications/Papers_PDF/BRINE%20DISPOSAL.pdf (accessed 21.05.08.).
Gleick, P.H., 1996. In: Schneider, S.H. (Ed.), Water Resources inEncyclopedia of Climate and Weather, vol. 2. University Press,New York, pp. 817–823.
Gleick, P.H., 2006. The World’s Water 2006–2007, The BiennialReport on Freshwater Resources. Island Press, Chicago.
Glueckstern, P., 1999. Design and operation of medium- andsmall-size desalination plants in remote areas: newperspective for improved reliability, durability and lowercosts. Desalination 122 (2–3), 123.
Glueckstern, P., Priel, M., 2003. Optimization of boron removal inold and new SWRO systems. Desalination 156, 219–228.
Glueckstern, P., Priel, M., 2007. Boron removal in brackish waterdesalination systems. Desalination 205, 178–184.
Glueckstern, P., Thoma, A., Priel, M., 2001. The impact of R&D onnew technologies, novel design concepts and advancedoperating procedures on the cost of water desalination.Desalination 139, 217–228.
Gorenflo, A., Velazquez-Padron, D., Frimmel, F.H., 2002.Nanofiltration of a German groundwater of high hardnessand NOM content: performance and costs. Desalination 151,253–265.
Graber, C., 2006. Desalination in Spain, Technology Review.Massachusetts Institute of Technology (MIT). Available from:http://www.technologyreview.com/microsites/spain/water/index.aspx (accessed 13.12.07.).
Graves, M., Choffel, K., 2004. Economic Siting Factors forSeawater. Desalination Projects along the Texas Gulf-Coast,Technical Papers, Case Studies, and Desalination TechnologyResources. Texas Water Development Board. Available from:www.twdb.state.tx.us/./The%20Future%20of%20Desalination%20in%20Texas%20-%20Volume%202/documents/C11.pdf (accessed 25.05.08.).
Hafez, A., El-Manharawy, S., 2002. Economics of seawater ROdesalination in the Red Sea region, Egypt. Part 1. A case study.Desalination 153, 335–347.
w a t e r r e s e a r c h 4 3 ( 2 0 0 9 ) 2 3 1 7 – 2 3 4 8 2345
Hamed, O.A., 2005. Overview of hybrid desalination systems –current status and future prospects. Desalination 186, 207–214.
Harris, C., 1999. Energy recovery for membrane desalination.Desalination 125 (1–3), 173–180.
Hassan, A.M., Al-Sofi, M.A.K., Al-Amoudi, A.S., Jamaluddin, A.T.M., Farooque, A.M., Rowaili, A., Dalvi, A.G.I., Kither, N.M.,Mustafa, G.M., Al-Tisan, I.A.R., 1998. A new approach tomembrane and thermal seawater desalination processesusing nanofiltration membranes (Part 1). Desalination 118,35–51.
Hasson, D., Drak, A., Semiat, R., 2001. Inception of CaSO4 scalingon RO membranes at various water recovery levels.Desalination 139, 73–81.
Helal, A.M., Al-Malek, S.A., Al-Katheeri, E.S., 2008. Economicfeasibility of alternative designs of a PV-RO desalination unitfor remote areas in the United Arab Emirates. Desalination 221(1–3), 1–16.
Henthorne, L., 2003. Desalination today. Southwest Hydrology,12–13.
Herold, D., Horstmann, V., Neskakis, A., Plettner-Marliani, J.,Piernavieja, G., Calero, R., 1998. Small scale photovoltaicdesalination for rural water suppy – demonstration plant inGran Canaria. Renewable Energy 14 (1–4), 293–298.
Hilal, N., Al-Zoubi, H., Darwish, N.A., Mohammad, A.W., AbuArabi, M., 2004. A comprehensive review of nanofiltrationmembranes: treatment, pretreatment, modelling, and atomicforce microscopy. Desalination 170, 281–308.
Hilal, N., Al-Zoubi, H., Mohammad, A.W., Darwish, N.A., 2005.Nanofiltration of highly concentrated salt solutions up toseawter salinity. Desalination 184, 315–326.
Hydranautics, 2002. Brackish Water RO Membranes Availablefrom: http://www.membranes.com/pdf/HYDRABrochure.pdf(accessed 13.02.08.).
Hydranautics, 2003. Chemical Pretreatment for RO and NF.Technical Application Bulletin No. 111, Rev. BAvailable from:Available from: http://www.membranes.com/docs/tab/TAB111.pdf (accessed 17.05.08.).
Hydranautics, 2007. Press Release: Integrated MembraneSolutions at work in Southern Spain Available from: http://www.membranes.com/press/Escombreras.Jan%202007.pdf(accessed 13.02.08.).
Isaias, N.P., 2001. Experience in reverse osmosis pretreatment.Desalination 139, 57–64.
Jaber, I.S., Ahmed, M.R., 2004. Technical and economic evaluationof brackish groundwater desalination by reverse osmosis (RO)process. Desalination 165, 209–213.
Jacob, C., 2007. Seawater desalination: boron removal by ionexchange technology. Desalination 205, 47–52.
Jian, W., Kitanaka, A., Nishijima, W., Baes, A.U., Okada, M., 1998.Removal of oil pollutants in seawater as pretreatment ofreverse osmosis desalination process. Water Research 33 (8),1857–1863.
Jurenka, R.A., Chapman-Wilbert, M., 1996. Maricopa GroundwaterTreatment Study. Water Treatment Technology ProgramReport No. 15. U.S. Department of the Interior, Bureau ofReclamation.
Kamp, P.C., Kruithof, J.C., Folmer, H.C., 2000. UF/RO treatmentplant Heemskerk: from challenge to full scale application.Desalination 131, 27–35.
Karagiannis, I.C., Soldatos, P.G., 2008. Water desalination costliterature: review and assessment. Desalination 223 (1–3),448–456.
Kedem, O., Freger, V., 2008. Determination of concentration-dependent transport coefficients in nanofiltration: defining anoptimal set of coefficients. Journal of Membrane Science 310(1–2), 586–593.
Khalil, E.E., 2001. Potable water technology development in Egypt.Desalination 136, 57–62.
Khawaji, A.D., Kutubkhanah, I.K., Wie, J.M., 2007. A 13.3 MGDseawater RO desalination plant for Yanbu Industrial City.Desalination 203 (1–3), 176–188.
Kim, S.-H., Lee, S.-H., Yoon, J.-S., Moon, S.-Y., Yoon, C.-H., 2007.Pilot plant demonstration of energy reduction for RO seawaterdesalination through a recovery increase. Desalination 203,153–159.
Kim, S., Hoek, E.M.V., 2005. Modeling concentration polarizationin reverse osmosis processes. Desalination 186, 111–128.
Kimes, J.K., 1995. The regulation of concentrate disposal inFlorida. Desalination 102, 87–92.
Tour KINDASA, 2007. Kindasa Water Services. Available from: http://www.kindasa.com/TourKINDASA.htm (accessed 13.02.08.).
Koyuncu, I., Topacik, D., Turan, M., Celik, M.S., Sarikaya, H.Z.,2001. Application of the membrane technology to controlammonia in surface water. Water Science and Technology 1(1), 117–124.
Kremen, S.S., Tanner, M., 1998. Silt density indices (SDI), percentplugging factor (%PF): their relation to actual foulantdeposition. Desalination 119, 259–262.
Lamei, A., van der Zaag, P., von Munch, E., 2008. Impact of solarenergy cost on water production cost of seawater desalinationplants in Egypt. Energy Policy 36 (5), 1748–1756.
Le Gouellec, Y.A., Elimelech, M., 2002. Calcium sulfate (gypsum)scaling in nanofiltration of agricultural drainage water.Journal of Membrane Science 205, 279–291.
Lee, H.Y., 2008. Crude resumes its upward climb. The Wall StreetJournal Available from: http://online.wsj.com/article/SB121154867877817317.html?mod ¼ googlenews_wsj NewYork, NY. (accessed 25.05.08.).
Lee, R.-W., Glater, J., Cohen, Y., Martin, C., Kovac, J., Milobar, M.N.,Bartel, D.W., 2003. Low-pressure RO membrane desalinationof agricultural drainage water. Desalination 155, 109–120.
Leitz, F., Boegli, B., 2001. Evaluation of the Port HuenemeDemonstration Plant: An Analysis of 1 MGD Reverse Osmosis,Nanofiltration, and Electrodialysis Reversal Plants Run UnderEssentially Identical Conditions. Desalination and WaterPurification Research and Development Program Report No.65. U.S. Department of the Interior, Bureau of Reclamation.
Lhassani, L., Rumeau, M., Benjelloun, D., Pontie, M., 2001.Selective demineralization of water by nanofiltrationapplication to the defluorination of brackish water. WaterResearch 35 (13), 3260–3264.
Liu, L.F., Yu, S.C., Wu, L.G., Gao, C.J., 2008. Study on a novelantifouling polyamide-urea reverse osmosis compositemembrane (ICIC-MPD) – III. Analysis of membraneelectrical properties. Journal of Membrane Science 310 (1–2),119–128.
Loeb, S., Sourirajan, S., 1963. Seawater dimineralization by meansof an osmotic membrane. Advances in Chemistry Series 38,117–132.
Lonsdale, H.K., Merten, U., Riley, R.L., 1965. Transport propertiesof cellulose acetate osmotic membranes. Journal of AppliedPolymer Science 9, 1341–1362.
M’nif, A., Bouguecha, S., Hamrouni, B., Dhahbi, M., 2007. Couplingof membrane processes for brackish water desalination.Desalination 203, 331–336.
MacHarg, J.P., 2001. Exchanger tests verify 2.0 kWh/m3 SWROenergy use. International Desalination and Water Reuse 11 (1),42–45.
Magara, Y., Kawasaki, M., Sekino, M., Yamamura, H., 2000.Development of reverse osmosis seawater desalination inJapan. Water Science and Technology 41 (10–11), 1–8.
Magara, Y., Tabata, A., Minoru, K., Kawasaki, M., Hirose, M., 1998.Development of boron reduction system for sea waterdesalination. Desalination 118, 25–34.
Malekar, S., 2005. Role of antiscalants in reverse osmosis.Chemical Industry Digest, 47–52.

w a t e r r e s e a r c h 4 3 ( 2 0 0 9 ) 2 3 1 7 – 2 3 4 82346
Mandil, M.A., Bushnak, A.A., 2002. Future needs for desalinationin South Mediterranean countries. Desalination 152, 15–18.
Mandil, M.A., Farag, H.A., Naim, M.M., Attia, M.K., 1998. Feedsalinity and cost-effectiveness of energy recovery in reverseosmosis desalination. Desalination 120 (1–2), 89–94.
Martin, A., 2007. In eco-friendly factory, low-guilt potato chips. TheNew York Times Available from: http://www.nytimes.com/2007/11/15/business/15plant.html?_r ¼ 1&scp ¼ 1&sq ¼ In þEco-Friendly þ Factory%2C þ Low-Guilt þ Potato þ Chips&st ¼nyt&oref ¼ slogin New York, NY. (accessed 17.05.08.).
Masson, L., Richards, B.S., Schaefer, A.I., 2005. System design andperformance testing of a hybrid membrane-photovoltaicdesalination system. Desalination 179, 51–59.
Mathioulakis, E., Belessiotis, V., Delyannis, E., 2007. Desalinationby using alternative energy: review and state-of-the-art.Desalination 203, 346–365.
Merten, U., 1963. Flow relationships in reverse osmosis. Industrialand Engineering Chemistry Fundamentals 2 (3), 229–232.
Mickley, M.C., 2001. Membrane Concentrate Disposal: Practicesand Regulation. U.S. Department of the Interior, Bureau ofReclamation, Mickley & Associates.
Mickley, M.C., 2004. Review of Concentrate management options,ground water report 363. Technical Papers, Case Studies andDesalination Technology Resources. In: The Future ofDesalination in Texas, vol. II. Texas Water DevelopmentBoard. Available from:. http://www.twdb.state.tx.us/iwt/desal/docs/Volume2Main.asp (accessed 21.05.08.).
Miller, J.E., 2003. Review of Water Resources and DesalinationTechnologies. Available from: Sandia National Laboratorieshttp://www.prod.sandia.gov/cgi-bin/techlib/access-control.pl/2003/030800.pdf (accessed 25.05.08.).
Mohsen, M.S., 2007. Water strategies and potential of desalinationin Jordan. Desalination 203 (1–3), 27–46.
Mooij, C., 2007. Hamma water desalination plant: planning andfunding. Desalination 203, 107–118.
Morenski, F., 1992. Current pretreatment requirements forreverse osmosis membrane applications. In: OfficialProceedings of the 53rd International Water Conference, pp.325–330.
Murakami, M., 1995. Managing Water for Peace in the Middle East:Alternative Strategies. The United Nations University Press,Tokyo.
National Water Quality Management Strategy: AustralianDrinking Water Guidelines, 2004. Australian National Healthand Medical Research Council, Australian Natural ResourceManagement Ministerial Council. Available from: http://www.nhmrc.gov.au/publications/synopses/eh19syn.htm (accessed25.05.08.).
Nuclear Desalination. UIC Nuclear Issues Briefing Paper # 74,2007. Uranium Information Centre Ltd. Available from: http://www.uic.com.au/nip74.htm (accessed 29.01.08.).
Nadav, N., Priel, M., Glueckstern, P., 2005. Boron removal from thepermeate of a large SWRO plant in Eilat. Desalination 185, 121–129.
Nicot, J.P., Gross, B., Walden, S., Baier, R., 2007. Self-SealingEvaporation Ponds for Desalination Facilities in Texas. TexasWater Development Board.
Oner, M., Dogan, O, Oner, G., 1998. The influence ofpolyelectrolytes architecture on calcium sulfate dihydrategrowth retardation. Journal of Crystal Growth 186, 427–437.
Otero, J.A., Mazarrasa, O., Villasante, J., Silva, V., Pradanos, P.,Calvo, J.I., Hernandez, A., 2008. Three independent ways toobtain information on pore size distributions of nanofiltrationmembranes. Journal of Membrane Science 309, 17–27.
Park, C., Kim, H., Hong, S., Choi, S.-I., 2006. Variation andprediction of membrane fouling index under various feedwater characteristics. Journal of Membrane Science 284,248–254.
Park, H.B., Freeman, B.D., Zhang, Z.B., Sankir, M., McGrath, J.E.,2008. Highly chlorine-tolerant polymers for desalination.Angewandte Chemie-International Edition 47 (32), 6019–6024.
Paul, D.R., 2004. Reformulation of the solution-diffusiontheory of reverse osmosis. Journal of Membrane Science241, 371–386.
Paul, D.R., 1972. The role of membrane pressure in reverseosmosis. Journal of Applied Polymer Science 16, 771–782.
Pearce, G.K., 2007. The case for UF/MF pretreatment to RO inseawater applications. Desalination 203, 285–295.
Pearce, G.K., Allam, J., Chida, K., 2003. Ultrafiltration Pre-treatment to RO: Trials at Kindasa Water Services, Jeddah,Saudia Arabia. Hydranautics Available from: http://www.membranes.com/docs/papers/New%20Folder/UF%20Pretreatment%20to%20RO.Trials%20at%20Kindasa.pdf(accessed 17.05.08.).
Pearce, G.K., Talo, S., Chida, K., Basha, A., Gulamhusein, A., 2004.Pretreatment options for large scale SWRO plants: casestudies of UF trials at Kindasa, Saudi Arabia, and conventionalpretreatment in Spain. Desalination 167, 175–189.
Peleka, E.N., Matis, K.A., 2008. Application of flotation asa pretreatment process during desalination. Desalination 222(1–3), 1–8.
Perry, R.H., Green, D.W. (Eds.), 1997. Perry’s Chemical Engineers’Handbook. McGraw Hill, New York.
Petry, M., Sanz, M.A., Langlais, C., Bonnelye, V., Durand, J.-P.,Guevara, D., Nardes, W.M., Saemi, C.H., 2007. The El Coloso(Chile) reverse osmosis plant. Desalination 203, 141–152.
Pflimlin, E., 2007. The Impact of the Current Rise in Oil is Lessthan the Shocks of 1973 or 1979. Le Monde, Le Monde Paris.Available from: http://www.lemonde.fr (in French) (accessed15.11.07.).
Plottu-Pecheux, A., Houssais, B., Democrate, C., Gatel, D.,Parron, C., Cavard, J., 2002. Comparison of three antiscalants,as applied to the treatment of water from the River Oise.Desalination 145, 273–280.
Purnama, A., Al-Barwani, H.H., Smith, R., 2005. Calculating theenvironmental cost of seawater desalination in the Arabianmarginal seas. Desalination 185 (1–3), 79–86.
Quteishat, K., Abu Arabi, M.K., Reddy, K.V., 2003. Review ofMEDRC R&D projects. Desalination 156, 1–20.
Reverse Osmosis Desalination Plants Reference List – MajorProjects, 2005. Outokumpu. http://www.outokumpu.com/36039.epibrw (accessed 13.02.08.).
Rahardianto, A., Gao, J., Gabelich, C.J., Williams, M.D., Cohen, Y.,2007. High recovery membrane desalting of low-salinitybrackish water: integration of accelerated precipitationsoftening with membrane RO. Journal of Membrane Science289, 123–137.
Rahardianto, A., Shih, W.-Y., Lee, R.-W., Cohen, Y., 2006.Diagnostic characterization of gypsum scale formation andcontrol in RO membrane desalination of brackish water.Journal of Membrane Science 279, 655–668.
Ravizky, A., Nadav, N., 2007. Salt production by the evaporation ofSWRO bring in Eilat: a success story. Desalination 205,374–379.
Reahl, E.R., 2004. Half a Century of Desalination withElectrodialysis. General Electric Company. Available from:http://www.gewater.com/pdf/Technical%20Papers_Cust/Americas/English/TP1038EN.pdf (accessed 25.05.08.).
Reddy, K.V., Ghaffour, N., 2007. Overview of the cost ofdesalinated water and costing methodologies. Desalination205, 340–353.
Reverberi, F., Gorenflo, A., 2007. Three year operationalexperience of a spiral-wound SWRO system with a highfouling potential feed water. Desalination 203, 100–106.
Reverter, J.A., Talo, S., Alday, J., 2001. Las Palmas III – the successstory of brine staging. Desalination 138, 207–217.

w a t e r r e s e a r c h 4 3 ( 2 0 0 9 ) 2 3 1 7 – 2 3 4 8 2347
Richards, B.S., Schaefer, A.I., 2002. Design considerations fora solar-powered desalination system for remote communitiesin Australia. Desalination 144, 193–199.
Richardson, S.D., Plewa, M.J., Wagner, E.D., Schoeny, R.,DeMarini, D.M., 2007. Occurrence, genotoxicity, andcarcinogenicity of regulated and emerging disinfection by-products in drinking water: a review and roadmap forresearch. Mutation Research/Reviews in Mutation Research636 (1–3), 178.
Rybar, S., Vodnar, M., Vartolomei, F.L., Mendez, R.L., Ruano, J.B.L.,2005. Experience with Renewable Energy Source and SWRODesalination in Gran Canaria. SP05-100. InternationalDesalination Association World Congress. Available from:http://www.membranes.com/docs/papers/New%20Folder/Soslaires%20Canarias%20Desalination%20Plant.pdf (accessed25.05.08.).
Shoaiba Desalination Plant, Saudi Arabia.water-technology.net,2003 Available from: http://www.water-technology.net/projects/shuaiba/ (accessed 13.02.08.).
South Florida Water Management District EnvironmentalDatabase (DBHYDRO), 2001 Available from: http://www.sfwmd.gov/portal/page?_pageid ¼ 2894, 19708227&_dad ¼portal&_schema ¼ PORTAL (accessed 13.02.08.).
Sagle, A., Freeman, B., 2004. Fundamentals of membranes forwater treatment. In: Arroyo, J.A. (Ed.), The Future ofDesalination in Texas, vol. II. Texas Water DevelopmentBoard, Austin, TX, pp. 137–153.
Sandia, 2003. Desalination and Water Purification Roadmap – AReport of the Executive Committee. DWPR Program Report#95. U.S. Department of the Interior, Bureau of Reclamationand Sandia National Laboratories. Available from: http://wrri.nmsu.edu/tbndrc/roadmapreport.pdf (accessed 25.05.08.).
Sanz, M.A., Bonnelye, V., Cremer, G., 2007. Fujairah reverseosmosis plant: 2 years of operation. Desalination 203, 91–99.
Saripalli, K.P., Sharma, M.M., Bryant, S.L., 2000. Modelinginjection well performance during deep-well injection ofliquid wastes. Journal of Hydrology 227, 41–55.
Sauvet-Goichon, B., 2007. Ashkelon desalination plant –a successful challenge. Desalination 203, 75–81.
Schippers, J.C., Verdouw, J., 1980. Modified fouling index,a method of determining the fouling characteristics of water.Desalination 32 (1–3), 137–148.
Schippers, J.C., Hanemaayer, J.H., Smolders, C.A., Kostense, A.,1981. Predicting flux decline of reverse-osmosis membranes.Desalination 38 (1–3), 339–348.
Sedlak, D.L., Gray, J.L., Pinkston, K.E., 2000. Understandingmicrocontaminants in recycled water. Environmental Scienceand Technology 34 (23), 509A–515A.
Seigal, L., Zelonis, J., 1995. Water Desalination. RensselaerPolytechnic Institute. Available from: http://www.rpi.edu/dept/chem-eng/Biotech-Environ/Environmental/desal/intro.html (accessed 13.02.08.).
Semiat, R., Sutzkover, I., Hasson, D., 2003. Characterization of theeffectiveness of silica anti-scalants. Desalination 159, 11–19.
Service, R.F., 2006. Desalination freshens up. Science 313,1088–1090.
Sethi, S., 2007. Desalination Product Water Recovery andConcentrate Volume Minimization (DRAFT). American WaterWorks Association Research Foundation Project #3030. CarolloEngineers, U.S. Department of the Interior, Bureau ofReclamation.
Shih, W.-Y., Albrecht, K., Glater, J., Cohen, Y., 2004. A dual-probeapproach for evaluation of gypsum crystallization in responseto antiscalant treatment. Desalination 169, 213–221.
Shih, W.-Y., Rahardianto, A., Lee, R.-W., Cohen, Y., 2005.Morphometric characterization of calcium sulfate dihydrate(gypsum) scale on reverse osmosis membranes. Journal ofMembrane Science 252, 253–263.
Singh, R., 1997. Membranes: a review of membrane technologies:Reverse osmosis, nanofiltration, and ultrafiltration. UltrapureWater, 21–29.
Smith, R., Purnama, A., Al-Barwani, H.H., 2007. Sensitivity ofhypersaline Arabian Gulf to seawater desalination plants.Applied Mathematical Modelling 31 (10), 2347–2354.
Song, L.F., Elimelech, M., 1995. Theory of concentrationpolarization in cross-flow filtration. Journal of the ChemicalSociety-Faraday Transactions 91 (19), 3389–3398.
Stumm, W., Morgan, J.J., 1996. Aquatic Chemistry: ChemicalEquilibria and Rates in Natural Waters. Wiley-Interscience,New York.
Sutzkover, I., Hasson, D., Semiat, R., 2000. Simple technique formeasuring the concentration polarization level in a reverseosmosis system. Desalination 131, 117–127.
Potable Organic Polymers – Types and Applications, 2006.Sweetwater Technologies, Government Engineering. Availablefrom: http://www.govengr.com/ArticlesNov06/potable.pdf(accessed 13.02.08.).
Thames Water Desalination Plant, London, England.Water-technology.net, 2007 Available from: http://www.water-technology.net/projects/water-desalination/ (accessed 29.01.08.).
Tanninen, J., Manttari, M., Nystrom, M., 2006. Effect of saltmixture concentration on fractionation with NF membranes.Journal of Membrane Science 283, 57–64.
Teuler, A., Glucina, K., Laıne, J.M., 1999. Assessment of UFpretreatment prior RO membranes for seawater desalination.Desalination 125, 89–96.
Thomas, H., 2006. Central Arizona Salinity Study: ConcentrateManagement Strategies Available from: http://www.epwu.org/desal_presentations/session05/harold_thomas.pdf (accessed14.12.06.).
Tiwari, S.A., Goswami, D., Prabhakar, S., Tewari, P.K., 2006.Assessment of an ultrafiltration pre-treatment system fora seawater reverse osmosis plant. International Journal ofNuclear Desalination 2 (2), 132–138.
Tran, T., Bolto, B., Gray, S., Hoang, M., Ostarcevic, E., 2007. Anautopsy study of a fouled reverse osmosis membrane elementused in a brackish water treatment plant. Water Research 41,3915–3923.
Tsiourtis, N.X., 2001. Desalination and the environment.Desalination 141, 223–236.
Turek, M., 2002. Seawater desalination and salt production ina hybrid membrane-thermal process. Desalination 153,173–177.
Tzen, E., Perrakis, K., Baltas, P., 1998. Design of a stand alonePV – desalination system for rural areas. Desalination 119,327–334.
Utah Rule R309–200, 2006. Drinking Water Standards. UtahDepartment of Environmental Quality, Utah Division ofAdministrative Rules. Available from: http://www.rules.utah.gov/publicat/code/r309/r309-200.htm (accessed 25.05.08).
U.S. EPA, 2002. Title 40 Protection of the Environment, Chapter 1,Part 143. U.S.Environmental Protection Agency, NationalArchives and Records Administration. Available from: http://www.epa.gov/lawsregs/search/40cfr.html (accessed 25.05.08.).
U.S. EPA, 2004. Guidelines for Water Reuse. U.S. EnvironmentalProtection Agency, U.S. Agency for InternationalDevelopment. Available from: http://www.epa.gov/nrmrl/pubs/625r04108/625r04108.htm (accessed 25.05.08.).
Van der Bruggen, B., Lejon, L., Vandecasteele, C., 2003. Reuse,treatment, and discharge of the concentrate of pressure-driven membrane processes. Environmental Science andTechnology 37 (17), 3733–3738.
Van der Bruggen, B., Vandecasteele, C., 2002. Distillation vs.membrane filtration: overview of process evolutions inseawater desalination. Desalination 143, 207–218.

w a t e r r e s e a r c h 4 3 ( 2 0 0 9 ) 2 3 1 7 – 2 3 4 82348
Vedavyasan, C.V., 2007. Pretreatment trends – and overview.Desalination 203, 296–299.
Veolia, 2006. Veolia Eau has been Selected for Two Major Projectsin Australia that will Help the Fight Against Drought. VeoliaEau. Available from: http://www.veoliaenvironnement.com/fr/presse/20061205,secheresse-veolia-eau.aspx (in French)(accessed 22.01.08.).
Veolia, 2007. Veolia Eau Wins A Large Desalination Contract inSydney, Australia. Veolia Eau. Available from: http://www.veoliaenvironnement.com/fr/presse/20070718,dessalement-australie.aspx (in French) (accessed 22.01.08.).
Vince, F., Marechal, F., Aoustin, E., Breant, P., 2008. Multi-objective optimization of RO desalination plants. Desalination222 (1–3), 96–118.
Vrouwenvelder, J.S., Manolarakis, S.A., Veenendaal, H.R., Kooijv.d, D., 2000. Biofouling potential of chemicals used for scalecontrol in RO and NF membranes. Desalination 132, 1–10.
Walha, K., Amar, R.B., Firdaous, L., Quemeneur, F., Jaouen, P.,2007. Brackish groundwater treatment by nanofiltration,reverse osmosis and electrodialysis in Tunisia: performanceand cost comparison. Desalination 207, 95–106.
Walker, S., Mattausch, P., Abbott, A., 2007. Reverse osmosistreatment facilities: Innovative post-treatment stabilizationsolutions. Florida Water Resources Journal, 35–37.
Wang, D.-X., Su, M., Yu, Z.-Y., Wang, X.-L., Ando, M., Shintani, T.,2005. Separation performance of a nanofiltration membraneinfluenced by species and concentration of ions. Desalination175, 219–225.
Wang, D.-X., Wang, X.-L., Tomi, Y., Ando, M., Shintani, T., 2006.Modeling the separation performance of nanofiltrationmembranes for the mixed salts solution. Journal of MembraneScience 280, 734–743.
Wang, Y., Wang, S.C., Xu, S.C., 2004. Experimental studies ondynamic process of energy recovery device for ROdesalination plants. Desalination 160 (2), 187–193.
Wangnick, K., 2002. 2002 IDA Worldwide Desalting PlantsInventory. Report No. 17. Wangnick Consulting GMBH/International Desalination Association.
Wangnick/GWI, 2005. 2004 Worldwide Desalting Plants Inventory.Global Water Intelligence, Oxford, England.
Watson, B.M., Hornburg, C.D., Collins, R., 1995. Blending and post-treatment protocols for SDWA compliance – Hollywood (FL)water plant. Desalination 102 (1–3), 1–10.
Weiner, D., Fisher, D., Moses, E.J., Katz, B., Meron, G., 2001.Operation experience of a solar- and wind-powereddesalination demonstration plant. Desalination 137, 7–13.
Werner, M., Schaefer, A.I., 2007. Social aspects of a solar-powereddesalination unit for remote Australian communities.Desalination 203, 375–393.
WHO, 1970. European Standards for Drinking-Water. WorldHealth Organization, Geneva. Available from: http://whqlibdoc.who.int/publications/European_standards_for_drinking-water.pdf (accessed 13.12.07.).
Wijmans, J.G., Baker, R.W., 1995. The solution-diffusion model:a review. Journal of Membrane Science 107, 1–21.
Wilf, M., 2003. Fundamentals of RO-NF technology. HydranauticsAvailable from: http://www.membranes.com/docs/papers/New%20Folder/Fundamentals%20of%20RO-NF%20Technology.pdf (accessed 17.05.08.).
Wilf, M., Bartels, C., 2004. Optimization of seawater RO systemsdesign. Hydranautics Available from: http://www.
membranes.com/docs/papers/New%20Folder/OptimizationofSeawaterROSystemsDesign.pdf (accessed 17.05.08.).
Wilf, M., Bartels, C., 2006. Integrated membrane desalinationsystems - current status and projected development.Hydranautics Available from: http://www.membranes.com/docs/papers/New%20Folder/Abstract%20for%20Tianjin%20-%20Hydranautics.pdf (accessed 17.05.08.).
Wilf, M., Klinko, K., 2001. Optimization of seawater RO systemsdesign. Desalination 138, 299–306.
Williams, C.J., Edyvean, R.G., 1998. An investigation of thebiological fouling in the filtration of seawater. Water Scienceand Technology 38 (8–9), 309–316.
Williams, M.D., Evangelista, R., Cohen, Y., 2002. Non-thermalprocess for recovering reverse osmosis concentrate: processchemistry and kinetics. In: Proceedings of Water TechnologyConference, American Water Works Association, pp. 1246–1263.
Winters, H., 1997. Twenty years experience in seawater reverseosmosis and how chemicals in pretreatment affect fouling ofmembranes. Desalination 110, 93–96.
Wolfe, P., 2005. Fujairah Marks Major Milestone for Desalinationin Middle East. Water and Wastewater International. Availablefrom: http://ww.pennnet.com/display_article/227597/20/ARTCL/none/none/1/Fujairah-marks-major-milestone-for-desalination-in-Middle-East/ (accessed 25.05.08.).
Wolff, G., 2006. The Economics of Desalination. Pacific Institute.Available from: http://texas.sierraclub.org/water/conference/SAWConfPPTs/GaryWolff.pdf (accessed 13.02.08.).
Xu, J., Ruan, G., Chu, X., Yao, Y., Su, B., Gao, C., 2007. A pilot studyof UF pretreatment without any chemicals for SWROdesalination in China. Desalination 207, 216–226.
Yiantsios, S.G., Sioutopoulos, D., Karabelas, A.J., 2005. Colloidalfouling of RO membranes: an overview of key issues andefforts to develop improved prediction techniques.Desalination 183, 257–272.
Yoon, J., Amy, G., Yoon, Y., 2005. Transport of target anions,chromate (Cr(VI)), arsenate (As(V)), and perchlorate (CIO4�),through RO, NF, and UF membranes. Water Science AndTechnology 51 (6–7), 327–334.
Younos, T., 2003. The economics of desalination. Journal ofContemporary Water Research & Education 132, 39–45.
Yun, T.I., Gabelich, C., Cox, M.R., Mofidi, A.A., Lesan, R., 2006.Reducing costs for large-scale desalting plants using large-diameter, reverse osmosis membranes. Desalination 189,141–154.
Zhao, Y., Taylor, J., Hong, S., 2005. Combined influence ofmembrane surface properties and feed water qualities onRO/NF mass transfer, a pilot study. Water Research 39,1233–1244.
Zhou, Y., Tol, R.S.J., 2005. Evaluating the costs of desalination andwater transport. Water Resources Research 41 (3), 1–10.
Zhou, Y., Tol, R.S.J., 2004. Implications of desalination for waterresources in China - an economic perspective. Desalination164, 225–240.
Zidouri, H., 2000. Desalination in Morocco and presentation ofdesign and operation of the Laayoune seawater reverseosmosis plant. Desalination 131, 137–145.
Zydney, A.L., 1997. Stagnant film model for concentrationpolarization in membrane systems. Journal of MembraneScience 130, 275–281.