Embed Size (px)
Citation preview

This paper is included in the Proceedings of the 2020 USENIX Annual Technical Conference.
July 15–17, 2020978-1-939133-14-4
Open access to the Proceedings of the 2020 USENIX Annual Technical Conference
is sponsored by USENIX.
Reverse Debugging of Kernel Failures in Deployed Systems
Xinyang Ge, Microsoft Research; Ben Niu, Microsoft; Weidong Cui, Microsoft Research
https://www.usenix.org/conference/atc20/presentation/ge

Reverse Debugging of Kernel Failures in Deployed Systems
Xinyang GeMicrosoft Research
Ben NiuMicrosoft
Weidong CuiMicrosoft Research
AbstractPost-mortem diagnosis of kernel failures is crucial for op-
erating system vendors because kernel failures impact thereliability and security of the whole system. However, de-bugging kernel failures in deployed systems remains a chal-lenge because developers have to speculate the conditionsleading to the failure based on limited information such asmemory dumps. In this paper, we present Kernel REPT, thefirst practical reverse debugging solution for kernel failuresthat is highly efficient, imposes small memory footprint andrequires no extra software layer. To meet this goal, Ker-nel REPT employs efficient hardware tracing to record thekernel’s control flow on each processor, recognizes the con-trol flow of each software thread based on the context switchhistory, and recovers its data flow by emulating machine in-structions and hardware events such as interrupts and excep-tions. We design, implement, and deploy Kernel REPT onMicrosoft Windows. We show that developers can use Ker-nel REPT to do interactive reverse debugging and find theroot cause of real-world kernel failures. Kernel REPT alsoenables automatic root-cause analysis for certain kernel fail-ures that were hard to debug even manually. Furthermore,Kernel REPT can proactively identify kernel bugs by check-ing the reconstructed execution history against a set of pre-determined invariants.
1 Introduction
Post-mortem diagnosis of software failures in deployed sys-tems is becoming increasingly important for today’s softwaredevelopment process. Many software vendors such as Mi-crosoft and Apple have insider programs to test their latestsoftware before it is released to the general public. Soft-ware developers rely more and more on debugging failuresreported from early adopters to fix critical issues before ev-ery software release. In particular, the operating system isof the utmost importance because it is the foundation of thesoftware stack and its bugs can have catastrophic impact onthe reliability and security of the whole system.
Debugging kernel failures in deployed systems has been achallenge. The fundamental reason is that developers have tospeculate on the conditions leading up to the failure based onthe limited information available for post-mortem diagnosissuch as crashing stacks or memory dumps. The complex-ity of the kernel makes developers’ speculation ineffectivein many cases. For example, the Windows kernel checks aset of invariants upon returning to the user mode, and termi-nates the system if any invariant is violated. Such a failureleaves developers an empty call stack, which makes it almostimpossible to debug.
This motivates us to build a practical solution that enablesdevelopers to go back in time and examine the root cause ofkernel failures in deployed systems. Reverse debugging isnot a new idea [5,10], and researchers and practitioners havedeveloped record and replay solutions that can precisely logthe execution of the whole system [16, 21, 22, 28]. How-ever, existing whole-system record and replay solutions re-quire the target operating system to run on top of emula-tion or virtualization, use an excessive amount of memoryand storage space to support the record and replay, and in-troduce significant performance slowdown. On contrary, apractical reverse debugging solution for deployed systemsmust be able to provide a high-fidelity execution history forpost-mortem diagnosis while meeting the requirements oflow performance overhead, small memory footprint, no addi-tional setup of software emulation or virtualization, minimalchange to the operating system, and zero compromise on thebackward compatibility with existing applications.
In this paper, we present Kernel REPT, the first practicalsolution for reverse debugging of kernel failures in deployedsystems. It is an extension of REPT [19], a reverse de-bugging solution for user-mode applications. Kernel REPTleverages online hardware tracing to log the control flow ofkernel executions and performs an offline binary analysis torecover the data flow. By configuring the hardware to tracethe target kernel inside the kernel itself, Kernel REPT avoidsthe extra layer of software emulation or virtualization, hasthe minimal change to the target operating system, and is
USENIX Association 2020 USENIX Annual Technical Conference 281

fully compatible with existing applications. Furthermore,hardware tracing is shown to be efficient [27].
Kernel REPT traces the kernel execution on each CPUcore instead of on each software thread as done in REPT.This helps Kernel REPT achieve a small memory footprintbecause the number of CPU cores is much less than the num-ber of software threads in a system. In this tracing configura-tion, one trace buffer may contain traces of multiple threadsand the trace of one thread may span multiple trace buffers.To allow reverse debugging over the execution of a thread,Kernel REPT requires the context switch history to assem-ble the trace of the thread. However, Kernel REPT cannotinfer the context switch history based on the control flow orthe memory dump. Instead, Kernel REPT logs the contextswitch events during runtime and uses them to reconstructthe execution of a given thread during offline analysis. Thisway Kernel REPT can provide reverse debugging over theexecution of a thread on top of the core-based tracing.
REPT performs forward and backward instruction emula-tion to recover the program’s data flow, however, it is insuf-ficient to just emulate the semantics of machine instructionsin Kernel REPT. This is because a processor modifies thekernel state when a hardware event such as interrupts or ex-ceptions occurs. To correctly recover the kernel state, Ker-nel REPT needs to emulate the semantics of these hardwareevents properly. However, these hardware events are not ex-plicitly logged in the control flow trace, and different eventsmay make different changes to the kernel state. Kernel REPTsolves this problem by leveraging the kernel configuration ofhardware event handlers. For instance, Kernel REPT can tella page fault just happened when the page fault handler is ex-ecuted as shown in the control flow trace.
We implement Kernel REPT and deploy it on a billion de-vices running Microsoft Windows. Our experiments showthat Kernel REPT is efficient as it incurs less than 10% slow-down for microbenchmarks and 2% slowdown for applica-tions like Nginx and Chrome. Windows kernel developersuse Kernel REPT to debug real-world kernel failures and findthe root cause of some kernel bugs that have existed for adecade and caused innumerable failures.
The usage of Kernel REPT is not limited to interactivereverse debugging. To this end, we develop an automaticroot-cause analysis for a common class of kernel failureswhere the kernel fails when it detects that certain resourcesare not properly released before returning to the user mode.This class of failures is hard to debug even manually withoutKernel REPT because the kernel stack is empty when a fail-ure happens. Based on the execution history reconstructedby Kernel REPT, our analysis can automatically identify thebuggy function for 136 out of 188 real-world kernel failuresof this class. This automatic root-cause analysis is deployedas part of Microsoft’s error reporting service [24].
The reconstructed kernel execution history can enable notonly automatic root-cause analysis but also proactive bug de-
tection. A common kernel bug pattern is that the exceptionhandling code fails to properly release resources acquiredduring the execution wrapped in the try block. We build ahybrid analysis to proactively look for this bug pattern bydynamically analyzing the execution in a try block and stati-cally analyzing the code in the exception handling block. Byanalyzing thousands of real-world kernel execution histories,our hybrid analysis finds 17 new bugs in the Windows kernel,and all of them are confirmed and fixed.
2 Overview
The goal of Kernel REPT is to reconstruct the execution his-tory of kernel failures in deployed systems for effective post-mortem diagnosis without incurring noticeable runtime over-head. As an extension of REPT [19], it utilizes hardwaretracing to log the kernel’s control flow to a circular buffer atruntime, and recovers its data flow by running binary anal-ysis on the recorded control flow and the memory dump ofa failure. In the rest of this section, we first provide a back-ground of REPT. Then we discuss the challenges faced byKernel REPT.
2.1 REPTREPT shows a promising way to do reverse debugging foruser-mode failures in deployed systems. REPT logs a pro-gram’s control flow into a per-thread circular buffer with lowruntime overhead via hardware tracing (e.g., Intel ProcessorTrace [18]), and then recovers its data flow offline by com-bining the control flow with the memory dump taken at thefailure point. To do so, REPT runs an iterative binary anal-ysis that performs forward and backward instruction emula-tion on the recorded instruction sequence to infer the pro-gram state before every instruction based on the final statestored in the memory dump. REPT checks for conflicts dur-ing the execution history reconstruction and performs errorcorrections based on heuristics. REPT also supports multi-threaded programs by merging the instruction sequences ofdifferent threads into a partially ordered single instruction se-quence based on the fine-grained timestamps logged by thehardware tracing, and limiting the use of concurrent sharedmemory writes in the binary analysis if their exact order can-not be determined. The reconstructed execution history isnot perfect, but it is shown that REPT achieves high accu-racy and enables effective reverse debugging of real-worldapplication failures.
To illustrate how REPT works, we show an example bor-rowed from the REPT paper [19, Figure 2] in Figure 1. Thisexample has 5 instructions in the control-flow trace (I1..I5).The program state Si represents the state after the execu-tion of instruction Ii. Therefore, the final program state S5stored in the memory dump has rax=3, rbx=0, and [g]=3.REPT performs backward and forward analysis iteratively
282 2020 USENIX Annual Technical Conference USENIX Association
Iteration 1 Iteration 2 Iteration 3S0 ↑ {rax=?, rbx=?, [g]=3}→ ↑ {rax=?, rbx=?, [g]=2}
I1 lea rbx, [g] S1 ↑ {rax=?, rbx=?, [g]=3} ↓ {rax=?, rbx=g, [g]=3} ↑ {rax=?, rbx=g, [g]=2}I2 mov rax, 1 S2 ↑ {rax=?, rbx=?, [g]=3} ↓ {rax=1, rbx=g, [g]=3} ↑ {rax=1, rbx=g, [g]=2}I3 add rax, [rbx] S3 ↑ {rax=3, rbx=?, [g]=3} ↓ {rax=3, rbx=g, [g]=3} ↑ {rax=3, rbx=g, [g]=?}I4 mov [rbx], rax S4 ↑ {rax=3, rbx=?, [g]=3} ↓ {rax=3, rbx=g, [g]=3} ↑ {rax=3, rbx=g, [g]=3}I5 xor rbx, rbx S5 ↑ {rax=3, rbx=0, [g]=3} ↓ {rax=3, rbx=0, [g]=3}→
Figure 1: “This example shows how REPT’s iterative analysis recovers register and memory values when there exist irreversibleinstructions with memory accesses. We use “?” to represent “unknown”, and use “g” to represent the memory address of aglobal variable. Some values are in bold-face because they represent key updates in the analysis. We skip the fourth iterationwhich will recover [g]’s value to be 2 due to the space constraint.” [19, Figure 2]
to recover data values. In the first iteration, REPT does notupdate the global variable [g] in S3 because rbx’s value isunknown. In the second iteration, there is a conflict for rax’svalue in S3. Its original value is 3, but the forward analysiswould infer value 4 for it (rax + [g] = 1 + 3 = 4). REPTkeeps the original value of 3 because it is from the final pro-gram state stored in the memory dump. In the third iteration,REPT recovers [g]’s value to be 2 based on rax’s value be-fore and after the add instruction I3.
For the purpose of this paper, we abstract REPT as a mech-anism that takes as the input a final machine state and its pre-ceding instruction sequence, and outputs the recovered ma-chine state before every instruction with high accuracy. Ker-nel REPT leverages this data recovery mechanism to enablereverse debugging of kernel failures.
2.2 Challenges
A straw-man solution to support reverse debugging of kernelfailures is to modify REPT to trace the kernel execution ofeach software thread and run the same binary analysis on akernel memory dump. However, this simple solution doesnot work for two reasons.
First, it incurs unacceptable memory overhead. The ker-nel is shared by all threads on a system and allocating atrace buffer for each of them can consume an unpredictableamount of memory, especially when a system can have thou-sands or even tens of thousands of threads.
Second, the kernel has to handle hardware events of whichuser-mode applications are unaware. For instance, interruptsand exceptions can change the kernel’s stack layout with-out executing any explicit instruction. The details of thesehardware events such as the exception vector are not loggedby the hardware tracing. However, such information is im-portant for the data flow recovery because different types ofhardware events have different architectural effects that mustbe emulated.
3 Kernel REPT
In this section, we present the design of Kernel REPT. Wefirst describe how Kernel REPT avoids excessive memoryconsumption via per-core tracing while still allowing reversedebugging over the execution of a thread. Then we presenthow Kernel REPT handles hardware events when perform-ing the offline binary analysis to recover the data flow.
3.1 Per-Core Tracing
To minimize the memory footprint, Kernel REPT chooses todo per-core tracing instead of per-thread tracing for the ker-nel. That is, Kernel REPT allocates a circular trace bufferfor each logical core and logs the kernel-mode execution ona core to its corresponding buffer. Kernel REPT does notlog the control flow of user-mode executions because the ac-tual machine code executed in the user mode is not directlyrelated to the root cause of kernel failures. Per-core trac-ing ensures that Kernel REPT’s memory usage is linear inthe number of logical cores on a system, and the number oflogical cores is fixed and small compared to the number ofsoftware threads. This allows Kernel REPT to configure alarge trace buffer for each core when necessary without therisk of exhausting the memory.
Per-core tracing does come with its own problems. It ismore intuitive for developers to follow the execution on asoftware thread as opposed to a hardware core. On a mul-tiprocessor system, per-core tracing may mix traces of dif-ferent threads into one trace buffer and spread the trace of asingle thread into multiple trace buffers. This requires Ker-nel REPT to obtain the context switch history to identify thetrace of a single thread.
Ideally, Kernel REPT should recover the context switchhistory from a per-core trace by leveraging the binary analy-sis. However, the binary analysis cannot effectively reversethe context switch routine because the scheduling history isneither preserved in the memory dump nor can be inferredfrom the recorded instruction sequence. We show the pseudocode of a typical context switch routine in Figure 2. The con-text switch routine saves the register context of the previous
USENIX Association 2020 USENIX Annual Technical Conference 283
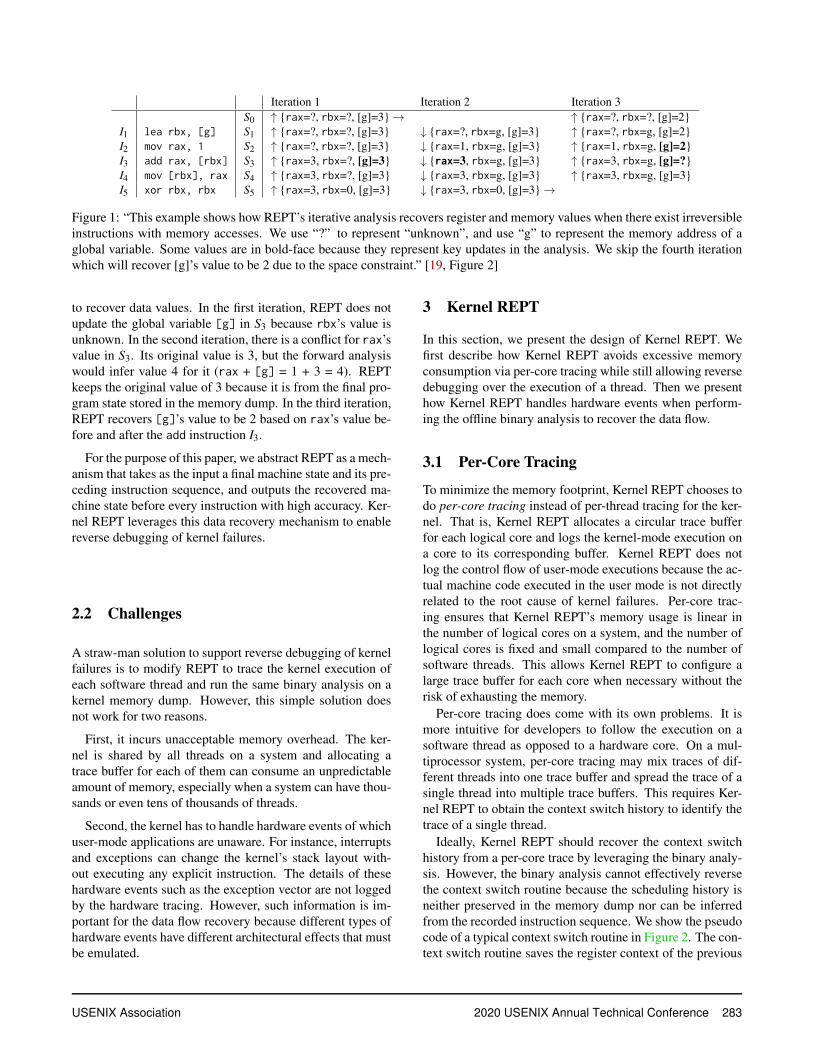
1 ; pseudo code for context switch2 ; rdi points to the old thread3 ; rsi points to the new thread4 push rax ; save GPRs5 push rbx6 ...7 mov KernelStack[rdi], rsp ; switch stack8 mov rsp, KernelStack[rsi]9 ... ; restore GPRs
10 pop rbx11 pop rax12 ret
Figure 2: Pseudo code for context switch. Basically, the con-text switch routine saves the register context to the previousthread’s stack and the stack pointer to the previous thread’sinternal data structure, and then restores the context of thenew thread by doing the opposite operations.
Type Origin Details
Interrupt User/Kernel Vector numberException User/Kernel Vector number
Syscall User N/A
Table 1: Information about hardware events needed for soft-ware emulation.
thread on its stack, swaps the stack pointer, and then restoresthe register context of the newly scheduled thread to resumeits execution. In this process, the context switch routine doesnot save the information about the previous thread before re-suming the execution of the new thread, and hence the binaryanalysis is unable to recover the scheduling history. This alsomakes the binary analysis ineffective when applied directlyto the per-core trace because the register values before a con-text switch cannot be recovered. Therefore, Kernel REPTchooses to log the context switch history in software.
3.2 Handling Hardware Events
The operating system manages hardware resources and hasto handle hardware events. Therefore, the architectural ef-fects of these hardware events, which are transparent to user-mode execution, are part of the kernel-mode execution andmust be emulated when running the binary analysis for ker-nel data recovery.
Different hardware events have different architectural ef-fects, and Kernel REPT has to understand the semantics ofeach hardware event for emulation. We list the informationabout the hardware events required for software emulationin Table 1. Specifically, Kernel REPT has to not only tell thetype of a hardware event, but also infer whether this eventoccurred in the user or kernel mode and what it was about.
To do so, Kernel REPT first infers the occurrence of ahardware event based on the hardware trace. Given that Ker-nel REPT only traces the kernel-mode execution, hardwaretracing will be paused when the execution returns to the usermode, and resumed when the execution enters the kernelmode. Therefore, the signal of tracing being resumed alreadyindicates the occurrence of a hardware event—a system callor an interrupt/exception happening in the user mode. Thehardware trace logs the occurrence of an asynchronous eventduring the kernel execution. Kernel REPT uses such infor-mation to detect the occurrence of an interrupt or exceptionin the kernel mode.
Next, Kernel REPT needs to infer additional informationabout a hardware event such as its type and the vector num-ber for an interrupt. The Windows kernel configures the han-dlers for these hardware events at the boot time and neverreconfigures the settings throughout the rest of its lifetime.Kernel REPT assumes this invariant holds for the vast ma-jority of kernel failures under non-adversarial scenarios, anddetermines the event type as well as the vector number forinterrupts/exceptions by comparing the control flow to thekernel configuration stored in the memory dump.
Finally, Kernel REPT emulates the architectural effect ofthese events according to the hardware specification. KernelREPT performs the emulation during the binary analysis asif it were emulating a special instruction. However, not alldata values are available to Kernel REPT when emulating ahardware event. For example, when emulating an exceptionfrom the user mode, Kernel REPT does not know the user-mode instruction that triggers the exception, so it cannot fillup all fields of the trap frame. Similarly, Kernel REPT doesnot log the parameters of system calls, so it does not nec-essarily have the register context of a system call event if itcannot be recovered from the memory dump. In these cases,Kernel REPT simply marks the register and memory valuesas unknown to avoid propagating stale values during the bi-nary analysis.
4 Automatic Analyses
In this section, we present two automatic analyses enabled byKernel REPT. The first analysis is an automatic root-causeanalysis that can identify the buggy function for a specificclass of kernel failures. The second analysis is a hybrid anal-ysis that can proactively detect bugs that may lead to thisclass of kernel failures.
4.1 Root-Cause AnalysisA common kernel bug is that calls to do operations (e.g.,resource acquisition) are not matched by calls to undo op-erations (e.g., resource release). For example, if the kerneldisables interrupts before entering a critical region but failsto re-enable interrupts after leaving the critical region, the
284 2020 USENIX Annual Technical Conference USENIX Association

system will crash eventually. Despite the simple nature ofthis failure type, it is difficult to debug kernel failures causedby these bugs simply based on a memory dump. The keychallenge is that the buggy function that missed the undooperation may have returned a long time ago. Without an ex-ecution history, it is hard to infer which function could be thebuggy one. Particularly, the Windows kernel checks if thereis a missing undo operation (e.g., resource not released) be-fore it returns to the user mode. A failed check leaves devel-opers an empty call stack, which makes it almost impossibleto debug. What makes the matter worse is that some opera-tions allow recursion by maintaining a counter for all pend-ing do operations (e.g., recursive lock). This requires thedevelopers to match the do and undo operations in a poten-tially long history before they can identify the unmatched dooperation, which further complicates the diagnosis process.
The root-cause analysis identifies the buggy function thatmisses the undo operation by searching along the execu-tion history to find the first function where a specified valuechanges between the function entry and return. For exam-ple, to detect when the kernel fails to re-enable the inter-rupts upon exiting a critical section, the analysis checks forthe interrupt enablement at each function entry and return,and reports the first one that has a mismatched value. How-ever, there are exceptions to the above analysis because somefunctions are designed to just perform the do or undo opera-tion. For example, if enabling/disabling interrupts is imple-mented in a library function, then the function is expected tomodify the value between its entry and return. The libraryfunctions that are designed to perform only a do or undooperation are relatively stable across kernel versions, so wemaintain a whitelist for such functions. The root-cause anal-ysis ignores them when searching for the buggy function.
4.2 Proactive Bug Detection
A common bug pattern that causes undo operations be-ing missed is related to the try/catch-like primitives de-signed to handle hardware exceptions gracefully. For exam-ple, the Windows kernel uses Structured Exception Handling(SEH) [9] to handle page faults when accessing a user-modepage. An undo operation may be missed when an excep-tion occurs if the try scope contains a do operation and thecatch scope does not have the corresponding undo opera-tion. We show an example of this bug pattern in Figure 3.foo calls read_user_obj in a try block to handle pagefaults in case the user-mode page is not mapped with properpermissions (line 12). read_user_obj temporarily disablesSupervisor-Mode Access Prevention (SMAP) in order to ac-cess user-mode pages (line 4). If a page fault occurs whenread_user_obj dereferences user_ptr, the page fault han-dler will redirect the execution back to the catch block infoo (line 15), skipping the subsequent call to enable_smap(line 5). The correct implementation is to apply the scope of
1 obj_t read_user_obj(int *user_ptr) {2 obj_t obj;3 disable_smap();4 obj.a = *user_ptr;5 enable_smap();6 return obj;7 }8
9 int foo() {10 obj_t obj;11 try {12 obj = read_user_obj(user_ptr);13 }14 catch {15 return -1;16 }17 return 0;18 }
Figure 3: Example code that misuses try/catch leading to amissing undo operation.
the try block to the dereference of user_ptr instead of theentire read_user_obj function.
Leveraging the execution history reconstructed by KernelREPT, we design an automatic hybrid analysis to proactivelydetect bugs of this pattern. Our hybrid analysis has two steps.First, it uses a dynamic analysis to check if there is any dooperation in a try scope based on the execution history. Sec-ond, it uses a static analysis to check if the matching catchscope does not have the corresponding undo operation. Theanalysis identifies try and catch scopes based on the un-wind information in the binaries [14].
The assumption behind this analysis is that a hardware ex-ception may happen at any time within the try scope, andmissing the undo operation in the catch scope means thatthe kernel would fail to restore the state if an exception hap-pens after the do operation. Even though this assumptionmay not be true for all cases, a violation implies an overuseof the try scope that should be addressed by developers.
The hybrid analysis is accurate and effective because itleverages execution traces from a huge number of deployedsystems. First, a try scope may include a significant amountof execution involving multiple levels of function calls. Stat-ically analyzing such a try scope is challenging, and our dy-namic analysis avoids this challenge. Second, the executionsof all kernel threads (i.e., not limited to the failure thread) in afailure report are used in the hybrid analysis. This allows theanalysis to avoid the common constraint on completeness fordynamic analysis. Third, the code logic in the catch scope isusually straightforward, so simple static analysis is sufficientfor checking if an expected undo operation exists.
USENIX Association 2020 USENIX Annual Technical Conference 285
5 Implementation
In this section, we describe the implementation and deploy-ment of Kernel REPT on Microsoft Windows.
5.1 Kernel Tracing
Kernel REPT logs both the context switch history and thecontrol flow of the Windows kernel. To log the contextswitch history, Kernel REPT leverages Event Tracing forWindows (ETW) [4]. ETW logs the timestamp, identifiersof both the old thread and the new thread for each contextswitch event. These ETW events will be included in thememory dump of a kernel failure.
To record the kernel’s control flow, Kernel REPT enablesIntel Processor Trace (PT) [18] on each processor core forthe kernel-mode execution at system start. We adapt thedriver from REPT to enable Intel PT for the Windows kernel.Our driver change has roughly 2K lines of C code. We markthe virtual memory of trace buffers as read-only to preventthe Windows kernel from accidentally corrupting them. Thiscan be done because Intel PT outputs the trace directly to thephysical memory and is not subject to the page permissionwe set on the virtual memory. Similar to the user-mode trac-ing in REPT, the kernel-mode trace is stored in the memorydump when a kernel failure is reported.
Kernel REPT currently disables multithreaded analysis forkernel failures due to a caveat of Intel PT. The timestamp log-ging of Intel PT cannot be configured for a specific privilegelevel. Without such a privilege-level filtering, the timestampsgenerated during the user-mode execution will overwrite thekernel’s control-flow trace in the circular buffer. One possi-ble solution is to dynamically enable and disable timestampsin software when the processor switches between the userand kernel mode. We leave its exploration to future work.
5.2 Trace Parsing
Intel PT encodes the control flow in a highly compact for-mat. It requires the code binary to parse the trace to recon-struct the control flow. Meanwhile, an operating system canswap out kernel code pages to reclaim its underlying phys-ical memory. This can fail the trace parsing because evencapturing the entire physical memory upon a kernel failurecan be insufficient due to the unavailability of swapped-outcode pages. One possible solution to this problem is to lockall the kernel code pages into the physical memory, but thiswill increase the memory pressure to the overall system.
In Kernel REPT, we choose to reconstruct the code pagesbased on the image’s metadata stored in the memory dumpand its binary file. One disadvantage of this approach is thatit does not work for third-party drivers where the binary filesare unavailable. This is not a big issue in practice because
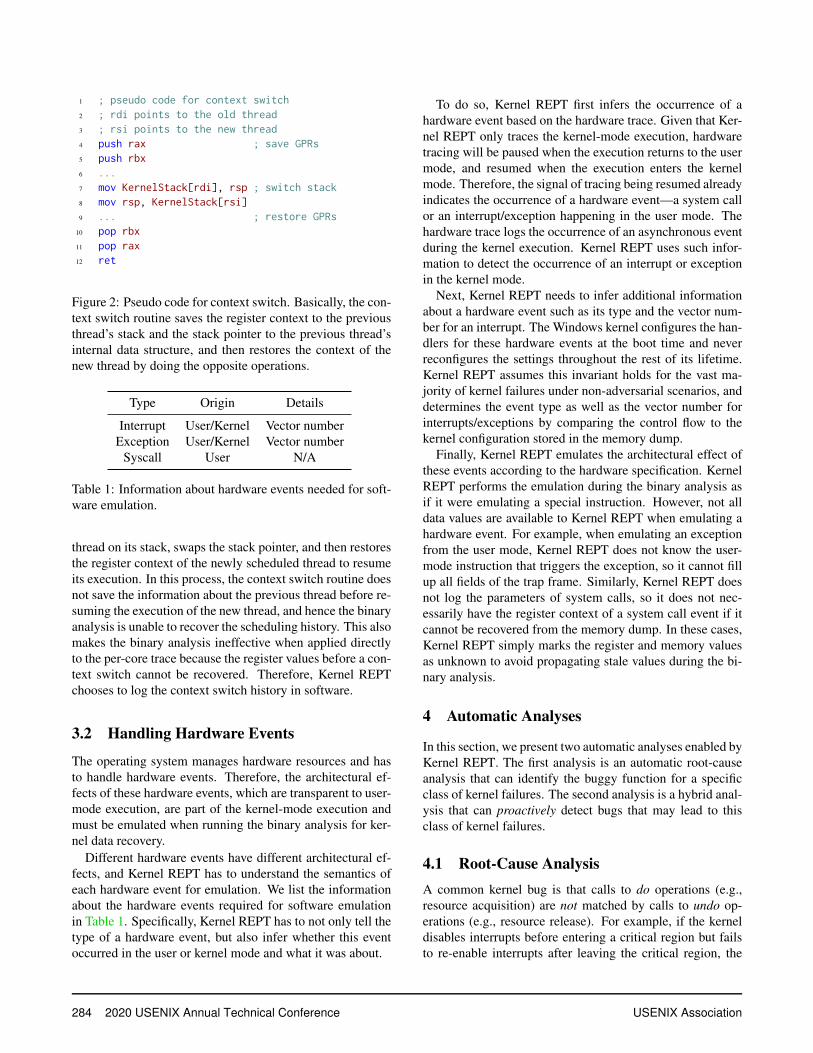
Time
CPU0 CPU1 CPU2 CPU3
Figure 4: An example scenario where traces of a thread arenot contiguous. Solid lines represent the execution trace ofthe interesting thread. Dashed lines represent the executiontrace of other threads. Dots (•) connecting them representcontext switches. Dotted lines mean the processor was insleep mode and no execution trace was generated.
the code that was executed close to the failure point is usu-ally available in the physical memory (thanks to the memorymanager’s policy).
5.3 Binary Analysis
We implement Kernel REPT’s binary analysis in 15K linesof C++ code on top of REPT. It includes the emulation ofhardware events, the thread trace reconstruction based onthe context switch history, and the two automated analyses.Most of the implementation is straightforward, but there aretwo technical details worth mentioning here.
First, a thread’s trace may be noncontiguous with respectto the thread’s execution. We show an example in Figure 4.In this example, core 2 was in sleep mode for a long periodof time, and no execution trace was generated. The trace ofthe target thread in its circular buffer can be obsolete and dis-connected from the rest of the thread’s trace on other cores.This can happen when the trace of the target thread on core 1was overwritten by another thread, and the overwritten tracewas more recent than the trace in core 2’s trace buffer. KernelREPT checks for such cases based on the timestamps of con-text switch events, and discards those disconnected traces.
Second, certain kernel instructions can be missing fromthe control-flow trace when the system is running insidea virtual machine. In a virtualized environment, guest in-structions that can modify the system state (e.g., wrmsr) aretrapped and emulated by the hypervisor. Kernel REPT onlytraces the kernel-mode execution, so its binary analysis willbe under the illusion that these instructions are skipped ac-cording to the Intel PT trace. This can result in an inconsis-tent state in the data flow recovery. Kernel REPT solves this
286 2020 USENIX Annual Technical Conference USENIX Association

issue by detecting VMEXIT and adding the skipped instructionback to the instruction sequence if it is deemed as emulatedby the hypervisor. Specifically, for each asynchronous eventlogged in the trace, Kernel REPT checks if there is one andonly one possible instruction between the current instructionand the next instruction in the instruction sequence. If so,Kernel REPT determines that the instruction is emulated bythe hypervisor, and adds it back to the instruction sequencebefore running the binary analysis. This check is straightfor-ward to implement because the hypervisor-emulated instruc-tion is typically a non-branch instruction.
5.4 DeploymentWe have deployed Kernel REPT in the ecosystem ofMicrosoft Windows. The deployment of Kernel REPTspans three parts: Windows, Windows Error Reporting(WER) [24], and Windows Debugger [12].
On Windows, we released the kernel driver that config-ures Intel PT tracing and the ETW context switch logger forthe kernel, and a user-mode daemon that communicates withWER to decide when to start/stop the driver. These compo-nents were released as part of Windows 10 version 1803.
On the WER service, we added support for requesting In-tel PT traces for a given kernel failure. When the WER ser-vice receives such a request, it selects devices that have re-ported the same kernel failures in the past and are capable ofIntel PT to enable tracing for future failure reporting. TheWER service also runs the automatic root-cause analysis onkernel failures of the specific error code [2].
On Windows Debugger, we implemented Kernel REPT’sinteractive reverse debugging by extending REPT’s debug-ger extension. This extension allows an developer to setbreakpoints, go back and forth on the reconstructed execu-tion history, switch to different threads, and inspect the localand global variables.
6 Evaluation
In this section, we evaluate the performance and effective-ness of Kernel REPT. For performance, we run both micro-benchmarks and real-world applications with Kernel REPTenabled to measure the runtime overhead. For effectiveness,we evaluate Kernel REPT’s data recovery and report how ithelps developers debug real-world kernel bugs.
6.1 PerformanceWe evaluate the performance impact of Intel PT tracingand context switch logging on kernel-mode execution byrunning UnixBench 5.1.3 [11], ApacheBench [1] on Ng-inx 1.17.5 [7], and JetStream 2 benchmarks [6] on Chrome79 [3]. We choose UnixBench because it measures themicro-level performance impact on a kernel’s key functions
Execl
FileCopy (1KB)
FileCopy (256B)
FileCopy (4KB)
Pipe Throughput
Context Switch
ProcessCreatio
n
System
Call0.0
2.0
4.0
6.0
8.0
10.0Intel PT
Intel PT + CS
Figure 5: Performance overhead of running UnixBench withIntel PT tracing and context switch logging.
such as system calls and context switches. We choose Ng-inx and Chrome because they represent popular programs forserver and client scenarios, respectively. We run the exper-iments on a Windows 10 (version 1903) machine equippedwith an Intel i7-6700K processor (8 logical cores) and 16GBRAM. We allocate two separate circular buffers for each log-ical core: a 1MB buffer for Intel PT tracing and a 128KBbuffer for context switch logging. We choose this default set-ting empirically for experiments, but our real-world deploy-ment allows developers to adjust the configuration as needed.
6.1.1 UnixBench
We run UnixBench on the Windows Subsystem for Linux1 (WSL 1) [13]. WSL 1 implements Linux system callsfrom the Windows kernel to run unmodified Linux ELF bi-naries such as UnixBench. We show the performance re-sults of UnixBench in Figure 5. For Intel PT tracing only,the average performance overhead is 3.06% with no singlebenchmark exceeding 5% overhead. With the context switchlogging enabled in addition, the average performance over-head becomes 5.35% with the highest performance overheadof 9.68%. In particular, three benchmarks, Execl, ContextSwitch and Process Creation, have more frequent contextswitches than other benchmarks. Therefore, they have higheroverhead when context switch logging is turned on.
6.1.2 Nginx
We evaluate the performance overhead of different tracingsetups on Nginx using ApacheBench. We run Nginx onthe test machine with 8 logical cores and 16GB RAM. Weuse the default configuration provided by Nginx but mod-ify worker_processes to 8 to use all the logical cores. We
USENIX Association 2020 USENIX Annual Technical Conference 287

# Instructions Data Recovery
IRQL Fault (Kernel) 3,310,906 65.13%Code Overwrite 1,151,315 73.18%Stack Trash 315,046 65.75%IRQL Fault (User) 9,176,219 61.56%Stack Overflow 10,421,430 60.97%Hardcoded Breakpoint 9,129,048 61.65%Double Free 5,232,343 43.03%
Table 2: Kernel REPT’s data recovery rate on kernel failurescaused by notmyfault [8].
run ApacheBench on a separate client machine with 16 log-ical cores. We use the client to make 100,000 HTTP re-quests over 16 concurrent connections and then measure thethroughput (requests/second). We run each session 10 timesand report the average throughput. The reduction of the av-erage throughout when the Intel PT tracing is enabled (withor without the context switch logging) is about 2%.
6.1.3 Chrome
We run JetStream 2 benchmarks on the Chrome browser toevaluate the performance impact on web browsing, one ofthe most common client-side scenarios. There is no visibleperformance slowdown when both the Intel PT tracing andthe context switch logging are enabled. We believe this isbecause the benchmarks have most of their computation inthe user mode.
6.2 EffectivenessWe evaluate the effectiveness of Kernel REPT from four per-spectives: (1) how well it can recover data; (2) how its inter-active reverse debugging can help developers debug kernelbugs; (3) how accurate the automatic root-cause analysis is;(4) how well the proactive bug detection works.
6.2.1 Data Recovery
We evaluate Kernel REPT’s data recovery based on the samemetric as REPT [19]. Specifically, we measure the data re-covery rate as the percentage of register uses (i.e., a registerused as the source operand or in the address of a memoryoperand) for which the register value is recovered by KernelREPT. Register use is a good metric because it avoids dou-ble counting (e.g., we only count it once when rax and rbxare both known in an instruction mov rax,rbx) and memoryvalues are often loaded into registers first before being usedin an operation.
In our experiment, we trigger Windows kernel failures byusing a public utility program called notmyfault [8], whichinjects a kernel driver to cause various types of failures such
1 bool get_desc(..., desc_t **p) {2 int size;3 bool success;4 *p = malloc(sizeof(desc_t));5 driver = find_driver();6 success = (driver->op)(*p, &size);7 return success;8 }9
10 void foo() {11 desc_t *p;12 bool success;13 if (...) {14 success = get_desc(..., &p));15 } else {16 success = get_desc(..., &p));17 }18 if (success) {19 bar(p->owner->sid); // CRASH!20 }21 }
Figure 6: A real-world example that showcases how KernelREPT helps developers find bugs.
as stack overflow and double free. We pick notmyfault be-cause its injected failures are reproducible. Our experimentdoes not include the Buffer Overflow fault in notmyfaultbecause it cannot trigger a kernel failure on the latest Win-dows. For each failure, we count the number instructions andmeasure the data recovery rate for the crashing thread. Ourexperimental results are shown in Table 2.
Kernel REPT’s data recovery rate is over 60% for all butone failure even when some execution contains over 10 mil-lion instructions. The Double Free case involves a series ofmemory allocation/free operations. As reported in REPT,memory allocation operations are hard to reverse becausetheir metadata may be completely overwritten by subsequentfree and reallocation operations. We believe this is the mainreason for the Double Free case to have a lower data recoveryrate than others.
Comparing with REPT’s data recovery on user-mode pro-grams [19, Figure 4], we can see that Kernel REPT achievesa similar data recovery rate for kernel failures. Note thatsome recovered data may be incorrect, but we cannot directlymeasure it due to the lack of a ground truth. However, we ex-pect it to be in the same low percentage as REPT.
6.2.2 Interactive Reverse Debugging
We use a real-world case to demonstrate how Kernel REPTcan help developers debug kernel bugs through interactivereverse debugging. This bug was introduced to the Windowskernel more than a decade ago. It was not fixed until Ker-nel REPT became available due to the lack of information in
288 2020 USENIX Annual Technical Conference USENIX Association

memory dumps. We show a simplified version of the codearound the bug in Figure 6. In the code snippet, foo callsget_desc to receive a pointer to a descriptor object. De-pending on certain conditions (line 13), the call can happenat two places with potentially different parameters (line 14and 16). get_desc allocates the memory for the descrip-tor object (line 4) and finds the driver that provides the cor-responding callback (line 5). Then, get_desc invokes thedriver’s callback function to initialize the object, which re-turns whether the initialization succeeds and the number ofbytes being initialized (line 6). Finally, the crash happenswhen foo dereferences a pointer field (owner) inside the de-scriptor object (line 19).
To debug this kernel failure, a developer first has to de-termine where get_desc is called (line 14 or 16). WithoutKernel REPT, a developer would need to use some auxil-iary information to figure it out. However, with the recordedcontrol flow, it is straightforward to find it. The next step isto determine the target function of the callback (line 6). Thiscan be challenging without the recorded control flow becauseget_desc has already returned and the relevant informationmay no longer be available. In fact, the actual code involvesmultiple levels of indirect function calls, making the problemeven harder. With Kernel REPT, the developer can easilyreach the correct target function based on the recorded con-trol flow. Finally, the developer has to understand how thedescriptor is mis-initialized by the callback function. In thisparticular case, it turns out that the callback function doesnot attempt to initialize the descriptor object at all. It just re-turns success with the number of initialized bytes being zero.Unfortunately, foo does not check the number of bytes beinginitialized, leading to the subsequent crash caused by deref-erencing an uninitialized pointer value. To fix this bug, thedeveloper changes the callback function to return an errorcode indicating that the operation is not supported.
6.2.3 Root-Cause Analysis
We run the automatic root-cause analysis described in §4.1on 377 real-world kernel failures of a specific error code [2]reported to Microsoft over two weeks. This error code isused by the kernel when it detects a specific resource is notproperly released upon returning to the user mode. The anal-ysis identifies potential buggy functions in 33 kernel compo-nents including the core OS kernel, the GUI subsystem, thefile system, and some third-party drivers. To evaluate the ac-curacy of the root-cause analysis, we manually check eachidentified buggy function either based on the source code orthe confirmation from developers. Since the source code ofthird-party drivers is unavailable and it is difficult to reachtheir developers, we exclude the 189 kernel failures whosebuggy functions are in a third-party driver.
We show the accuracy of the root-cause analysis for theremaining 188 kernel failures in Table 3. The root-cause
True Blame False Blame
Try/Catch Misc. Manual Unresolved
136 12 23 17
Table 3: The accuracy of the automatic root-cause analy-sis on 188 real-world kernel failures for which Kernel REPTblames a function in the first-party components.
analysis correctly identifies the buggy function for 148 fail-ures. 136 of these failures are caused by unsafe try/catchoperations and 12 of them are caused by other miscellaneousissues (e.g., the code fails to properly clean up the state on anerror handling path). The root-cause analysis fails to identifythe true buggy function for 40 kernel failures. We manuallyanalyze them via interactive reverse debugging and find thatwe can find the true buggy function for 23 failures. The rest17 failures cannot be resolved due to the limited trace size ordata recovery.
While analyzing the memory dumps of the 23 failuresmanually, we find that one common reason for the automaticroot-cause analysis to miss the true buggy function is thatthe do and undo operation pair is tied to an object’s lifetimeinstead of a function’s lifetime. For example, one way tomanage the acquisition and release of a lock is to implementthe acquire operation in a constructor function and the re-lease operation in the corresponding destructor function. Inthis case, a function can indirectly acquire the lock by cre-ating such an object, and then passes it to another functionthat releases this lock by destructing the object. If the kernelfails to destruct the object due to programming errors, it notonly causes memory leaks but also leads to the missing undoissue. The root cause of such programming errors can varycase by case, and blaming the function that creates the objectand seemingly misses the destruction does not always leadto the correct outcome. However, even in these cases, theroot-cause analysis can provide useful information to helpdevelopers find the root cause.
6.2.4 Proactive Bug Detection
We run the proactive bug detection described in §4.2 over2000 execution histories reconstructed from memory dumpsof real-world kernel failures. We do not limit the failuretype, and use the execution histories of all threads in a mem-ory dump. We use memory dumps of kernel failures insteadof normal executions because they are currently the majorsource of recorded real-world kernel executions.
We have found a total of 17 previously unknown kernelbugs, and all are confirmed and fixed. For one of the bugs,we observed an actual kernel failure caused by it a few daysafter we reported it to the developer. This shows the potentialof using Kernel REPT to uncover bugs even before they aretriggered in practice.
USENIX Association 2020 USENIX Annual Technical Conference 289

7 Discussion
Kernel REPT extends REPT’s support for reverse debuggingof user-mode failures to kernel-mode failures. Therefore, itshares two limitations with REPT. First, the reconstructedexecution history is incomplete because the circular tracebuffer only captures a fixed amount of control-flow infor-mation before the kernel failure. Second, the reconstructedexecution history is imperfect because many instructions arenot reversible. Despite the two limitations, Kernel REPT’sreverse debugging capability allows successful diagnosis ofmany real-world kernel failures that were impossible to de-bug before.
The automatic root-cause analysis described in §4.1 re-quires a whitelist of functions that perform only a do orundo operation by design. It requires manual effort to con-struct and update the whitelist. The root-cause analysis mayhave false blames due to the incompleteness of the whitelist.In practice, we rely on developers’ feedback to keep thewhitelist up to date.
One interesting observation we have is that REPT-style re-verse debugging is more effective for kernel-mode failuresthan for user-mode failures. We believe the key reason isthat the Windows kernel operates in a more defensive man-ner: it performs various checks of invariants in kernel stateat different times of the execution, such as checking missingundo operations before returning to the user mode (see §4.1for details). These checks shorten the execution between theprogram defect and the program failure. This is crucial forthe effectiveness of REPT-style reverse debugging since itsreconstructed execution history is incomplete and imperfect.
8 Related Work
In this section, we discuss the previous work related to Ker-nel REPT in three categories: record and replay, failure anal-ysis and failure reproduction. We omit the discussion ofREPT [19] as we have covered it comprehensively in §2.1.
8.1 Record and ReplayRecord and replay tools have been applied to debugging forboth user-mode applications [15, 25, 30, 33] and operatingsystems [16,21–23,28,31,32,34,35]. Software-based recordand replay tools [16, 21–23, 28, 35] for operating systemsrequire running the whole system in a virtualized environ-ment to log all non-deterministic inputs to the target system.These tools are rarely deployed in production environmentsbecause of their significant runtime overhead and compati-bility issue. The latter is caused by the requirement for aspecial setup such as installing a custom virtual machine.
Hardware-based record and replay tools [31, 32, 34] mod-ify the underlying hardware to record the execution of a tar-get system. For example, Flight Data Recorder (FDR) [34]
instruments the processor’s cache coherency protocol to en-able record and replay of a multiprocessor system. The re-quired hardware modification makes these systems expen-sive to build and adopt in practice.
Compared to the above record and replay tools, KernelREPT enables effective reverse debugging for operating sys-tems running on commodity hardware with low performanceand space overhead at runtime, making it practical for de-ployment on real-world systems.
8.2 Failure Analysis
RETracer [20] is a triaging system for both user-mode andkernel-mode failures. It starts with a corrupted pointer, per-forms backward taint analysis on memory dumps, and as-signs the blame to a function that contributes to the accessviolation. RETracer uses the crashing stack as an approxi-mate execution trace when performing backward taint anal-ysis, so it cannot effectively analyze kernel failures with anempty call stack.
Postmortem Symbolic Evaluation (PSE) [29] performsstatic backward slicing on memory dumps to identify wherea bad pointer is originated. PSE is also limited by the infor-mation available in the dump, and can have false positivesdue to unresolved memory aliases.
SherLog [36] analyzes the log messages generated duringa failed execution to infer control and data values before thefailure point. While this approach may be useful to diag-nose logical bugs in a program, log messages cannot be usedto diagnose low-level software bugs such as memory safetyerrors. In addition, its effectiveness depends on the devel-oper’s expertise in determining the key information to log,which varies case by case.
Kernel REPT is complementary to the above productionfailure analysis techniques. For instance, we integratedREPT-style reverse debugging into RETracer so that the lat-ter can run its backward taint analysis on the reconstructedexecution history to derive a more precise blame for produc-tion failures.
8.3 Failure Reproduction
Execution Synthesis (ESD) [37] explores possible programpaths to search for inputs that can lead to the same failure.ESD relies solely on memory dumps, and its symbolic exe-cution [17] may not be able to solve complicated constraintswhen exploring a long execution history of complex programstate. This makes it difficult to work for complex programssuch as the operating system kernel.
BugRedux [26] reproduces a production failure by instru-menting the program to collect execution data at differentlevels and employing symbolic execution to compute an in-put leading to a similar execution. Program instrumentation
290 2020 USENIX Annual Technical Conference USENIX Association

incurs overhead even for normal executions, and symbolicexecution is known to have path explosion problems.
Kernel REPT allows developers to examine the executionhistory of a kernel failure without the need to reproduce it.
9 Conclusion
We have presented the design and implementation of KernelREPT, the first practical solution for reverse debugging ofkernel failures in deployed systems. Kernel REPT recordsthe kernel’s control flow and context switch events on eachprocessor, and recovers its data flow on each software threadvia binary analysis. Its analysis emulates both machine in-structions and hardware events such as interrupts and excep-tions. In addition to the support for interactive reverse de-bugging, we have developed two automatic analyses on topof Kernel REPT: a root-cause analysis that can identify thebuggy function for a class of kernel failures, and a hybridanalysis that can proactively detect bugs due to a misuse ofthe try/catch primitive. We show that Kernel REPT is effi-cient for real-world deployment and effective for debuggingreal-world kernel failures.
Acknowledgments
We thank our shepherd, David Devecsery, and other review-ers for their insightful feedback during this unprecedentedtime. We are also very grateful for all the help from ourcolleagues at Microsoft during the development and deploy-ment of Kernel REPT. In particular, we thank Alan Auer-bach, Joe Ballantyne, Harini Bandi, Abolade Gbadegesin,Stephen Hufnagel, Mehmet Iyigun, Pedro Justo, Scott Lee,Graham McIntyre, Timothy Misiak, Viorel Mititean, JordiMola and Pin Wu for their tremendous help in making thisproject a fully deployed end-to-end system.
References
[1] ApacheBench: A Complete Benchmarking and Re-gression Testing Suite. https://httpd.apache.org/docs/2.2/programs/ab.html.
[2] APC Index Mismatch. https://docs.microsoft.com/en-us/windows-hardware/drivers/debugger/bug-check-0x1--apc-index-mismatch.
[3] Chrome. https://www.google.com/chrome/.
[4] Event Tracing for Windows (ETW). https://docs.microsoft.com/en-us/windows/win32/etw/about-event-tracing.
[5] GDB and Reverse Debugging. https://www.gnu.org/software/gdb/news/reversible.html.
[6] JetStream 2. https://browserbench.org/JetStream/.
[7] Nginx. https://www.nginx.com/.
[8] NotMyFault. https://docs.microsoft.com/en-us/sysinternals/downloads/notmyfault.
[9] Structured Exception Handling (SEH).https://docs.microsoft.com/en-us/cpp/cpp/structured-exception-handling-c-cpp.
[10] UndoDB: The Interactive Reverse Debugger for C/C++on Linux and Android. https://undo.io/.
[11] UnixBench. https://github.com/kdlucas/byte-unixbench.
[12] Windows Debugger. https://docs.microsoft.com/en-us/windows-hardware/drivers/debugger/.
[13] Windows Subsystem for Linux (WSL). https://docs.microsoft.com/en-us/windows/wsl/about.
[14] x64 Exception Handling. https://docs.microsoft.com/en-us/cpp/build/exception-handling-x64.
[15] Gautam Altekar and Ion Stoica. ODR: Output-Deterministic Replay for Multicore Debugging. InProceedings of the 22nd ACM Symposium on Operat-ing Systems Principles (SOSP), pages 193–206. ACM,2009.
[16] Prashanth P Bungale and Chi-Keung Luk. PinOS:A Programmable Framework for Whole-System Dy-namic Instrumentation. In Proceedings of the 3rd In-ternational Conference on Virtual Execution Environ-ments (VEE), pages 137–147. ACM, 2007.
[17] Cristian Cadar, Daniel Dunbar, and Dawson Engler.KLEE: Unassisted and Automatic Generation of High-coverage Tests for Complex Systems Programs. In Pro-ceedings of the 8th USENIX Symposium on OperatingSystems Design and Implementation (OSDI), 2008.
[18] Intel Corporation. Intel 64 and IA-32 ArchitecturesSoftware Developer’s Manual.
[19] Weidong Cui, Xinyang Ge, Baris Kasikci, Ben Niu,Upamanyu Sharma, Ruoyu Wang, and Insu Yun.REPT: Reverse Debugging of Failures in DeployedSoftware. In Proceedings of the 13th USENIX Sympo-sium on Operating Systems Design and Implementation(OSDI), pages 17–32, 2018.
[20] Weidong Cui, Marcus Peinado, Sang Kil Cha, Yan-ick Fratantonio, and Vasileios P. Kemerlis. RETracer:Triaging Crashes by Reverse Execution from PartialMemory Dumps. In Proceedings of the 38th Inter-national Conference on Software Engineering (ICSE),2016.
USENIX Association 2020 USENIX Annual Technical Conference 291

[21] Brendan Dolan-Gavitt, Josh Hodosh, Patrick Hulin,Tim Leek, and Ryan Whelan. Repeatable Reverse En-gineering with PANDA. In Proceedings of the 5th Pro-gram Protection and Reverse Engineering Workshop.ACM, 2015.
[22] George W Dunlap, Samuel T King, Sukru Cinar, Mur-taza A Basrai, and Peter M Chen. ReVirt: EnablingIntrusion Analysis Through Virtual-Machine Loggingand Replay. In Proceedings of the 5th USENIX Sympo-sium on Operating Systems Design and Implementation(OSDI), 2002.
[23] George W Dunlap, Dominic G Lucchetti, Michael AFetterman, and Peter M Chen. Execution Replay ofMultiprocessor Virtual Machines. In Proceedings ofthe 4th International Conference on Virtual ExecutionEnvironments (VEE). ACM, 2008.
[24] Kirk Glerum, Kinshuman Kinshumann, Steve Green-berg, Gabriel Aul, Vince Orgovan, Greg Nichols, DavidGrant, Gretchen Loihle, and Galen Hunt. Debugging inthe (Very) Large: Ten Years of Implementation and Ex-perience. In Proceedings of the 22nd ACM Symposiumon Operating Systems Principles (SOSP), 2009.
[25] Zhenyu Guo, Xi Wang, Jian Tang, Xuezheng Liu,Zhilei Xu, Ming Wu, M Frans Kaashoek, and ZhengZhang. R2: An Application-Level Kernel for Recordand Replay. In Proceedings of the 8th USENIX SYmpo-sium on Operating Systems Design and Implementation(OSDI), 2008.
[26] Wei Jin and Alessandro Orso. BugRedux: ReproducingField Failures for In-House Debugging. In Proceedingsof the 34th International Conference on Software Engi-neering (ICSE), 2012.
[27] Baris Kasikci, Weidong Cui, Xinyang Ge, and Ben Niu.Lazy Diagnosis of In-Production Concurrency Bugs. InProceedings of the 26th ACM Symposium on OperatingSystems Principles (SOSP), 2017.
[28] Samuel T King, George W Dunlap, and Peter M Chen.Debugging Operating Systems with Time-TravelingVirtual Machines. In Proceedings of the 2005 USENIXAnnual Technical Conference (ATC), 2005.
[29] Roman Manevich, Manu Sridharan, Stephen Adams,Manuvir Das, and Zhe Yang. PSE: Explaining Pro-gram Failures via Postmortem Static Analysis. In Pro-ceedings of the 12th ACM SIGSOFT 12th InternationalSymposium on Foundations of Software Engineering(FSE), 2004.
[30] Ali Mashtizadeh, Tal Garfinkel, David Terei, DavidMazier̀es, and Mendel Rosenblum. Towards Practical
Default-On Multi-Core Record/Replay. In Proceedingsof the 22nd ACM International Conference on Architec-tural Support for Programming Languages and Oper-ating Systems (ASPLOS), 2017.
[31] Pablo Montesinos, Luis Ceze, and Josep Torrellas. De-Lorean: Recording and Deterministically ReplayingShared-Memory Multiprocessor Execution Efficiently.In Proceedings of the 35th Annual International Sym-posium on Computer Architecture (ISCA), 2008.
[32] Satish Narayanasamy, Gilles Pokam, and Brad Calder.Bugnet: Continuously Recording Program Executionfor Deterministic Replay Debugging. In Proceedingsof the 32nd International Symposium on Computer Ar-chitecture (ISCA), 2005.
[33] Robert O’Callahan, Chris Jones, Nathan Froyd, KyleHuey, Albert Noll, and Nimrod Partush. Engineer-ing Record and Replay for Deployability. In Proceed-ings of the 2017 USENIX Annual Technical Conference(ATC), 2017.
[34] Min Xu, Rastislav Bodik, and Mark D Hill. A FlightData Recorder for Enabling Full-System Multiproces-sor Deterministic Replay. In Proceedings of the 30thAnnual International Symposium on Computer Archi-tecture (ISCA). ACM, 2002.
[35] Min Xu, Vyacheslav Malyugin, Jeffrey Sheldon,Venkitachalam Weissman, Ganesh, and Boris Weiss-man. Retrace: Collecting Execution Trace with VirtualMachine Deterministic Replay. In Proceedings of the3rd Annual Workshop on Modeling, Benchmarking andSimulation (MoBS), 2007.
[36] Ding Yuan, Haohui Mai, Weiwei Xiong, Lin Tan,Yuanyuan Zhou, and Shankar Pasupathy. SherLog:Error Diagnosis by Connecting Clues from Run-TimeLogs. In Proceedings of the 15th International Confer-ence on Architectural Support for Programming Lan-guages and Operating Systems (ASPLOS), 2010.
[37] Cristian Zamfir and George Candea. Execution Synthe-sis: A Technique for Automated Debugging. In Pro-ceedings of the 5th European Conference on ComputerSystems (EuroSys), 2010.
292 2020 USENIX Annual Technical Conference USENIX Association


![Debugging with gdb · Debugging Data Race Conditions: Section 12.2 [Data Race Detection], page 171. Debugging OpenMP*: Section 12.4 [OpenMP* Debugging], page 177. Extended recording](https://img.dokumen.tips/doc/110x75/5f0b5c707e708231d4302334/debugging-with-gdb-debugging-data-race-conditions-section-122-data-race-detection.jpg)