Embed Size (px)
Citation preview

Revenues and Expenses
2004 -2016
NCAA® Revenues / Expenses Division I Report 2004 – 2016 | 2
NATIONAL COLLEGIATE ATHLETIC ASSOCIATION P.O. Box 6222
Indianapolis, Indiana 46206-6222 317-917-6222 www.ncaa.org
September 2017
Report Prepared By: Daniel L. Fulks, Ph.D., CPA, Professor Emeritus, University of Kentucky
NCAA is a trademark of the National Collegiate Athletic Association.

NCAA® Revenues / Expenses Division I Report 2004 – 2016 | 3
PREFACE AND ACKNOWLEDGMENTS This report represents the 2017 edition of Revenues and Expenses of NCAA Division I Intercollegiate Athletics Programs. Although editions before 1989 were conducted, independently of the NCAA, by Professor Mitch Raiborn of Bradley University, editions subsequent to that date have been joint efforts of the NCAA research staff and me. This edition includes data for the fiscal years 2004 through 2016. Both the format and content of the study continue to evolve. The 2016 reporting consists of eight separate segments – one for each of the three Division I subdivisions and one for all Division I men’s and women’s basketball. Important additions with this edition are separate groupings for the Autonomy schools and the Non-Autonomy schools. Separate reports for Divisions II and III will be issued later this year. The feedback we have received from readers of previous editions indicates that the operating environment and financial aspects in each division and subdivision are sufficiently different to warrant separate reports. Starting in 2008, the format for the report is significantly different from that of previous editions, and the reader is encouraged to read the introduction for explanation of these changes. Most data reported for fiscal years before 2004 are not comparable to those of subsequent years. We believe this report provides valuable insight into the financial state of affairs in intercollegiate athletics and the changing environment in which college and university athletics programs operate. As always, reader comments, inquiries, and/or suggestions are welcome and appreciated. It also is relevant to note that in spring 2004, the National Association of College and University Business Officers (NACUBO)/NCAA Task Force completed a year- long project aimed at improving the consistency of reporting and the quality of financial data related to intercollegiate athletes. This project resulted in numerous changes to our survey instrument, which were implemented with the fall 2004 data collection and are reflected in reports subsequent to that date.
I express my sincere appreciation to Kathleen McNeely, chief financial officer, and Todd Petr, managing director of research, for the NCAA, for providing me the opportunity to conduct this study and the freedom to carry it out as I saw fit. Their enthusiastic support is not only sincerely appreciated but also is vital to the continuation of this project. Very special thanks go to Nicole Hollomon, associate director of research, and to Erin Irick, assistant director of research, for their many hours of data compilation, programming and analysis. Thanks also to my fellow consultant and colleague Maria DeJulio of the NCAA research department. We also thank the representatives of the NCAA member institutions who responded to the survey at a time when demands upon athletics administrators for information are sometimes overwhelming. Confidentiality was assured and will be honored. We hope readers will find the report interesting and useful. Please direct comments or questions to me at the address below:
Daniel L. Fulks, Ph.D., CPA
Professor Emeritus, University of Kentucky
Adjunct Professor, Eastern Kentucky University
859-583-3037
NCAA® Revenues / Expenses Division I Report 2004 – 2016 | 4
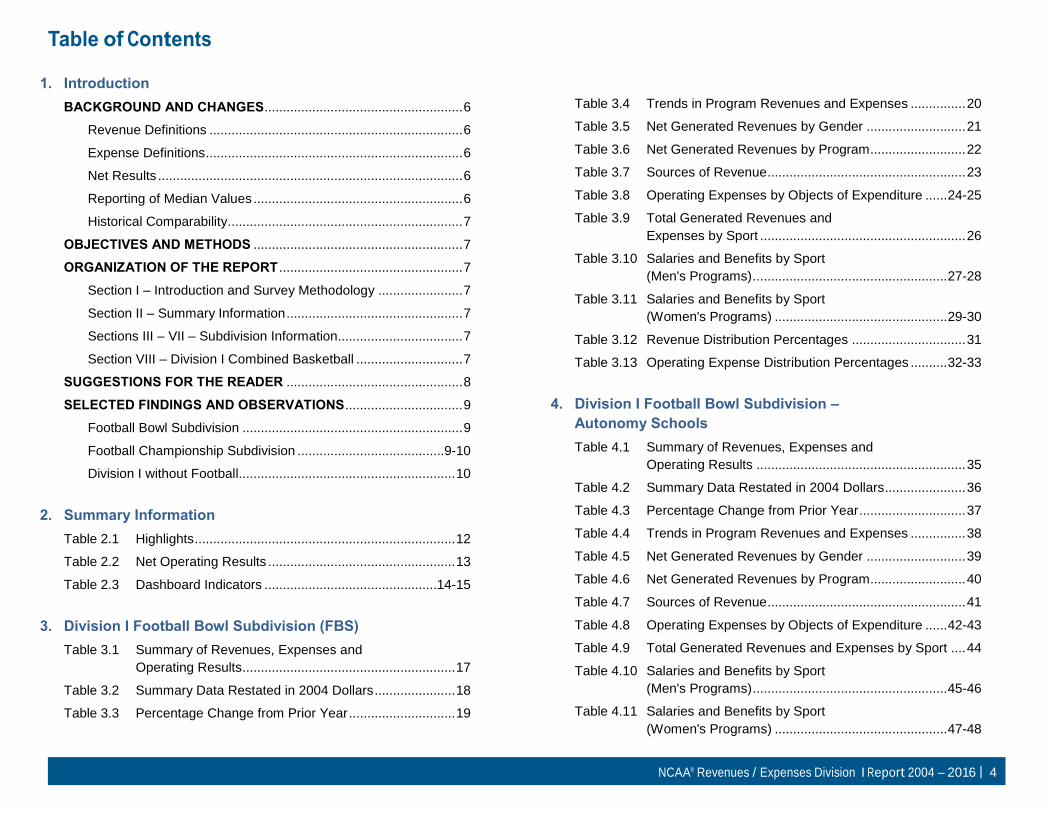
Table of Contents
1. Introduction BACKGROUND AND CHANGES ...................................................... 6
Revenue Definitions ..................................................................... 6
Expense Definitions ...................................................................... 6
Net Results ................................................................................... 6
Reporting of Median Values ......................................................... 6
Historical Comparability ................................................................ 7
OBJECTIVES AND METHODS ......................................................... 7
ORGANIZATION OF THE REPORT .................................................. 7
Section I – Introduction and Survey Methodology ....................... 7
Section II – Summary Information ................................................ 7
Sections III – VII – Subdivision Information .................................. 7
Section VIII – Division I Combined Basketball ............................. 7
SUGGESTIONS FOR THE READER ................................................ 8
SELECTED FINDINGS AND OBSERVATIONS ................................ 9
Football Bowl Subdivision ............................................................ 9
Football Championship Subdivision ........................................9-10
Division I without Football........................................................... 10
2. Summary Information
Table 2.1 Highlights ....................................................................... 12
Table 2.2 Net Operating Results ................................................... 13
Table 2.3 Dashboard Indicators ...............................................14-15
3. Division I Football Bowl Subdivision (FBS) Table 3.1 Summary of Revenues, Expenses and
Operating Results .......................................................... 17
Table 3.2 Summary Data Restated in 2004 Dollars ...................... 18
Table 3.3 Percentage Change from Prior Year ............................. 19
Table 3.4 Trends in Program Revenues and Expenses ............... 20
Table 3.5 Net Generated Revenues by Gender ........................... 21
Table 3.6 Net Generated Revenues by Program .......................... 22
Table 3.7 Sources of Revenue ...................................................... 23
Table 3.8 Operating Expenses by Objects of Expenditure ...... 24-25
Table 3.9 Total Generated Revenues and
Expenses by Sport ........................................................ 26
Table 3.10 Salaries and Benefits by Sport
(Men's Programs) ..................................................... 27-28
Table 3.11 Salaries and Benefits by Sport
(Women's Programs) ............................................... 29-30
Table 3.12 Revenue Distribution Percentages ............................... 31
Table 3.13 Operating Expense Distribution Percentages .......... 32-33
4. Division I Football Bowl Subdivision – Autonomy Schools Table 4.1 Summary of Revenues, Expenses and
Operating Results ......................................................... 35
Table 4.2 Summary Data Restated in 2004 Dollars ...................... 36
Table 4.3 Percentage Change from Prior Year ............................. 37
Table 4.4 Trends in Program Revenues and Expenses ............... 38
Table 4.5 Net Generated Revenues by Gender ........................... 39
Table 4.6 Net Generated Revenues by Program .......................... 40
Table 4.7 Sources of Revenue ...................................................... 41
Table 4.8 Operating Expenses by Objects of Expenditure ...... 42-43
Table 4.9 Total Generated Revenues and Expenses by Sport .... 44
Table 4.10 Salaries and Benefits by Sport
(Men's Programs) ..................................................... 45-46
Table 4.11 Salaries and Benefits by Sport
(Women's Programs) ............................................... 47-48
NCAA® Revenues / Expenses Division I Report 2004 – 2016 | 5
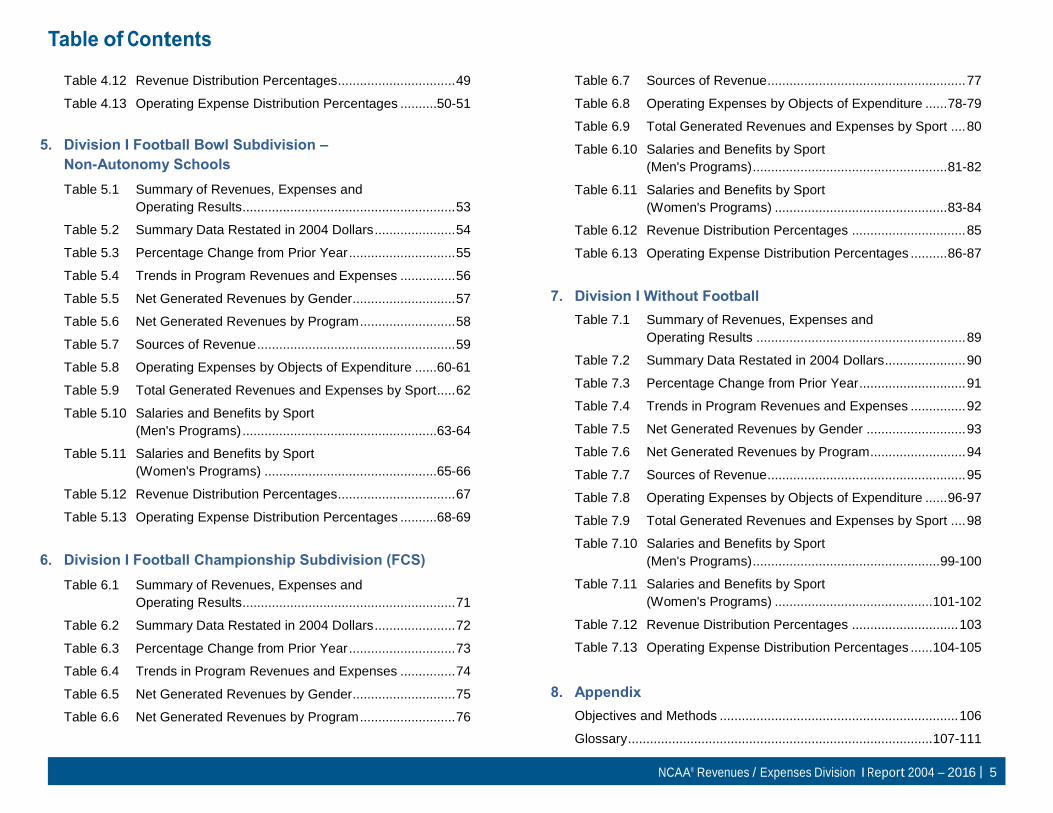
Table of Contents
Table 4.12 Revenue Distribution Percentages ................................ 49
Table 4.13 Operating Expense Distribution Percentages ..........50-51
5. Division I Football Bowl Subdivision – Non-Autonomy Schools
Table 5.1 Summary of Revenues, Expenses and
Operating Results .......................................................... 53
Table 5.2 Summary Data Restated in 2004 Dollars ...................... 54
Table 5.3 Percentage Change from Prior Year ............................. 55
Table 5.4 Trends in Program Revenues and Expenses ............... 56
Table 5.5 Net Generated Revenues by Gender............................ 57
Table 5.6 Net Generated Revenues by Program .......................... 58
Table 5.7 Sources of Revenue ...................................................... 59
Table 5.8 Operating Expenses by Objects of Expenditure ......60-61
Table 5.9 Total Generated Revenues and Expenses by Sport ..... 62
Table 5.10 Salaries and Benefits by Sport
(Men's Programs) .....................................................63-64
Table 5.11 Salaries and Benefits by Sport
(Women's Programs) ...............................................65-66
Table 5.12 Revenue Distribution Percentages ................................ 67
Table 5.13 Operating Expense Distribution Percentages ..........68-69
6. Division I Football Championship Subdivision (FCS) Table 6.1 Summary of Revenues, Expenses and
Operating Results .......................................................... 71
Table 6.2 Summary Data Restated in 2004 Dollars ...................... 72
Table 6.3 Percentage Change from Prior Year ............................. 73
Table 6.4 Trends in Program Revenues and Expenses ............... 74
Table 6.5 Net Generated Revenues by Gender............................ 75
Table 6.6 Net Generated Revenues by Program .......................... 76
Table 6.7 Sources of Revenue ...................................................... 77
Table 6.8 Operating Expenses by Objects of Expenditure ...... 78-79
Table 6.9 Total Generated Revenues and Expenses by Sport .... 80
Table 6.10 Salaries and Benefits by Sport
(Men's Programs) ..................................................... 81-82
Table 6.11 Salaries and Benefits by Sport
(Women's Programs) ............................................... 83-84
Table 6.12 Revenue Distribution Percentages ............................... 85
Table 6.13 Operating Expense Distribution Percentages .......... 86-87
7. Division I Without Football Table 7.1 Summary of Revenues, Expenses and
Operating Results ......................................................... 89
Table 7.2 Summary Data Restated in 2004 Dollars ...................... 90
Table 7.3 Percentage Change from Prior Year ............................. 91
Table 7.4 Trends in Program Revenues and Expenses ............... 92
Table 7.5 Net Generated Revenues by Gender ........................... 93
Table 7.6 Net Generated Revenues by Program .......................... 94
Table 7.7 Sources of Revenue ...................................................... 95
Table 7.8 Operating Expenses by Objects of Expenditure ...... 96-97
Table 7.9 Total Generated Revenues and Expenses by Sport .... 98
Table 7.10 Salaries and Benefits by Sport
(Men's Programs) ................................................... 99-100
Table 7.11 Salaries and Benefits by Sport
(Women's Programs) ........................................... 101-102
Table 7.12 Revenue Distribution Percentages ............................. 103
Table 7.13 Operating Expense Distribution Percentages ...... 104-105
8. Appendix
Objectives and Methods ................................................................. 106
Glossary ................................................................................... 107-111

NCAA® Revenues / Expenses Division I Report 2004 – 2016 | 6
Introduction
REVENUES AND EXPENSES OF NCAA DIVISION I INTERCOLLEGIATE ATHLETICS PROGRAMS REPORT
Fiscal Years 2004 through 2016
BACKGROUND AND CHANGES The 2008 edition of Revenues and Expenses of Intercollegiate Athletics Programs reflected significant changes in the collection, classification and reporting of data related to the financial aspects of intercollegiate athletics. The changes were in response to heightened interest in the financial area from the media, the public and NCAA leadership and were designed to render the reported information more relevant, meaningful and useful. The primary objective then and now is to isolate the financial impact of athletics on the respective educational institutions. The 2017 edition continues that effort. The current edition has been shortened from prior editions with many tables no longer presented. Readers from NCAA member institutions are encouraged to access the Institutional Performance Program (IPP) in order to see more detailed financial information. Revenue Definitions. Revenues appearing on the athletics budget are grouped as either: (1) Allocated revenues; or (2) Generated revenues. Allocated revenues are comprised of:
• Student fees directly allocated to athletics;
• Financial transfers directly from the general fund to athletics (i.e., direct institutional support);
• Indirect institutional support, such as the payment of utilities, maintenance, support salaries, etc., by the institution on behalf of athletics; and
• Direct governmental support, which is the receipt of funds from state and local governmental agencies that are designated for athletics.
Generated revenues are produced by the athletics department and include ticket sales, radio and television receipts, alumni contributions, guarantees, royalties, NCAA distributions, and other revenue sources that are not dependent upon institutional entities outside the athletics department.
Expense Definitions. Similarly, some expense items have been grouped as either: (a) Those paid by the athletics department; or (b) Those paid by outside parties. Unless guaranteed in amount by the institution, these third-party payments should not be included in determining the net financial results of the athletics operations. In addition, indirect support from the institution, such as facilities maintenance, insurance, utilities, etc., has been isolated and reported as a line item on both the revenue and the expense side. Since indirect support is excluded from generated revenues, the resulting expense item is included in the net cost to the institution. Net Results. New terminology for the net operating results of the athletics department also was introduced in the 2008 report. "Net generated revenue" results when total generated revenues exceed university-paid (or guaranteed) expenses. A "negative net generated revenue" results when university-paid (or guaranteed) expenses exceed generated revenues. These are generally recognized terms in the economics literature. Reporting of Median Values. Also, significant in the 2008 report was the change from reporting average (or mean) data to median data. The impetus for this change was the impact that unusually large (outlier) revenue items, primarily alumni and booster contributions, have had on average amounts in recent years. Moreover, for most comparative purposes, median statistics are more meaningful than are averages. Mean data are still reported in the percentile tables, and the distribution tables. The caveat is that median data also can be misleading. First, unlike average data, medians are not additive. Thus, tables including "total" values may be confusing. Second, there are many instances in the tables where subdivision median values are zero. This results when at least one-half of the responding institutions report zero or below zero values for a given line item. In such cases, the resulting median, the midpoint value, will be zero.
NCAA® Revenues / Expenses Division I Report 2004 – 2016 | 7
Historical Comparability. Because of the substantial changes in data collection and reporting, comparisons with years before 2004 are no longer meaningful. Thus, the 2004 fiscal year is a benchmark year. This 2017 edition provides summary information concerning revenues and expenses of NCAA Division I and its three subdivisions for the 2004 through 2016 fiscal year (i.e., institutions' fiscal years that ended within those respective calendar years). In addition, since this edition is the first to report data for the two FBS segments, comparisons are not possible for prior years for those groupings. The data were collected via a survey conducted in connection with data collection mandated by the federal Equity in Athletics Disclosure Act (EADA), the results of which are close to 100 percent usable response rates. The 2004 fiscal year was also the first year in which audited data were utilized, as well as the initial year for data to be submitted electronically by the respective institutions. Better quality data and more useful reporting result from these changes. It is important to note that a few changes were made to definitions in the data collection instrument which may result in some slight changes in the way data were reported. On the revenue side these included:
• Adding a category that accounts for monetary transfers from the athletics department back to the university;
• Making in-kind contributions separate from cash contributions (for purposes of consistency those categories remain combined in this report); and
• Making media rights its own category. In the past media rights had been included with NCAA and conference distributions.
Similar studies were conducted for the NCAA under the previous format since 1969, with resulting reports published under the same title periodically from 1970 through 2004. The corresponding reports have been published and are available on the NCAA website. Surveys before 1993 were conducted independently of the NCAA, by Dr. Mitchell Raiborn of Bradley University, and the data collected are not in the possession of, nor under the control, of the NCAA.
OBJECTIVES AND METHODS Please see Appendix A for Objectives and Methods of the report.
ORGANIZATION OF THE REPORT The financial information in this report is classified and presented in detail by subdivision, with men’s and women’s basketball information also provided for the entire division. The reported numbers consist almost entirely of medians and frequency distributions of means for the respective subdivisions. Partial financial data for the fiscal years 2004 through 2014 also are provided for comparative purposes. Prior years' data, although not comparative, may be found in earlier editions of the report by the same title. There are eight sections of the report: Section I – Introduction and Survey Methodology. This section provides a background for the study and its stated objectives. A description of the survey instrument is given, as well as an analysis of the number and relative proportion of respondents from the respective subdivisions. Section II – Summary Information. Summary tables are presented in this section showing median total revenue and expense data for each subdivision, as well as net generated revenues (surpluses and deficits). Tables also show average number of sports offered, average number of student-athletes, and average expense per student-athlete. These tables make it possible to see overall results and to make comparisons across subdivisions. Sections III through VII – Subdivision Information. Each of the three subdivisions is reported separately in these sections. Medians are shown for generated revenues, total revenues, total expenses, revenues and expenses by sport, revenues and expenses by gender, and net operating results. Frequency distributions are provided for each set of means. Additional data are reported for salaries and benefits. Section VIII – Division I Combined Basketball. This section presents a summary of basketball operations for all Division I institutions. Appendix A - Objectives and Methods. Appendix B - Glossary. The appendix provides definitions of terms as they are used in the survey and the report.

NCAA® Revenues / Expenses Division I Report 2004 – 2016 | 8
SUGGESTIONS FOR THE READER Several basic considerations should be weighed when using the information in this report: 1. In 2016, the NCAA made the Institutional Performance Program (IPP)
available to the membership in all three divisions. This powerful tool allows users access to a great array of financial data and also allows direct comparisons to groups of peer institutions. Because this is now available, this report focuses on higher-level analyses and overall financial trends. All member institutions are encouraged to use this report along with the IPP to best understand their own athletics financial situation.
2. An individual institution's actual results may differ greatly from that
institution's divisional median or average; no two institutions operate in identical environments or under identical circumstances. The varying sizes of institutions and their budgets, as well as the markets within which the institutions operate, may have dramatic effects on financial results. In addition, there are inherent differences in fiscal demands and resources of public institutions and those of private institutions.
3. There are significant differences across the various subdivisions. For
instance, athletics programs offering football operate in a different environment from those that do not, and the impact of the differences noted above within a subdivision are likely to be even greater when making comparisons across different subdivisions. Also noteworthy is the fact that the proportion of private versus public institutions varies by subdivision.
4. Revenues and expenses that are not specifically related to men's or
women's programs have been classified as nongender or, in some cases, administrative. Examples of such expenses would be those related to academic support centers or training facilities utilized by all student-athletes. Although it may be possible for many member institutions to allocate such revenues and expenses among male and female student-athletes, the inconsistencies among allocation methods of the institutions and lack of precision would result in misleading data. Until these inconsistencies and imprecisions are remedied, such items will be reported separately.
Throughout the report, it is hoped that the information presented in a table is clear and self-explanatory. Brief explanations of tables are provided as deemed necessary. Please refer to the Glossary in the Appendix for definitions of terms as they are used in this report. The report is available online (www.NCAA.org). Additionally, a brief video presentation regarding finances of intercollegiate athletics is available at the NCAA website.)

NCAA® Revenues / Expenses Division I Report 2004 – 2016 | 9
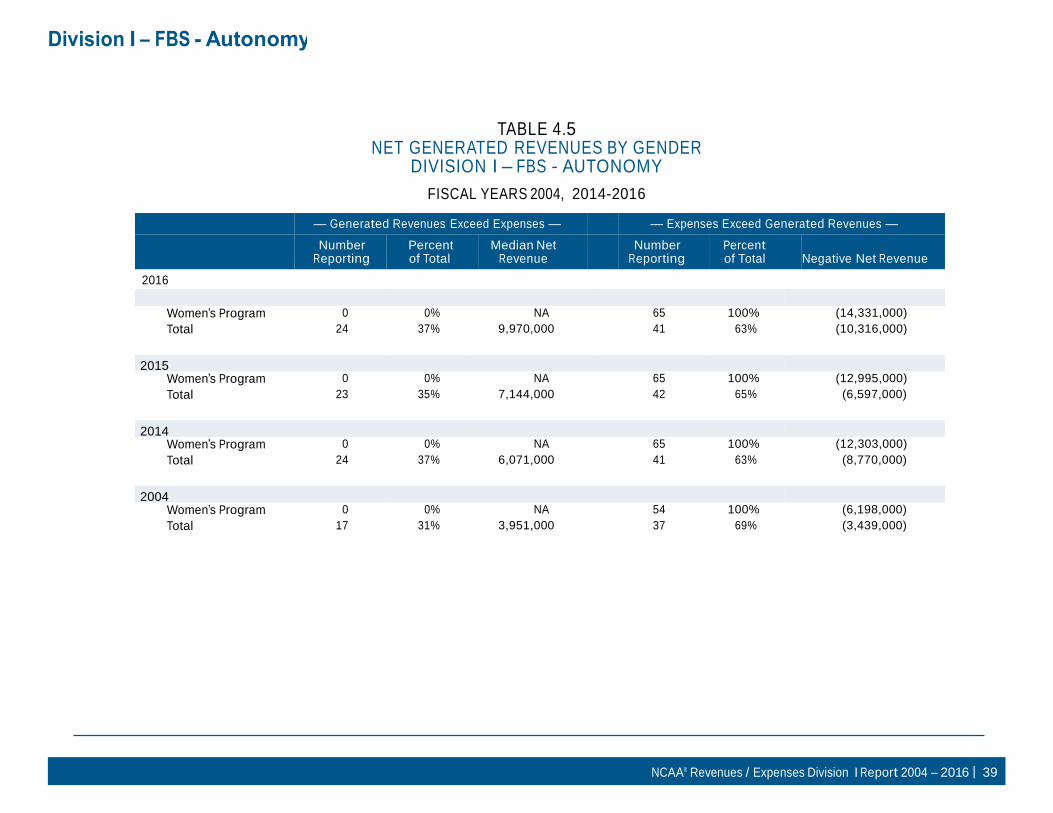
SELECTED FINDINGS AND OBSERVATIONS Following are selected findings and observations, presented by the total division, as well as sub-divisional groupings, with comparisons to the 2004 through 2015 fiscal years. Because of the significant changes in data collection and reporting, trends included in reports prior to 2004 are not included. Related table numbers are indicated in parenthesis. FOOTBALL BOWL SUBDIVISION Generated Revenues. Median generated revenues for the Autonomy Group (AG) is $94,900,000, an increase of 11 percent over 2015; for the Non-Autonomy Group (NA) the median is $13,200,000, an increase of five percent over 2015; for the total subdivision (FBS) the median is $52,800,000, an increase of 10 percent. (2.1) Total Operating Expenses. Median total expenses for the AG is $99,000,000, an increase of seven percent over 2015; for NA is $33,000,000, an increase of four percent; All FBS is $72,000,000, an increase of eight percent. (2.1) Number of Student-Athletes. No significant change in the number of student-athletes in either reporting group. (2.1) Net Generated Revenues. The median negative net generated revenue for the AG is $3,600,000 (i.e., the median loss for a program in the AG), which must be supplemented by the institution; for the NA is $19,900,000; and for all FBS is $14,400,000. (2.2) Percent of Institutional Spending. In terms of the total institutional budget, athletics expenditures represent approximately six percent of the total budget at the median. It should be noted that this percentage does not take into account the revenues generated by athletics. (2.3) Expense per Student-Athlete. The median expense per student-athlete in the AG is $79,000 per female and $181,000 per male; $44,000 per female and $77,000 per male in the NA; $63,000 and $132,000 in the FBS total. (2.3) Financial Haves and Have-nots. A total of 24 programs in the AG showed positive net generated revenues (profits), with a median of $10,000,000, while the remaining 41 of the AG lost a median of $10,000,000; the 64 NA programs lost a median of $20,000,000; the total FBS loss is a median of $18,000,000. Net losses for women's programs were $14,000,000 for AG, $6,500,000 for NA, and $9,000,000 for FBS. (3.5, 4.5, 5.5)
Generated Revenue Sources. When looking at sources of revenue, the following patterns emerged in terms of the percentage of generated revenues from various sources: AG: Ticket sales = 23%; Donor contributions = 23%; Broadcast rights = 21%; Conference/NCAA distributions = 12%. (4.7) NA: Donor contributions = 24%; Ticket sales = 19%; Conference/NCAA = 18%; Royalties/sponsorships = 12%. (5.7) All FBS: Donor contributions = 23%; Ticket sales = 22%; Broadcast rights = 19%; Conference/NCAA = 13%. (3.7) Expense Distributions. When looking at expense items, the following patterns emerged in terms of the percentage of total expense to various categories: AG: Compensation = 35%; Facility maintenance/rental = 18%; Grants-in-aid = 13%. (4.8) NA: Compensation = 33%; Grants-in-aid = 20%; Facility maintenance/rental = 11%. (5.8) All FBS: Compensation = 4%; Facility maintenance/rental = 16%; Grants-in-aid = 15%. (3.8) FOOTBALL CHAMPIONSHIP SUBDIVISION Number of Student-Athletes. There was no significant change (.5%) in the number of student-athletes. (2.1) Expense per Student-Athlete. Expense per student-athlete increased from $40,000 to $43,000. (2.3) Generated Revenue. The median generated revenues increased by nine percent (after adjusting for inflation) from $4,047,000 to $4,492,000. (6.1) Total Operating Expenses. Total operating expenses grew by five percent (after inflation) from $16,174,000 to $17,290,000. (6.1) Net Generated Revenues. The result is a median net loss for the subdivision of $12,550,000; men's programs = $5,022,000 and women's programs = $4,089,000. These medians are up only slightly from 2015. (6.1)
NCAA® Revenues / Expenses Division I Report 2004 – 2016 | 10
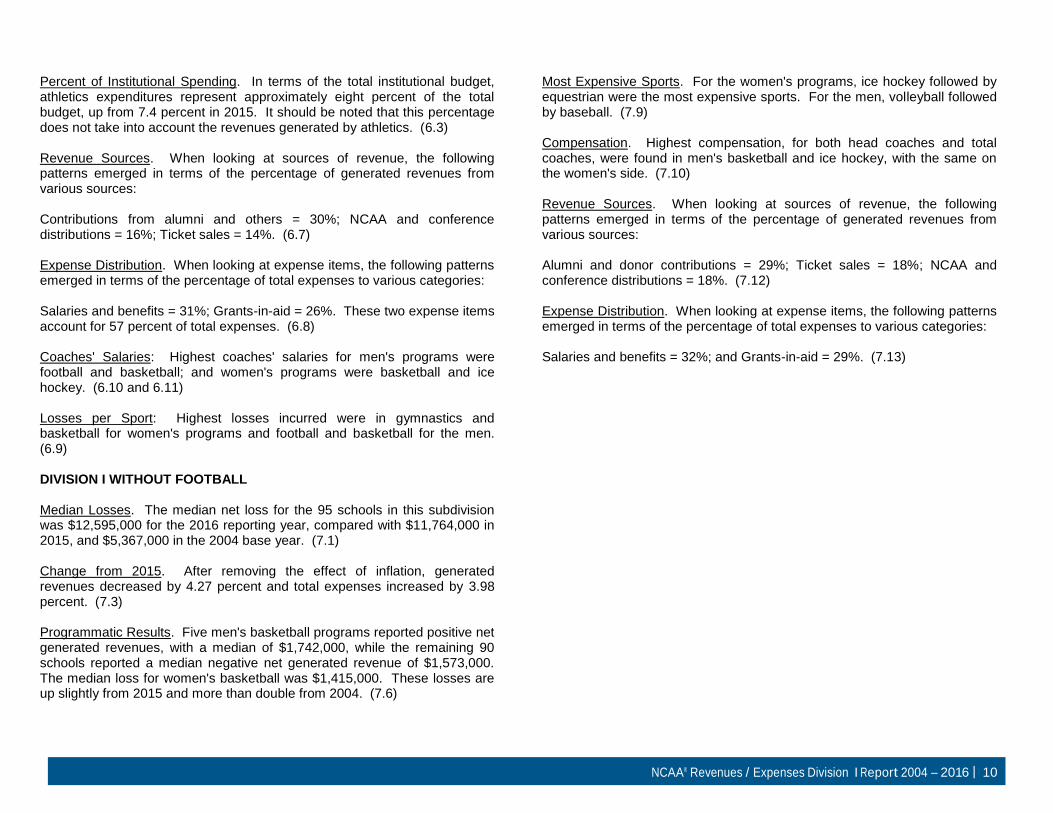
Percent of Institutional Spending. In terms of the total institutional budget, athletics expenditures represent approximately eight percent of the total budget, up from 7.4 percent in 2015. It should be noted that this percentage does not take into account the revenues generated by athletics. (6.3) Revenue Sources. When looking at sources of revenue, the following patterns emerged in terms of the percentage of generated revenues from various sources: Contributions from alumni and others = 30%; NCAA and conference distributions = 16%; Ticket sales = 14%. (6.7) Expense Distribution. When looking at expense items, the following patterns emerged in terms of the percentage of total expenses to various categories: Salaries and benefits = 31%; Grants-in-aid = 26%. These two expense items account for 57 percent of total expenses. (6.8) Coaches' Salaries: Highest coaches' salaries for men's programs were football and basketball; and women's programs were basketball and ice hockey. (6.10 and 6.11) Losses per Sport: Highest losses incurred were in gymnastics and basketball for women's programs and football and basketball for the men. (6.9) DIVISION I WITHOUT FOOTBALL Median Losses. The median net loss for the 95 schools in this subdivision was $12,595,000 for the 2016 reporting year, compared with $11,764,000 in 2015, and $5,367,000 in the 2004 base year. (7.1) Change from 2015. After removing the effect of inflation, generated revenues decreased by 4.27 percent and total expenses increased by 3.98 percent. (7.3) Programmatic Results. Five men's basketball programs reported positive net generated revenues, with a median of $1,742,000, while the remaining 90 schools reported a median negative net generated revenue of $1,573,000. The median loss for women's basketball was $1,415,000. These losses are up slightly from 2015 and more than double from 2004. (7.6)
Most Expensive Sports. For the women's programs, ice hockey followed by equestrian were the most expensive sports. For the men, volleyball followed by baseball. (7.9) Compensation. Highest compensation, for both head coaches and total coaches, were found in men's basketball and ice hockey, with the same on the women's side. (7.10) Revenue Sources. When looking at sources of revenue, the following patterns emerged in terms of the percentage of generated revenues from various sources: Alumni and donor contributions = 29%; Ticket sales = 18%; NCAA and conference distributions = 18%. (7.12) Expense Distribution. When looking at expense items, the following patterns emerged in terms of the percentage of total expenses to various categories: Salaries and benefits = 32%; and Grants-in-aid = 29%. (7.13)

NCAA® Revenues / Expenses Division I Report 2004 – 2016 | 11
SUMMARY INFORMATION

NCAA® Revenues / Expenses Division I Report 2004 – 2016 | 12
Summary Information
TABLE 2.1
HIGHLIGHTS
DIVISION I
FISCAL YEARS 2004, 2014-2016
FBS
Autonomy
Non- Autonomy
FCS
Div. I w/o Football
Median Total Revenue 2016 68,614,000 97,276,000 33,470,000 17,409,000 16,018,000
Percent change from 2015 7.8% 6.1% 5.3% 6.7% 5.1% 2015 63,659,000 91,688,000 31,771,000 16,314,000 15,243,000
Percent change from 2014 2.2% 4.6% 6.6% 6.5% 5.8% 2014 62,275,000 87,637,000 29,797,000 15,315,000 14,413,000 2004 28,214,000 44,724,000 18,175,000 7,770,000 7,281,000
Median Total Generated Revenue
2016 52,845,000 94,903,000 13,195,000 4,492,000 2,842,000
Percent change from 2015 10.2% 10.8% 5.3% 11.0% -2.5% 2015 47,962,000 85,655,000 12,526,000 4,047,000 2,915,000
Percent change from 2014 7.9% 4.9% 5.3% -2.2% 9.3%
2014 44,455,000 81,660,000 11,895,000 4,137,000 2,667,000
2004 22,864,000 40,819,000 8,557,000 2,047,000 1,469,000
Median Total Expense 2016 71,689,000 98,913,000 33,113,000 17,290,000 15,956,000
Percent change from 2015 8.1% 7.3% 3.8% 6.9% 5.9% 2015 66,295,000 92,208,000 31,910,000 16,174,000 15,066,000
Percent change from 2014 3.7% 5.6% 7.1% 6.7% 5.2% 2014 63,959,000 87,292,000 29,797,000 15,154,000 14,322,000 2004 28,991,000 43,323,000 18,622,000 7,810,000 7,147,000
Average Number of Athletes 2015 607 681 532 529 380
Percent change from 2014 -0.5% -0.7% 0.2% 0.9% 0.7% 2015 610 686 531 524 377
Percent change from 2014 -0.8% -0.5% -0.8% 0.8% 0.8% 2014 615 689 535 520 374 2004 577 638 513 492 311
Note: Participating Athletes totals represent non-duplicated count.

NCAA® Revenues / Expenses Division I Report 2004 – 2016 | 13
Summary Information
TABLE 2.2
Football Bowl Subdivision
NET OPERATING RESULTS DIVISION I MEDIAN VALUES
FISCAL YEARS 2004, 2014-2016
2004 2014 2015 2016
Total Generated Revenues 22,864,000 44,455,000 47,962,000 52,845,000
Total Expenses 28,991,000 63,959,000 66,295,000 71,689,000
Median Net Generated Revenue (5,902,000) (14,734,000) (12,868,000) (14,407,000)
Football Bowl Subdivision - Autonomy
Total Generated Revenues 40,819,000 81,660,000 85,655,000 94,903,000
Total Expenses 43,323,000 87,292,000 92,208,000 98,913,000
Median Net Generated Revenue (1,549,000) (3,433,000) (2,676,000) (3,570,000)
Football Bowl Subdivision - Non-Autonomy
Total Generated Revenues 8,557,000 11,895,000 12,526,000 13,195,000
Total Expenses 18,622,000 29,797,000 31,910,000 33,113,000
Median Net Generated Revenue (8,444,000) (18,267,000) (19,173,000) (19,893,000)
Football Championship Subdivision
Total Generated Revenues 2,047,000 4,137,000 4,047,000 4,492,000
Total Expenses 7,810,000 15,154,000 16,174,000 17,290,000
Median Net Generated Revenue (5,907,000) (11,041,000) (12,020,000) (12,550,000)
Division I without Football
Total Generated Revenues 1,469,000 2,667,000 2,915,000 2,842,000
Total Expenses 7,147,000 14,322,000 15,066,000 15,956,000
Median Net Generated Revenue (5,266,000) (11,245,000) (11,764,000) (12,595,000)

NCAA® Revenues / Expenses Division I Report 2004 – 2016 | 14
Summary Information
TABLE 2.3
15.2% 12.3% 11.0% 10.0% 15.0% 13.0% 12.0% 10.0% 14.0% 12.0% 10.0% 9.0%
63,000 116,000 123,000 132,000 79,000 152,000 169,000 181,000 44,000 71,000 73,000 77,000
DASHBOARD INDICATORS DIVISION I - MEDIAN VALUES
FISCAL YEARS 2004, 2014-2016
— FBS — — Autonomy— — Non-Autonomy —
2004 2014 2015 2016 2004 2014 2015 2016 2004 2014 2015 2016
Sponsored sport count 19 19 19 19 20 21 21 21 18 17 17 17
Athletics expenditures as percentage of total institutional budget
Generated Revenues as percentage of Total Revenues
Allocated Revenues as percentage of Total Revenues
Generated Revenues as percentage of total athletic expenditures (self–sufficiency)
4.6% 5.6% 6.1% 6.0% 5.0% 6.0% 6.0% 6.0% 5.0% 6.0% 6.0% 6.0%
79.0% 73.5% 74.6% 73.0% 94.0% 94.0% 95.0% 96.0% 51.0% 43.0% 41.0% 44.0%
21.3% 26.5% 25.4% 27.0% 6.0% 6.0% 5.0% 6.0% 49.0% 57.0% 59.0% 59.0%
76.9% 71.3% 75.6% 73.0% 96.0% 96.0% 97.0% 97.0% 50.0% 42.0% 40.0% 41.0%
Reliance on football-generated revenues 43.0% 45.0% 45.0% 45.0% 48.0% 53.0% 52.0% 53.0% 41.0% 38.0% 34.0% 35.0%
Reliance on women’s and men’s basketball revenues
15.4% 11.8% 10.9% 11.0% 17.0% 13.0% 13.0% 12.0% 14.0% 10.0% 10.0% 10.0%
Increase Gap: Athlete vs. Organization Expense . 2.3% 2.5% 3.0% . 3.0% 1.0% 3.0% . 2.0% 3.0% 4.0%
Athletic aid as percentage of total operating expenses
Total compensation as percentage of total operating expenses
Coaches’ compensation as a percentage of total operating expenses
Administrative compensation as a percentage of total operating expenses
Severance pay as a percentage of total operating expenses
Participation and game expenses as a percentage of total operating expenses
Facilities maintenance and administrative support as a percentage of total operating expenses
16.1% 16.0% 15.6% 16.0% 14.0% 13.0% 13.0% 13.0% 20.0% 22.0% 21.0% 21.0%
33.8% 35.0% 34.8% 35.0% 34.0% 36.0% 36.0% 36.0% 33.0% 33.0% 33.0% 33.0%
17.2% 18.9% 18.6% 18.0% 16.0% 19.0% 19.0% 18.0% 18.0% 19.0% 19.0% 18.0%
15.5% 15.6% 15.7% 15.0% 17.0% 16.0% 17.0% 16.0% 14.0% 13.0% 14.0% 14.0%
0.0% 0.1% 0.1% 0.0% 0.0% 0.0% 0.0% 0.0% 0.0% 0.0% 0.0% 0.0%
20.6% 19.9% 19.7% 19.0% 20.0% 19.0% 19.0% 18.0% 21.0% 21.0% 21.0% 20.0%
10.7% 14.5% 16.7% 17.0% 15.0% 17.0% 19.0% 19.0% 6.0% 12.0% 12.0% 13.0%
Miscellaneous expenses as a percentage of total operating expenses
Athletic expense per student-athlete
NCAA® Revenues / Expenses Division I Report 2004 – 2016 | 15
Summary Information
TABLE 2.3 - CONTINUED DASHBOARD INDICATORS
DIVISION I - MEDIAN VALUES
FISCAL YEARS 2004, 2014-2016
— FCS — — Div. I w/o Football —
2004 2014 2015 2016 2004 2014 2015 2016
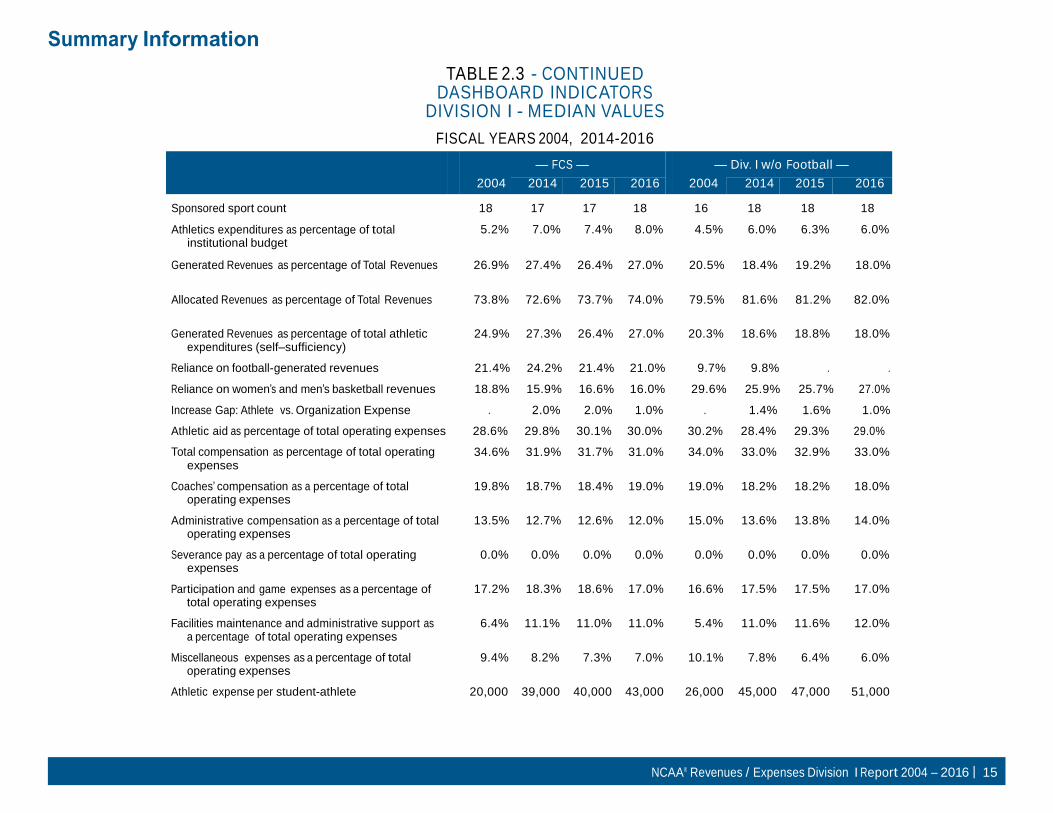
Sponsored sport count 18 17 17 18 16 18 18 18
Athletics expenditures as percentage of total institutional budget
5.2% 7.0% 7.4% 8.0% 4.5% 6.0% 6.3% 6.0%
Generated Revenues as percentage of Total Revenues 26.9% 27.4% 26.4% 27.0% 20.5% 18.4% 19.2% 18.0%
Allocated Revenues as percentage of Total Revenues 73.8% 72.6% 73.7% 74.0% 79.5% 81.6% 81.2% 82.0%
Generated Revenues as percentage of total athletic
expenditures (self–sufficiency) 24.9% 27.3% 26.4% 27.0% 20.3% 18.6% 18.8% 18.0%
Reliance on football-generated revenues 21.4% 24.2% 21.4% 21.0% 9.7% 9.8% . .
Reliance on women’s and men’s basketball revenues 18.8% 15.9% 16.6% 16.0% 29.6% 25.9% 25.7% 27.0%
Increase Gap: Athlete vs. Organization Expense . 2.0% 2.0% 1.0% . 1.4% 1.6% 1.0%
Athletic aid as percentage of total operating expenses 28.6% 29.8% 30.1% 30.0% 30.2% 28.4% 29.3% 29.0%
Total compensation as percentage of total operating expenses
Coaches’ compensation as a percentage of total operating expenses
Administrative compensation as a percentage of total operating expenses
Severance pay as a percentage of total operating expenses
Participation and game expenses as a percentage of total operating expenses
Facilities maintenance and administrative support as a percentage of total operating expenses
Miscellaneous expenses as a percentage of total operating expenses
34.6% 31.9% 31.7% 31.0% 34.0% 33.0% 32.9% 33.0%
19.8% 18.7% 18.4% 19.0% 19.0% 18.2% 18.2% 18.0%
13.5% 12.7% 12.6% 12.0% 15.0% 13.6% 13.8% 14.0%
0.0% 0.0% 0.0% 0.0% 0.0% 0.0% 0.0% 0.0%
17.2% 18.3% 18.6% 17.0% 16.6% 17.5% 17.5% 17.0%
6.4% 11.1% 11.0% 11.0% 5.4% 11.0% 11.6% 12.0%
9.4% 8.2% 7.3% 7.0% 10.1% 7.8% 6.4% 6.0%
Athletic expense per student-athlete 20,000 39,000 40,000 43,000 26,000 45,000 47,000 51,000

NCAA® Revenues / Expenses Division I Report 2004 – 2016 | 16
DIVISION I FOOTBALL BOWL SUBDIVISION
(FBS)

NCAA® Revenues / Expenses Division I Report 2004 – 2016 | 17
Division I – FBS
TABLE 3.1 SUMMARY OF REVENUES, EXPENSES AND OPERATING RESULTS
DIVISION I – FBS
FISCAL YEARS 2004, 2014-2016
Generated Revenues
Total Revenues
Total Expenses
Median Net Revenue
2016 Men’s 27,942,000 30,860,000 30,187,000 (1,792,000)
Women’s 1,302,000 3,600,000 12,157,000 (8,969,000)
Coed 12,832,000 23,982,000 21,178,000 (5,976,000)
Total 52,845,000 68,614,000 71,689,000 (14,407,000)
2015 Men’s 28,387,000 28,491,000 27,368,000 (298,000)
Women’s 1,178,000 3,079,000 10,454,000 (8,477,000)
Coed 12,494,000 23,125,000 19,398,000 (5,871,000)
Total 47,962,000 63,659,000 66,295,000 (12,868,000)
2014 Men’s 30,573,000 30,869,000 26,087,000 (539,000)
Women’s 986,000 3,539,000 10,612,000 (8,449,000)
Coed 11,453,000 20,287,000 18,648,000 (6,170,000)
Total 2004
44,455,000 62,275,000 63,959,000 (14,734,000)
Men’s 13,974,000 14,929,000 13,153,000 (42,000)
Women’s 516,000 1,591,000 5,299,000 (4,323,000)
Coed 4,145,000 9,239,000 8,941,000 (3,251,000)
Total 22,864,000 28,214,000 28,991,000 (5,902,000)
Notes: Generated Revenues represent those earned by the athletics department and do not include allocated revenues. Allocated revenues come from
outside athletics and include Direct Institutional Support, Indirect Institutional Support, Student Fees and Governmental Support.
Division I – FBS
NCAA® Revenues / Expenses Division I Report 2004 – 2016 | 18
TABLE 3.2 SUMMARY DATA RESTATED IN 2004 DOLLARS
DIVISION I – FBS MEDIAN VALUES
FISCAL YEARS 2004, 2014-2016
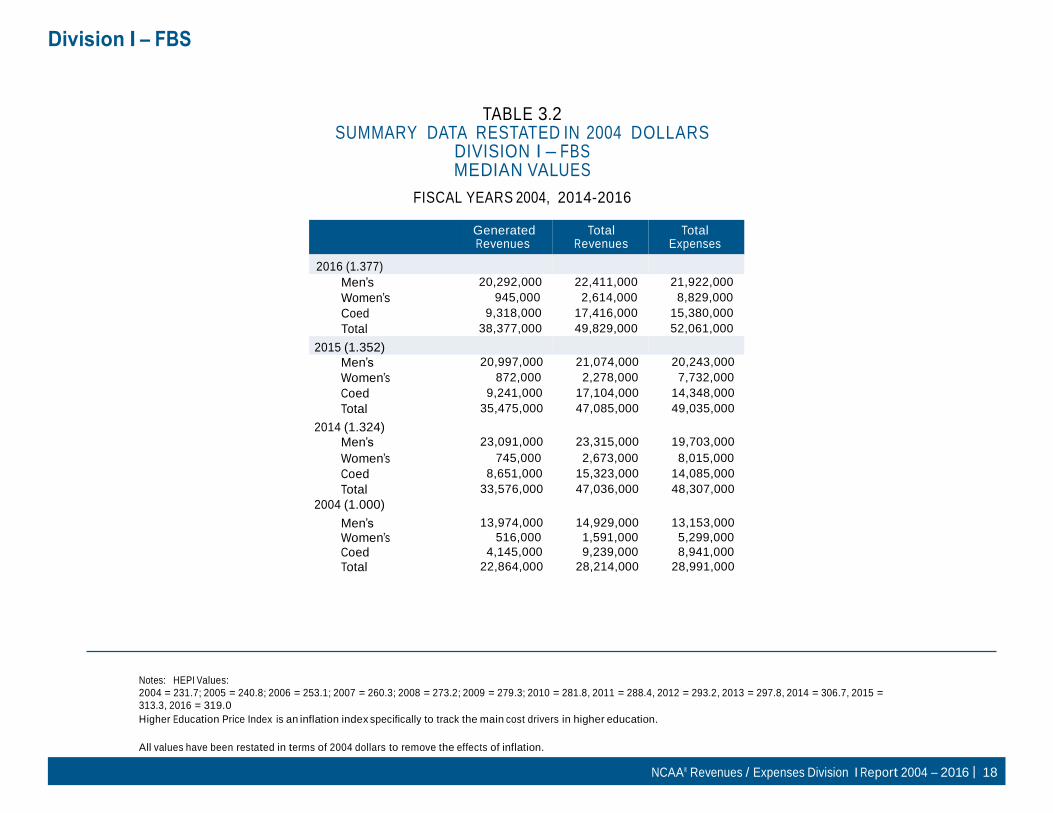
2016 (1.377)
Generated Revenues
Total Revenues
Total Expenses
Men’s 20,292,000 22,411,000 21,922,000
Women’s 945,000 2,614,000 8,829,000
Coed 9,318,000 17,416,000 15,380,000
Total 38,377,000 49,829,000 52,061,000
2015 (1.352)
Men’s 20,997,000 21,074,000 20,243,000
Women’s 872,000 2,278,000 7,732,000
Coed 9,241,000 17,104,000 14,348,000
Total 35,475,000 47,085,000 49,035,000
2014 (1.324) Men’s 23,091,000 23,315,000 19,703,000
Women’s 745,000 2,673,000 8,015,000
Coed 8,651,000 15,323,000 14,085,000
Total 33,576,000 47,036,000 48,307,000
2004 (1.000) Men’s 13,974,000 14,929,000 13,153,000
Women’s 516,000 1,591,000 5,299,000
Coed 4,145,000 9,239,000 8,941,000
Total 22,864,000 28,214,000 28,991,000
Notes: HEPI Values:
2004 = 231.7; 2005 = 240.8; 2006 = 253.1; 2007 = 260.3; 2008 = 273.2; 2009 = 279.3; 2010 = 281.8, 2011 = 288.4, 2012 = 293.2, 2013 = 297.8, 2014 = 306.7, 2015 =
313.3, 2016 = 319.0
Higher Education Price Index is an inflation index specifically to track the main cost drivers in higher education.
All values have been restated in terms of 2004 dollars to remove the effects of inflation.
Division I – FBS
NCAA® Revenues / Expenses Division I Report 2004 – 2016 | 19
2016
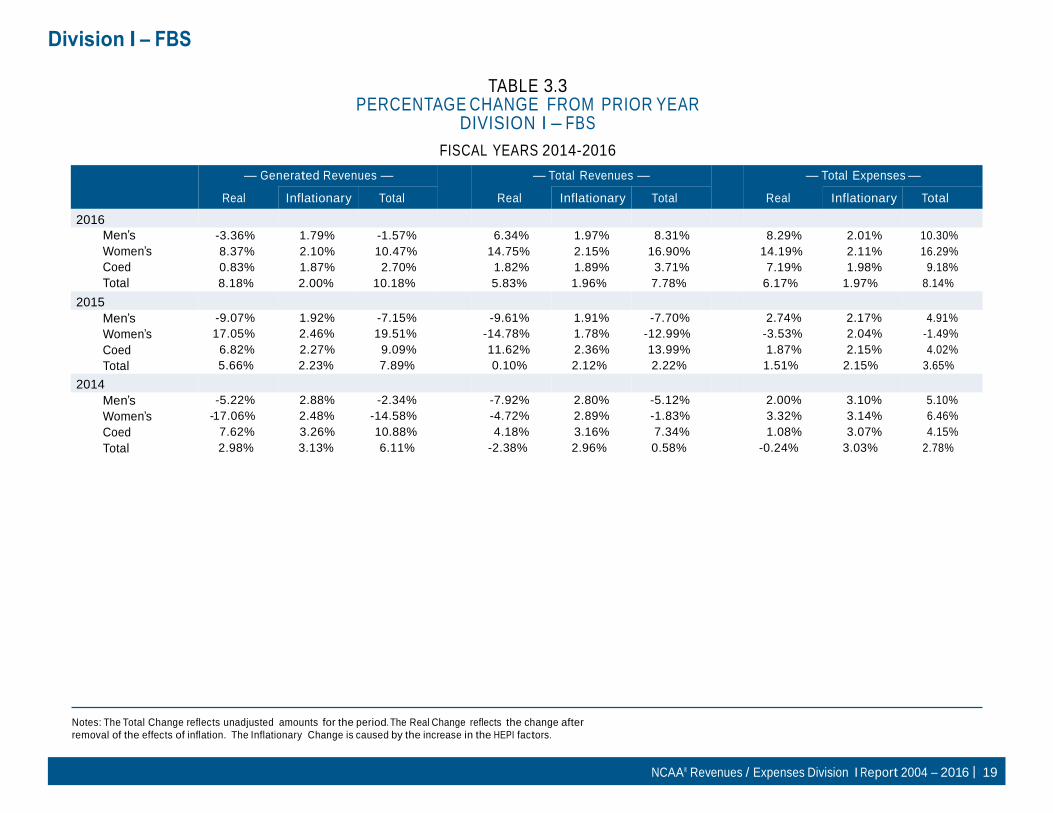
TABLE 3.3 PERCENTAGE CHANGE FROM PRIOR YEAR
DIVISION I – FBS
FISCAL YEARS 2014-2016
— Generated Revenues — — Total Revenues — — Total Expenses —
Real Inflationary Total Real Inflationary Total Real Inflationary Total
Men’s -3.36% 1.79% -1.57% 6.34% 1.97% 8.31% 8.29% 2.01% 10.30%
Women’s 8.37% 2.10% 10.47% 14.75% 2.15% 16.90% 14.19% 2.11% 16.29%
Coed 0.83% 1.87% 2.70% 1.82% 1.89% 3.71% 7.19% 1.98% 9.18%
Total 8.18% 2.00% 10.18% 5.83% 1.96% 7.78% 6.17% 1.97% 8.14%
2015
Men’s -9.07% 1.92% -7.15% -9.61% 1.91% -7.70% 2.74% 2.17% 4.91%
Women’s 17.05% 2.46% 19.51% -14.78% 1.78% -12.99% -3.53% 2.04% -1.49%
Coed 6.82% 2.27% 9.09% 11.62% 2.36% 13.99% 1.87% 2.15% 4.02%
Total 5.66% 2.23% 7.89% 0.10% 2.12% 2.22% 1.51% 2.15% 3.65%
2014
Men’s -5.22% 2.88% -2.34% -7.92% 2.80% -5.12% 2.00% 3.10% 5.10%
Women’s -17.06% 2.48% -14.58% -4.72% 2.89% -1.83% 3.32% 3.14% 6.46%
Coed 7.62% 3.26% 10.88% 4.18% 3.16% 7.34% 1.08% 3.07% 4.15%
Total 2.98% 3.13% 6.11% -2.38% 2.96% 0.58% -0.24% 3.03% 2.78%
Notes: The Total Change reflects unadjusted amounts for the period. The Real Change reflects the change after
removal of the effects of inflation. The Inflationary Change is caused by the increase in the HEPI factors.

Division I – FBS
NCAA® Revenues / Expenses Division I Report 2004 – 2016 | 20
TABLE 3.4 TRENDS IN PROGRAM REVENUES AND EXPENSES
DIVISION I – FBS
FISCAL YEARS 2004, 2014-2016
Generated Revenues Total Revenues Total Expenses
2016
Football
19,923,000
21,867,000
17,307,000 Men’s Basketball 5,902,000 6,283,000 6,147,000
Women’s Basketball 331,000 758,000 3,165,000
2015
Football
21,602,000
22,837,000
16,385,000 Men’s Basketball 5,712,000 6,102,000 5,808,000
Women’s Basketball 328,000 809,000 2,861,000
2014
Football
21,717,000
22,213,000
16,062,000 Men’s Basketball 5,753,000 6,574,000 5,744,000
Women’s Basketball 271,000 750,000 2,783,000
2004
Football
8,289,000
9,209,000
7,493,000 Men’s Basketball 3,212,000 3,212,000 2,480,000
Women’s Basketball 158,000 386,000 1,379,000
Notes: Generated Revenues represent those earned by the athletics department and do not include allocated revenues. Allocated revenues
come from outside athletics and include Direct Institutional Support, Indirect Institutional Support, Student Fees and Governmental Support.

Division I – FBS
NCAA® Revenues / Expenses Division I Report 2004 – 2016 | 21
TABLE 3.5 NET GENERATED REVENUES BY GENDER
DIVISION I – FBS
FISCAL YEARS 2004, 2014-2016
— Generated Revenues Exceed Expenses — — Expenses Exceed Generated Revenues —
2016
Number Reporting
Percent of Total
Median Net Revenue
Number Reporting
Percent of Total
Negative Net Revenue
Men’s Program 63 49% 18,383,000 66 51% (8,365,000)
Women’s Program 0 0% NA 129 100% (8,969,000)
Total 24 19% 9,970,000 105 81% (18,014,000)
2015
Men’s Program 63 49% 18,867,000 65 51% (8,422,000)
Women’s Program 0 0% NA 128 100% (8,477,000)
Total 24 19% 6,443,000 104 81% (15,558,000)
2014
Men’s Program 61 49% 16,783,000 64 51% (7,134,000)
Women’s Program 0 0% NA 125 100% (8,449,000)
Total 24 19% 6,071,000 101 81% (16,964,000)
2004 Men’s Program 58 50% 9,130,000 58 50% (3,330,000)
Women’s Program 0 0% NA 116 100% (4,323,000)
Total 18 16% 4,237,000 98 84% (7,093,000)

Division I – FBS
NCAA® Revenues / Expenses Division I Report 2004 – 2016 | 22
TABLE 3.6 NET GENERATED REVENUES BY PROGRAM
DIVISION I – FBS
FISCAL YEARS 2004, 2014-2016
— Generated Revenues Exceed Expenses — — Expenses Exceed Generated Revenues —
2016
Number Reporting
Percent of Total
Median Net Revenue
Number Reporting
Percent of Total
Negative Net Revenue
Football 70 54% 17,906,000 59 46% (4,438,000)
Men’s Basketball 61 47% 3,112,000 68 53% (1,560,000)
Women’s Basketball
2015
0 0% NA 129 100% (2,624,000)
Football 70 55% 17,465,000 58 45% (5,006,000)
Men’s Basketball 64 50% 2,753,000 64 50% (1,500,000)
Women’s Basketball
2014
0 0% NA 128 100% (2,304,000)
Football 69 55% 14,483,000 56 45% (4,214,000)
Men’s Basketball 63 50% 2,762,000 62 50% (1,339,000)
Women’s Basketball
2004
2 0% 437,000 123 98% (2,150,000)
Football 64 55% 7,512,000 52 45% (1,846,000)
Men’s Basketball 67 58% 2,151,000 49 42% (550,000)
Women’s Basketball 3 3% 1,217,000 113 97% (1,043,000)

Division I – FBS
NCAA® Revenues / Expenses Division I Report 2004 – 2016 | 23
TABLE 3.7 SOURCES OF REVENUES
DIVISION I – FBS
FISCAL YEAR 2016 – MEDIAN VALUES
Total Ticket Sales 8,937,000
NCAA and conference distributions 4,715,000
Guarantees and options 837,000
Cash contributions from alumni and others 9,155,000
Third-Party Support 0
Other:
Concessions/Programs/Novelties 1,015,000
Broadcast Rights 2,516,000
Royalties/Advertising/Sponsorship 3,995,000
Sports camps 78,000
Endowment/Investment Income 238,000
Miscellaneous 0
Total Generated Revenues 52,845,000
Allocated Revenues:
Direct Institutional Support
3,886,000
Indirect Institutional Support 263,000
Student Fees 2,257,000
Direct government support 0
Total Allocated Revenues 13,730,000
Total All Revenues 68,614,000

Division I – FBS
NCAA® Revenues / Expenses Division I Report 2004 – 2016 | 24
TABLE 3.8 OPERATING EXPENSES BY OBJEC TS OF EXPENDITURE
DIVISION I – FBS
FISCAL YEAR 2016 – MEDIAN VALUES
Grants-in-Aid
Total Total
Equipment/uniforms/supplies
Men 5,455,000
Women 4,151,000
Administrative and Non-gender 232,000
Total 10,155,000
Guarantees and Options
Men 1,123,000
Women 72,000
Administrative and Non-gender 0
Total 1,217,000
Salaries and Benefits – University paid
Men 10,922,000 Women 3,188,000
Administrative and Non-gender 7,543,000
Total 24,413,000
Salaries and Benefits – Third Party paid
Men 0
Women 0
Administrative and Non-gender 0
Total 0
Severance Pay
Men 47,000
Women 0
Administrative and Non-gender 0
Total 139,000
Team travel
Men 2,697,000
Women 1,519,000
Administrative and Non-gender 0
Total 4,542,000
Recruiting
Men 754,000
Women 322,000
Administrative and Non-gender 0
Total 1,126,000
Men 978,000
Women 394,000
Administrative and Non-gender 149,000
Total 1,711,000
Fundraising
Men 90,000
Women 15,000
Administrative and Non-gender 1,010,000
Total 1,187,000
Game Expenses
Men 1,351,000
Women 333,000
Administrative and Non-gender 140,000
Total 2,389,000
Medical
Men 21,000 Women 2,000
Administrative and Non-gender 550,000
Total 798,000
Membership Dues
Men 12,000
Women 10,000
Administrative and Non-gender 103,000
Total 155,000
Sports Camps
Men 0
Women 0
Administrative and Non-gender 0
Total 21,000
Spirit Groups
Men 0
Women 0
Administrative and Non-gender 121,000
Total 174,000
Division I – FBS
NCAA® Revenues / Expenses Division I Report 2004 – 2016 | 25
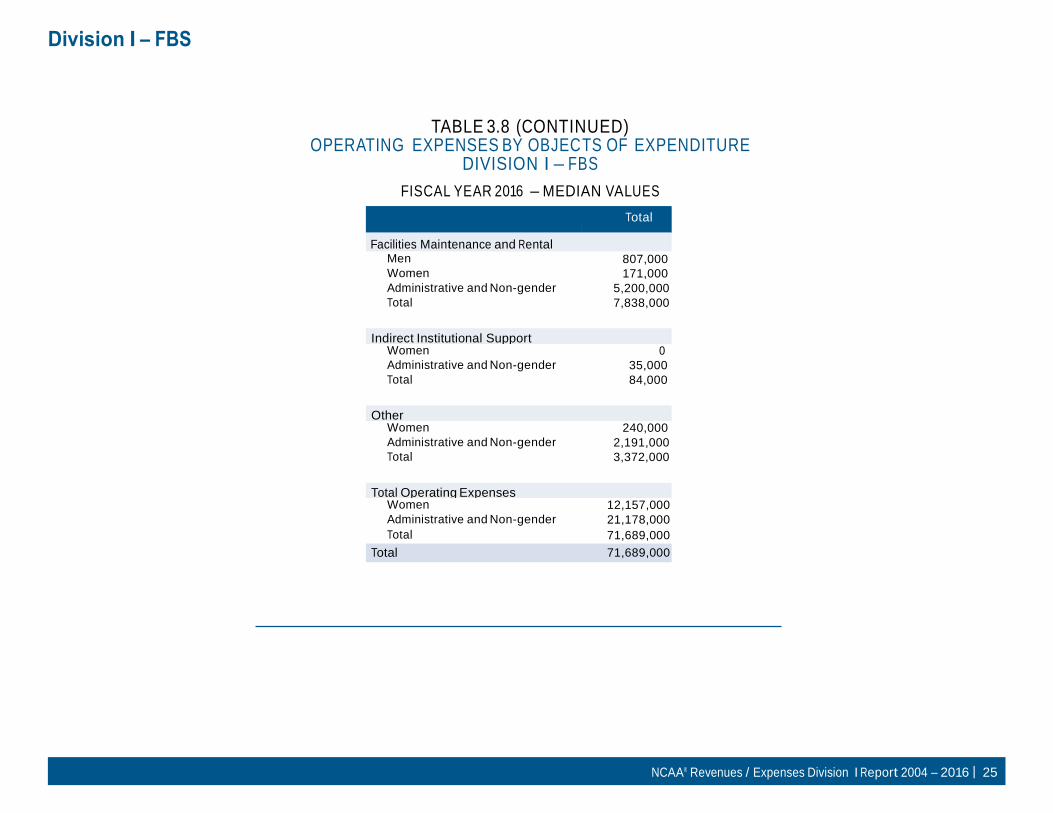
TABLE 3.8 (CONTINUED) OPERATING EXPENSES BY OBJEC TS OF EXPENDITURE
DIVISION I – FBS
FISCAL YEAR 2016 – MEDIAN VALUES
Total
Facilities Maintenance and Rental Men 807,000
Women 171,000
Administrative and Non-gender 5,200,000
Total 7,838,000
Indirect Institutional Support
Men
0 Women 0
Administrative and Non-gender 35,000
Total 84,000
Other
Men
720,000 Women 240,000
Administrative and Non-gender 2,191,000
Total 3,372,000
Total Operating Expenses
Men
30,187,000 Women 12,157,000
Administrative and Non-gender 21,178,000
Total 71,689,000
Total 71,689,000

Division I – FBS
NCAA® Revenues / Expenses Division I Report 2004 – 2016 | 26
TABLE 3.9 TOTAL GENERATED REVENUES AND EXPENSES BY SPORT
DIVISION I – FBS
FISCAL YEAR 2016 – MEDIAN VALUES
— Men’s Programs — — Women’s Programs —
Sport
# of Institutions
Sponsoring
Generated Revenues Expenses Net Revenue
# of Institutions
Sponsoring
Generated Revenues Expenses
Net Revenue
Baseball 114 447,000 1,819,000 (1,029,000) N/A N/A N/A N/A
Basketball 129 5,902,000 6,147,000 79,000 129 331,000 3,165,000 (2,321,000)
Bowling 0 0 0 0 6 50,000 50,000 (220,000)
Crew 0 0 0 0 42 118,000 1,659,000 (1,196,000)
Equestrian 0 0 0 0 11 165,000 1,829,000 (1,155,000)
Fencing 8 29,000 243,000 (199,000) 10 48,000 483,000 (213,000)
Field Hockey N/A N/A N/A N/A 28 78,000 1,193,000 (798,000)
Football 129 19,923,000 17,307,000 3,312,000 N/A N/A N/A N/A
Golf 120 109,000 599,000 (340,000) 113 79,000 597,000 (377,000)
Gymnastics 13 127,000 862,000 (712,000) 46 151,000 1,275,000 (945,000)
Ice Hockey 16 1,580,000 2,837,000 (1,028,000) 7 259,000 2,068,000 (1,650,000)
Lacrosse 14 774,000 1,672,000 (756,000) 32 122,000 1,297,000 (760,000)
Rifle 11 0 41,000 (41,000) 15 32,000 51,000 (51,000)
Rugby 0 0 0 0 1 6,000 281,000 (169,000)
Sand Volleyball 0 0 0 0 23 17,000 323,000 (134,000)
Skiing 4 41,000 587,000 (331,000) 4 39,000 579,000 (351,000)
Soccer 59 128,000 1,052,000 (625,000) 126 103,000 1,257,000 (793,000)
Softball N/A N/A N/A N/A 108 118,000 1,230,000 (795,000)
Swimming 59 91,000 1,062,000 (642,000) 90 76,000 1,159,000 (724,000)
Tennis 94 60,000 681,000 (420,000) 125 49,000 739,000 (462,000)
Track & Field/
Cross Country112 86,000 1,233,000 (697,000) 128 76,000 1,400,000 (856,000)
Water Polo 7 225,000 710,000 (337,000) 11 50,000 869,000 (572,000)
Wrestling 42 167,000 1,115,000 (580,000) 0 0 0 0
Other 13 431,000 713,000 (328,000) 10 23,000 379,000 (122,000)
Note: Revenues are reported excluding all allocated revenues. Expenses are reported excluding third-party support. Medians shown represent only those institutions
reporting some amount for revenues or expenses.
# of Institutions Sponsoring represents the N that reported financial data for each of the sports listed. These N’s do not reflect the overall sponsorship numbers.

Division I – FBS
NCAA® Revenues / Expenses Division I Report 2004 – 2016 | 27
TABLE 3.10 SALARIES AND BENEFITS BY SPORT
MEN’S PROGRAMS DIVISION I – FBS
FISCAL YEAR 2016 – MEDIAN VALUES
Head Coaches
2004 2014 2015 2016
Baseball 100,000 241,000 256,000 287,000
Basketball 530,000 1,321,000 1,376,000 1,494,000
Fencing 27,000 67,000 62,000 64,000
Football 608,000 1,915,000 1,945,000 2,278,000
Golf 73,000 128,000 128,000 131,000
Gymnastics 88,000 114,000 128,000 148,000
Ice Hockey 172,000 403,000 391,000 434,000
Lacrosse 121,000 300,000 286,000 320,000
Rifle 13,000 40,000 36,000 41,000
Skiing 36,000 53,000 65,000 63,000
Soccer 77,000 179,000 179,000 187,000
Swimming 55,000 87,000 99,000 122,000
Tennis 75,000 123,000 125,000 132,000
Assistant Coaches
2004 2014 2015 2016
Baseball 103,000 204,000 213,000 227,000
Basketball 304,000 636,000 667,000 706,000
Fencing 10,000 51,000 39,000 48,000
Football 1,192,000 2,772,000 2,721,000 3,089,000
Golf 26,000 47,000 51,000 53,000
Gymnastics 66,000 108,000 117,000 113,000
Ice Hockey 129,000 290,000 301,000 307,000
Lacrosse 92,000 204,000 191,000 205,000
Rifle 0 0 6,000 0
Skiing 27,000 56,000 60,000 62,000
Soccer 47,000 119,000 126,000 130,000
Swimming 61,000 120,000 121,000 132,000
Tennis 29,000 53,000 56,000 57,000
Track & Field/ Cross Country
52,000 91,000 90,000 103,000
Track & Field/ Cross Country
72,000 130,000 146,000 164,000
Volleyball 105,000 157,000 165,000 160,000
Water Polo 79,000 159,000 181,000 177,000
Wrestling 77,000 143,000 154,000 148,000
Other 78,000 71,000 124,000 133,000
Volleyball 60,000 144,000 146,000 147,000
Water Polo 38,000 77,000 93,000 76,000
Wrestling 65,000 149,000 154,000 150,000
Other 63,000 64,000 48,000 74,000

Division I – FBS
NCAA® Revenues / Expenses Division I Report 2004 – 2016 | 28
TABLE 3.10 (CONTINUED) SALARIES AND BENEFITS BY SPORT
MEN’S PROGRAMS DIVISION I – FBS
FISCAL YEAR 2016 – MEDIAN VALUES
Total Coaches
2004 2014 2015 2016
Administrative
2004 2014 2015 2016
Baseball 207,000 443,000 474,000 520,000 Baseball 33,000 36,000 47,000 48,000
Basketball 855,000 2,029,000 2,074,000 2,164,000 Basketball 127,000 249,000 273,000 298,000
Fencing 38,000 112,000 101,000 105,000 Fencing 8,000 0 2,000 1,000
Football 1,757,000 4,559,000 4,734,000 5,393,000 Football 345,000 710,000 728,000 811,000
Golf 80,000 172,000 180,000 185,000 Golf 9,000 0 0 0
Gymnastics 151,000 213,000 246,000 291,000 Gymnastics 8,000 0 0 0
Ice Hockey 297,000 685,000 700,000 754,000 Ice Hockey 28,000 79,000 122,000 139,000
Lacrosse 213,000 521,000 490,000 530,000 Lacrosse 26,000 30,000 43,000 49,000
Rifle 13,000 44,000 43,000 41,000 Rifle 0 0 0 0
Skiing 64,000 109,000 125,000 125,000 Skiing 8,000 0 4,000 0
Soccer 129,000 305,000 308,000 306,000 Soccer 8,000 2,000 3,000 3,000
Swimming 120,000 245,000 248,000 257,000 Swimming 16,000 2,000 7,000 9,000
Tennis 102,000 174,000 185,000 194,000 Tennis 8,000 0 3,000 1,000
Track & Field/ Cross Country
127,000 231,000 245,000 273,000 Track & Field/ Cross Country
14,000 5,000 6,000 7,000
Volleyball 178,000 303,000 315,000 315,000 Volleyball 6,000 5,000 9,000 1,000
Water Polo 116,000 240,000 277,000 250,000 Water Polo 17,000 0 0 0
Wrestling 135,000 292,000 304,000 307,000 Wrestling 12,000 5,000 4,000 8,000
Other 163,000 115,000 161,000 224,000 Other 19,000 0 11,000 0

Division I – FBS
NCAA® Revenues / Expenses Division I Report 2004 – 2016 | 29
TABLE 3.11 SALARIES AND BENEFITS BY SPORT
WOMEN’S PROGRAMS DIVISION I – FBS
FISCAL YEAR 2016 – MEDIAN VALUES
Head Coaches
2004 2014 2015 2016
Assistant Coaches
2004 2014 2015 2016
Basketball 209,000 414,000 419,000 442,000 Basketball 218,000 399,000 399,000 416,000
Bowling 59,000 56,000 61,000 53,000 Bowling 32,000 3,000 0 0
Crew 67,000 121,000 127,000 129,000 Crew 66,000 122,000 128,000 129,000
Equestrian 56,000 116,000 120,000 128,000 Equestrian 62,000 114,000 124,000 128,000
Fencing 25,000 66,000 62,000 73,000 Fencing 12,000 50,000 45,000 51,000
Field Hockey 79,000 135,000 137,000 152,000 Field Hockey 69,000 120,000 125,000 127,000
Golf 64,000 102,000 115,000 117,000 Golf 23,000 44,000 51,000 51,000
Gymnastics 81,000 142,000 149,000 161,000 Gymnastics 73,000 127,000 141,000 150,000
Ice Hockey 113,000 170,000 169,000 196,000 Ice Hockey 102,000 162,000 180,000 199,000
Lacrosse 68,000 146,000 151,000 157,000 Lacrosse 57,000 137,000 135,000 141,000
Rifle 27,000 45,000 40,000 30,000 Rifle 0 0 0 0
Rugby 0 0 64,000 80,000 Rugby 0 0 16,000 28,000
Sand Volleyball 0 47,000 47,000 72,000 Sand Volleyball 0 0 5,000 25,000
Skiing 36,000 53,000 65,000 63,000 Skiing 27,000 56,000 60,000 62,000
Soccer 78,000 138,000 147,000 161,000 Soccer 64,000 125,000 133,000 135,000
Softball 75,000 143,000 144,000 142,000 Softball 68,000 126,000 134,000 136,000
Swimming 60,000 98,000 104,000 104,000 Swimming 54,000 116,000 106,000 110,000
Tennis 62,000 109,000 111,000 114,000 Tennis 26,000 49,000 54,000 54,000
Track & Field/ Cross Country
55,000 96,000 104,000 108,000 Track & Field/ Cross Country
72,000 134,000 138,000 145,000
Triathlon 0 0 0 68,000 Triathlon 0 0 0 0
Volleyball 89,000 152,000 152,000 159,000 Volleyball 86,000 136,000 147,000 152,000
Water Polo 63,000 108,000 127,000 125,000 Water Polo 32,000 73,000 64,000 75,000
Other 26,000 69,000 65,000 76,000 Other 23,000 10,000 34,000 29,000

Division I – FBS
NCAA® Revenues / Expenses Division I Report 2004 – 2016 | 30
TABLE 3.11 (CONTINUED) SALARIES AND BENEFITS BY SPORT
WOMEN’S PROGRAMS DIVISION I – FBS
FISCAL YEAR 2016 – MEDIAN VALUES
Total Coaches
2004 2014 2015 2016
Administrative
2004 2014 2015 2016
Basketball 431,000 835,000 839,000 909,000 Basketball 83,000 148,000 170,000 194,000
Bowling 91,000 58,000 61,000 53,000 Bowling 29,000 0 0 0
Crew 140,000 247,000 253,000 263,000 Crew 23,000 25,000 31,000 39,000
Equestrian 104,000 231,000 245,000 259,000 Equestrian 40,000 59,000 79,000 89,000
Fencing 40,000 127,000 94,000 119,000 Fencing 8,000 0 2,000 1,000
Field Hockey 138,000 247,000 262,000 278,000 Field Hockey 7,000 0 0 0
Golf 77,000 150,000 161,000 164,000 Golf 5,000 0 0 0
Gymnastics 153,000 271,000 294,000 298,000 Gymnastics 12,000 4,000 8,000 7,000
Ice Hockey 215,000 334,000 348,000 373,000 Ice Hockey 35,000 56,000 61,000 54,000
Lacrosse 123,000 280,000 289,000 304,000 Lacrosse 3,000 20,000 15,000 17,000
Rifle 27,000 58,000 45,000 51,000 Rifle 17,000 0 0 0
Rugby 0 0 80,000 108,000 Rugby 0 0 0 0
Sand Volleyball 0 52,000 56,000 85,000 Sand Volleyball 0 0 0 0
Skiing 54,000 109,000 125,000 125,000 Skiing 8,000 0 4,000 0
Soccer 141,000 263,000 285,000 302,000 Soccer 7,000 6,000 5,000 5,000
Softball 152,000 274,000 273,000 283,000 Softball 8,000 8,000 14,000 11,000
Swimming 120,000 221,000 233,000 230,000 Swimming 13,000 1,000 3,000 4,000
Tennis 86,000 157,000 168,000 173,000 Tennis 5,000 1,000 0 0
Track & Field/ Cross Country
130,000 237,000 244,000 265,000 Track & Field/ Cross Country
12,000 6,000 6,000 5,000
Triathlon 0 0 0 68,000 Triathlon 0 0 0 0
Volleyball 179,000 287,000 301,000 310,000 Volleyball 11,000 14,000 14,000 22,000
Water Polo 89,000 163,000 190,000 194,000 Water Polo 15,000 0 0 0
Other 38,000 71,000 93,000 102,000 Other 17,000 0 0 0
Division I – FBS
NCAA® Revenues / Expenses Division I Report 2004 – 2016 | 31
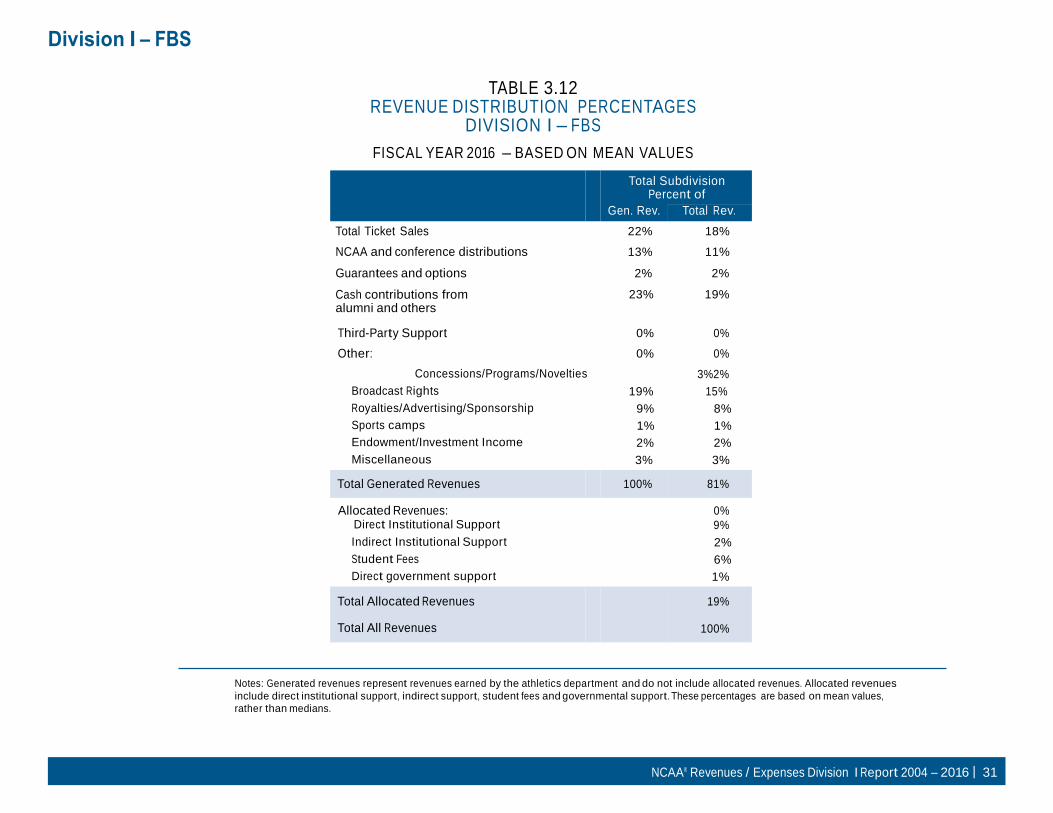
TABLE 3.12 REVENUE DISTRIBUTION PERCENTAGES
DIVISION I – FBS
FISCAL YEAR 2016 – BASED ON MEAN VALUES
Total Subdivision Percent of
Gen. Rev. Total Rev.
Total Ticket Sales 22% 18%
NCAA and conference distributions 13% 11%
Guarantees and options 2% 2%
Cash contributions from alumni and others
23% 19%
Third-Party Support 0% 0%
Other: 0% 0%
Concessions/Programs/Novelties 3%2%
Broadcast Rights 19% 15%
Royalties/Advertising/Sponsorship 9% 8%
Sports camps 1% 1%
Endowment/Investment Income 2% 2%
Miscellaneous 3% 3%
Total Generated Revenues 100% 81%
Allocated Revenues: 0% Direct Institutional Support 9%
Indirect Institutional Support 2%
Student Fees 6%
Direct government support 1%
Total Allocated Revenues 19%
Total All Revenues 100%
Notes: Generated revenues represent revenues earned by the athletics department and do not include allocated revenues. Allocated revenues
include direct institutional support, indirect support, student fees and governmental support. These percentages are based on mean values, rather than medians.

Division I – FBS
NCAA® Revenues / Expenses Division I Report 2004 – 2016 | 32
Men 0%
Women 0% 0% Administrative and Non-gender 1% 0% Total 1%
Grants-in-Aid
TABLE 3.13 OPERATING EXPENSE DISTRIBUTION PERCENTAGES
DIVISION I – FBS PERCENT OF TOTAL EXPENSES
FISCAL YEAR 2016 – BASED ON MEAN VALUES
Total
Equipment/uniforms/supplies
Total
Men 8%
Women 6%
Administrative and Non-gender 1%
Total 15%
Guarantees and Options Men 2% Women 0% Administrative and Non-gender 0% Total 2%
Salaries and Benefits – University paid
Men 16% Women 5% Administrative and Non-gender 13% Total 34%
Salaries and Benefits – Third Party paid
Men
Women
Administrative and Non-gender 0% Total 0%
Severance Pay Men 1% Women 0% Administrative and Non-gender 0% Total 1%
Team travel Men 4% Women 2% Administrative and Non-gender 0% Total 6%
Recruiting Men 1% Women 0% Administrative and Non-gender 0% Total 2%
Men 2%
Women 1%
Administrative and Non-gender 1%
Total 3%
Fundraising Men 1%
Women 0%
Administrative and Non-gender 2%
Total 3%
Game Expenses Men 3%
Women 1%
Administrative and Non-gender 1%
Total 4%
Medical
Membership Dues
Men 0%
Women 0%
Administrative and Non-gender 0%
Total 0%
Sports Camps Men 0%
Women 0%
Administrative and Non-gender 0%
Total 1%
Spirit Groups Men 0%
Women 0%
Administrative and Non-gender 0%
Total 0%
Division I – FBS
NCAA® Revenues / Expenses Division I Report 2004 – 2016 | 33
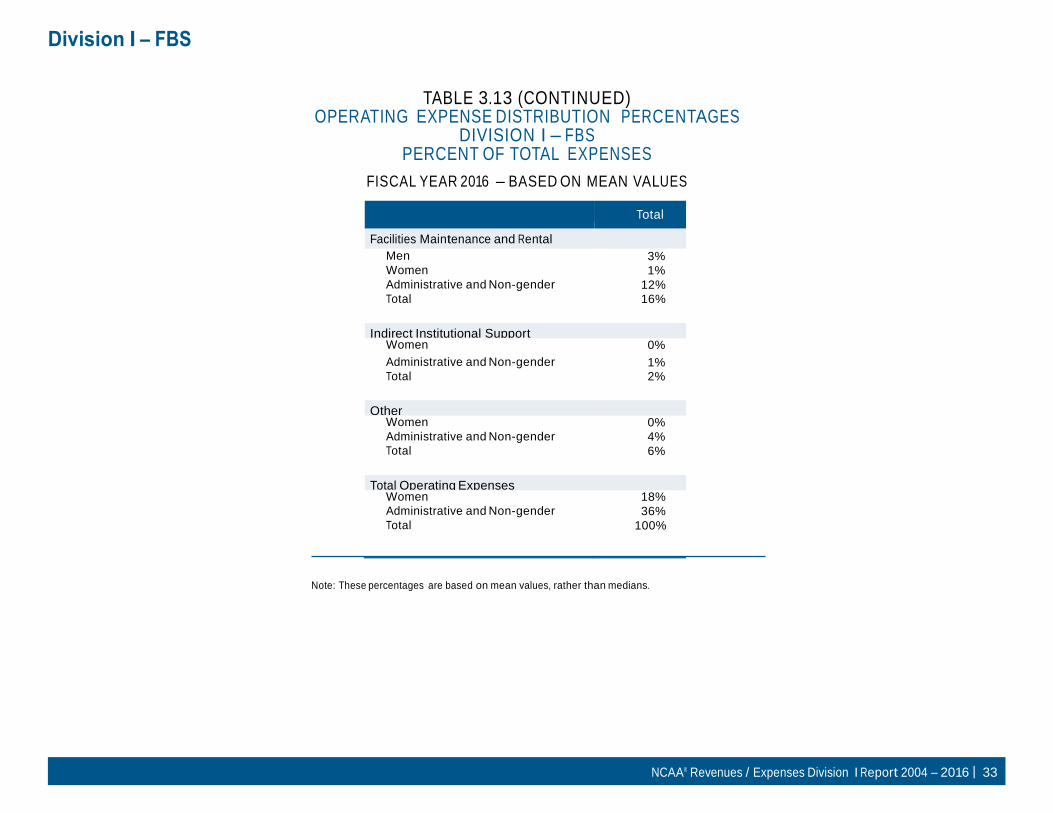
TABLE 3.13 (CONTINUED) OPERATING EXPENSE DISTRIBUTION PERCENTAGES
DIVISION I – FBS PERCENT OF TOTAL EXPENSES
FISCAL YEAR 2016 – BASED ON MEAN VALUES
Total
Facilities Maintenance and Rental Men 3% Women 1%
Administrative and Non-gender 12%
Total 16%
Indirect Institutional Support Men
0% Women 0%
Administrative and Non-gender 1% Total 2%
Other Men
2% Women 0%
Administrative and Non-gender 4%
Total 6%
Total Operating Expenses Men
45% Women 18%
Administrative and Non-gender 36%
Total 100%
Note: These percentages are based on mean values, rather than medians.

NCAA® Revenues / Expenses Division I Report 2004 – 2016 | 34
DIVISION I FOOTBALL BOWL SUBDIVISION
AUTONOMY SCHOOLS

NCAA® Revenues / Expenses Division I Report 2004 – 2016 | 35
Division I – FBS - Autonomy
TABLE 4.1 SUMMARY OF REVENUES, EXPENSES AND OPERATING RESULTS
DIVISION I – FBS - AUTONOMY
FISCAL YEARS 2004, 2014-2016
Generated
Revenues Total
Revenues Total
Expenses Median Net
Revenue
2016
Men’s 61,378,000 63,369,000 45,976,000 17,670,000
Women’s 2,472,000 3,661,000 17,674,000 (14,331,000)
Coed 25,256,000 32,568,000 38,359,000 (13,066,000)
Total 94,903,000 97,276,000 98,913,000 (3,570,000)
2015 Men’s 58,745,000 59,861,000 41,743,000 17,854,000
Women’s 2,576,000 3,499,000 15,780,000 (12,995,000)
Coed 26,250,000 29,283,000 34,727,000 (10,305,000)
Total 85,655,000 91,688,000 92,208,000 (2,676,000)
2014 Men’s 54,966,000 55,540,000 39,700,000 15,522,000
Women’s 2,520,000 3,794,000 15,272,000 (12,303,000)
Coed 18,379,000 26,096,000 33,413,000 (11,366,000)
Total
2004
81,660,000 87,637,000 87,292,000 (3,433,000)
Men’s 26,378,000 27,512,000 18,255,000 8,722,000
Women’s 1,282,000 2,038,000 7,237,000 (6,198,000)
Coed 8,395,000 10,948,000 16,972,000 (6,262,000)
Total 40,819,000 44,724,000 43,323,000 (1,549,000)
Notes: Generated Revenues represent those earned by the athletics department and do not include allocated revenues. Allocated revenues come from outside athletics and include Direct Institutional Support, Indirect Institutional Support, Student Fees and Governmental Support.

NCAA® Revenues / Expenses Division I Report 2004 – 2016 | 36
Division I – FBS - Autonomy
TABLE 4.2 SUMMARY DATA RESTATED IN 2004 DOLLARS
DIVISION I – FBS - AUTONOMY MEDIAN VALUES
FISCAL YEARS 2004, 2014-2016
2016 (1.377)
Generated Revenues
Total Revenues
Total Expenses
Men’s 44,574,000 46,020,000 33,389,000
Women’s 1,795,000 2,658,000 12,835,000
Coed 18,341,000 23,651,000 27,857,000
Total 68,920,000 70,643,000 71,832,000
2015 (1.352)
Men’s 43,451,000 44,276,000 30,875,000
Women’s 1,905,000 2,588,000 11,671,000
Coed 19,415,000 21,659,000 25,685,000
Total 63,354,000 67,817,000 68,201,000
2014 (1.324) Men’s 41,515,000 41,949,000 29,985,000
Women’s 1,903,000 2,866,000 11,535,000
Coed 13,882,000 19,710,000 25,236,000
Total 61,677,000 66,191,000 65,930,000
2004 (1.000) Men’s 26,378,000 27,512,000 18,255,000
Women’s 1,282,000 2,038,000 7,237,000
Coed 8,395,000 10,948,000 16,972,000
Total 40,819,000 44,724,000 43,323,000
Notes: HEPI Values:
2004 = 231.7; 2005 = 240.8; 2006 = 253.1; 2007 = 260.3; 2008 = 273.2; 2009 = 279.3; 2010 = 281.8, 2011 = 288.4, 2012 = 293.2, 2013 = 297.8, 2014 = 306.7, 2015 =
313.3, 2016 = 319.0
Higher Education Price Index is an inflation index specifically to track the main cost drivers in higher education.
All values have been restated in terms of 2004 dollars to remove the effects of inflation.

NCAA® Revenues / Expenses Division I Report 2004 – 2016 | 37
Division I – FBS - Autonomy
2016
TABLE 4.3 PERCENTAGE CHANGE FROM PRIOR YEAR
DIVISION I – FBS - AUTONOMY
FISCAL YEARS 2014-2016
— Generated Revenues — — Total Revenues — — Total Expenses —
Real Inflationary Total Real Inflationary Total Real Inflationary Total
Men’s 2.58% 1.79% 4.48% 3.94% 1.97% 5.86% 8.14% 2.01% 10.14%
Women’s -5.77% 2.10% -4.04% 2.70% 2.15% 4.61% 9.97% 2.11% 12.01%
Coed -5.53% 1.87% -3.79% 9.20% 1.89% 11.22% 8.46% 1.98% 10.46%
Total 8.79% 2.00% 10.80% 4.17% 1.96% 6.09% 5.32% 1.97% 7.27%
2015
Men’s 4.66% 1.92% 6.88% 5.55% 1.91% 7.78% 2.97% 2.17% 5.15%
Women’s 0.11% 2.46% 2.22% -9.70% 1.78% -7.78% 1.18% 2.04% 3.32%
Coed 39.86% 2.27% 42.82% 9.89% 2.36% 12.21% 1.78% 2.15% 3.93%
Total 2.72% 2.23% 4.89% 2.46% 2.12% 4.62% 3.44% 2.15% 5.63%
2014
Men’s 1.22% 2.88% 4.30% 1.89% 2.80% 4.98% 7.70% 3.10% 10.97%
Women’s -1.04% 2.48% 1.99% -3.57% 2.89% -0.63% 5.96% 3.14% 9.17%
Coed -0.98% 3.26% 2.02% 9.57% 3.16% 12.90% 4.87% 3.07% 8.05%
Total 5.97% 3.13% 9.18% 1.75% 2.96% 4.83% 3.74% 3.03% 6.89%
Notes: The Total Change reflects unadjusted amounts for the period. The Real Change reflects the change after removal
of the effects of inflation. The Inflationary Change is caused by the increase in the HEPI factors.

Division I – FBS - Autonomy
NCAA® Revenues / Expenses Division I Report 2004 – 2016 | 38
TABLE 4.4 TRENDS IN PROGRAM REVENUES AND EXPENSES
DIVISION I – FBS - AUTONOMY
FISCAL YEARS 2004, 2014-2016
Generated Revenues Total Revenues Total Expenses
2016
Football
45,217,000
47,472,000
26,736,000 Men’s Basketball 10,760,000 10,760,000 8,529,000
Women’s Basketball 709,000 807,000 4,019,000
2015
Football
40,380,000
42,357,000
23,828,000 Men’s Basketball 9,888,000 9,888,000 7,484,000
Women’s Basketball 678,000 862,000 3,897,000
2014
Football
35,779,000
38,530,000
23,844,000 Men’s Basketball 9,587,000 9,587,000 7,076,000
Women’s Basketball 647,000 837,000 3,531,000
2004
Football
17,468,000
17,493,000
10,248,000 Men’s Basketball 6,270,000 6,270,000 3,271,000
Women’s Basketball 404,000 463,000 1,755,000
Notes: Generated Revenues represent those earned by the athletics department and do not include allocated revenues. Allocated revenues come
from outside athletics and include Direct Institutional Support, Indirect Institutional Support, Student Fees and Governmental Support.
Division I – FBS - Autonomy
NCAA® Revenues / Expenses Division I Report 2004 – 2016 | 39
TABLE 4.5 NET GENERATED REVENUES BY GENDER
DIVISION I – FBS - AUTONOMY
FISCAL YEARS 2004, 2014-2016
— Generated Revenues Exceed Expenses — — Expenses Exceed Generated Revenues —
2016
Number Reporting
Percent of Total
Median Net Revenue
Number Reporting
Percent of Total Negative Net Revenue
Men’s Program
60
92%
18,888,000
5
8%
(4,855,000) Women’s Program 0 0% NA 65 100% (14,331,000)
Total 24 37% 9,970,000 41 63% (10,316,000)
2015
Men’s Program
59
91%
19,149,000
6
9%
(4,477,000) Women’s Program 0 0% NA 65 100% (12,995,000)
Total 23 35% 7,144,000 42 65% (6,597,000)
2014
Men’s Program
58
89%
17,327,000
7
11%
(5,958,000) Women’s Program 0 0% NA 65 100% (12,303,000)
Total 24 37% 6,071,000 41 63% (8,770,000)
2004
Men’s Program
44
81%
10,262,000
10
19%
(5,002,000) Women’s Program 0 0% NA 54 100% (6,198,000)
Total 17 31% 3,951,000 37 69% (3,439,000)
Division I – FBS - Autonomy
NCAA® Revenues / Expenses Division I Report 2004 – 2016 | 40
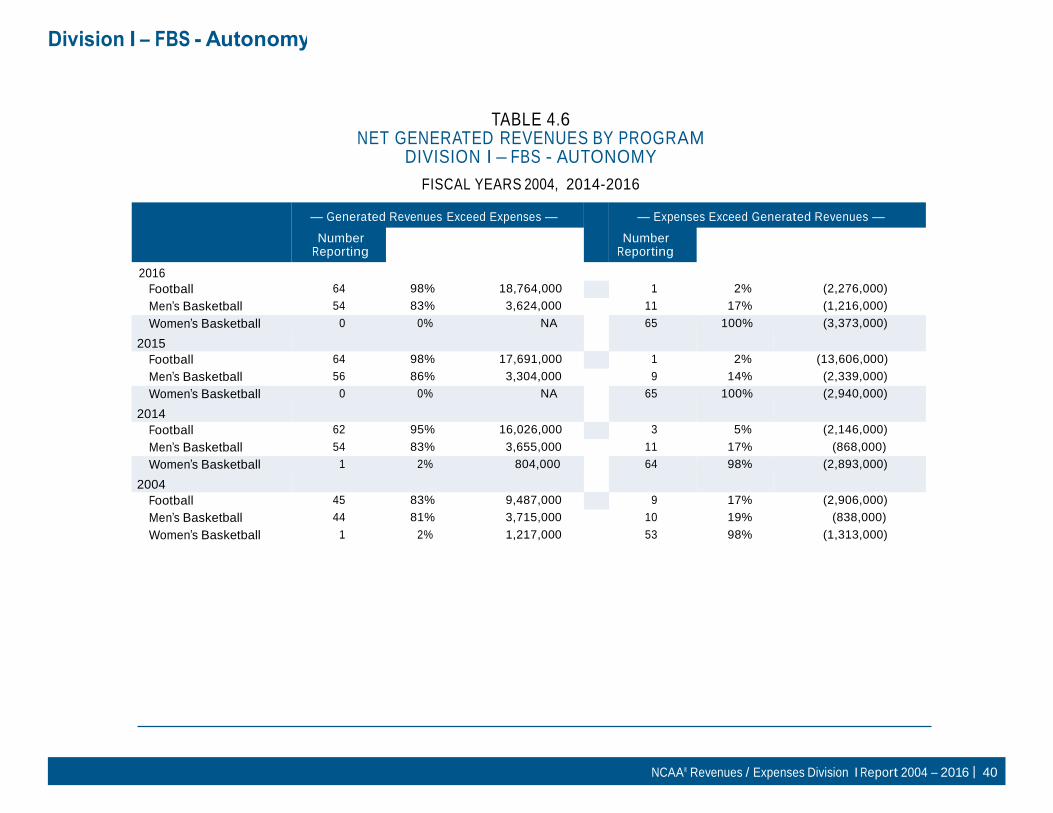
TABLE 4.6 NET GENERATED REVENUES BY PROGRAM
DIVISION I – FBS - AUTONOMY
FISCAL YEARS 2004, 2014-2016
— Generated Revenues Exceed Expenses — — Expenses Exceed Generated Revenues —
2016
Number Reporting
Percent of Total
Median Net Revenue
Number Reporting
Percent of Total Negative Net Revenue
Football 64 98% 18,764,000 1 2% (2,276,000)
Men’s Basketball 54 83% 3,624,000 11 17% (1,216,000)
Women’s Basketball
2015
0 0% NA 65 100% (3,373,000)
Football 64 98% 17,691,000 1 2% (13,606,000)
Men’s Basketball 56 86% 3,304,000 9 14% (2,339,000)
Women’s Basketball
2014
0 0% NA 65 100% (2,940,000)
Football 62 95% 16,026,000 3 5% (2,146,000)
Men’s Basketball 54 83% 3,655,000 11 17% (868,000)
Women’s Basketball
2004
1 2% 804,000 64 98% (2,893,000)
Football 45 83% 9,487,000 9 17% (2,906,000)
Men’s Basketball 44 81% 3,715,000 10 19% (838,000)
Women’s Basketball 1 2% 1,217,000 53 98% (1,313,000)

Division I – FBS - Autonomy
NCAA® Revenues / Expenses Division I Report 2004 – 2016 | 41
TABLE 4.7 SOURCES OF REVENUES
DIVISION I – FBS - AUTONOMY
FISCAL YEAR 2016 – MEDIAN VALUES
Total Ticket Sales 19,153,000
NCAA and conference distributions 11,303,000
Guarantees and options 348,000
Cash contributions from alumni and others 21,500,000
Third-Party Support 0
Other: -
Concessions/Programs/Novelties 2,042,000
Broadcast Rights 20,701,000
Royalties/Advertising/Sponsorship 8,169,000
Sports camps 135,000
Endowment/Investment Income 1,084,000
Miscellaneous 0
Total Generated Revenues 94,903,000
Allocated Revenues:
Direct Institutional Support
1,955,000
Indirect Institutional Support 0
Student Fees 372,000
Direct government support 0
Total Allocated Revenues 4,634,000
Total All Revenues 97,276,000
Division I – FBS - Autonomy
NCAA® Revenues / Expenses Division I Report 2004 – 2016 | 42
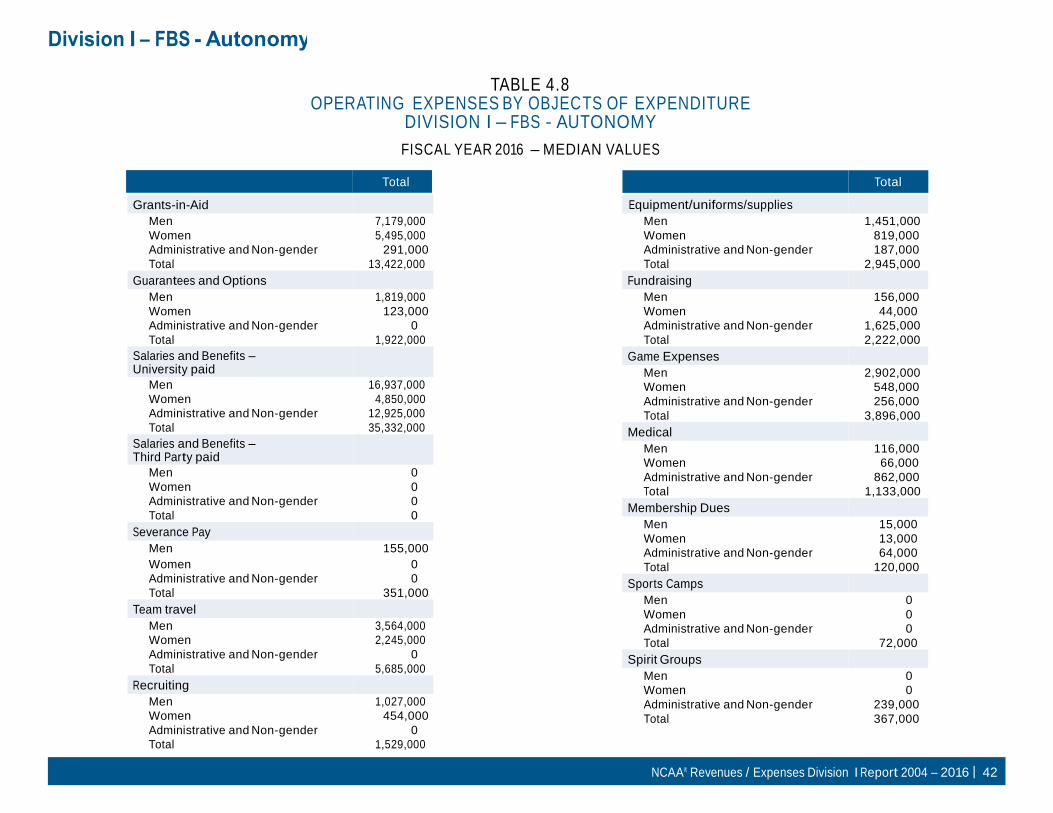
TABLE 4.8 OPERATING EXPENSES BY OBJEC TS OF EXPENDITURE
DIVISION I – FBS - AUTONOMY
FISCAL YEAR 2016 – MEDIAN VALUES
Grants-in-Aid
Total Total
Equipment/uniforms/supplies
Men 7,179,000
Women 5,495,000
Administrative and Non-gender 291,000
Total 13,422,000
Guarantees and Options
Men 1,819,000
Women 123,000
Administrative and Non-gender 0
Total 1,922,000
Salaries and Benefits – University paid
Men 16,937,000
Women 4,850,000
Administrative and Non-gender 12,925,000
Total 35,332,000
Salaries and Benefits – Third Party paid
Men 0
Women 0
Administrative and Non-gender 0
Total 0
Severance Pay
Men 155,000
Women 0
Administrative and Non-gender 0
Total 351,000
Team travel
Men 3,564,000
Women 2,245,000
Administrative and Non-gender 0
Total 5,685,000
Recruiting
Men 1,027,000
Women 454,000
Administrative and Non-gender 0
Total 1,529,000
Men 1,451,000
Women 819,000
Administrative and Non-gender 187,000
Total 2,945,000
Fundraising
Men 156,000
Women 44,000
Administrative and Non-gender 1,625,000
Total 2,222,000
Game Expenses
Men 2,902,000
Women 548,000
Administrative and Non-gender 256,000
Total 3,896,000
Medical
Men 116,000
Women 66,000
Administrative and Non-gender 862,000
Total 1,133,000
Membership Dues
Men 15,000
Women 13,000
Administrative and Non-gender 64,000
Total 120,000
Sports Camps
Men 0
Women 0
Administrative and Non-gender 0
Total 72,000
Spirit Groups
Men 0
Women 0
Administrative and Non-gender 239,000
Total 367,000

Division I – FBS - Autonomy
NCAA® Revenues / Expenses Division I Report 2004 – 2016 | 43
TABLE 4.8 (CONTINUED) OPERATING EXPENSES BY OBJEC TS OF EXPENDITURE
DIVISION I – FBS - AUTONOMY
FISCAL YEAR 2016 – MEDIAN VALUES
Total
Facilities Maintenance and Rental Men 1,954,000
Women 545,000
Administrative and Non-gender 12,443,000
Total 17,354,000
Indirect Institutional Support
Men
0 Women 0
Administrative and Non-gender 0
Total 0
Other
Men
1,526,000 Women 377,000
Administrative and Non-gender 4,511,000
Total 6,480,000
Total Operating Expenses
Men
45,976,000 Women 17,674,000
Administrative and Non-gender 38,359,000
Total 98,913,000
Total 98,913,000

Division I – FBS - Autonomy
NCAA® Revenues / Expenses Division I Report 2004 – 2016 | 44
TABLE 4.9 TOTAL GENERATED REVENUES AND EXPENSES BY SPORT
DIVISION I – FBS - AUTONOMY
FISCAL YEAR 2016 – MEDIAN VALUES
— Men’s Programs — — Women’s Programs —
Sport
# of Institutions
Sponsoring
Generated Revenues
Expenses
Net Revenue
# of Institutions
Sponsoring
Generated Revenues
Expenses
Net Revenue
Baseball 61 842,000 2,565,000 (1,457,000) N/A N/A N/A N/A
Basketball 65 10,760,000 8,529,000 2,841,000 65 709,000 4,019,000 (3,167,000)
Bowling 0 0 0 0 2 113,000 821,000 (708,000)
Crew 0 0 0 0 31 137,000 1,778,000 (1,495,000)
Equestrian 0 0 0 0 8 150,000 1,936,000 (1,481,000)
Fencing 7 27,000 256,000 (236,000) 8 48,000 519,000 (213,000)
Field Hockey N/A N/A N/A N/A 18 134,000 1,255,000 (1,049,000)
Football 65 45,217,000 26,736,000 19,025,000 N/A N/A N/A N/A
Golf 62 178,000 730,000 (565,000) 60 146,000 772,000 (580,000)
Gymnastics 10 139,000 899,000 (730,000) 33 168,000 1,494,000 (1,238,000)
Ice Hockey 9 2,749,000 3,655,000 (906,000) 6 305,000 2,218,000 (1,413,000)
Lacrosse 10 809,000 1,822,000 (836,000) 22 217,000 1,437,000 (892,000)
Rifle 4 0 71,000 (71,000) 7 32,000 90,000 (90,000)
Rugby 0 0 0 0 0 0 0 0
Sand Volleyball 0 0 0 0 13 85,000 435,000 (193,000)
Skiing 3 39,000 798,000 (438,000) 3 36,000 710,000 (399,000)
Soccer 29 285,000 1,325,000 (951,000) 63 226,000 1,688,000 (1,218,000)
Softball N/A N/A N/A N/A 55 244,000 1,586,000 (1,250,000)
Swimming 41 161,000 1,264,000 (1,004,000) 52 104,000 1,398,000 (1,088,000)
Tennis 52 109,000 827,000 (693,000) 64 77,000 949,000 (726,000)
Track & Field/ Cross Country
61 193,000 1,623,000 (1,325,000) 65 170,000 1,879,000 (1,424,000)
Triathlon 0 0 0 0 1 26,000 110,000 (84,000)
Volleyball 5 124,000 866,000 (785,000) 63 283,000 1,721,000 (1,358,000)
Water Polo 4 289,000 827,000 (539,000) 7 188,000 912,000 (781,000)
Wrestling 28 267,000 1,188,000 (791,000) 0 0 0 0
Other 7 469,000 1,516,000 (512,000) 4 68,000 1,205,000 (836,000)
Note: Revenues are reported excluding all allocated revenues. Expenses are reported excluding third-party support. Medians shown represent only those institutions
reporting some amount for revenues or expenses.
# of Institutions Sponsoring represents the N that reported financial data for each of the sports listed. These N’s do not reflect the overall sponsorship numbers.

Division I – FBS - Autonomy
NCAA® Revenues / Expenses Division I Report 2004 – 2016 | 45
TABLE 4.10 SALARIES AND BENEFITS BY SPORT
MEN’S PROGRAMS DIVISION I – FBS - AUTONOMY
FISCAL YEAR 2016 – MEDIAN VALUES
Head Coaches
2004 2014 2015 2016
Baseball 144,000 382,000 397,000 461,000
Basketball 830,000 2,123,000 2,225,000 2,623,000
Fencing 25,000 70,000 64,000 69,000
Football 1,028,000 3,050,000 3,336,000 3,529,000
Golf 90,000 161,000 163,000 168,000
Gymnastics 90,000 128,000 136,000 156,000
Ice Hockey 313,000 443,000 436,000 472,000
Lacrosse 121,000 312,000 304,000 336,000
Rifle 13,000 43,000 43,000 52,000
Skiing 36,000 54,000 72,000 69,000
Soccer 114,000 201,000 220,000 227,000
Swimming 66,000 104,000 111,000 129,000
Tennis 87,000 151,000 149,000 166,000
Assistant Coaches
2004 2014 2015 2016
Baseball 137,000 279,000 307,000 335,000
Basketball 351,000 801,000 833,000 906,000
Fencing 34,000 48,000 36,000 43,000
Football 1,457,000 3,599,000 3,851,000 4,082,000
Golf 32,000 56,000 62,000 65,000
Gymnastics 68,000 120,000 125,000 130,000
Ice Hockey 220,000 313,000 324,000 359,000
Lacrosse 92,000 223,000 208,000 219,000
Rifle 0 12,000 11,000 12,000
Skiing 52,000 76,000 81,000 85,000
Soccer 64,000 145,000 147,000 159,000
Swimming 72,000 152,000 168,000 163,000
Tennis 32,000 73,000 72,000 75,000
Track & Field/ Cross Country
70,000 118,000 122,000 132,000
Track & Field/ Cross Country
101,000 196,000 203,000 218,000
Volleyball 105,000 170,000 184,000 151,000
Water Polo 81,000 180,000 185,000 190,000
Wrestling 78,000 153,000 176,000 177,000
Other 121,000 142,000 156,000 151,000
Volleyball 58,000 146,000 147,000 167,000
Water Polo 32,000 76,000 105,000 91,000
Wrestling 84,000 159,000 175,000 186,000
Other 79,000 73,000 81,000 91,000

Division I – FBS - Autonomy
NCAA® Revenues / Expenses Division I Report 2004 – 2016 | 46
TABLE 4.10 (CONTINUED) SALARIES AND BENEFITS BY SPORT
MEN’S PROGRAMS DIVISION I – FBS - AUTONOMY
FISCAL YEAR 2016 – MEDIAN VALUES
Total Coaches
2004 2014 2015 2016
Administrative
2004 2014 2015 2016
Baseball 302,000 746,000 735,000 762,000 Baseball 40,000 85,000 96,000 93,000
Basketball 1,172,000 2,933,000 3,029,000 3,418,000 Basketball 165,000 366,000 371,000 389,000
Fencing 31,000 122,000 101,000 100,000 Fencing 8,000 0 4,000 2,000
Football 2,536,000 6,665,000 7,491,000 7,625,000 Football 473,000 1,443,000 1,498,000 1,481,000
Golf 114,000 212,000 229,000 236,000 Golf 10,000 2,000 4,000 5,000
Gymnastics 153,000 242,000 257,000 314,000 Gymnastics 8,000 2,000 5,000 6,000
Ice Hockey 506,000 761,000 739,000 882,000 Ice Hockey 121,000 188,000 156,000 179,000
Lacrosse 213,000 538,000 532,000 564,000 Lacrosse 8,000 38,000 54,000 57,000
Rifle 13,000 53,000 53,000 71,000 Rifle 0 0 0 0
Skiing 88,000 130,000 153,000 154,000 Skiing 8,000 0 0 1,000
Soccer 170,000 353,000 367,000 403,000 Soccer 8,000 11,000 10,000 14,000
Swimming 155,000 258,000 272,000 299,000 Swimming 19,000 10,000 18,000 21,000
Tennis 118,000 223,000 229,000 240,000 Tennis 10,000 7,000 11,000 6,000
Track & Field/ Cross Country
192,000 306,000 310,000 345,000 Track & Field/ Cross Country
16,000 28,000 27,000 29,000
Volleyball 163,000 316,000 331,000 317,000 Volleyball 8,000 10,000 8,000 0
Water Polo 108,000 240,000 296,000 289,000 Water Polo 17,000 0 0 0
Wrestling 170,000 318,000 350,000 380,000 Wrestling 12,000 6,000 19,000 33,000
Other 183,000 219,000 249,000 239,000 Other 19,000 13,000 22,000 35,000
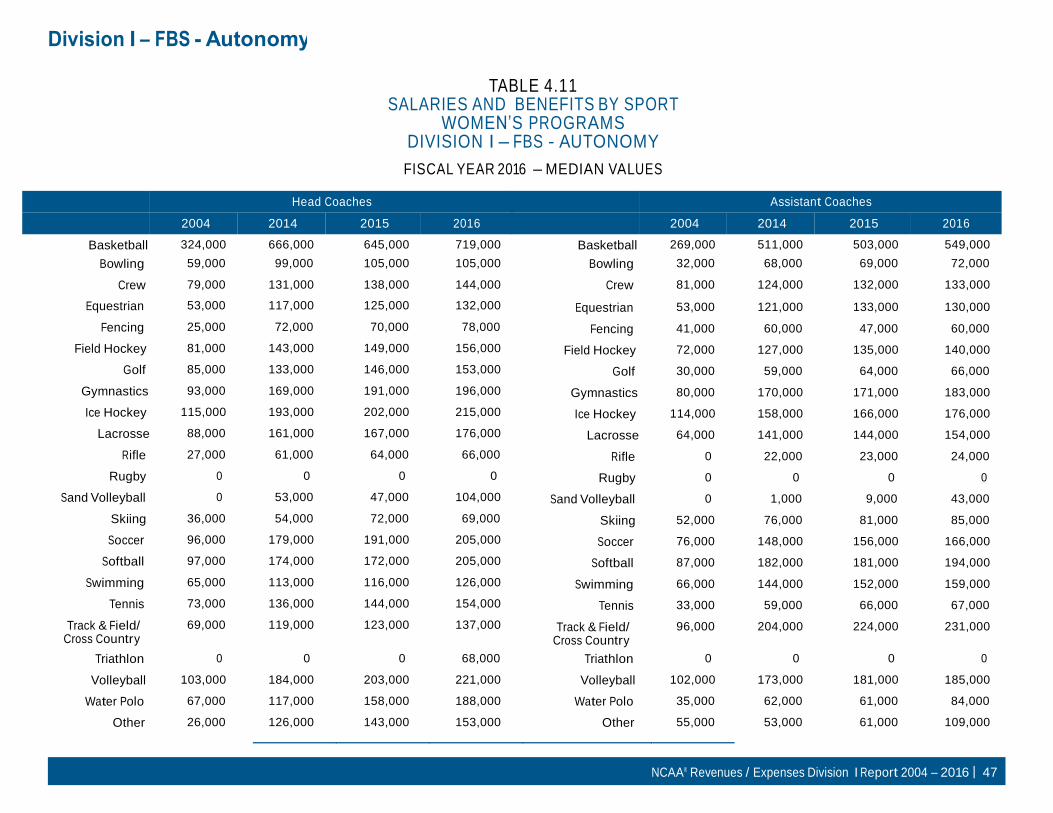
Division I – FBS - Autonomy
NCAA® Revenues / Expenses Division I Report 2004 – 2016 | 47
TABLE 4.11 SALARIES AND BENEFITS BY SPORT
WOMEN’S PROGRAMS DIVISION I – FBS - AUTONOMY
FISCAL YEAR 2016 – MEDIAN VALUES
Head Coaches
2004 2014 2015 2016
Assistant Coaches
2004 2014 2015 2016
Basketball 324,000 666,000 645,000 719,000 Basketball 269,000 511,000 503,000 549,000
Bowling 59,000 99,000 105,000 105,000 Bowling 32,000 68,000 69,000 72,000
Crew 79,000 131,000 138,000 144,000 Crew 81,000 124,000 132,000 133,000
Equestrian 53,000 117,000 125,000 132,000 Equestrian 53,000 121,000 133,000 130,000
Fencing 25,000 72,000 70,000 78,000 Fencing 41,000 60,000 47,000 60,000
Field Hockey 81,000 143,000 149,000 156,000 Field Hockey 72,000 127,000 135,000 140,000
Golf 85,000 133,000 146,000 153,000 Golf 30,000 59,000 64,000 66,000
Gymnastics 93,000 169,000 191,000 196,000 Gymnastics 80,000 170,000 171,000 183,000
Ice Hockey 115,000 193,000 202,000 215,000 Ice Hockey 114,000 158,000 166,000 176,000
Lacrosse 88,000 161,000 167,000 176,000 Lacrosse 64,000 141,000 144,000 154,000
Rifle 27,000 61,000 64,000 66,000 Rifle 0 22,000 23,000 24,000
Rugby 0 0 0 0 Rugby 0 0 0 0
Sand Volleyball 0 53,000 47,000 104,000 Sand Volleyball 0 1,000 9,000 43,000
Skiing 36,000 54,000 72,000 69,000 Skiing 52,000 76,000 81,000 85,000
Soccer 96,000 179,000 191,000 205,000 Soccer 76,000 148,000 156,000 166,000
Softball 97,000 174,000 172,000 205,000 Softball 87,000 182,000 181,000 194,000
Swimming 65,000 113,000 116,000 126,000 Swimming 66,000 144,000 152,000 159,000
Tennis 73,000 136,000 144,000 154,000 Tennis 33,000 59,000 66,000 67,000
Track & Field/ Cross Country
69,000 119,000 123,000 137,000 Track & Field/ Cross Country
96,000 204,000 224,000 231,000
Triathlon 0 0 0 68,000 Triathlon 0 0 0 0
Volleyball 103,000 184,000 203,000 221,000 Volleyball 102,000 173,000 181,000 185,000
Water Polo 67,000 117,000 158,000 188,000 Water Polo 35,000 62,000 61,000 84,000
Other 26,000 126,000 143,000 153,000 Other 55,000 53,000 61,000 109,000

Division I – FBS - Autonomy
NCAA® Revenues / Expenses Division I Report 2004 – 2016 | 48
TABLE 4.11 (CONTINUED) SALARIES AND BENEFITS BY SPORT
WOMEN’S PROGRAMS DIVISION I – FBS - AUTONOMY
FISCAL YEAR 2016 – MEDIAN VALUES
Total Coaches
2004 2014 2015 2016
Administrative
2004 2014 2015 2016
Basketball 583,000 1,113,000 1,139,000 1,229,000 Basketball 111,000 246,000 248,000 271,000
Bowling 91,000 167,000 174,000 178,000 Bowling 29,000 23,000 18,000 13,000
Crew 171,000 261,000 275,000 269,000 Crew 29,000 47,000 57,000 60,000
Equestrian 107,000 245,000 278,000 260,000 Equestrian 45,000 117,000 122,000 99,000
Fencing 73,000 135,000 123,000 145,000 Fencing 8,000 0 6,000 5,000
Field Hockey 169,000 273,000 289,000 292,000 Field Hockey 4,000 0 1,000 1,000
Golf 104,000 189,000 202,000 216,000 Golf 9,000 2,000 1,000 1,000
Gymnastics 180,000 342,000 359,000 366,000 Gymnastics 12,000 11,000 13,000 11,000
Ice Hockey 229,000 347,000 367,000 381,000 Ice Hockey 61,000 93,000 100,000 97,000
Lacrosse 156,000 293,000 310,000 335,000 Lacrosse 3,000 30,000 29,000 26,000
Rifle 27,000 81,000 87,000 90,000 Rifle 17,000 0 0 0
Rugby 0 0 0 0 Rugby 0 0 0 0
Sand Volleyball 0 61,000 63,000 135,000 Sand Volleyball 0 0 0 0
Skiing 88,000 130,000 153,000 154,000 Skiing 8,000 0 0 1,000
Soccer 173,000 331,000 355,000 372,000 Soccer 8,000 21,000 30,000 29,000
Softball 183,000 370,000 363,000 401,000 Softball 9,000 37,000 51,000 49,000
Swimming 152,000 247,000 268,000 270,000 Swimming 19,000 10,000 13,000 20,000
Tennis 106,000 199,000 209,000 220,000 Tennis 7,000 4,000 5,000 2,000
Track & Field/ Cross Country
172,000 323,000 349,000 358,000 Track & Field/ Cross Country
13,000 26,000 27,000 28,000
Triathlon 0 0 0 68,000 Triathlon 0 0 0 12,000
Volleyball 205,000 372,000 399,000 412,000 Volleyball 19,000 57,000 62,000 64,000
Water Polo 104,000 163,000 219,000 279,000 Water Polo 15,000 0 0 0
Other 48,000 180,000 228,000 262,000 Other 17,000 6,000 0 7,000

Division I – FBS - Autonomy
NCAA® Revenues / Expenses Division I Report 2004 – 2016 | 49
TABLE 4.12
REVENUE DISTRIBUTION PERCENTAGES DIVISION I – FBS - AUTONOMY
FISCAL YEAR 2016 – BASED ON MEAN VALUES
Total Subdivision Percent of
Gen. Rev. Total Rev.
Total Ticket Sales 23% 22%
NCAA and conference distributions 12% 11%
Guarantees and options 1% 1%
Cash contributions from alumni and others
23% 22%
Third-Party Support 0% 0%
Other: 0% 0%
Concessions/Programs/Novelties 3% 2%
Broadcast Rights 21% 20%
Royalties/Advertising/Sponsorship 9% 9%
Sports camps 1% 1%
Endowment/Investment Income 3% 2%
Miscellaneous 3% 3%
Total Generated Revenues
100%
93%
Allocated Revenues: 0%
Direct Institutional Support 4%
Indirect Institutional Support 1%
Student Fees 2%
Direct government support 0%
Total Allocated Revenues
7%
Total All Revenues 100%
Notes: Generated revenues represent revenues earned by the athletics department and do not include allocated revenues. Allocated revenues include direct institutional support, indirect support, student fees and governmental support. These percentages are based on mean values,
rather than medians.

Division I – FBS - Autonomy
NCAA® Revenues / Expenses Division I Report 2004 – 2016 | 50
TABLE 4.13 OPERATING EXPENSE DISTRIBUTION PERCENTAGES
DIVISION I – FBS - AUTONOMY PERCENT OF TOTAL EXPENSES
FISCAL YEAR 2016 – BASED ON MEAN VALUES
Grants-in-Aid
Total
Equipment/uniforms/supplies
Total
Men 7%
Women 6%
Administrative and Non-gender 1%
Total 13%
Guarantees and Options
Men 2%
Women 0%
Administrative and Non-gender 0%
Total 2%
Salaries and Benefits – University paid
Men 16%
Women 5%
Administrative and Non-gender 13%
Total 35%
Salaries and Benefits – Third Party paid
Men 0%
Women 0%
Administrative and Non-gender 0%
Total 0%
Severance Pay
Men 1%
Women 0%
Administrative and Non-gender 0%
Total 1%
Team travel Men 4%
Women 2%
Administrative and Non-gender 0%
Total 6%
Recruiting
Men 1%
Women 0%
Administrative and Non-gender 0%
Total 2%
Men 2%
Women 1%
Administrative and Non-gender 1%
Total 3%
Fundraising
Men 0%
Women 0%
Administrative and Non-gender 2%
Total 3%
Game Expenses Men 3%
Women 1%
Administrative and Non-gender 1%
Total 4%
Medical Men 0%
Women 0%
Administrative and Non-gender 1%
Total 1%
Membership Dues Men 0%
Women 0%
Administrative and Non-gender 0%
Total 0%
Sports Camps
Men 0%
Women 0%
Administrative and Non-gender 0%
Total 0%
Spirit Groups Men 0%
Women 0%
Administrative and Non-gender 0%
Total 0%

Division I – FBS - Autonomy
NCAA® Revenues / Expenses Division I Report 2004 – 2016 | 51
TABLE 4.13 (CONTINUED) OPERATING EXPENSE DISTRIBUTION PERCENTAGES
DIVISION I – FBS - AUTONOMY PERCENT OF TOTAL EXPENSES
FISCAL YEAR 2016 – BASED ON MEAN VALUES
Total
Facilities Maintenance and Rental Men 4%
Women 1%
Administrative and Non-gender 13%
Total 18%
Indirect Institutional Support Men
0% Women 0%
Administrative and Non-gender 1%
Total 1%
Other Men
2% Women 1%
Administrative and Non-gender 4%
Total 6%
Total Operating Expenses Men
45% Women 17%
Administrative and Non-gender 38%
Total 100%
Note: These percentages are based on mean values, rather than medians.
NCAA® Revenues / Expenses Division I Report 2004 – 2016 | 52
DIVISION I FOOTBALL BOWL SUBDIVISION NON-AUTONOMY SCHOOLS

NCAA® Revenues / Expenses Division I Report 2004 – 2016 | 53
Division I – FBS - Non-Autonomy
TABLE 5.1 SUMMARY OF REVENUES, EXPENSES AND OPERATING RESULTS
DIVISION I – FBS - NON-AUTONOMY
FISCAL YEARS 2004, 2014-2016
Generated
Revenues Total
Revenues Total
Expenses Median Net
Revenue
2016
Men’s 7,059,000 12,806,000 15,405,000 (8,505,000)
Women’s 572,000 3,557,000 7,118,000 (6,545,000)
Coed 6,168,000 18,881,000 11,072,000 (4,352,000)
Total 13,195,000 33,470,000 33,113,000 (19,893,000)
2015 Men’s 6,362,000 11,904,000 14,190,000 (8,374,000)
Women’s 513,000 2,900,000 6,742,000 (6,204,000)
Coed 5,843,000 18,283,000 11,098,000 (4,183,000)
Total 12,526,000 31,771,000 31,910,000 (19,173,000)
2014 Men’s 5,986,000 11,072,000 13,827,000 (7,150,000)
Women’s 499,000 3,084,000 6,458,000 (5,943,000)
Coed 4,725,000 15,940,000 9,948,000 (4,394,000)
Total
2004
11,895,000 29,874,000 29,797,000 (18,267,000)
Men’s 5,591,000 7,501,000 8,220,000 (2,240,000)
Women’s 350,000 1,326,000 3,824,000 (3,256,000)
Coed 2,372,000 7,814,000 5,380,000 (2,827,000)
Total 8,557,000 18,175,000 18,622,000 (8,444,000)
Notes: Generated Revenues represent those earned by the athletics department and do not include allocated revenues. Allocated revenues come from
outside athletics and include Direct Institutional Support, Indirect Institutional Support, Student Fees and Governmental Support.
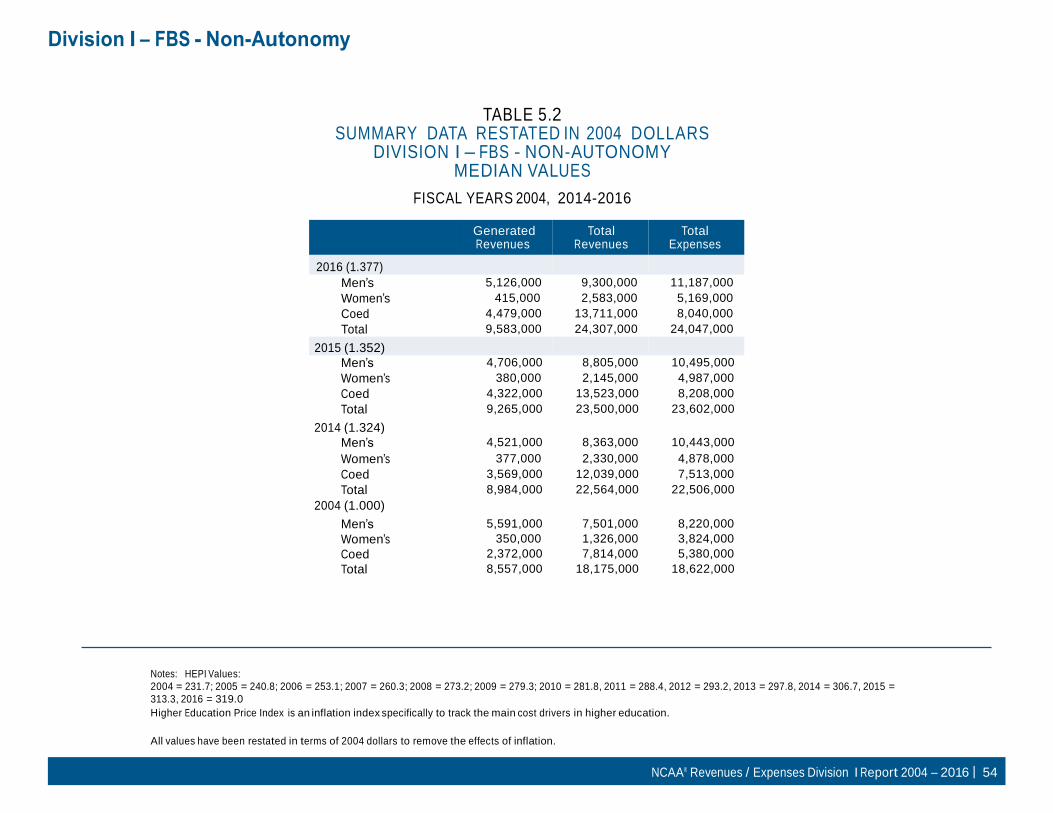
NCAA® Revenues / Expenses Division I Report 2004 – 2016 | 54
Division I – FBS - Non-Autonomy
TABLE 5.2 SUMMARY DATA RESTATED IN 2004 DOLLARS
DIVISION I – FBS - NON-AUTONOMY MEDIAN VALUES
FISCAL YEARS 2004, 2014-2016
2016 (1.377)
Generated Revenues
Total Revenues
Total Expenses
Men’s 5,126,000 9,300,000 11,187,000
Women’s 415,000 2,583,000 5,169,000
Coed 4,479,000 13,711,000 8,040,000
Total 9,583,000 24,307,000 24,047,000
2015 (1.352)
Men’s 4,706,000 8,805,000 10,495,000
Women’s 380,000 2,145,000 4,987,000
Coed 4,322,000 13,523,000 8,208,000
Total 9,265,000 23,500,000 23,602,000
2014 (1.324) Men’s 4,521,000 8,363,000 10,443,000
Women’s 377,000 2,330,000 4,878,000
Coed 3,569,000 12,039,000 7,513,000
Total 8,984,000 22,564,000 22,506,000
2004 (1.000) Men’s 5,591,000 7,501,000 8,220,000
Women’s 350,000 1,326,000 3,824,000
Coed 2,372,000 7,814,000 5,380,000
Total 8,557,000 18,175,000 18,622,000
Notes: HEPI Values:
2004 = 231.7; 2005 = 240.8; 2006 = 253.1; 2007 = 260.3; 2008 = 273.2; 2009 = 279.3; 2010 = 281.8, 2011 = 288.4, 2012 = 293.2, 2013 = 297.8, 2014 = 306.7, 2015 =
313.3, 2016 = 319.0
Higher Education Price Index is an inflation index specifically to track the main cost drivers in higher education.
All values have been restated in terms of 2004 dollars to remove the effects of inflation.
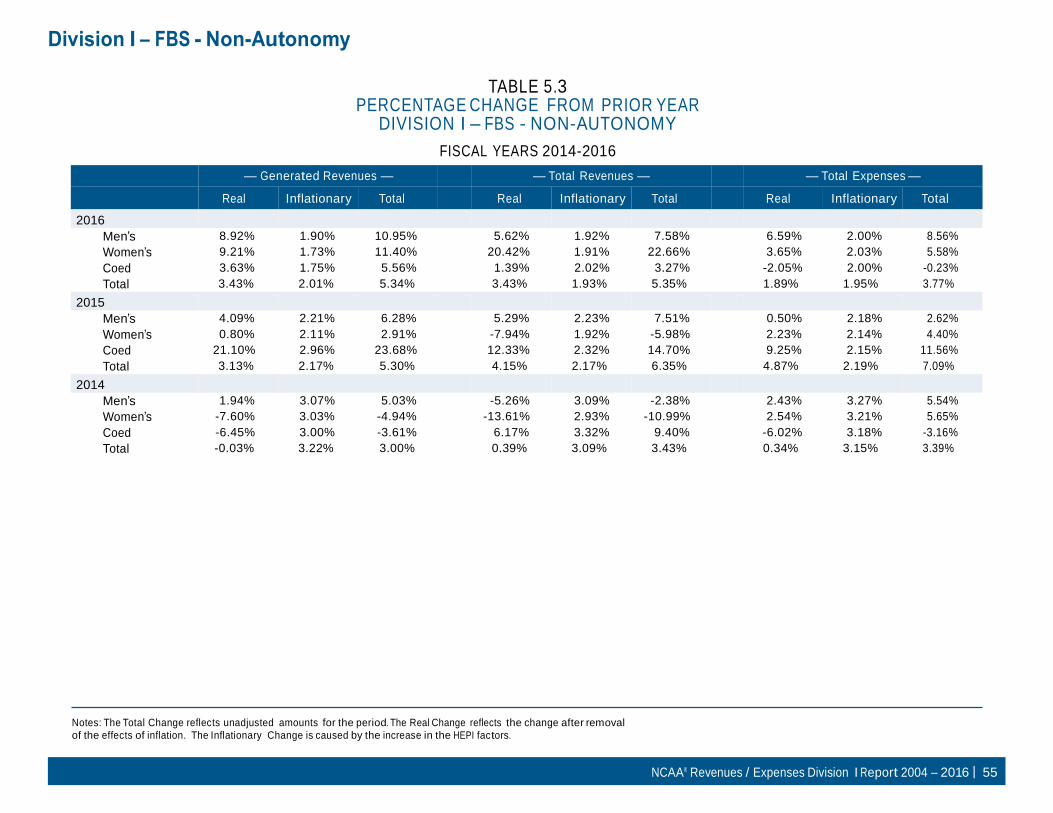
NCAA® Revenues / Expenses Division I Report 2004 – 2016 | 55
Division I – FBS - Non-Autonomy
2016
TABLE 5.3 PERCENTAGE CHANGE FROM PRIOR YEAR
DIVISION I – FBS - NON-AUTONOMY
FISCAL YEARS 2014-2016
— Generated Revenues — — Total Revenues — — Total Expenses —
Real Inflationary Total Real Inflationary Total Real Inflationary Total
Men’s 8.92% 1.90% 10.95% 5.62% 1.92% 7.58% 6.59% 2.00% 8.56%
Women’s 9.21% 1.73% 11.40% 20.42% 1.91% 22.66% 3.65% 2.03% 5.58%
Coed 3.63% 1.75% 5.56% 1.39% 2.02% 3.27% -2.05% 2.00% -0.23%
Total 3.43% 2.01% 5.34% 3.43% 1.93% 5.35% 1.89% 1.95% 3.77%
2015
Men’s 4.09% 2.21% 6.28% 5.29% 2.23% 7.51% 0.50% 2.18% 2.62%
Women’s 0.80% 2.11% 2.91% -7.94% 1.92% -5.98% 2.23% 2.14% 4.40%
Coed 21.10% 2.96% 23.68% 12.33% 2.32% 14.70% 9.25% 2.15% 11.56%
Total 3.13% 2.17% 5.30% 4.15% 2.17% 6.35% 4.87% 2.19% 7.09%
2014
Men’s 1.94% 3.07% 5.03% -5.26% 3.09% -2.38% 2.43% 3.27% 5.54%
Women’s -7.60% 3.03% -4.94% -13.61% 2.93% -10.99% 2.54% 3.21% 5.65%
Coed -6.45% 3.00% -3.61% 6.17% 3.32% 9.40% -6.02% 3.18% -3.16%
Total -0.03% 3.22% 3.00% 0.39% 3.09% 3.43% 0.34% 3.15% 3.39%
Notes: The Total Change reflects unadjusted amounts for the period. The Real Change reflects the change after removal
of the effects of inflation. The Inflationary Change is caused by the increase in the HEPI factors.

NCAA® Revenues / Expenses Division I Report 2004 – 2016 | 56
Division I – FBS - Non-Autonomy
TABLE 5.4 TRENDS IN PROGRAM REVENUES AND EXPENSES
DIVISION I – FBS - NON-AUTONOMY
FISCAL YEARS 2004, 2014-2016
Generated Revenues Total Revenues Total Expenses
2016
Football
5,113,843
7,867,323
9,297,978 Men’s Basketball 1,050,110 2,181,383 2,777,006
Women’s Basketball 171,468 709,208 1,706,811
2015
Football
4,720,881
7,271,745
8,097,331 Men’s Basketball 1,116,993 1,942,983 2,567,603
Women’s Basketball 115,911 685,048 1,611,396
2014
Football
4,373,444
6,857,297
8,101,296 Men’s Basketball 987,288 1,957,081 2,506,033
Women’s Basketball 108,183 632,498 1,499,785
2004
Football
3,367,000
4,736,000
5,054,000 Men’s Basketball 976,000 1,279,000 1,362,000
Women’s Basketball 109,000 300,000 860,000
Notes: Generated Revenues represent those earned by the athletics department and do not include allocated revenues. Allocated revenues come
from outside athletics and include Direct Institutional Support, Indirect Institutional Support, Student Fees and Governmental Support.

NCAA® Revenues / Expenses Division I Report 2004 – 2016 | 57
Division I – FBS - Non-Autonomy
TABLE 5.5 NET GENERATED REVENUES BY GENDER
DIVISION I – FBS - NON-AUTONOMY
FISCAL YEARS 2004, 2014-2016
— Generated Revenues Exceed Expenses — — Expenses Exceed Generated Revenues —
2016
Number Reporting
Percent of Total
Median Net Revenue
Number Reporting
Percent of Total Negative Net Revenue
Men’s Program
3
5%
3,831,000
61
95%
(8,714,000) Women’s Program 0 0% NA 64 100% (6,545,000)
Total 0 0% NA 64 100% (19,893,000)
2015
Men’s Program
4
6%
2,710,000
59
94%
(8,447,000) Women’s Program 0 0% NA 63 100% (6,204,000)
Total 1 2% 4,308,000 62 98% (19,317,000)
2014
Men’s Program
3
5%
3,510,000
57
95%
(7,297,000) Women’s Program 0 0% NA 60 100% (5,943,000)
Total 0 0% NA 60 100% (18,267,000)
2004
Men’s Program
14
23%
4,090,000
48
77%
(3,093,000) Women’s Program 0 0% NA 62 100% (3,256,000)
Total 1 2% 11,921,000 61 98% (8,506,000)

NCAA® Revenues / Expenses Division I Report 2004 – 2016 | 58
Division I – FBS - Non-Autonomy
TABLE 5.6 NET GENERATED REVENUES BY PROGRAM
DIVISION I – FBS - NON-AUTONOMY
FISCAL YEARS 2004, 2014-2016
— Generated Revenues Exceed Expenses — — Expenses Exceed Generated Revenues —
2016
Number Reporting
Percent of Total
Median Net Revenue
Number Reporting
Percent of Total Negative Net Revenue
Football 6 9% 3,715,000 58 91% (4,465,000)
Men’s Basketball 7 11% 900,000 57 89% (1,577,000)
Women’s Basketball
2015
0 0% NA 64 100% (1,488,000)
Football 6 10% 4,356,000 57 90% (4,836,000)
Men’s Basketball 8 13% 661,000 55 87% (1,498,000)
Women’s Basketball
2014
0 0% NA 63 100% (1,488,000)
Football 7 12% 1,845,000 53 88% (4,239,000)
Men’s Basketball 9 15% 1,419,000 51 85% (1,348,000)
Women’s Basketball
2004
1 2% 69,000 59 98% (1,388,000)
Football 19 31% 1,817,000 43 69% (1,785,000)
Men’s Basketball 23 37% 963,000 39 63% (527,000)
Women’s Basketball 2 3% 1,249,000 60 97% (754,000)

NCAA® Revenues / Expenses Division I Report 2004 – 2016 | 59
Division I – FBS - Non-Autonomy
TABLE 5.7 SOURCES OF REVENUES
DIVISION I – FBS - NON-AUTONOMY
FISCAL YEAR 2016 – MEDIAN VALUES
Total Ticket Sales 2,121,000
NCAA and conference distributions 2,685,000
Guarantees and options 1,333,000
Cash contributions from alumni and others 3,320,000
Third-Party Support -
Other:
Concessions/Programs/Novelties 234,000
Broadcast Rights 150,000
Royalties/Advertising/Sponsorship 1,184,000
Sports camps 21,000
Endowment/Investment Income 90,000
Miscellaneous -
Total Generated Revenues 13,195,000
Allocated Revenues:
Direct Institutional Support
8,092,000
Indirect Institutional Support 1,531,000
Student Fees 5,902,000
Direct government support 0
Total Allocated Revenues 19,652,000
Total All Revenues 33,470,000

Division I – FBS - Non-Autonomy
NCAA® Revenues / Expenses Division I Report 2004 – 2016 | 60
TABLE 5.8 OPERATING EXPENSES BY OBJEC TS OF EXPENDITURE
DIVISION I – FBS - NON-AUTONOMY
FISCAL YEAR 2016 – MEDIAN VALUES
Grants-in-Aid
Total Total
Equipment/uniforms/supplies
Men 3,973,000
Women 2,987,000
Administrative and Non-gender 195,000
Total 6,963,000
Guarantees and Options
Men 704,000
Women 27,000
Administrative and Non-gender 0
Total 741,000
Salaries and Benefits – University paid
Men 4,703,000
Women 1,951,000
Administrative and Non-gender 4,090,000
Total 10,516,000
Salaries and Benefits – Third Party paid
Men 0
Women 0
Administrative and Non-gender 0
Total 0
Severance Pay
Men 0
Women 0
Administrative and Non-gender 0
Total 0
Team travel
Men 1,592,000
Women 958,000
Administrative and Non-gender 15,000
Total 2,623,000
Recruiting
Men 384,000
Women 171,000
Administrative and Non-gender 0
Total 560,000
Men 637,000
Women 246,000
Administrative and Non-gender 123,000
Total 1,033,000
Fundraising
Men 36,000
Women 7,000
Administrative and Non-gender 537,000
Total 756,000
Game Expenses
Men 800,000
Women 183,000
Administrative and Non-gender 88,000
Total 1,233,000
Medical
Men 7,000
Women 0
Administrative and Non-gender 386,000
Total 505,000
Membership Dues
Men 10,000
Women 6,000
Administrative and Non-gender 245,000
Total 279,000
Sports Camps
Men 0
Women 0
Administrative and Non-gender 0
Total 3,000
Spirit Groups
Men 0
Women 0
Administrative and Non-gender 71,000
Total 96,000

Division I – FBS - Non-Autonomy
NCAA® Revenues / Expenses Division I Report 2004 – 2016 | 61
TABLE 5.8 (CONTINUED) OPERATING EXPENSES BY OBJEC TS OF EXPENDITURE
DIVISION I – FBS - NON-AUTONOMY
FISCAL YEAR 2016 – MEDIAN VALUES
Total
Facilities Maintenance and Rental Men 310,000
Women 76,000
Administrative and Non-gender 2,017,000
Total 2,906,000
Indirect Institutional Support
Men
0 Women 0
Administrative and Non-gender 457,000
Total 492,000
Other
Men
425,000 Women 121,000
Administrative and Non-gender 992,000
Total 1,716,000
Total Operating Expenses
Men
15,405,000 Women 7,118,000
Administrative and Non-gender 11,072,000
Total 33,113,000
Total 33,113,000
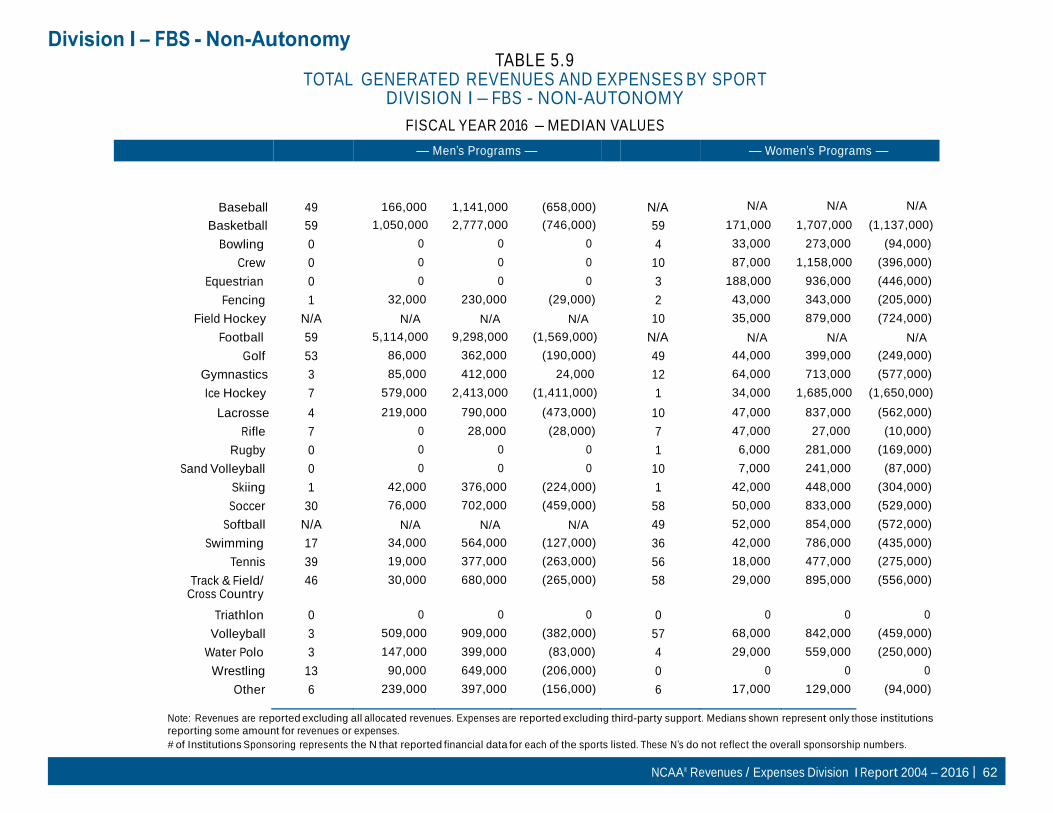
Division I – FBS - Non-Autonomy
NCAA® Revenues / Expenses Division I Report 2004 – 2016 | 62
TABLE 5.9 TOTAL GENERATED REVENUES AND EXPENSES BY SPORT
DIVISION I – FBS - NON-AUTONOMY
FISCAL YEAR 2016 – MEDIAN VALUES
— Men’s Programs — — Women’s Programs —
Sport
# of Institutions
Sponsoring
Generated Revenues
Expenses
Net Revenue
# of Institutions
Sponsoring
Generated Revenues
Expenses
Net Revenue
Baseball 49 166,000 1,141,000 (658,000) N/A N/A N/A N/A
Basketball 59 1,050,000 2,777,000 (746,000) 59 171,000 1,707,000 (1,137,000)
Bowling 0 0 0 0 4 33,000 273,000 (94,000)
Crew 0 0 0 0 10 87,000 1,158,000 (396,000)
Equestrian 0 0 0 0 3 188,000 936,000 (446,000)
Fencing 1 32,000 230,000 (29,000) 2 43,000 343,000 (205,000)
Field Hockey N/A N/A N/A N/A 10 35,000 879,000 (724,000)
Football 59 5,114,000 9,298,000 (1,569,000) N/A N/A N/A N/A
Golf 53 86,000 362,000 (190,000) 49 44,000 399,000 (249,000)
Gymnastics 3 85,000 412,000 24,000 12 64,000 713,000 (577,000)
Ice Hockey 7 579,000 2,413,000 (1,411,000) 1 34,000 1,685,000 (1,650,000)
Lacrosse 4 219,000 790,000 (473,000) 10 47,000 837,000 (562,000)
Rifle 7 0 28,000 (28,000) 7 47,000 27,000 (10,000)
Rugby 0 0 0 0 1 6,000 281,000 (169,000)
Sand Volleyball 0 0 0 0 10 7,000 241,000 (87,000)
Skiing 1 42,000 376,000 (224,000) 1 42,000 448,000 (304,000)
Soccer 30 76,000 702,000 (459,000) 58 50,000 833,000 (529,000)
Softball N/A N/A N/A N/A 49 52,000 854,000 (572,000)
Swimming 17 34,000 564,000 (127,000) 36 42,000 786,000 (435,000)
Tennis 39 19,000 377,000 (263,000) 56 18,000 477,000 (275,000)
Track & Field/ Cross Country
46 30,000 680,000 (265,000) 58 29,000 895,000 (556,000)
Triathlon 0 0 0 0 0 0 0 0
Volleyball 3 509,000 909,000 (382,000) 57 68,000 842,000 (459,000)
Water Polo 3 147,000 399,000 (83,000) 4 29,000 559,000 (250,000)
Wrestling 13 90,000 649,000 (206,000) 0 0 0 0
Other 6 239,000 397,000 (156,000) 6 17,000 129,000 (94,000)
Note: Revenues are reported excluding all allocated revenues. Expenses are reported excluding third-party support. Medians shown represent only those institutions
reporting some amount for revenues or expenses.
# of Institutions Sponsoring represents the N that reported financial data for each of the sports listed. These N’s do not reflect the overall sponsorship numbers.
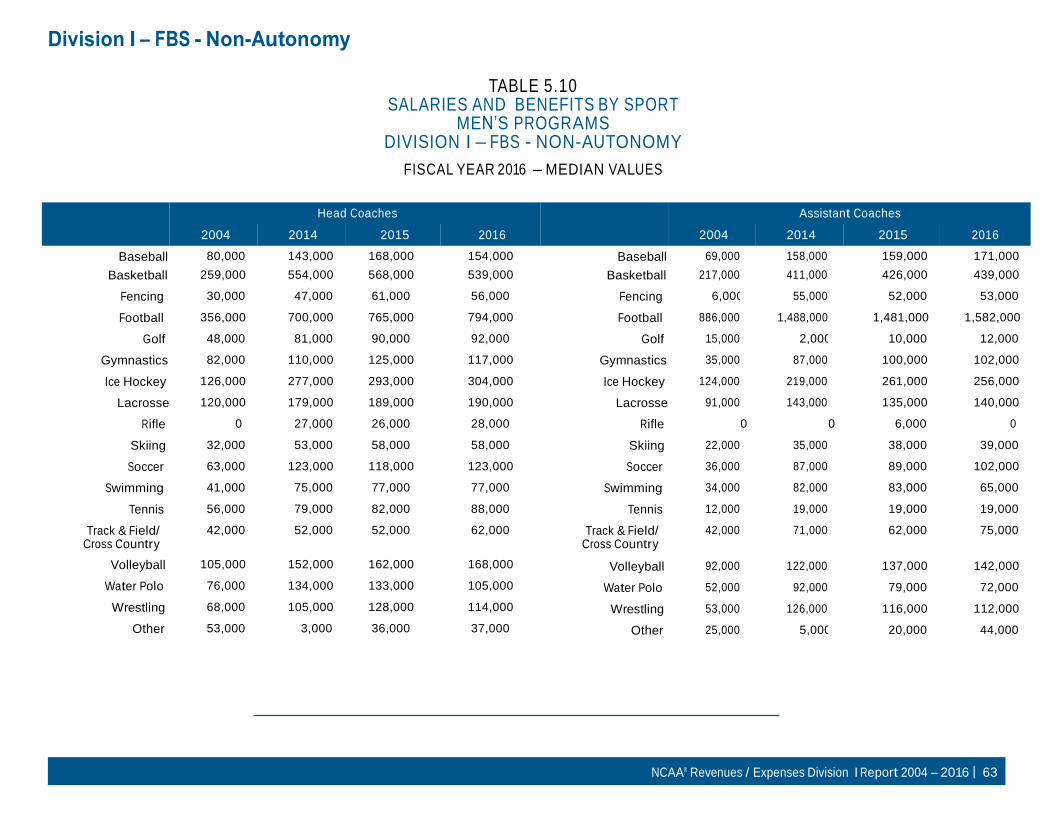
Division I – FBS - Non-Autonomy
NCAA® Revenues / Expenses Division I Report 2004 – 2016 | 63
TABLE 5.10 SALARIES AND BENEFITS BY SPORT
MEN’S PROGRAMS DIVISION I – FBS - NON-AUTONOMY
FISCAL YEAR 2016 – MEDIAN VALUES
Head Coaches
2004 2014 2015 2016
Assistant Coaches
2004 2014 2015 2016
Baseball 80,000 143,000 168,000 154,000 Baseball 69,000 158,000 159,000 171,000
Basketball 259,000 554,000 568,000 539,000 Basketball 217,000 411,000 426,000 439,000
Fencing 30,000 47,000 61,000 56,000 Fencing 6,000 55,000 52,000 53,000
Football 356,000 700,000 765,000 794,000 Football 886,000 1,488,000 1,481,000 1,582,000
Golf 48,000 81,000 90,000 92,000 Golf 15,000 2,000 10,000 12,000
Gymnastics 82,000 110,000 125,000 117,000 Gymnastics 35,000 87,000 100,000 102,000
Ice Hockey 126,000 277,000 293,000 304,000 Ice Hockey 124,000 219,000 261,000 256,000
Lacrosse 120,000 179,000 189,000 190,000 Lacrosse 91,000 143,000 135,000 140,000
Rifle 0 27,000 26,000 28,000 Rifle 0 0 6,000 0
Skiing 32,000 53,000 58,000 58,000 Skiing 22,000 35,000 38,000 39,000
Soccer 63,000 123,000 118,000 123,000 Soccer 36,000 87,000 89,000 102,000
Swimming 41,000 75,000 77,000 77,000 Swimming 34,000 82,000 83,000 65,000
Tennis 56,000 79,000 82,000 88,000 Tennis 12,000 19,000 19,000 19,000
Track & Field/ Cross Country
42,000 52,000 52,000 62,000 Track & Field/ Cross Country
42,000 71,000 62,000 75,000
Volleyball 105,000 152,000 162,000 168,000 Volleyball 92,000 122,000 137,000 142,000
Water Polo 76,000 134,000 133,000 105,000 Water Polo 52,000 92,000 79,000 72,000
Wrestling 68,000 105,000 128,000 114,000 Wrestling 53,000 126,000 116,000 112,000
Other 53,000 3,000 36,000 37,000 Other 25,000 5,000 20,000 44,000

Division I – FBS - Non-Autonomy
NCAA® Revenues / Expenses Division I Report 2004 – 2016 | 64
Volleyball 197,000 274,000 300,000 313,000
Water Polo 129,000 227,000 211,000 177,000
Wrestling 122,000 229,000 225,000 220,000
Other 90,000 13,000 67,000 81,000
TABLE 5.10 (CONTINUED) SALARIES AND BENEFITS BY SPORT
MEN’S PROGRAMS DIVISION I – FBS - NON-AUTONOMY
FISCAL YEAR 2016 – MEDIAN VALUES
Total Coaches
2004 2014 2015 2016
Baseball 147,000 314,000 336,000 326,000
Basketball 474,000 968,000 985,000 1,039,000
Fencing 43,000 102,000 113,000 110,000
Football 1,328,000 2,194,000 2,270,000 2,353,000
Golf 49,000 96,000 105,000 108,000
Gymnastics 119,000 211,000 225,000 219,000
Ice Hockey 252,000 568,000 578,000 583,000
Lacrosse 208,000 309,000 324,000 326,000
Rifle 0 27,000 32,000 28,000
Skiing 54,000 89,000 97,000 97,000
Soccer 104,000 207,000 217,000 230,000
Swimming 73,000 159,000 168,000 170,000
Tennis 67,000 94,000 98,000 113,000
Administrative
2004 2014 2015 2016
Baseball 15,000 3,000 13,000 15,000
Basketball 71,000 89,000 124,000 126,000
Fencing 11,000 0 0 0
Football 162,000 329,000 338,000 408,000
Golf 6,000 0 0 0
Gymnastics 0 0 0 0
Ice Hockey 26,000 42,000 42,000 39,000
Lacrosse 51,000 0 0 1,000
Rifle 0 0 0 0
Skiing 0 0 7,000 0
Soccer 8,000 0 0 0
Swimming 10,000 0 0 0
Tennis 3,000 0 0 0
Track & Field/ Cross Country
77,000 135,000 132,000 141,000
Track & Field/ Cross Country
9,000 0 0 0
Volleyball 4,000 0 15,000 2,000
Water Polo 0 0 0 0
Wrestling 14,000 0 0 0
Other 67,000 0 7,000 0

Division I – FBS - Non-Autonomy
NCAA® Revenues / Expenses Division I Report 2004 – 2016 | 65
TABLE 5.11 SALARIES AND BENEFITS BY SPORT
WOMEN’S PROGRAMS DIVISION I – FBS - NON-AUTONOMY
FISCAL YEAR 2016 – MEDIAN VALUES
Head Coaches
2004 2014 2015 2016
Assistant Coaches
2004 2014 2015 2016
Basketball 141,000 256,000 262,000 269,000 Basketball 166,000 268,000 287,000 308,000
Bowling 0 49,000 52,000 48,000 Bowling 0 0 0 0
Crew 54,000 86,000 96,000 98,000 Crew 38,000 106,000 105,000 106,000
Equestrian 60,000 71,000 105,000 110,000 Equestrian 62,000 49,000 101,000 82,000
Fencing 25,000 33,000 33,000 53,000 Fencing 8,000 50,000 41,000 45,000
Field Hockey 67,000 103,000 107,000 110,000 Field Hockey 49,000 64,000 71,000 78,000
Golf 51,000 73,000 78,000 80,000 Golf 15,000 - 5,000 8,000
Gymnastics 59,000 91,000 113,000 114,000 Gymnastics 37,000 62,000 60,000 75,000
Ice Hockey 58,000 111,000 129,000 135,000 Ice Hockey 31,000 183,000 184,000 199,000
Lacrosse 58,000 99,000 108,000 123,000 Lacrosse 47,000 90,000 115,000 119,000
Rifle 28,000 26,000 11,000 14,000 Rifle 0 0 0 0
Rugby 0 0 64,000 80,000 Rugby 0 0 16,000 28,000
Sand Volleyball 0 41,000 51,000 48,000 Sand Volleyball 0 0 0 19,000
Skiing 37,000 53,000 58,000 58,000 Skiing 22,000 35,000 38,000 39,000
Soccer 63,000 93,000 97,000 99,000 Soccer 40,000 90,000 95,000 93,000
Softball 64,000 100,000 108,000 109,000 Softball 48,000 97,000 106,000 110,000
Swimming 58,000 84,000 89,000 85,000 Swimming 45,000 87,000 84,000 83,000
Tennis 50,000 74,000 75,000 79,000 Tennis 15,000 18,000 20,000 23,000
Track & Field/ Cross Country
45,000 69,000 72,000 74,000 Track & Field/ Cross Country
46,000 103,000 102,000 95,000
Triathlon 0 0 0 0 Triathlon 0 0 0 0
Volleyball 79,000 118,000 122,000 124,000 Volleyball 64,000 105,000 108,000 114,000
Water Polo 54,000 90,000 104,000 104,000 Water Polo 20,000 77,000 64,000 68,000
Other 25,000 21,000 59,000 66,000 Other 6,000 2,000 9,000 6,000

Division I – FBS - Non-Autonomy
NCAA® Revenues / Expenses Division I Report 2004 – 2016 | 66
TABLE 5.11 (CONTINUED) SALARIES AND BENEFITS BY SPORT
WOMEN’S PROGRAMS DIVISION I – FBS - NON-AUTONOMY
FISCAL YEAR 2016 – MEDIAN VALUES
Total Coaches
2004 2014 2015 2016
Basketball 303,000 530,000 566,000 588,000
Bowling 0 50,000 52,000 48,000
Crew 92,000 191,000 210,000 199,000
Equestrian 91,000 120,000 206,000 192,000
Fencing 29,000 83,000 74,000 98,000
Field Hockey 121,000 160,000 178,000 187,000
Golf 53,000 76,000 81,000 86,000
Gymnastics 96,000 184,000 169,000 172,000
Ice Hockey 89,000 294,000 313,000 335,000
Lacrosse 103,000 187,000 219,000 227,000
Rifle 28,000 26,000 11,000 14,000
Rugby 0 0 80,000 108,000
Sand Volleyball 0 49,000 52,000 59,000
Skiing 43,000 89,000 97,000 97,000
Soccer 108,000 181,000 188,000 200,000
Softball 115,000 200,000 220,000 219,000
Swimming 100,000 170,000 176,000 180,000
Tennis 58,000 85,000 91,000 108,000
Administrative
2004 2014 2015 2016
Basketball 32,000 61,000 79,000 84,000
Bowling 0 0 0 0
Crew 10,000 0 0 0
Equestrian 32,000 11,000 13,000 16,000
Fencing 8,000 0 0 0
Field Hockey 18,000 0 0 0
Golf 2,000 0 0 0
Gymnastics 10,000 0 0 0
Ice Hockey 9,000 2,000 3,000 3,000
Lacrosse 15,000 0 0 0
Rifle 0 0 0 0
Rugby 0 0 0 0
Sand Volleyball 0 0 0 0
Skiing 0 0 7,000 0
Soccer 7,000 0 0 1,000
Softball 7,000 1,000 0 0
Swimming 6,000 0 0 0
Tennis 3,000 0 0 0
Track & Field/ Cross Country
98,000 172,000 179,000 169,000
Track & Field/ Cross Country
5,000 0 0 0
Triathlon 0 0 0 0
Volleyball 132,000 225,000 225,000 238,000
Water Polo 80,000 163,000 176,000 177,000
Other 28,000 30,000 73,000 86,000
Triathlon 0 0 0 0
Volleyball 9,000 1,000 1,000 2,000
Water Polo 0 0 0 1,000
Other 0 0 0 0
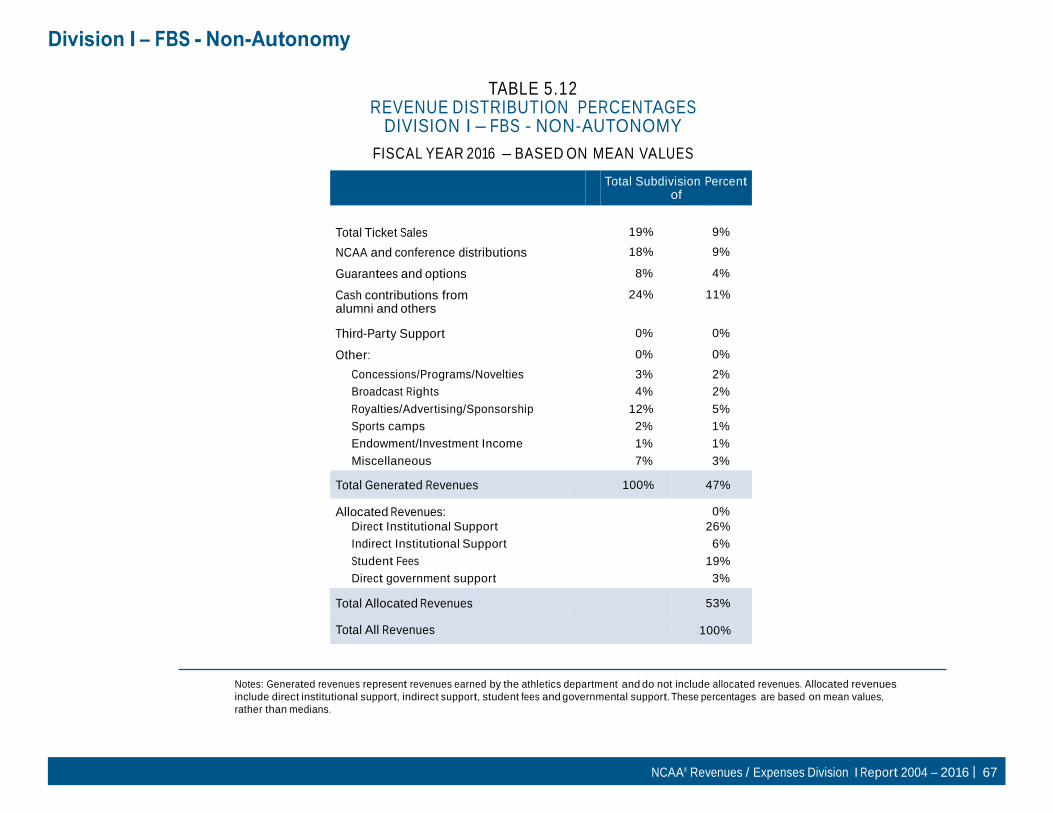
Division I – FBS - Non-Autonomy
NCAA® Revenues / Expenses Division I Report 2004 – 2016 | 67
TABLE 5.12 REVENUE DISTRIBUTION PERCENTAGES
DIVISION I – FBS - NON-AUTONOMY
FISCAL YEAR 2016 – BASED ON MEAN VALUES
Total Subdivision Percent of
Gen. Rev. Total Rev.
Total Ticket Sales 19% 9%
NCAA and conference distributions 18% 9%
Guarantees and options 8% 4%
Cash contributions from alumni and others
24% 11%
Third-Party Support 0% 0%
Other: 0% 0%
Concessions/Programs/Novelties 3% 2%
Broadcast Rights 4% 2%
Royalties/Advertising/Sponsorship 12% 5%
Sports camps 2% 1%
Endowment/Investment Income 1% 1%
Miscellaneous 7% 3%
Total Generated Revenues
100%
47%
Allocated Revenues: 0%
Direct Institutional Support 26%
Indirect Institutional Support 6%
Student Fees 19%
Direct government support 3%
Total Allocated Revenues
53%
Total All Revenues 100%
Notes: Generated revenues represent revenues earned by the athletics department and do not include allocated revenues. Allocated revenues
include direct institutional support, indirect support, student fees and governmental support. These percentages are based on mean values,
rather than medians.

Division I – FBS - Non-Autonomy
NCAA® Revenues / Expenses Division I Report 2004 – 2016 | 68
Total
Men
11% Women 8%
Administrative and Non-gender 1%
Total 20%
Men
2% Women 0%
Administrative and Non-gender 0%
Total 2%
Men 2%
Women 1%
Administrative and Non-gender 1%
Total 3%
Medical Men 0%
TABLE 5.13 OPERATING EXPENSE DISTRIBUTION PERCENTAGES
DIVISION I – FBS - NON-AUTONOMY PERCENT OF TOTAL EXPENSES
FISCAL YEAR 2016 – BASED ON MEAN VALUES
Equipment/uniforms/supplies
Total
Men 2%
Women 1%
Administrative and Non-gender 1%
Total 3%
Men 1%
Women 0%
Administrative and Non-gender 2%
Total 3% Salaries and Benefits – University paid
Men 15%
Women 6%
Administrative and Non-gender 12%
Total 33%
Salaries and Benefits – Third Party paid
Men 0%
Women 0%
Administrative and Non-gender 0%
Total 0%
Men 0%
Women 0%
Administrative and Non-gender 0%
Total 1%
Men 5%
Women 3%
Administrative and Non-gender 0%
Total 8%
Men 1%
Women 0%
Administrative and Non-gender 0%
Total 2%
Women 0%
Administrative and Non-gender 1%
Total 1%
Membership Dues Men 0%
Women 0%
Administrative and Non-gender 1%
Total 1%
Men 0%
Women 0%
Administrative and Non-gender 0%
Total 1%
Men 0%
Women 0%
Administrative and Non-gender 0%
Total 0%

Division I – FBS - Non-Autonomy
NCAA® Revenues / Expenses Division I Report 2004 – 2016 | 69
TABLE 5.13 (CONTINUED) OPERATING EXPENSE DISTRIBUTION PERCENTAGES
DIVISION I – FBS - NON-AUTONOMY PERCENT OF TOTAL EXPENSES
FISCAL YEAR 2016 – BASED ON MEAN VALUES
Total
Facilities Maintenance and Rental Men 3%
Women 1%
Administrative and Non-gender 7%
Total 11%
Indirect Institutional Support Men
1% Women 0%
Administrative and Non-gender 2%
Total 4%
Other Men
1% Women 0%
Administrative and Non-gender 4%
Total 6%
Total Operating Expenses Men
47% Women 20%
Administrative and Non-gender 33%
Total 100%
Note: These percentages are based on mean values, rather than medians.
NCAA® Revenues / Expenses Division I Report 2004 – 2016 | 70
DIVISION I FOOTBALL CHAMPIONSHIP SUBDIVISION
(FCS)

NCAA® Revenues / Expenses Division I Report 2004 – 2016 | 71
Division I – FCS
TABLE 6.1 SUMMARY OF REVENUES, EXPENSES AND OPERATING RESULTS
DIVISION I – FCS
FISCAL YEARS 2004, 2014-2016
Generated
Revenues Total
Revenues Total
Expenses Median Net
Revenue
2016
Men’s 1,980,000 6,513,000 7,599,000 (4,988,000)
Women’s 350,000 3,218,000 4,703,000 (4,089,000)
Coed 1,904,000 6,591,000 4,963,000 (2,943,000)
Total 4,492,000 17,409,000 17,290,000 (12,550,000)
2015 Men’s 1,896,000 6,050,000 7,212,000 (4,811,000)
Women’s 327,000 3,402,000 4,528,000 (4,000,000)
Coed 1,635,000 6,426,000 4,827,000 (2,976,000)
Total 4,047,000 16,314,000 16,174,000 (12,020,000)
2014 Men’s 1,928,000 5,481,000 6,870,000 (4,542,000)
Women’s 309,000 3,197,000 4,391,000 (3,956,000)
Coed 1,547,000 6,474,000 4,741,000 (2,746,000)
Total
2004
4,137,000 15,315,000 15,154,000 (11,041,000)
Men’s 950,000 2,557,000 3,485,000 (2,396,000)
Women’s 154,000 957,000 2,262,000 (2,038,000)
Coed 702,000 3,581,000 1,930,000 (1,120,000)
Total 2,047,000 7,770,000 7,810,000 (5,907,000)
Notes: Generated Revenues represent those earned by the athletics department and do not include allocated revenues. Allocated revenues come from
outside athletics and include Direct Institutional Support, Indirect Institutional Support, Student Fees and Governmental Support.

Division I – FCS
NCAA® Revenues / Expenses Division I Report 2004 – 2016 | 72
TABLE 6.2 SUMMARY DATA RESTATED IN 2004 DOLLARS
DIVISION I – FCS MEDIAN VALUES
FISCAL YEARS 2004, 2014-2016
2016 (1.377)
Generated Revenues
Total Revenues
Total Expenses
Men’s 1,438,000 4,730,000 5,519,000
Women’s 254,000 2,337,000 3,416,000
Coed 1,383,000 4,787,000 3,604,000
Total 3,262,000 12,643,000 12,556,000
2015 (1.352)
Men’s 1,403,000 4,475,000 5,335,000
Women’s 242,000 2,516,000 3,349,000
Coed 1,209,000 4,753,000 3,570,000
Total 2,993,000 12,066,000 11,963,000
2014 (1.324) Men’s 1,456,000 4,140,000 5,189,000
Women’s 233,000 2,415,000 3,316,000
Coed 1,168,000 4,890,000 3,581,000
Total 3,124,000 11,567,000 11,445,000
2004 (1.000) Men’s 950,000 2,557,000 3,485,000
Women’s 154,000 957,000 2,262,000
Coed 702,000 3,581,000 1,930,000
Total 2,047,000 7,770,000 7,810,000
Notes: HEPI Values:
2004 = 231.7; 2005 = 240.8; 2006 = 253.1; 2007 = 260.3; 2008 = 273.2; 2009 = 279.3; 2010 = 281.8, 2011 = 288.4, 2012 = 293.2, 2013 = 297.8, 2014 = 306.7, 2015 =
313.3, 2016 = 319.0
Higher Education Price Index is an inflation index specifically to track the main cost drivers in higher education.
All values have been restated in terms of 2004 dollars to remove the effects of inflation.

Division I – FCS
NCAA® Revenues / Expenses Division I Report 2004 – 2016 | 73
2016
TABLE 6.3 PERCENTAGE CHANGE FROM PRIOR YEAR
DIVISION I – FCS
FISCAL YEARS 2014-2016
— Generated Revenues — — Total Revenues — — Total Expenses —
Real Inflationary Total Real Inflationary Total Real Inflationary Total
Men’s 2.49% 1.91% 4.41% 5.70% 1.95% 7.65% 3.45% 1.91% 5.36%
Women’s 4.96% 2.23% 7.19% -7.11% 1.70% -5.42% 2.00% 1.87% 3.87%
Coed 14.39% 2.07% 16.46% 0.72% 1.86% 2.57% 0.95% 1.87% 2.82%
Total 8.99% 2.01% 11.00% 4.78% 1.93% 6.71% 4.96% 1.94% 6.89%
2015
Men’s -3.64% 1.99% -1.65% 8.09% 2.29% 10.38% 2.81% 2.17% 4.98%
Women’s 3.86% 1.93% 5.80% 4.18% 2.24% 6.42% 1.00% 2.13% 3.13%
Coed 3.51% 2.17% 5.68% -2.80% 2.06% -0.75% -0.31% 2.12% 1.81%
Total -4.19% 2.02% -2.17% 4.31% 2.21% 6.52% 4.53% 2.21% 6.74%
2014
Men’s -0.79% 3.03% 2.24% 5.32% 3.19% 8.51% 4.37% 3.16% 7.53%
Women’s 3.93% 3.26% 7.19% 5.05% 3.17% 8.22% 1.53% 3.09% 4.62%
Coed -3.42% 2.97% -0.45% 0.23% 3.04% 3.27% 3.94% 3.15% 7.09%
Total 5.84% 3.22% 9.06% 1.16% 3.07% 4.23% 1.48% 3.08% 4.56%
Notes: The Total Change reflects unadjusted amounts for the period. The Real Change reflects the change after removal
of the effects of inflation. The Inflationary Change is caused by the increase in the HEPI factors.

Division I – FCS
NCAA® Revenues / Expenses Division I Report 2004 – 2016 | 74
TABLE 6.4 TRENDS IN PROGRAM REVENUES AND EXPENSES
DIVISION I – FCS
FISCAL YEARS 2004, 2014-2016
Generated Revenues Total Revenues Total Expenses
2016
Football
1,000,000
2,946,000
3,572,000 Men’s Basketball 526,000 1,278,000 1,527,000
Women’s Basketball 108,000 799,000 1,169,000
2015
Football
1,058,000
2,911,000
3,490,000 Men’s Basketball 509,000 1,292,000 1,440,000
Women’s Basketball 110,000 805,000 1,144,000
2014
Football
991,000
2,644,000
3,200,000 Men’s Basketball 489,000 1,149,000 1,402,000
Women’s Basketball 97,000 765,000 1,087,000
2004
Football
431,000
878,000
1,596,000 Men’s Basketball 244,000 626,000 724,000
Women’s Basketball 37,000 262,000 593,000
Notes: Generated Revenues represent those earned by the athletics department and do not include allocated revenues. Allocated revenues come
from outside athletics and include Direct Institutional Support, Indirect Institutional Support, Student Fees and Governmental Support.

Division I – FCS
NCAA® Revenues / Expenses Division I Report 2004 – 2016 | 75
TABLE 6.5 NET GENERATED REVENUES BY GENDER
DIVISION I – FCS
FISCAL YEARS 2004, 2014-2016
— Generated Revenues Exceed Expenses — — Expenses Exceed Generated Revenues —
2016
Number Reporting
Percent of Total
Median Net Revenue
Number Reporting
Percent of Total Negative Net Revenue
Men’s Program
2
2%
844,300
121
98%
(5,022,000) Women’s Program 0 0% NA 123 100% (4,089,000)
Total 0 0% NA 123 100% (12,550,000)
2015
Men’s Program
2
2%
789,000
122
98%
(4,869,000) Women’s Program 0 0% NA 124 100% (4,000,000)
Total 0 0% NA 124 100% (12,020,000)
2014
Men’s Program
1
1%
2,498,000
124
99%
(4,542,000) Women’s Program 0 0% NA 125 100% (3,956,000)
Total 0 0% NA 125 100% (11,041,000)
2004
Men’s Program
2
2%
1,588,000
113
98%
(2,402,000) Women’s Program 0 0% NA 115 100% (2,038,000)
Total 0 0% NA 115 100% (5,907,000)

Division I – FCS
NCAA® Revenues / Expenses Division I Report 2004 – 2016 | 76
TABLE 6.6 NET GENERATED REVENUES BY PROGRAM
DIVISION I – FCS
FISCAL YEARS 2004, 2014-2016
— Generated Revenues Exceed Expenses — — Expenses Exceed Generated Revenues —
2016
Number Reporting
Percent of Total
Median Net Revenue
Number Reporting
Percent of Total Negative Net Revenue
Football 3 2% 244,000 120 98% (2,393,000)
Men’s Basketball 3 2% 4,002,000 120 98% (995,000)
Women’s Basketball
2015
0 0% NA 121 100% (1,047,000)
Football 2 2% 952,000 122 98% (2,438,000)
Men’s Basketball 3 2% 3,291,000 121 98% (938,000)
Women’s Basketball
2014
0 0% NA 122 100% (997,000)
Football 3 2% 203,000 121 98% (2,179,000)
Men’s Basketball 4 3% 1,676,000 121 97% (828,000)
Women’s Basketball
2004
0 0% NA 123 100% (962,000)
Football 7 6% 184,000 108 94% (1,076,000)
Men’s Basketball 8 7% 269,000 107 93% (471,000)
Women’s Basketball 2 2% 156,000 111 98% (547,000)

Division I – FCS
NCAA® Revenues / Expenses Division I Report 2004 – 2016 | 77
TABLE 6.7 SOURCES OF REVENUES
DIVISION I – FCS
FISCAL YEAR 2016 – MEDIAN VALUES
Total Ticket Sales 468,000
NCAA and conference distributions 842,000
Guarantees and options 643,000
Cash contributions from alumni and others 1,055,000
Third-Party Support 0
Other:
Concessions/Programs/Novelties 52,000
Broadcast Rights 0
Royalties/Advertising/Sponsorship 318,000
Sports camps 7,000
Endowment/Investment Income 30,000
Miscellaneous 0
Total Generated Revenues 4,492,000
Allocated Revenues:
Direct Institutional Support
8,315,000
Indirect Institutional Support 1,253,000
Student Fees 1,070,000
Direct government support 0
Total Allocated Revenues 12,550,000
Total All Revenues 17,409,000
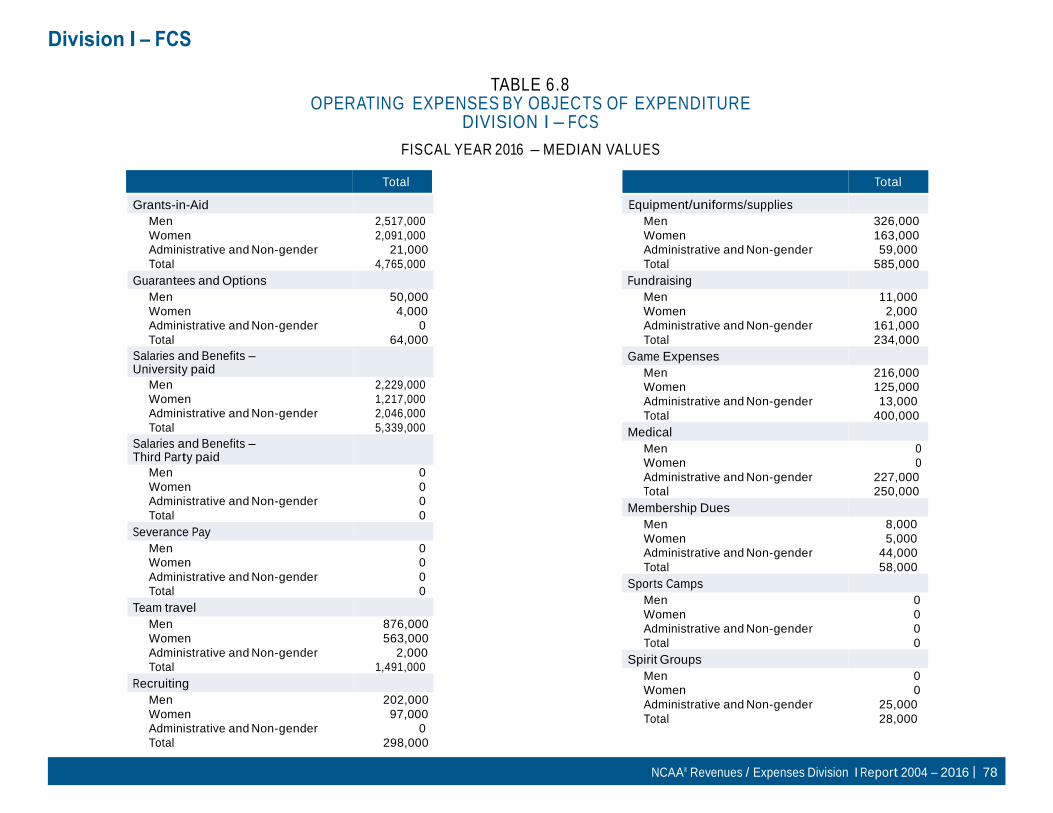
Division I – FCS
NCAA® Revenues / Expenses Division I Report 2004 – 2016 | 78
TABLE 6.8 OPERATING EXPENSES BY OBJEC TS OF EXPENDITURE
DIVISION I – FCS
FISCAL YEAR 2016 – MEDIAN VALUES
Grants-in-Aid
Total Total
Equipment/uniforms/supplies
Men 2,517,000
Women 2,091,000
Administrative and Non-gender 21,000
Total 4,765,000
Guarantees and Options
Men 50,000
Women 4,000
Administrative and Non-gender 0
Total 64,000
Salaries and Benefits – University paid
Men 2,229,000
Women 1,217,000
Administrative and Non-gender 2,046,000
Total 5,339,000
Salaries and Benefits – Third Party paid
Men 0
Women 0
Administrative and Non-gender 0
Total 0
Severance Pay
Men 0
Women 0
Administrative and Non-gender 0
Total 0
Team travel
Men 876,000
Women 563,000
Administrative and Non-gender 2,000
Total 1,491,000
Recruiting
Men 202,000
Women 97,000
Administrative and Non-gender 0
Total 298,000
Men 326,000
Women 163,000
Administrative and Non-gender 59,000
Total 585,000
Fundraising
Men 11,000
Women 2,000
Administrative and Non-gender 161,000
Total 234,000
Game Expenses
Men 216,000
Women 125,000
Administrative and Non-gender 13,000
Total 400,000
Medical
Men 0
Women 0
Administrative and Non-gender 227,000
Total 250,000
Membership Dues
Men 8,000
Women 5,000
Administrative and Non-gender 44,000
Total 58,000
Sports Camps
Men 0
Women 0
Administrative and Non-gender 0
Total 0
Spirit Groups
Men 0
Women 0
Administrative and Non-gender 25,000
Total 28,000

Division I – FCS
NCAA® Revenues / Expenses Division I Report 2004 – 2016 | 79
TABLE 6.8 (CONTINUED) OPERATING EXPENSES BY OBJEC TS OF EXPENDITURE
DIVISION I – FCS
FISCAL YEAR 2016 – MEDIAN VALUES
Facilities Maintenance and Rental
Total
Men 52,000
Women 21,000
Administrative and Non-gender 331,000
Total 634,000
Indirect Institutional Support
Men 0
Women 0
Administrative and Non-gender 586,000
Total 742,000
Other Men 170,000
Women 72,000
Administrative and Non-gender 395,000
Total 679,000
Total Operating Expenses Men 7,599,000
Women 4,703,000
Administrative and Non-gender 4,963,000
Total 17,290,000
Total 17,290,000
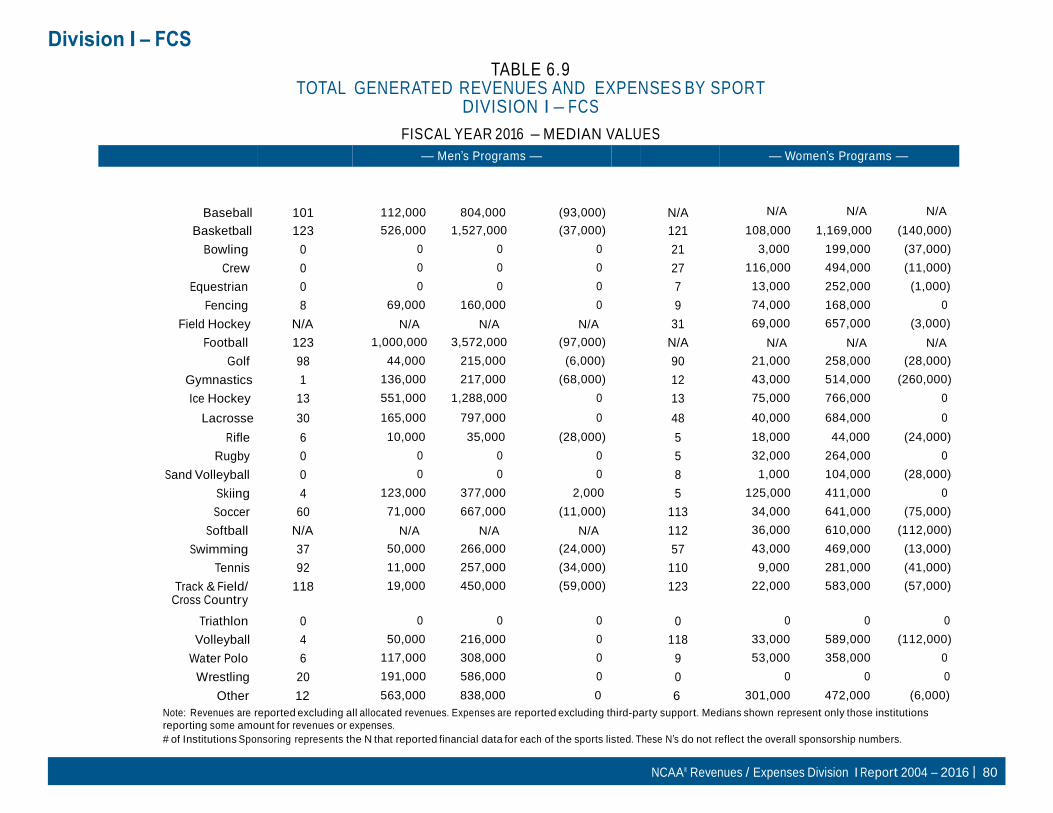
Division I – FCS
NCAA® Revenues / Expenses Division I Report 2004 – 2016 | 80
TABLE 6.9 TOTAL GENERATED REVENUES AND EXPENSES BY SPORT
DIVISION I – FCS
FISCAL YEAR 2016 – MEDIAN VALUES
— Men’s Programs — — Women’s Programs —
Sport
# of Institutions
Sponsoring
Generated Revenues
Expenses
Net Revenue
# of Institutions
Sponsoring
Generated Revenues
Expenses
Net Revenue
Baseball 101 112,000 804,000 (93,000) N/A N/A N/A N/A
Basketball 123 526,000 1,527,000 (37,000) 121 108,000 1,169,000 (140,000)
Bowling 0 0 0 0 21 3,000 199,000 (37,000)
Crew 0 0 0 0 27 116,000 494,000 (11,000)
Equestrian 0 0 0 0 7 13,000 252,000 (1,000)
Fencing 8 69,000 160,000 0 9 74,000 168,000 0
Field Hockey N/A N/A N/A N/A 31 69,000 657,000 (3,000)
Football 123 1,000,000 3,572,000 (97,000) N/A N/A N/A N/A
Golf 98 44,000 215,000 (6,000) 90 21,000 258,000 (28,000)
Gymnastics 1 136,000 217,000 (68,000) 12 43,000 514,000 (260,000)
Ice Hockey 13 551,000 1,288,000 0 13 75,000 766,000 0
Lacrosse 30 165,000 797,000 0 48 40,000 684,000 0
Rifle 6 10,000 35,000 (28,000) 5 18,000 44,000 (24,000)
Rugby 0 0 0 0 5 32,000 264,000 0
Sand Volleyball 0 0 0 0 8 1,000 104,000 (28,000)
Skiing 4 123,000 377,000 2,000 5 125,000 411,000 0
Soccer 60 71,000 667,000 (11,000) 113 34,000 641,000 (75,000)
Softball N/A N/A N/A N/A 112 36,000 610,000 (112,000)
Swimming 37 50,000 266,000 (24,000) 57 43,000 469,000 (13,000)
Tennis 92 11,000 257,000 (34,000) 110 9,000 281,000 (41,000)
Track & Field/ Cross Country
118 19,000 450,000 (59,000) 123 22,000 583,000 (57,000)
Triathlon 0 0 0 0 0 0 0 0
Volleyball 4 50,000 216,000 0 118 33,000 589,000 (112,000)
Water Polo 6 117,000 308,000 0 9 53,000 358,000 0
Wrestling 20 191,000 586,000 0 0 0 0 0
Other 12 563,000 838,000 0 6 301,000 472,000 (6,000)
Note: Revenues are reported excluding all allocated revenues. Expenses are reported excluding third-party support. Medians shown represent only those institutions
reporting some amount for revenues or expenses.
# of Institutions Sponsoring represents the N that reported financial data for each of the sports listed. These N’s do not reflect the overall sponsorship numbers.

Division I – FCS
NCAA® Revenues / Expenses Division I Report 2004 – 2016 | 81
Volleyball 5,000 5,000 10,000 15,000
Water Polo 2,000 24,000 31,000 31,000
Wrestling 26,000 108,000 81,000 118,000
Other 15,000 49,000 109,000 114,000
TABLE 6.10 SALARIES AND BENEFITS BY SPORT
MEN’S PROGRAMS DIVISION I – FCS
FISCAL YEAR 2016 – MEDIAN VALUES
Head Coaches
2004 2014 2015 2016
Baseball 61,000 105,000 106,000 114,000
Basketball 134,000 254,000 263,000 279,000
Fencing 43,000 54,000 65,000 56,000
Football 123,000 245,000 261,000 267,000
Golf 15,000 42,000 45,000 45,000
Gymnastics 45,000 95,000 101,000 95,000
Ice Hockey 143,000 253,000 256,000 253,000
Lacrosse 55,000 150,000 158,000 164,000
Rifle 4,000 5,000 16,000 28,000
Skiing 43,000 81,000 82,000 81,000
Soccer 54,000 98,000 103,000 102,000
Swimming 27,000 43,000 42,000 43,000
Tennis 19,000 45,000 44,000 47,000
Assistant Coaches
2004 2014 2015 2016
Baseball 36,000 84,000 87,000 89,000
Basketball 133,000 227,000 242,000 246,000
Fencing 3,000 31,000 23,000 29,000
Football 320,000 614,000 644,000 667,000
Golf 3,000 0 0 0
Gymnastics 7,000 11,000 8,000 29,000
Ice Hockey 105,000 193,000 210,000 206,000
Lacrosse 28,000 105,000 113,000 111,000
Rifle 0 0 0 0
Skiing 14,000 21,000 23,000 24,000
Soccer 15,000 58,000 56,000 61,000
Swimming 12,000 32,000 31,000 33,000
Tennis 4,000 4,000 1,000 3,000
Track & Field/ Cross Country
32,000 50,000 48,000 51,000
Track & Field/ Cross Country
18,000 39,000 43,000 45,000
Volleyball 11,000 49,000 50,000 67,000
Water Polo 12,000 47,000 48,000 50,000
Wrestling 50,000 111,000 117,000 118,000
Other 26,000 81,000 186,000 223,000

Division I – FCS
NCAA® Revenues / Expenses Division I Report 2004 – 2016 | 82
Volleyball 0 0 0 0
Water Polo 0 0 0 0
Wrestling 6,000 0 0 0
Other 70,000 0 3,000 0
TABLE 6.10 (CONTINUED) SALARIES AND BENEFITS BY SPORT
MEN’S PROGRAMS DIVISION I – FCS
FISCAL YEAR 2016 – MEDIAN VALUES
Total Coaches
2004 2014 2015 2016
Baseball 88,000 194,000 206,000 208,000
Basketball 268,000 489,000 501,000 536,000
Fencing 44,000 89,000 97,000 96,000
Football 451,000 860,000 894,000 921,000
Golf 12,000 50,000 54,000 54,000
Gymnastics 52,000 106,000 109,000 124,000
Ice Hockey 267,000 452,000 476,000 459,000
Lacrosse 80,000 286,000 286,000 293,000
Rifle 4,000 5,000 16,000 28,000
Skiing 58,000 102,000 110,000 114,000
Soccer 69,000 161,000 165,000 170,000
Swimming 38,000 73,000 73,000 79,000
Tennis 20,000 58,000 52,000 57,000
Administrative
2004 2014 2015 2016
Baseball 8,000 0 0 0
Basketball 30,000 20,000 23,000 25,000
Fencing 0 0 0 0
Football 37,000 45,000 48,000 57,000
Golf 3,000 0 0 0
Gymnastics 0 0 0 0
Ice Hockey 44,000 21,000 30,000 39,000
Lacrosse 4,000 1,000 2,000 1,000
Rifle 0 0 0 0
Skiing 0 0 0 0
Soccer 1,000 0 0 0
Swimming 8,000 0 0 0
Tennis 1,000 0 0 0
Track & Field/ Cross Country
52,000 96,000 95,000 101,000
Track & Field/ Cross Country
4,000 0 0 0
Volleyball 14,000 51,000 63,000 95,000
Water Polo 12,000 68,000 81,000 84,000
Wrestling 64,000 209,000 193,000 230,000
Other 37,000 109,000 295,000 337,000
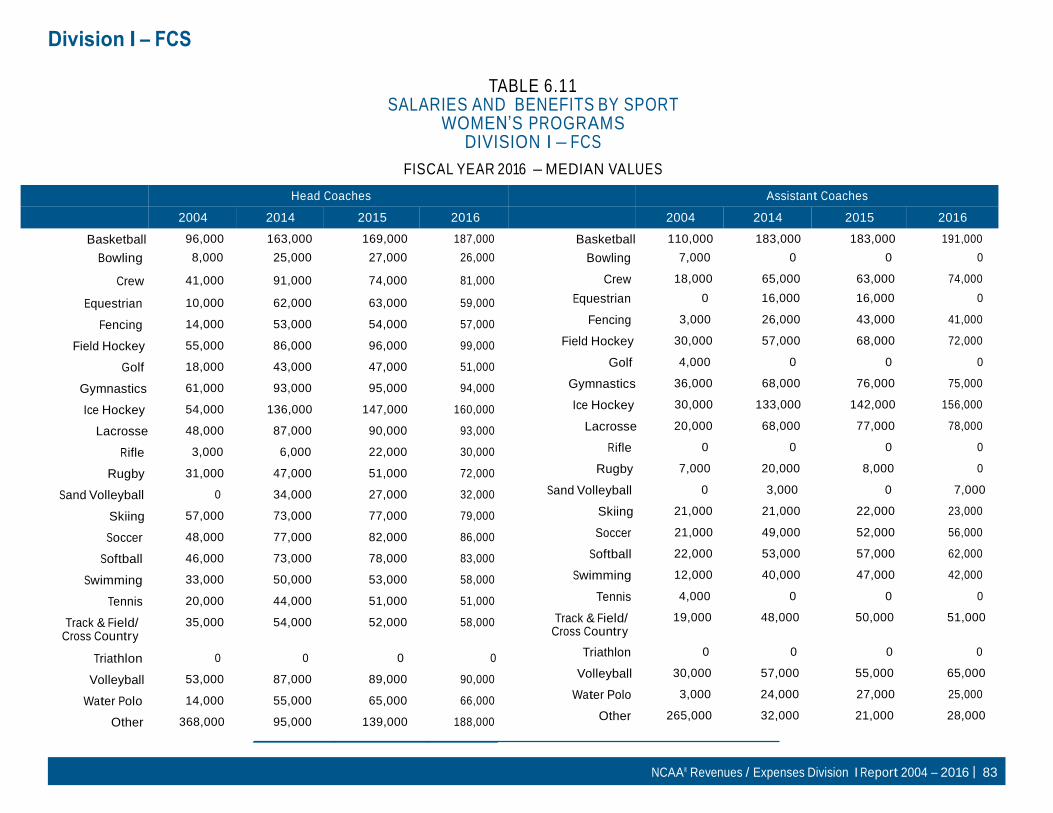
Division I – FCS
NCAA® Revenues / Expenses Division I Report 2004 – 2016 | 83
Basketball 96,000 163,000 169,000 187,000
Bowling 8,000 25,000 27,000 26,000
Crew 41,000 91,000 74,000 81,000
Equestrian 10,000 62,000 63,000 59,000
Fencing 14,000 53,000 54,000 57,000
Field Hockey 55,000 86,000 96,000 99,000
Golf 18,000 43,000 47,000 51,000
Gymnastics 61,000 93,000 95,000 94,000
Ice Hockey 54,000 136,000 147,000 160,000
Lacrosse 48,000 87,000 90,000 93,000
Rifle 3,000 6,000 22,000 30,000
Rugby 31,000 47,000 51,000 72,000
Sand Volleyball 0 34,000 27,000 32,000
Skiing 57,000 73,000 77,000 79,000
Soccer 48,000 77,000 82,000 86,000
Softball 46,000 73,000 78,000 83,000
Swimming 33,000 50,000 53,000 58,000
Tennis 20,000 44,000 51,000 51,000
Track & Field/ Cross Country
35,000 54,000 52,000 58,000
Triathlon 0 0 0 0
Volleyball 53,000 87,000 89,000 90,000
Water Polo 14,000 55,000 65,000 66,000
Other 368,000 95,000 139,000 188,000
Head Coaches
TABLE 6.11 SALARIES AND BENEFITS BY SPORT
WOMEN’S PROGRAMS DIVISION I – FCS
FISCAL YEAR 2016 – MEDIAN VALUES
Assistant Coaches
2004 2014 2015 2016
2004 2014 2015 2016
Basketball 110,000 183,000 183,000 191,000
Bowling 7,000 0 0 0
Crew 18,000 65,000 63,000 74,000
Equestrian 0 16,000 16,000 0
Fencing 3,000 26,000 43,000 41,000
Field Hockey 30,000 57,000 68,000 72,000
Golf 4,000 0 0 0
Gymnastics 36,000 68,000 76,000 75,000
Ice Hockey 30,000 133,000 142,000 156,000
Lacrosse 20,000 68,000 77,000 78,000
Rifle 0 0 0 0
Rugby 7,000 20,000 8,000 0
Sand Volleyball 0 3,000 0 7,000
Skiing 21,000 21,000 22,000 23,000
Soccer 21,000 49,000 52,000 56,000
Softball 22,000 53,000 57,000 62,000
Swimming 12,000 40,000 47,000 42,000
Tennis 4,000 0 0 0
Track & Field/ Cross Country
19,000 48,000 50,000 51,000
Triathlon 0 0 0 0
Volleyball 30,000 57,000 55,000 65,000
Water Polo 3,000 24,000 27,000 25,000
Other 265,000 32,000 21,000 28,000

Division I – FCS
NCAA® Revenues / Expenses Division I Report 2004 – 2016 | 84
Total Coaches
TABLE 6.11(CONTINUED) SALARIES AND BENEFITS BY SPORT
WOMEN’S PROGRAMS DIVISION I – FCS
FISCAL YEAR 2016 – MEDIAN VALUES
Administrative
2004 2014 2015 2016
Basketball 208,000 347,000 359,000 373,000
Bowling 8,000 29,000 42,000 43,000
Crew 57,000 163,000 149,000 157,000
Equestrian 10,000 90,000 81,000 77,000
Fencing 14,000 97,000 94,000 108,000
Field Hockey 89,000 147,000 161,000 169,000
Golf 20,000 51,000 53,000 59,000
Gymnastics 99,000 153,000 165,000 167,000
Ice Hockey 83,000 280,000 321,000 322,000
Lacrosse 69,000 147,000 166,000 171,000
Rifle 3,000 9,000 22,000 30,000
Rugby 38,000 68,000 53,000 78,000
Sand Volleyball 0 53,000 27,000 39,000
Skiing 78,000 95,000 100,000 102,000
Soccer 63,000 128,000 138,000 143,000
Softball 68,000 128,000 134,000 142,000
Swimming 44,000 93,000 93,000 94,000
Tennis 22,000 53,000 53,000 54,000
2004 2014 2015 2016
Basketball 22,000 13,000 0 0
Bowling 5,000 0 23,000 25,000
Crew 28,000 0 0 0
Equestrian 0 0 48,000 57,000
Fencing 0 0 0 0
Field Hockey 6,000 0 0 0
Golf 3,000 0 30,000 39,000
Gymnastics 1,000 0 2,000 1,000
Ice Hockey 11,000 7,000 0 0
Lacrosse 6,000 0 0 0
Rifle 0 0 0 0
Rugby 0 0 0 0
Sand Volleyball 0 0 0 0
Skiing 0 0 0 0
Soccer 4,000 0 0 0
Softball 4,000 0 0 0
Swimming 8,000 0 3,000 0
Tennis 1,000 0 1,000 0
Track & Field/ Cross Country
58,000 106,000 115,000 117,000
Track & Field/ Cross Country
4,000 0 0 0
Triathlon 0 0 0 0
Volleyball 77,000 140,000 140,000 154,000
Water Polo 17,000 72,000 86,000 88,000
Other 633,000 119,000 157,000 212,000
Triathlon 0 0 0 0
Volleyball 4,000 0 4,000 0
Water Polo 0 0 0 0
Other 2,000 0 2,000 0
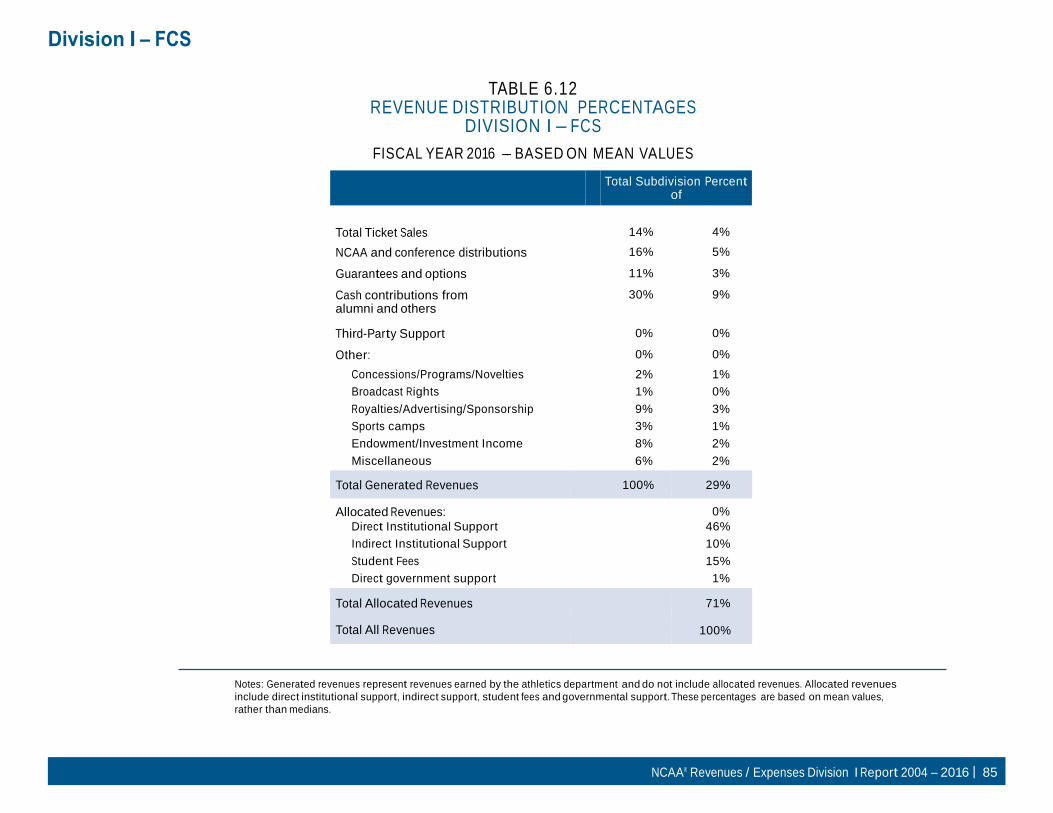
Division I – FCS
NCAA® Revenues / Expenses Division I Report 2004 – 2016 | 85
TABLE 6.12 REVENUE DISTRIBUTION PERCENTAGES
DIVISION I – FCS
FISCAL YEAR 2016 – BASED ON MEAN VALUES
Total Subdivision Percent of
Gen. Rev. Total Rev.
Total Ticket Sales 14% 4%
NCAA and conference distributions 16% 5%
Guarantees and options 11% 3%
Cash contributions from alumni and others
30% 9%
Third-Party Support 0% 0%
Other: 0% 0%
Concessions/Programs/Novelties 2% 1%
Broadcast Rights 1% 0%
Royalties/Advertising/Sponsorship 9% 3%
Sports camps 3% 1%
Endowment/Investment Income 8% 2%
Miscellaneous 6% 2%
Total Generated Revenues
100%
29%
Allocated Revenues: 0%
Direct Institutional Support 46%
Indirect Institutional Support 10%
Student Fees 15%
Direct government support 1%
Total Allocated Revenues
71%
Total All Revenues 100%
Notes: Generated revenues represent revenues earned by the athletics department and do not include allocated revenues. Allocated revenues
include direct institutional support, indirect support, student fees and governmental support. These percentages are based on mean values,
rather than medians.

Division I – FCS
NCAA® Revenues / Expenses Division I Report 2004 – 2016 | 86
Men 0% 0% Women 0% 0% Administrative and Non-gender 1% 0% Total 1%
TABLE 6.13 OPERATING EXPENSE DISTRIBUTION PERCENTAGES
DIVISION I – FCS PERCENT OF TOTAL EXPENSES
FISCAL YEAR 2016 – BASED ON MEAN VALUES
Grants-in-Aid
Total
Equipment/uniforms/supplies
Total
Men 14%
Women 12%
Administrative and Non-gender 1%
Total 26%
Guarantees and Options
Men 1%
Women 0%
Administrative and Non-gender 0%
Total 1%
Salaries and Benefits – University paid
Men 13%
Women 7%
Administrative and Non-gender 12%
Total 31%
Salaries and Benefits – Third Party paid
Men
Women
Administrative and Non-gender
Total 0%
Severance Pay
Men 0%
Women 0%
Administrative and Non-gender 0%
Total 0%
Team travel
Men 2%
Women 1%
Administrative and Non-gender 1%
Total 3%
Fundraising
Men 0%
Women 0%
Administrative and Non-gender 1%
Total 2%
Game Expenses
Men 1%
Women 1%
Administrative and Non-gender 0%
Total 3%
Medical
Membership Dues
Men 0%
Women 0%
Administrative and Non-gender 0%
Total 0%
Sports Camps
Men 0%
Men 5% Women 0%
Women 3% Administrative and Non-gender 0%
Administrative and Non-gender 0% Total 0%
Total 8%
Recruiting
Men 1%
Women 1%
Administrative and Non-gender 0%
Total 2%
Spirit Groups
Men 0%
Women 0%
Administrative and Non-gender 0%
Total 0%

Division I – FCS
NCAA® Revenues / Expenses Division I Report 2004 – 2016 | 87
TABLE 6.13 (CONTINUED) OPERATING EXPENSE DISTRIBUTION PERCENTAGES
DIVISION I – FCS PERCENT OF TOTAL EXPENSES
FISCAL YEAR 2016 – BASED ON MEAN VALUES
Total
Facilities Maintenance and Rental Men 1%
Women 0%
Administrative and Non-gender 6%
Total 8%
Indirect Institutional Support Men
1% Women 1%
Administrative and Non-gender 6%
Total 8%
Other Men
1% Women 0%
Administrative and Non-gender 3%
Total 5%
Total Operating Expenses Men
41% Women 26%
Administrative and Non-gender 33%
Total 100%
Note: These percentages are based on mean values, rather than medians.

NCAA® Revenues / Expenses Division I Report 2004 – 2016 | 88
DIVISION I WITHOUT FOOTBALL

NCAA® Revenues / Expenses Division I Report 2004 – 2016 | 89
Division I without football
TABLE 7.1 SUMMARY OF REVENUES, EXPENSES AND OPERATING RESULTS
DIVISION I WITHOUT FOOTBALL
FISCAL YEARS 2004, 2014-2016
Generated
Revenues Total
Revenues Total
Expenses Median Net
Revenue
2016
Men’s 960,000 4,509,000 5,498,000 (4,441,000)
Women’s 260,000 3,939,000 5,243,000 (4,821,000)
Coed 1,398,000 6,248,000 5,029,000 (3,266,000)
Total 2,842,000 16,018,000 15,956,000 (12,595,000)
2015 Men’s 952,000 4,549,000 5,126,000 (3,853,000)
Women’s 286,000 3,590,000 4,870,000 (4,598,000)
Coed 1,422,000 6,053,000 4,595,000 (3,033,000)
Total 2,915,000 15,243,000 15,066,000 (11,764,000)
2014 Men’s 912,000 4,043,000 4,820,000 (3,580,000)
Women’s 242,000 3,375,000 4,581,000 (4,275,000)
Coed 1,280,000 5,801,000 4,302,000 (2,876,000)
Total
2004
2,667,000 14,413,000 14,322,000 (11,245,000)
Men’s 463,000 2,273,000 2,584,000 (1,885,000)
Women’s 101,000 1,866,000 2,506,000 (2,277,000)
Coed 548,000 2,872,000 1,854,000 (1,178,000)
Total 1,469,000 7,281,000 7,147,000 (5,266,000)
Notes: Generated Revenues represent those earned by the athletics department and do not include allocated revenues. Allocated revenues come from
outside athletics and include Direct Institutional Support, Indirect Institutional Support, Student Fees and Governmental Support.

Division I without football
NCAA® Revenues / Expenses Division I Report 2004 – 2016 | 90
TABLE 7.2 SUMMARY DATA RESTATED IN 2004 DOLLARS
DIVISION I WITHOUT FOOTBALL MEDIAN VALUES
FISCAL YEARS 2004, 2014-2016
2016 (1.377)
Generated Revenues
Total Revenues
Total Expenses
Men’s 697,000 3,275,000 3,993,000
Women’s 188,000 2,860,000 3,807,000
Coed 1,016,000 4,538,000 3,652,000
Total 2,064,000 11,632,000 11,587,000
2015 (1.352)
Men’s 704,000 3,365,000 3,791,000
Women’s 212,000 2,655,000 3,602,000
Coed 1,052,000 4,477,000 3,399,000
Total 2,156,000 11,275,000 11,144,000
2014 (1.324) Men’s 689,000 3,053,000 3,640,000
Women’s 182,000 2,549,000 3,460,000
Coed 967,000 4,381,000 3,250,000
Total 2,014,000 10,886,000 10,817,000
2004 (1.000) Men’s 463,000 2,273,000 2,584,000
Women’s 101,000 1,866,000 2,506,000
Coed 548,000 2,872,000 1,854,000
Total 1,469,000 7,281,000 7,147,000
Notes: HEPI Values:
2004 = 231.7; 2005 = 240.8; 2006 = 253.1; 2007 = 260.3; 2008 = 273.2; 2009 = 279.3; 2010 = 281.8, 2011 = 288.4, 2012 = 293.2, 2013 = 297.8, 2014 = 306.7, 2015 =
313.3, 2016 = 319.0
Higher Education Price Index is an inflation index specifically to track the main cost drivers in higher education.
All values have been restated in terms of 2004 dollars to remove the effects of inflation.

Division I without football
NCAA® Revenues / Expenses Division I Report 2004 – 2016 | 91
2016
TABLE 7.3 PERCENTAGE CHANGE FROM PRIOR YEAR
DIVISION I WITHOUT FOOTBALL
FISCAL YEARS 2014-2016
— Generated Revenues — — Total Revenues — — Total Expenses —
Real Inflationary Total Real Inflationary Total Real Inflationary Total
Men’s -0.99% 1.83% 0.83% -2.67% 1.80% -0.88% 5.33% 1.93% 7.26%
Women’s -11.32% 1.98% -9.34% 7.72% 2.01% 9.73% 5.69% 1.95% 7.64%
Coed -3.42% 1.76% -1.66% 1.36% 1.87% 3.23% 7.44% 2.00% 9.45%
Total -4.27% 1.75% -2.52% 3.17% 1.91% 5.08% 3.98% 1.93% 5.90%
2015
Men’s 2.18% 2.25% 4.43% 10.22% 2.30% 12.52% 4.15% 2.20% 6.35%
Women’s 16.48% 1.98% 18.46% 4.16% 2.19% 6.35% 4.10% 2.21% 6.31%
8.79% 2.28% 11.07% 2.19% 2.15% 4.34% 4.58% 2.22% 6.80%
Total 7.05% 2.27% 9.32% 3.57% 2.18% 5.76% 3.02% 2.18% 5.20%
2014
Men’s 12.32% 3.39% 15.71% 1.07% 3.08% 4.15% 3.47% 3.15% 6.61%
Women’s -4.22% 3.18% -1.04% 2.60% 3.13% 5.73% 3.69% 3.15% 6.84%
Coed 9.77% 3.33% 13.10% -0.74% 3.02% 2.28% -0.54% 3.00% 2.46%
Total 6.59% 3.24% 9.83% 6.54% 3.24% 9.78% -0.88% 3.01% 2.13%
Notes: The Total Change reflects unadjusted amounts for the period. The Real Change reflects the change after removal
of the effects of inflation. The Inflationary Change is caused by the increase in the HEPI factors.

Division I without football
NCAA® Revenues / Expenses Division I Report 2004 – 2016 | 92
TABLE 7.4 TRENDS IN PROGRAM REVENUES AND EXPENSES
DIVISION I WITHOUT FOOTBALL
FISCAL YEARS 2004, 2014-2016
Generated Revenues Total Revenues Total Expenses
2016
Men’s Basketball
561,000
1,893,000
2,202,000 Women’s Basketball 72,000 1,249,000 1,517,000
2015
Men’s Basketball
539,000
1,835,000
2,144,000 Women’s Basketball 75,000 1,117,000 1,404,000
2014
Men’s Basketball
502,000
1,752,000
1,953,000 Women’s Basketball 66,000 1,067,000 1,371,000
2004
Men’s Basketball
298,000
959,000
1,057,000 Women’s Basketball 36,000 568,000 808,000
Notes: Generated Revenues represent those earned by the athletics department and do not include allocated revenues. Allocated revenues come from outside athletics and include Direct Institutional Support, Indirect Institutional Support, Student Fees and Governmental Support.
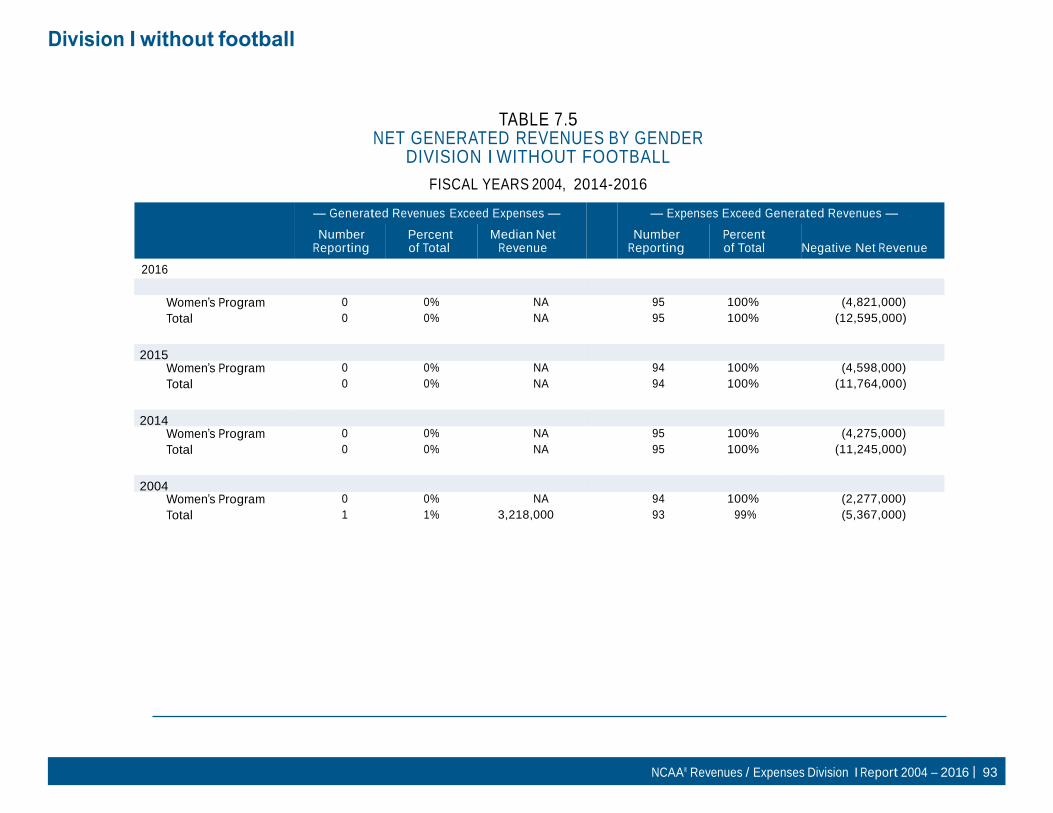
Division I without football
NCAA® Revenues / Expenses Division I Report 2004 – 2016 | 93
TABLE 7.5 NET GENERATED REVENUES BY GENDER
DIVISION I WITHOUT FOOTBALL
FISCAL YEARS 2004, 2014-2016
— Generated Revenues Exceed Expenses — — Expenses Exceed Generated Revenues —
2016
Number Reporting
Percent of Total
Median Net Revenue
Number Reporting
Percent of Total Negative Net Revenue
Men’s Program
1
1%
135,000
94
99%
(4,445,000) Women’s Program 0 0% NA 95 100% (4,821,000)
Total 0 0% NA 95 100% (12,595,000)
2015
Men’s Program
2
2%
1,828,000
92
98%
(3,912,000) Women’s Program 0 0% NA 94 100% (4,598,000)
Total 0 0% NA 94 100% (11,764,000)
2014
Men’s Program
2
2%
2,812,000
93
98%
(3,677,000) Women’s Program 0 0% NA 95 100% (4,275,000)
Total 0 0% NA 95 100% (11,245,000)
2004
Men’s Program
1
1%
934,000
93
99%
(1,894,000) Women’s Program 0 0% NA 94 100% (2,277,000)
Total 1 1% 3,218,000 93 99% (5,367,000)

Division I without football
NCAA® Revenues / Expenses Division I Report 2004 – 2016 | 94
TABLE 7.6 NET GENERATED REVENUES BY PROGRAM
DIVISION I WITHOUT FOOTBALL
FISCAL YEARS 2004, 2014-2016
— Generated Revenues Exceed Expenses — — Expenses Exceed Generated Revenues —
2016
Number Reporting
Percent of Total
Median Net Revenue
Number Reporting
Percent of Total Negative Net Revenue
Men’s Basketball 5 5% 1,742,000 90 95% (1,573,000)
Women’s Basketball 0 0% NA 95 100% (1,415,000)
2015
Men’s Basketball 6 6% 841,000 88 94% (1,445,000)
Women’s Basketball 0 0% NA 94 100% (1,308,000)
2014
Men’s Basketball 7 7% 885,000 88 93% (1,358,000)
Women’s Basketball 0 0% NA 95 100% (1,257,000)
2004
Men’s Basketball 8 8% 704,000 86 83% (640,000)
Women’s Basketball 0 0% N/A 94 100% (686,000)

Division I without football
NCAA® Revenues / Expenses Division I Report 2004 – 2016 | 95
TABLE 7.7 SOURCES OF REVENUES
DIVISION I WITHOUT FOOTBALL
FISCAL YEAR 2016 – MEDIAN VALUES
2016
Total Ticket Sales 228,000
NCAA and conference distributions 594,000
Guarantees and options 240,000
Cash contributions from alumni and others 705,000
Third-Party Support 0
Other:
Concessions/Programs/Novelties 13,000
Broadcast Rights 0
Royalties/Advertising/Sponsorship 318,000
Sports camps 9,000
Endowment/Investment Income 33,000
Miscellaneous 0
Total Generated Revenues 2,842,000
Allocated Revenues:
Direct Institutional Support
9,216,000
Indirect Institutional Support 1,058,000
Student Fees 461,000
Direct government support 0
Total Allocated Revenues 12,633,000
Total All Revenues 16,018,000

Division I without football
NCAA® Revenues / Expenses Division I Report 2004 – 2016 | 96
TABLE 7.8 OPERATING EXPENSES BY OBJEC TS OF EXPENDITURE
DIVISION I WITHOUT FOOTBALL
FISCAL YEAR 2016 – MEDIAN VALUES
Grants-in-Aid
Total Total
Equipment/uniforms/supplies
Men 2,003,000
Women 2,438,000
Administrative and Non-gender 29,000
Total 4,646,000
Guarantees and Options
Men 27,000
Women 5,000
Administrative and Non-gender 0
Total 36,000
Salaries and Benefits – University paid
Men 1,544,000
Women 1,272,000
Administrative and Non-gender 2,051,000
Total 5,085,000
Salaries and Benefits – Third Party paid
Men 0
Women 0
Administrative and Non-gender 0
Total 0
Severance Pay
Men 0
Women 0
Administrative and Non-gender 0
Total 0
Team travel
Men 693,000
Women 553,000
Administrative and Non-gender 1,000
Total 1,251,000
Recruiting
Men 129,000
Women 99,000
Administrative and Non-gender 0
Total 233,000
Men 221,000
Women 176,000
Administrative and Non-gender 30,000
Total 460,000
Fundraising
Men 11,000
Women 5,000
Administrative and Non-gender 176,000
Total 225,000
Game Expenses
Men 148,000
Women 103,000
Administrative and Non-gender 32,000
Total 336,000
Medical
Men 0
Women 0
Administrative and Non-gender 166,000
Total 201,000
Membership Dues
Men 5,000
Women 5,000
Administrative and Non-gender 38,000
Total 55,000
Sports Camps
Men 0
Women 0
Administrative and Non-gender 0
Total 0
Spirit Groups
Men 0
Women 0
Administrative and Non-gender 24,000
Total 28,000

Division I without football
NCAA® Revenues / Expenses Division I Report 2004 – 2016 | 97
TABLE 7.8 (CONTINUED) OPERATING EXPENSES BY OBJEC TS OF EXPENDITURE
DIVISION I WITHOUT FOOTBALL
FISCAL YEAR 2016 – MEDIAN VALUES
Total
Facilities Maintenance and Rental Men 52,000
Women 30,000
Administrative and Non-gender 298,000
Total 536,000
Indirect Institutional Support
Men
0 Women 0
Administrative and Non-gender 555,000
Total 788,000
Other
Men
95,000 Women 61,000
Administrative and Non-gender 380,000
Total 562,000
Total Operating Expenses
Men
5,498,000 Women 5,243,000
Administrative and Non-gender 5,029,000
Total 15,956,000
Total 15,956,000

Division I without football
NCAA® Revenues / Expenses Division I Report 2004 – 2016 | 98
TABLE 7.9 TOTAL GENERATED REVENUES AND EXPENSES BY SPORT
DIVISION I WITHOUT FOOTBALL
FISCAL YEAR 2016 – MEDIAN VALUES
— Men’s Programs — — Women’s Programs —
Sport
# of Institutions
Sponsoring
Generated Revenues
Expenses
Net Revenue
# of Institutions
Sponsoring
Generated Revenues
Expenses
Net Revenue
Baseball 79 87,000 945,000 (58,000) N/A N/A N/A N/A
Basketball 95 561,000 2,202,000 (6,000) 95 72,000 1,517,000 (81,000)
Bowling 0 0 0 0 6 0 227,000 (36,000)
Crew 0 0 0 0 19 26,000 347,000 0
Equestrian 0 0 0 0 1 1,000 212,000 (211,000)
Fencing 4 4,000 180,000 0 5 3,000 196,000 0
Field Hockey N/A N/A N/A N/A 17 33,000 709,000 0
Golf 79 34,000 245,000 (5,000) 60 15,000 278,000 (15,000)
Gymnastics 1 45,000 139,000 (17,000) 3 59,000 1,224,000 0
Ice Hockey 9 1,084,000 2,926,000 0 5 26,000 1,945,000 (308,000)
Lacrosse 23 64,000 1,060,000 0 31 31,000 620,000 0
Rifle 0 0 0 0 0 0 0 0
Rugby 0 0 0 0 1 0 851,000 0
Sand Volleyball 0 0 0 0 16 3,000 88,000 (45,000)
Skiing 3 39,000 535,000 56,000 3 38,000 526,000 (21,000)
Soccer 84 39,000 745,000 0 88 25,000 756,000 (3,000)
Softball N/A N/A N/A N/A 72 31,000 646,000 (25,000)
Swimming 38 19,000 307,000 0 49 19,000 353,000 (4,000)
Tennis 74 6,000 251,000 (2,000) 84 5,000 311,000 (4,000)
Track & Field/ Cross Country
89 11,000 422,000 (32,000) 93 9,000 457,000 (32,000)
Triathlon 0 0 0 0 1 26,000 110,000 (84,000)
Volleyball 9 135,000 681,000 (253,000) 87 22,000 724,000 (51,000)
Water Polo 11 57,000 315,000 0 13 25,000 307,000 (17,000)
Wrestling 10 69,000 639,000 0 0 0 0 0
Other 8 38,000 169,000 (28,000) 4 42,000 367,000 1,000
Note: Revenues are reported excluding all allocated revenues. Expenses are reported excluding third-party support. Medians shown represent only those institutions reporting some amount for revenues or expenses.
# of Institutions Sponsoring represents the N that reported financial data for each of the sports listed. These N’s do not reflect the overall sponsorship numbers.
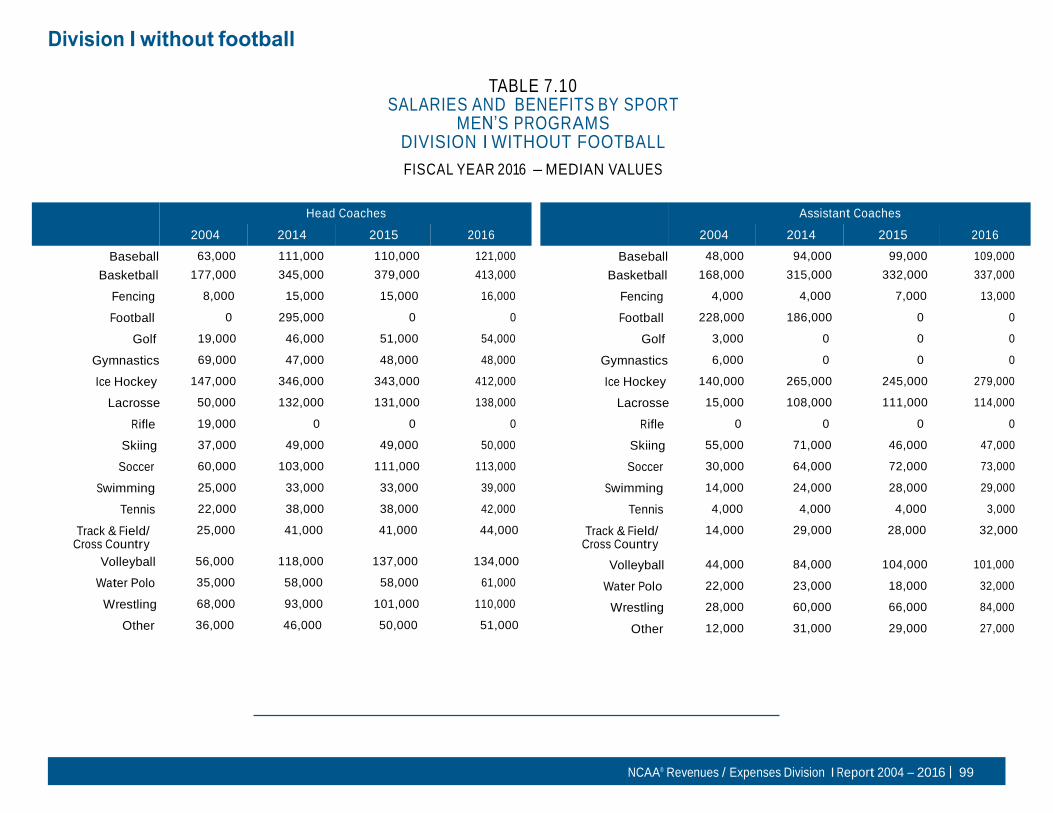
Division I without football
NCAA® Revenues / Expenses Division I Report 2004 – 2016 | 99
Volleyball 44,000 84,000 104,000 101,000
Water Polo 22,000 23,000 18,000 32,000
Wrestling 28,000 60,000 66,000 84,000
Other 12,000 31,000 29,000 27,000
TABLE 7.10 SALARIES AND BENEFITS BY SPORT
MEN’S PROGRAMS DIVISION I WITHOUT FOOTBALL
FISCAL YEAR 2016 – MEDIAN VALUES
Head Coaches
2004 2014 2015 2016
Baseball 63,000 111,000 110,000 121,000
Basketball 177,000 345,000 379,000 413,000
Fencing 8,000 15,000 15,000 16,000
Football 0 295,000 0 0
Golf 19,000 46,000 51,000 54,000
Gymnastics 69,000 47,000 48,000 48,000
Ice Hockey 147,000 346,000 343,000 412,000
Lacrosse 50,000 132,000 131,000 138,000
Rifle 19,000 0 0 0
Skiing 37,000 49,000 49,000 50,000
Soccer 60,000 103,000 111,000 113,000
Swimming 25,000 33,000 33,000 39,000
Tennis 22,000 38,000 38,000 42,000
Assistant Coaches
2004 2014 2015 2016
Baseball 48,000 94,000 99,000 109,000
Basketball 168,000 315,000 332,000 337,000
Fencing 4,000 4,000 7,000 13,000
Football 228,000 186,000 0 0
Golf 3,000 0 0 0
Gymnastics 6,000 0 0 0
Ice Hockey 140,000 265,000 245,000 279,000
Lacrosse 15,000 108,000 111,000 114,000
Rifle 0 0 0 0
Skiing 55,000 71,000 46,000 47,000
Soccer 30,000 64,000 72,000 73,000
Swimming 14,000 24,000 28,000 29,000
Tennis 4,000 4,000 4,000 3,000
Track & Field/ Cross Country
25,000 41,000 41,000 44,000
Track & Field/ Cross Country
14,000 29,000 28,000 32,000
Volleyball 56,000 118,000 137,000 134,000
Water Polo 35,000 58,000 58,000 61,000
Wrestling 68,000 93,000 101,000 110,000
Other 36,000 46,000 50,000 51,000
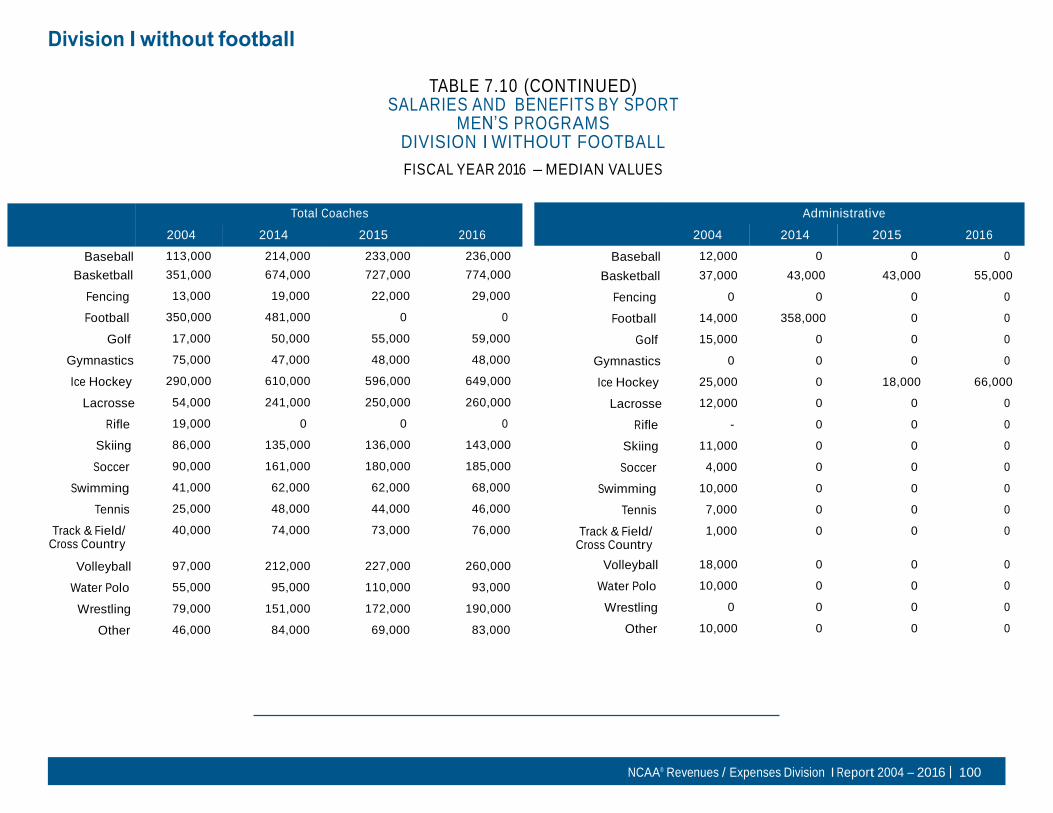
Division I without football
NCAA® Revenues / Expenses Division I Report 2004 – 2016 | 100
TABLE 7.10 (CONTINUED) SALARIES AND BENEFITS BY SPORT
MEN’S PROGRAMS DIVISION I WITHOUT FOOTBALL
FISCAL YEAR 2016 – MEDIAN VALUES
Total Coaches
2004 2014 2015 2016
Administrative
2004 2014 2015 2016
Baseball 113,000 214,000 233,000 236,000 Baseball 12,000 0 0 0
Basketball 351,000 674,000 727,000 774,000 Basketball 37,000 43,000 43,000 55,000
Fencing 13,000 19,000 22,000 29,000 Fencing 0 0 0 0
Football 350,000 481,000 0 0 Football 14,000 358,000 0 0
Golf 17,000 50,000 55,000 59,000 Golf 15,000 0 0 0
Gymnastics 75,000 47,000 48,000 48,000 Gymnastics 0 0 0 0
Ice Hockey 290,000 610,000 596,000 649,000 Ice Hockey 25,000 0 18,000 66,000
Lacrosse 54,000 241,000 250,000 260,000 Lacrosse 12,000 0 0 0
Rifle 19,000 0 0 0 Rifle - 0 0 0
Skiing 86,000 135,000 136,000 143,000 Skiing 11,000 0 0 0
Soccer 90,000 161,000 180,000 185,000 Soccer 4,000 0 0 0
Swimming 41,000 62,000 62,000 68,000 Swimming 10,000 0 0 0
Tennis 25,000 48,000 44,000 46,000 Tennis 7,000 0 0 0
Track & Field/ Cross Country
40,000 74,000 73,000 76,000 Track & Field/ Cross Country
1,000 0 0 0
Volleyball 97,000 212,000 227,000 260,000 Volleyball 18,000 0 0 0
Water Polo 55,000 95,000 110,000 93,000 Water Polo 10,000 0 0 0
Wrestling 79,000 151,000 172,000 190,000 Wrestling 0 0 0 0
Other 46,000 84,000 69,000 83,000 Other 10,000 0 0 0

Division I without football
NCAA® Revenues / Expenses Division I Report 2004 – 2016 | 101
TABLE 7.11 SALARIES AND BENEFITS BY SPORT
WOMEN’S PROGRAMS DIVISION I WITHOUT FOOTBALL
FISCAL YEAR 2016 – MEDIAN VALUES
Head Coaches
2004 2014 2015 2016
Assistant Coaches
2004 2014 2015 2016
Basketball 106,000 180,000 186,000 195,000 Basketball 129,000 225,000 235,000 247,000
Bowling 10,000 22,000 24,000 26,000 Bowling 4,000 0 0 3,000
Crew 43,000 62,000 66,000 64,000 Crew 14,000 44,000 42,000 45,000
Equestrian 8,000 53,000 55,000 54,000 Equestrian 0 0 0 0
Fencing 9,000 14,000 14,000 26,000 Fencing 4,000 6,000 6,000 4,000
Field Hockey 53,000 86,000 90,000 96,000 Field Hockey 15,000 62,000 59,000 79,000
Golf 23,000 49,000 51,000 55,000 Golf 5,000 0 0 0
Gymnastics 68,000 90,000 82,000 118,000 Gymnastics 66,000 52,000 36,000 76,000
Ice Hockey 81,000 193,000 198,000 199,000 Ice Hockey 54,000 155,000 159,000 167,000
Lacrosse 42,000 70,000 73,000 77,000 Lacrosse 17,000 52,000 56,000 56,000
Rifle 7,000 0 0 0 Rifle 5,000 0 0 0
Rugby 0 85,000 71,000 101,000 Rugby 0 30,000 49,000 49,000
Sand Volleyball 0 29,000 28,000 33,000 Sand Volleyball 0 10,000 9,000 10,000
Skiing 37,000 49,000 49,000 50,000 Skiing 55,000 45,000 67,000 79,000
Soccer 51,000 89,000 91,000 96,000 Soccer 30,000 61,000 66,000 70,000
Softball 47,000 82,000 81,000 81,000 Softball 20,000 53,000 59,000 65,000
Swimming 27,000 40,000 39,000 42,000 Swimming 17,000 26,000 24,000 29,000
Tennis 22,000 37,000 38,000 47,000 Tennis 4,000 3,000 3,000 3,000
Track & Field/ Cross Country
26,000 47,000 47,000 50,000 Track & Field/ Cross Country
15,000 36,000 35,000 39,000
Triathlon 0 0 0 0 Triathlon 0 0 0 0
Volleyball 55,000 88,000 96,000 97,000 Volleyball 33,000 61,000 63,000 73,000
Water Polo 37,000 58,000 58,000 58,000 Water Polo 19,000 17,000 16,000 14,000
Other 50,000 56,000 67,000 66,000 Other 27,000 19,000 25,000 33,000

Division I without football
NCAA® Revenues / Expenses Division I Report 2004 – 2016 | 102
Basketball
26,000
19,000
30,000
30,000
Bowling 0 0 0 0
Crew 5,000 0 0 0
Equestrian 0 0 0 0
Fencing 0 0 0 0
Field Hockey 10,000 0 0 0
Golf 3,000 0 0 0
Gymnastics 13,000 0 0 0
Ice Hockey 7,000 0 17,000 16,000
Lacrosse 0 0 0 0
Rifle 0 0 0 0
Rugby 0 0 0 0
Sand Volleyball 0 0 0 0
Skiing 11,000 0 0 0
Soccer 3,000 0 0 0
Softball 1,000 0 0 0
Swimming 1,000 0 0 0
Tennis 8,000 0 0 0
Track & Field/ Cross Country
8,000 0 0 0
Triathlon 0 0 0 0
Volleyball 2,000 0 0 0
Water Polo 8,000 0 0 0
Other 0 0 0 0
TABLE 7.11 (CONTINUED) SALARIES AND BENEFITS BY SPORT
WOMEN’S PROGRAMS DIVISION I WITHOUT FOOTBALL
FISCAL YEAR 2016 – MEDIAN VALUES
Total Coaches
2004 2014 2015 2016
Administrative
2004 2014 2015 2016
Basketball 234,000 399,000 433,000 445,000
Bowling 11,000 27,000 31,000 32,000
Crew 62,000 105,000 112,000 119,000
Equestrian 8,000 53,000 55,000 54,000
Fencing 13,000 20,000 21,000 30,000
Field Hockey 66,000 143,000 155,000 186,000
Golf 28,000 60,000 57,000 61,000
Gymnastics 97,000 142,000 117,000 195,000
Ice Hockey 132,000 348,000 357,000 360,000
Lacrosse 56,000 124,000 127,000 132,000
Rifle 10,000 0 0 0
Rugby 0 115,000 120,000 151,000
Sand Volleyball 0 36,000 38,000 42,000
Skiing 86,000 135,000 136,000 143,000
Soccer 78,000 150,000 154,000 173,000
Softball 65,000 132,000 142,000 147,000
Swimming 44,000 70,000 63,000 75,000
Tennis 25,000 48,000 46,000 53,000
Track & Field/ Cross Country
40,000 86,000 85,000 91,000
Triathlon 0 0 0 0
Volleyball 83,000 154,000 155,000 164,000
Water Polo 43,000 95,000 92,000 93,000
Other 76,000 77,000 92,000 105,000

Division I without football
NCAA® Revenues / Expenses Division I Report 2004 – 2016 | 103
TABLE 7.12 REVENUE DISTRIBUTION PERCENTAGES
DIVISION I WITHOUT FOOTBALL
FISCAL YEAR 2016 – BASED ON MEAN VALUES
Total Subdivision Percent of
Gen. Rev. Total Rev.
Total Ticket Sales 18% 4%
NCAA and conference distributions 18% 4%
Guarantees and options 6% 1%
Cash contributions from alumni and others
29% 7%
Third-Party Support 1% 0%
Other: 0% 0%
Concessions/Programs/Novelties 2% 0%
Broadcast Rights 3% 1%
Royalties/Advertising/Sponsorship 12% 3%
Sports camps 3% 1%
Endowment/Investment Income 2% 1%
Miscellaneous 7% 2%
Total Generated Revenues
100%
23%
Allocated Revenues: 0%
Direct Institutional Support 52%
Indirect Institutional Support 10%
Student Fees 15%
Direct government support 0%
Total Allocated Revenues
77%
Total All Revenues 100%
Notes: Generated revenues represent revenues earned by the athletics department and do not include allocated revenues. Allocated revenues
include direct institutional support, indirect support, student fees and governmental support. These percentages are based on mean values,
rather than medians.

Division I without football
NCAA® Revenues / Expenses Division I Report 2004 – 2016 | 104
Men 0% 0% Women 0% 0% Administrative and Non-gender 1% 0% Total 1%
TABLE 7.13 OPERATING EXPENSE DISTRIBUTION PERCENTAGES
DIVISION I WITHOUT FOOTBALL PERCENT OF TOTAL EXPENSES
FISCAL YEAR 2016 – BASED ON MEAN VALUES
Grants-in-Aid
Total
Equipment/uniforms/supplies
Total
Men 12%
Women 16%
Administrative and Non-gender 1%
Total 29%
Guarantees and Options
Men 1%
Women 0%
Administrative and Non-gender 0%
Total 1%
Salaries and Benefits – University paid
Men 11%
Women 8%
Administrative and Non-gender 12%
Total 32%
Salaries and Benefits – Third Party paid
Men
Women
Administrative and Non-gender
Total 0%
Severance Pay
Men 0%
Women 0%
Administrative and Non-gender 0%
Total 0%
Team travel
Men 1%
Women 1%
Administrative and Non-gender 1%
Total 3%
Fundraising
Men 0%
Women 0%
Administrative and Non-gender 2%
Total 2%
Game Expenses
Men 1%
Women 1%
Administrative and Non-gender 0%
Total 2%
Medical
Membership Dues
Men 0%
Women 0%
Administrative and Non-gender 0%
Total 0%
Sports Camps
Men 0%
Men 5% Women 0%
Women 4% Administrative and Non-gender 0%
Administrative and Non-gender 0% Total 0%
Total 8%
Recruiting
Men 1%
Women 1%
Administrative and Non-gender 0%
Total 2%
Spirit Groups
Men 0%
Women 0%
Administrative and Non-gender 0%

Division I without football
NCAA® Revenues / Expenses Division I Report 2004 – 2016 | 105
TABLE 7.13 (CONTINUED) OPERATING EXPENSE DISTRIBUTION PERCENTAGES
DIVISION I WITHOUT FOOTBALL PERCENT OF TOTAL EXPENSES
FISCAL YEAR 2016 – BASED ON MEAN VALUES
Total
Facilities Maintenance and Rental Men 1%
Women 0%
Administrative and Non-gender 5%
Total 6%
Indirect Institutional Support Men
1% Women 1%
Administrative and Non-gender 7%
Total 8%
Other Men
1% Women 1%
Administrative and Non-gender 3%
Total 4%
Total Operating Expenses Men
36% Women 32%
Administrative and Non-gender 32%
Total 100%
Note: These percentages are based on mean values, rather than medians.

Appendix A – Objectives and Methods
NCAA® Revenues / Expenses Division I Report 2004 – 2016 | 106
Objectives. The primary objective of the 2017 edition of this report is to update the information in previous reports. Current data are presented concerning sources of revenues (ticket sales, television, etc.) and objects of expenditures (grants-in-aid, coaches' salaries, etc.). Revenue and expense data are categorized by program (men's and women's) and by the specific sports of football and basketball. Limited information is also presented for other NCAA-sanctioned sports. An additional objective is to provide a basis for analysis of the revenue and expense trends of athletics programs within each of the respective Division I subdivisions. Thus, all data for a particular subdivision are shown in a self-contained section in the report, although some summary data for all Division I member institutions are provided in a summary section at the beginning of the report. This is also the first report that contains data separated by the two categories of FBS institutions (i.e., Autonomy and Non-Autonomy). Additionally, Section VIII of the report provides aggregated data for all Division I basketball programs. A final objective of the report is to provide data relevant to gender issues. Tables throughout the report provide comparisons of revenues and expenses of men's and women's programs within each subdivision. Additional information regarding gender issues may be found in other NCAA publications.
Methods. All NCAA Division I member institutions, including provisional members, provide data annually via the NCAA Financial Reporting System. In all cases, respondents are clearly instructed to limit their responses to intercollegiate athletics only, excluding intramural and club sports. Collection instructions also request that data be separated by gender, which enables data for men's and women's programs to be presented separately. The financial data requested included: Total revenues and expenses by program (men's and women's); Total revenues and expenses by sport; Total revenues by source (e.g., ticket sales, student fees and television receipts); Total expenses by expense object (e.g., grants-in-aid, salaries and travel); and categorized salary information. Organizational data, such as the number of participating athletes, the number of sports offered, the cost of grants-in-aid and other similar information, also are requested. Some of those data are presented in this report, while others may be found in other NCAA publications. (www.NCAA.org) Since response rates for all three subdivisions were 100 percent, readers are able to compare financial results for one member institution with the median and mean results for other members in the same subdivision. Readers may determine how their institutions' athletics programs are faring, relative to other similar institutions. They also may see how their institutions' financial trends in recent years compare with the trends for similar institutions. Some comparisons also may be drawn among the results in the various subdivisions. These comparisons are presented in tabular form in the summary section of the report. NOTE: Because confidentiality was assured to respondents, neither the NCAA nor the author is able to provide data from individual institutions. To obtain such financial information, readers are directed to the U.S. Department of Education website to obtain EADA information for specific institutions. Readers should be cautioned that the Department of Education EADA reports do not eliminate allocated revenues from the data. The result is that many, if not most, institutions report break-even results, since institutional support covers any resulting deficit.
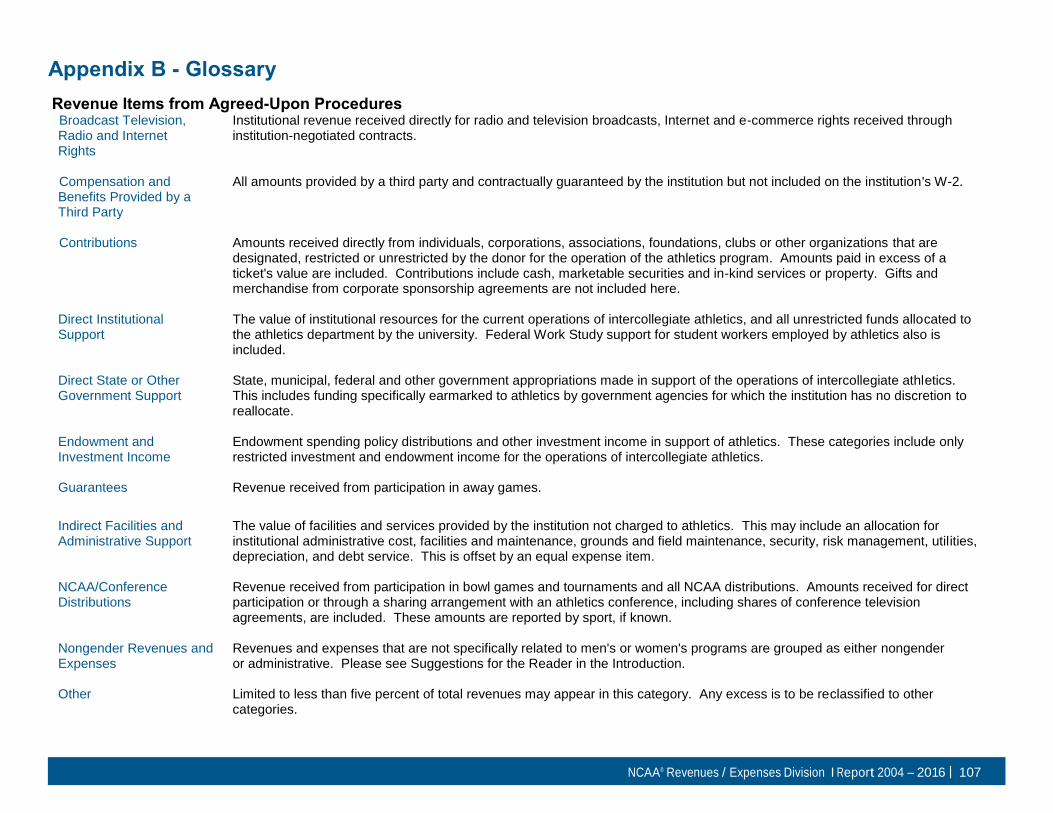
NCAA® Revenues / Expenses Division I Report 2004 – 2016 | 107
Appendix B - Glossary
Revenue Items from Agreed-Upon Procedures Broadcast Television, Radio and Internet Rights
Institutional revenue received directly for radio and television broadcasts, Internet and e-commerce rights received through institution-negotiated contracts.
Compensation and Benefits Provided by a Third Party
All amounts provided by a third party and contractually guaranteed by the institution but not included on the institution's W-2.
Contributions Amounts received directly from individuals, corporations, associations, foundations, clubs or other organizations that are designated, restricted or unrestricted by the donor for the operation of the athletics program. Amounts paid in excess of a ticket's value are included. Contributions include cash, marketable securities and in-kind services or property. Gifts and merchandise from corporate sponsorship agreements are not included here.
Direct Institutional Support
The value of institutional resources for the current operations of intercollegiate athletics, and all unrestricted funds allocated to the athletics department by the university. Federal Work Study support for student workers employed by athletics also is included.
Direct State or Other Government Support
State, municipal, federal and other government appropriations made in support of the operations of intercollegiate athletics. This includes funding specifically earmarked to athletics by government agencies for which the institution has no discretion to reallocate.
Endowment and Investment Income
Endowment spending policy distributions and other investment income in support of athletics. These categories include only restricted investment and endowment income for the operations of intercollegiate athletics.
Guarantees Revenue received from participation in away games.
Indirect Facilities and Administrative Support
The value of facilities and services provided by the institution not charged to athletics. This may include an allocation for institutional administrative cost, facilities and maintenance, grounds and field maintenance, security, risk management, utilities, depreciation, and debt service. This is offset by an equal expense item.
NCAA/Conference Distributions
Revenue received from participation in bowl games and tournaments and all NCAA distributions. Amounts received for direct participation or through a sharing arrangement with an athletics conference, including shares of conference television agreements, are included. These amounts are reported by sport, if known.
Nongender Revenues and Expenses
Revenues and expenses that are not specifically related to men's or women's programs are grouped as either nongender or administrative. Please see Suggestions for the Reader in the Introduction.
Other Limited to less than five percent of total revenues may appear in this category. Any excess is to be reclassified to other categories.

NCAA® Revenues / Expenses Division I Report 2004 – 2016 | 108
Program Sales, Concessions, Novelty Sales and Parking
Revenue derived from game programs, novelties, food or other concessions, and parking. This does not include sales of game program advertising.
Royalties, Licensing, Advertisements, and Sponsorships
All revenue from corporate sponsorships, licensing, sales of advertisements, trademarks and royalties. In-kind products and services are included.
Sports-Camp Revenues
Amounts received by athletics for sports camps and clinics.
Student Fees Student fees assessed by the institution and restricted for support of intercollegiate athletics.
Ticket Sales Revenue received for sales of admissions to athletics events. Included are ticket sales to the public, faculty and students,
and money received for shipping and handling of tickets. Not included are ticket sales for conference and national tournaments that are pass-through transactions.
Expense Items from Agreed-Upon Procedures Athletic Student Aid The total amount of athletically related student aid awarded, including summer school and tuition discounts and waivers
(including aid given to student-athletes who have exhausted their eligibility or who are inactive due to medical reasons).
Coaching Other Compensation and Benefits Paid by a Third Party
All compensation paid to the coaching staff by a third party and contractually guaranteed by the institution but not included on the institution's W-2. Examples include shoe and apparel contract revenue, housing allowances, compensation from camps, and television and radio income.
Coaching Salaries, Benefits and Bonuses Paid by the University
Gross salaries, bonuses and benefits provided to head and assistant coaches, which includes all amounts attributable to coaching that would be reportable on the university or related entity W-2 and/or 1099 forms. Examples include car stipend, club membership, entertainment allowance, clothing allowance, television income and tuition remission.
Direct Facilities, Maintenance, and Rental
Direct facilities costs charged to intercollegiate athletics, including building and grounds maintenance, utilities, rental fees, operating leases, equipment repair and maintenance, and debt service.
Equipment, Uniforms and Supplies
Includes only items that are provided to teams. Equipment amounts are those expended from current or operating funds.
Fundraising, Marketing and Promotion
Costs associated with fundraising, marketing and promotion for media guides, brochures, recruiting publications and other such expenditures.
Game Expenses Game-day expenses other than travel that are necessary for intercollegiate athletics competition, including officials, security, event staff, ambulance and other such expenditures.

NCAA® Revenues / Expenses Division I Report 2004 – 2016 | 109
Guarantees Amounts paid to visiting participating institutions.
Indirect Facilities and Administrative Support
The value of facilities and services provided by the institution and not charged to athletics. This support may include an allocation for institutional administrative cost, facilities and maintenance, grounds and field maintenance, security, risk management, utilities, depreciation, and debt service. This is offset by an equal amount of revenue.
Medical Expenses and Medical Insurance
Medical expense and medical insurance premiums for student-athletes.
Memberships and Dues Includes memberships, and conference and association dues.
Other Operating Expenses Include printing and duplicating, subscriptions, business insurance, telephone, postage, operating and equipment leases, nonteam travel, and any other operating expense not reported elsewhere. Indirect administration overhead provided by the university is not included.
Recruiting Transportation, lodging and meals for prospective student-athletes and institutional personnel on official and unofficial visits, telephone charges, postage and other such expenditures related to recruiting. Also included is the value of the use of the university's vehicles or airplanes, and the in-kind value of loaned or contributed transportation.
Severance Payments Severance payments and applicable benefits recognized for past coaching and administrative personnel.
Spirit Groups Includes support provided for spirit groups, including bands, cheerleaders, mascots, dance teams, etc.
Sports-Camp Expenses All expenses paid by athletics, including nonathletics personnel salaries and benefits, from hosting sports camps and clinics.
Support Staff/ Administrative Salaries, Benefits and Bonuses Paid by a Third Party
Includes all compensation paid to the support staff by a third party and guaranteed by the university but included in the W-2 or 1099 forms of the institution. Examples include car stipends, club memberships, clothing allowances, speaking fees, radio and television income, and other related expenditures or in-kind products or services.
Support Staff/ Administrative Salaries, Benefits and Bonuses Paid by the University and Related Entities
Gross salaries, bonuses and benefits paid to administrative staff (e.g., football secretary and trainers) that would be reportable on university or related entities W-2 or 1099 forms. Examples include car stipends, club memberships, clothing allowances, speaking fees, radio and television income, and other related expenditures or in-kind products or services.
Team Travel Air and ground travel, lodging, meals and incidentals for competition related to pre-season, regular season, and/or postseason. Any amounts incurred for food and lodging for housing a team before a home game also should be included, as should the value of the use of the institution's owned vehicles or airplanes and in-kind value of donor-provided transportation.
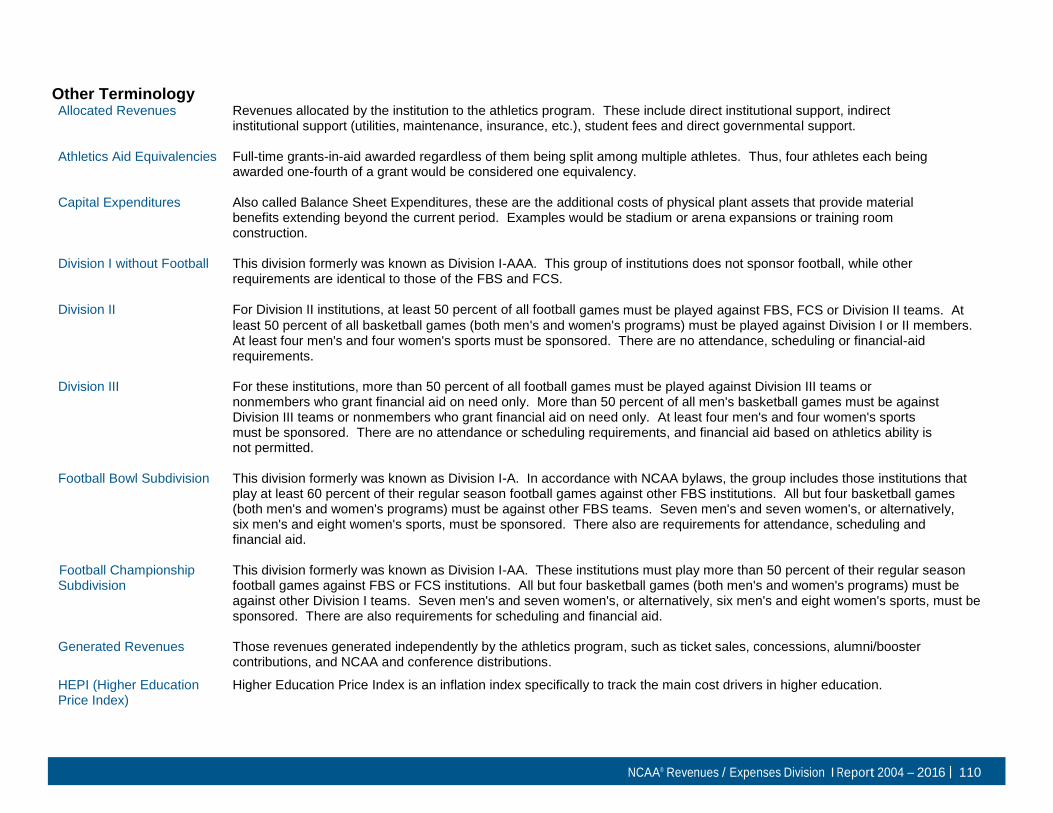
NCAA® Revenues / Expenses Division I Report 2004 – 2016 | 110
Other Terminology Allocated Revenues Revenues allocated by the institution to the athletics program. These include direct institutional support, indirect
institutional support (utilities, maintenance, insurance, etc.), student fees and direct governmental support.
Athletics Aid Equivalencies Full-time grants-in-aid awarded regardless of them being split among multiple athletes. Thus, four athletes each being awarded one-fourth of a grant would be considered one equivalency.
Capital Expenditures Also called Balance Sheet Expenditures, these are the additional costs of physical plant assets that provide material benefits extending beyond the current period. Examples would be stadium or arena expansions or training room construction.
Division I without Football This division formerly was known as Division I-AAA. This group of institutions does not sponsor football, while other requirements are identical to those of the FBS and FCS.
Division II For Division II institutions, at least 50 percent of all football games must be played against FBS, FCS or Division II teams. At least 50 percent of all basketball games (both men's and women's programs) must be played against Division I or II members. At least four men's and four women's sports must be sponsored. There are no attendance, scheduling or financial-aid requirements.
Division III For these institutions, more than 50 percent of all football games must be played against Division III teams or nonmembers who grant financial aid on need only. More than 50 percent of all men's basketball games must be against Division III teams or nonmembers who grant financial aid on need only. At least four men's and four women's sports must be sponsored. There are no attendance or scheduling requirements, and financial aid based on athletics ability is not permitted.
Football Bowl Subdivision This division formerly was known as Division I-A. In accordance with NCAA bylaws, the group includes those institutions that play at least 60 percent of their regular season football games against other FBS institutions. All but four basketball games (both men's and women's programs) must be against other FBS teams. Seven men's and seven women's, or alternatively, six men's and eight women's sports, must be sponsored. There also are requirements for attendance, scheduling and financial aid.
Football Championship Subdivision
This division formerly was known as Division I-AA. These institutions must play more than 50 percent of their regular season football games against FBS or FCS institutions. All but four basketball games (both men's and women's programs) must be against other Division I teams. Seven men's and seven women's, or alternatively, six men's and eight women's sports, must be sponsored. There are also requirements for scheduling and financial aid.
Generated Revenues Those revenues generated independently by the athletics program, such as ticket sales, concessions, alumni/booster contributions, and NCAA and conference distributions.
HEPI (Higher Education Price Index)
Higher Education Price Index is an inflation index specifically to track the main cost drivers in higher education.

NCAA® Revenues / Expenses Division I Report 2004 – 2016 | 111
Inflationary Effect The inflationary effect utilized in some tables is based on the HEPI provided by the U.S. Department of Labor and Statistics. The use of this index is intended to reflect the portion of annual increases in revenues and expenses that result from inflation.
Median Values Median values represent the midpoint of all values reported by respondents. These median values subsequent to the 2003 fiscal period cannot be compared with the mean values reported in prior years. It also should be noted that median values are not additive. Furthermore, if at least one-half of respondents report zero values for a line item, the median value for that line will be zero.
Net Operating Results Total generated revenues less total operating expenses. These results are reported as either Net Generated Revenue (generated revenues exceed expenses) or Negative Net Generated Revenue (expenses exceed generated revenues).
Third-Party Payments These are payments to athletics coaches and other personnel from outside parties. Only third-party payments guaranteed by the institution are included here. Such payments are included as both revenue and expense lines

NCAA® Revenues / Expenses Division I Report 2004 – 2016 | 107
Supporting
student-athlete
success on the field,
in the classroom
and for life


![· Utica and Villages of Ilion, Frankfort, Mohawk, Herkimer and Dolgeville] revenues and expenses, was reviewed. Overall 2014 revenues declined by $90,000; expenses declined by $145,000;](https://img.dokumen.tips/doc/110x75/5f9aee38ff38ed50c74673cb/utica-and-villages-of-ilion-frankfort-mohawk-herkimer-and-dolgeville-revenues.jpg)