Embed Size (px)
Citation preview
1
Reusing oil and gas produced water for irrigation of food crops in
drylands
Alban Echchelh, Tim Hess* and Ruben Sakrabani
Cranfield University, Cranfield, Bedfordshire, MK43 0AL, UK
*Corresponding author
E-mail address: [email protected];
Telephone: +44 (0)1234 758305
Abstract
Water scarcity severely affects drylands threatening their food security, whereas, the oil and
gas industry produces significant and increasing volumes of produced water that could be
partly reused for agricultural irrigation in these regions. In this review, we summarise recent
research and provide a broad overview of the potential for oil and gas produced water to
irrigate food crops in drylands. There is potentially sufficient water to irrigate about 130 000
ha/year of cropland in arid and semi-arid areas. The quality of produced water is often a
limiting factor for the reuse in irrigation as it can lead to soil salinisation and sodification.
Although the inappropriate use of produced water in irrigation could be damaging for the
soil, the agricultural sector in dry areas is often prone to challenges in soil salinity. There is a
lack of knowledge about the main environmental and economic conditions that could
encourage or limit the development of irrigation with oil and gas effluents at the scale of
drylands in the world. Cheaper treatment technologies in combination with farm-based
salinity management techniques could make the reuse of produced water relevant to irrigate
high value-crops in hyper-arid areas. This review paper approaches an aspect of the energy-
2
water-food nexus: the opportunities and challenges behind the reuse of abundant oil and gas
effluents for irrigation in hydrocarbon-rich but water-scarce and food-unsecured drylands.
Keywords: water recycling, arid areas, salinity, sodicity
1 Introduction
The oil and gas (O&G) industry produces large volumes of water during the extraction,
processing, and refining of hydrocarbons. The water that is brought to the surface with
hydrocarbons during extraction is termed ‘produced water’ (PW); this often comprises both
formation water (which naturally occurs in significant quantities in the reservoir with the
hydrocarbons) and water that has been withdrawn from another source, injected into the
O&G reservoir, and returns to the surface with the hydrocarbons (e.g. water injected for
enhanced oil recovery and for hydraulic fracturing) (Engle et al., 2014). In terms of volume,
PW is by far the largest by-product or waste stream associated with the O&G industry (Veil,
2011). In certain conditions, PW can be reused for beneficial purposes such as agricultural
irrigation, but, the volume of PW currently reused this way represents only a small proportion
of the total PW generated. Nonetheless, beneficial reuse of PW is growing (Burnett, 2004;
Clark and Veil, 2015) and could provide a substantial volume of irrigation water to crops
located near O&G facilities in drylands (Guerra et al., 2011).
In this paper, drylands are defined by a precipitation to potential evapotranspiration ratio
below 0.05 i.e. hyper-arid climate, up to 0.65 i.e. dry sub-humid climate (Barrow, 1992;
FAO, 2016; Safriel et al., 2006). Many drylands contain massive hydrocarbon resources (e.g.
3
the Persian Gulf, the Western USA, the Gulf of Mexico, the Libyan Desert or the Caspian
Sea countries). There are also large coal resources from which gas and synthetic fuels are
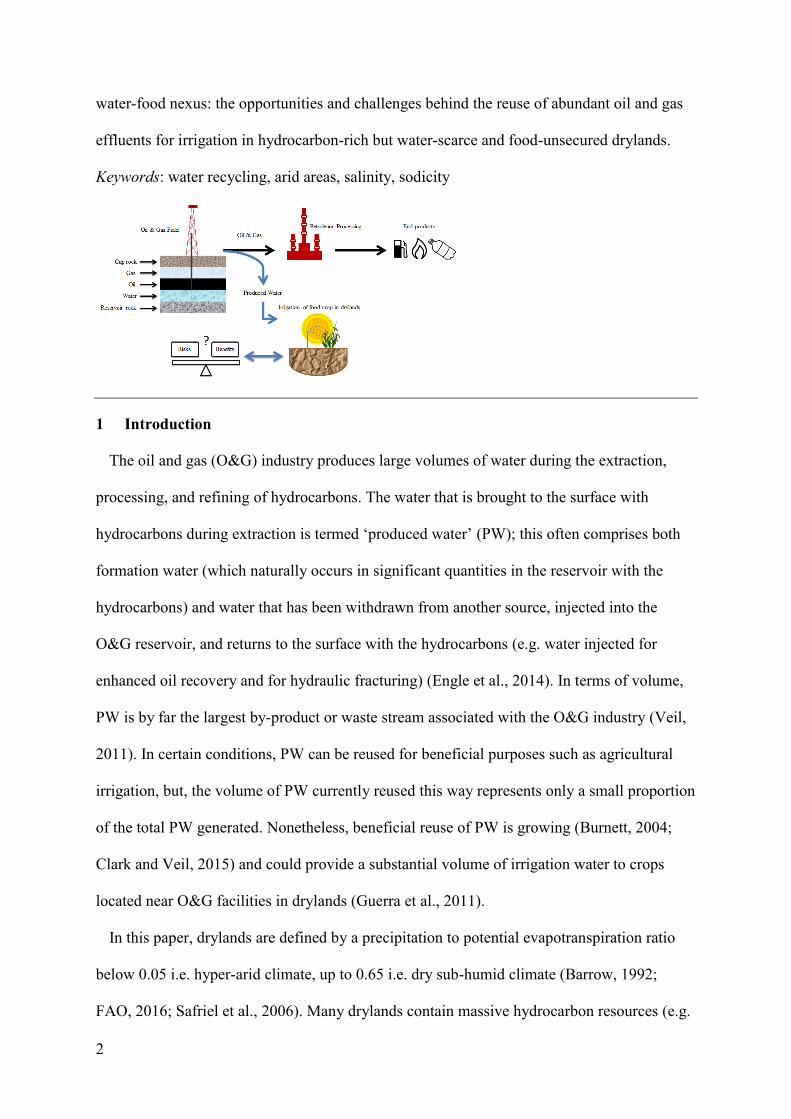
produced in the USA, China, Australia, and South Africa (Figure 1). The Middle-East North
Africa region, which is one of the most populated dry areas (World Bank, 2016), represents
about 33% of the oil production and 23% of the gas production in the world (EIA, 2016).
Figure 1. Distribution of drylands and of the main oil and gas production zones located in
these areas (adapted from FAO, 2016).
Drylands occur on all continents (Safriel et al., 2006), cover 41% of the earth’s landmass
(Millenium Ecosystem Assessment, 2005) and are projected to expand, partly due to climate
change (Feng and Fu, 2013). These regions are inhabited by 2.1 billion people, many of
whom live in developing countries and are directly dependent on the land’s natural resources
(UN, 2010). Projections estimate that half of the global population will live in regions with
high water scarcity by 2030 (UN, 2012). Drylands are an important component of the total
agricultural land area as well. About 50% of the arid and semi-arid area is used for
agriculture (Gratzfeld, 2003), drylands grow 44% of the world’s food and support 50% of the
world’s livestock (Reid, 2014). In drylands, agriculture represents a major economic activity
4
and approximately a third of the population living in these zones depends on agriculture
particularly in Africa and in Asia (CGIAR, 2015). Within developed countries, drylands have
also significant economic importance. For instance, California represents 13% of the US
GDP making this dry state the major contributor to America’s national wealth (US
Department of Commerce, 2015). California also produces around 70% of the fruit and tree
nuts, 55% of the vegetables, 10% of the cotton and about 30% of the rice produced in the
USA (US Department of Agriculture, 2015). However, agriculture and populations in
drylands are under constant threat of water shortage. In fact, drylands are characterised by
physical water scarcity because they are naturally prone to lack of water due to their negative
water balance (i.e. low precipitation and high evapotranspiration) (Gassert et al., 2014). In
addition, fresh water availability can also be reduced by water pollution (NSW Government,
2011) or seawater intrusion (Qadir and Sato, 2015) which can contaminate the already limited
fresh water resources. Climate change is projected to increase water scarcity in most
drylands, affecting both rain-fed and irrigated agriculture (Pedrick, 2012). As water resources
are diminishing, water users (i.e. industry, agriculture, households and the natural
environment) are competing more and more for access to water (El-Zanfaly, 2015; Freyman,
2014; Qadir and Sato, 2015).
Therefore, the pressure on water resources from the O&G industry in drylands is expected
to intensify and is likely to exacerbate competition and conflicts between water users, and
especially between irrigated farming and unconventional O&G firms which use fresh water
resources (Galbraith, 2013; Hitaj et al., 2014). Reusing O&G PW for the irrigation of food
crops could contribute considerably to improve the sustainability of irrigated agricultural
systems in drylands.
This structured review paper aims to provide a critical review of the potential of O&G PW
for the irrigation of food crops in drylands. It starts by providing a review of the volumes and
5
qualities of PW from around the world, followed by a discussion of its treatment and
management practices. Finally, the potential for reuse of PW in agriculture is discussed and
experiences of irrigation with PW are reviewed in order to identify the main risks associated
with using PW in practical conditions. The quality of PW is also discussed from an
agricultural viewpoint in order to highlight the agronomic and environmental risks associated
with reuse and the perspectives for adapting PW to irrigation.
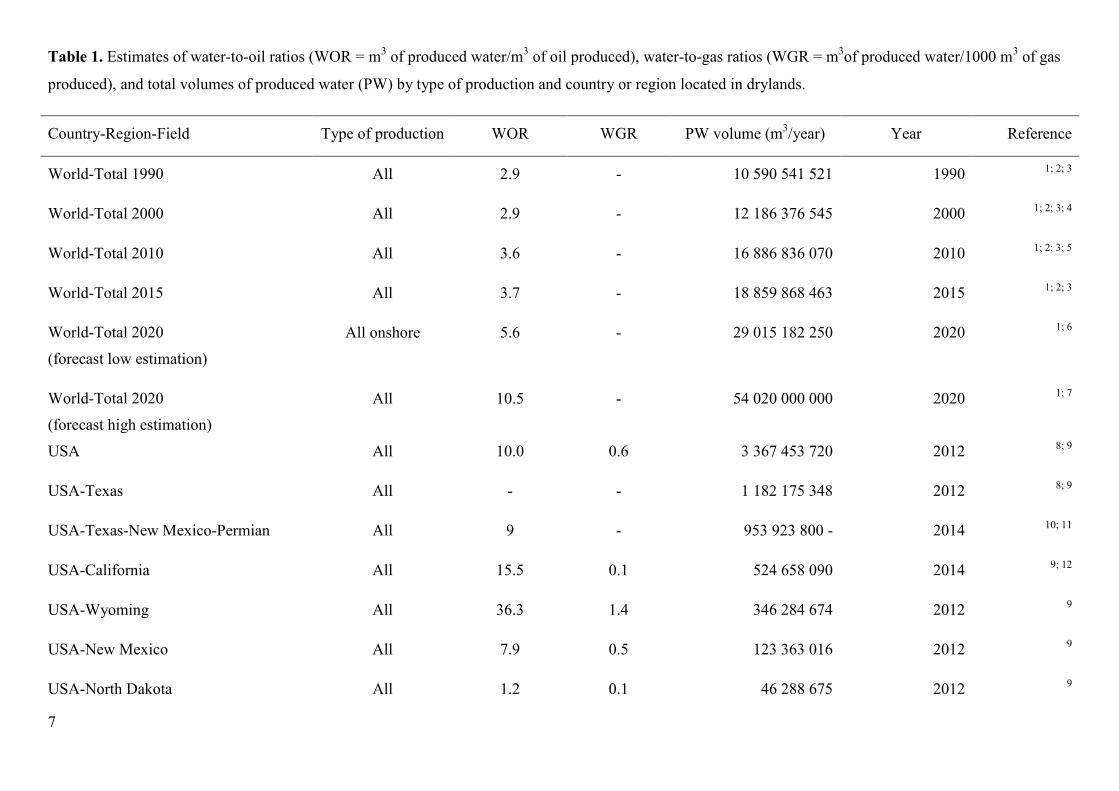
2 Volume of produced water
The water-to-oil (WOR) and water-to-gas (WGR) ratios are indicators used to quantify the
volume of PW generated compared to the volume of oil or gas produced. Although strictly
dimensionless, the O&G industry generally expresses the ratios as barrels (159 L) of water
per barrel of oil or million cubic feet of gas. At the world scale, the average WOR was about
3:1 in the 2000s (Khatib and Verbeek, 2002), and is probably nowadays closer to 4:1, but it
can locally range from as low as 0.4 to as high as 36 (Table 1) depending on the field history,
the type of hydrocarbon and the technologies employed (Clark and Veil, 2015). Globally, this
ratio has been increasing because conventional O&G fields are ageing so, they produce more
and more PW for less hydrocarbons (Healy et al., 2015; Veil et al., 2004). Thus, the highest
WOR and WGR are generally related to mature production areas (e.g. California, China, and
Oman). However, the WOR and WGR of some fields in the Middle East are still low even if
they have been operated for several decades due to specific geological and management
conditions of these ‘giant fields’ which reach their maturation stage much later than smaller
fields (Sorkhabi, 2010; Sorrell et al., 2011).
Significant quantities of PW are generated in dry regions (Table 1), although little
information is available about volumes of PW in O&G producing countries. Indeed, the only
significant O&G producer holding public documented information about PW generation and
management is the USA (Clark and Veil, 2015, 2009). Contrary to hydrocarbon production
6
that has a high economic value, PW volume is often not measured and monitored by O&G
operators (Clark and Veil, 2009). As a consequence, the data in Table 1 are uncertain due to
lack of rigorous reporting and monitoring (Clark and Veil, 2015).
The volume of PW and its evolution over time differ between oilfields and gas fields as oil
reservoirs usually contain larger volumes of water than gas reservoirs as gas has a higher
compressibility and sorption capacity than oil, and also because gas is stored in less porous
reservoirs (Guerra et al., 2011). The volume of PW and wells’ behaviour are also very
heterogeneous between the types of production; conventional O&G wells typically show a
gradual increase of water production while hydrocarbon production is decreasing (Clark and
Veil, 2009; Healy et al., 2015). In contrast, in unconventional O&G production, the volume
of PW tends to be correlated with the volume of hydrocarbons extracted (Healy et al., 2015).
Globally, the estimated quantity of PW has increased by more than 78% between 1990 and
2015 from about 10.6 billion m3 to 18.9 billion m
3 compared to 38% growth of the oil
production from 3.7 billion m3 to 5.1 billion m
3 respectively. This increasing trend is
expected to continue as the projected world PW volume is between 29–54 billion m3 in 2020
(Table 1).
There is an obvious connection between the increase in WOR and the quantity of PW as
illustrated by the situation in North America. Conventional O&G fields in North America are
ageing (IEA, 2013); consequently, a significant and continuous increase of PW volume has
been observed between 2007 and 2015 from 3.9 to 4.3 billion m3
respectively, it is forecast
that 5.6 billion m3 of PW will be generated in 2025 in this part of the world (Shah, 2014).
This increase is also partly explained by the rapid development of unconventional
hydrocarbons, even if their WOR and WGR are not significantly higher than those of
conventional hydrocarbons (Scanlon et al., 2014). Most part of the PW is, and will be,
generated in relatively dry states and provinces of North America (Guerra et al., 2011)
7
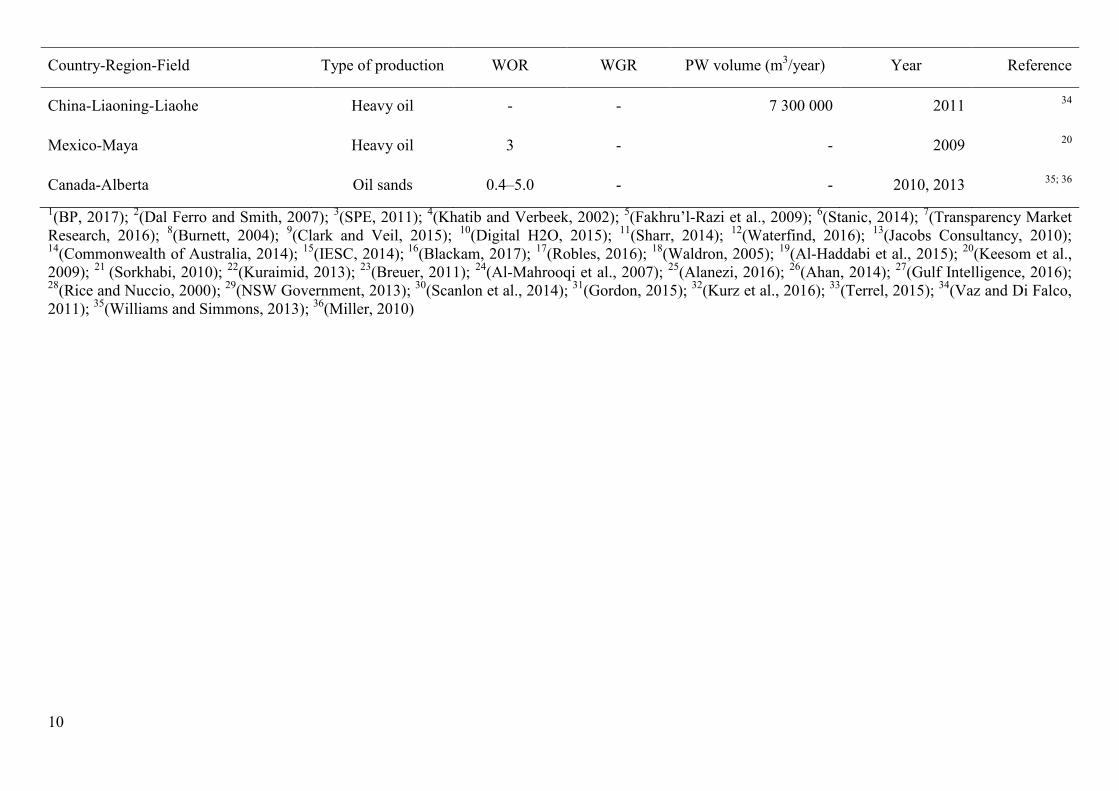
Table 1. Estimates of water-to-oil ratios (WOR = m3 of produced water/m
3 of oil produced), water-to-gas ratios (WGR = m
3of produced water/1000 m
3 of gas
produced), and total volumes of produced water (PW) by type of production and country or region located in drylands.
Country-Region-Field Type of production WOR WGR PW volume (m3/year) Year Reference
World-Total 1990 All 2.9 - 10 590 541 521 1990 1; 2; 3
World-Total 2000 All 2.9 - 12 186 376 545 2000 1; 2; 3; 4
World-Total 2010 All 3.6 - 16 886 836 070 2010 1; 2; 3; 5
World-Total 2015 All 3.7 - 18 859 868 463 2015 1; 2; 3
World-Total 2020
(forecast low estimation)
All onshore 5.6 - 29 015 182 250 2020 1; 6
World-Total 2020
(forecast high estimation)
All 10.5 - 54 020 000 000 2020 1; 7
USA All 10.0 0.6 3 367 453 720 2012 8; 9
USA-Texas All - - 1 182 175 348 2012 8; 9
USA-Texas-New Mexico-Permian All 9 - 953 923 800 - 2014 10; 11
USA-California All 15.5 0.1 524 658 090 2014 9; 12
USA-Wyoming All 36.3 1.4 346 284 674 2012 9
USA-New Mexico All 7.9 0.5 123 363 016 2012 9
USA-North Dakota All 1.2 0.1 46 288 675 2012 9
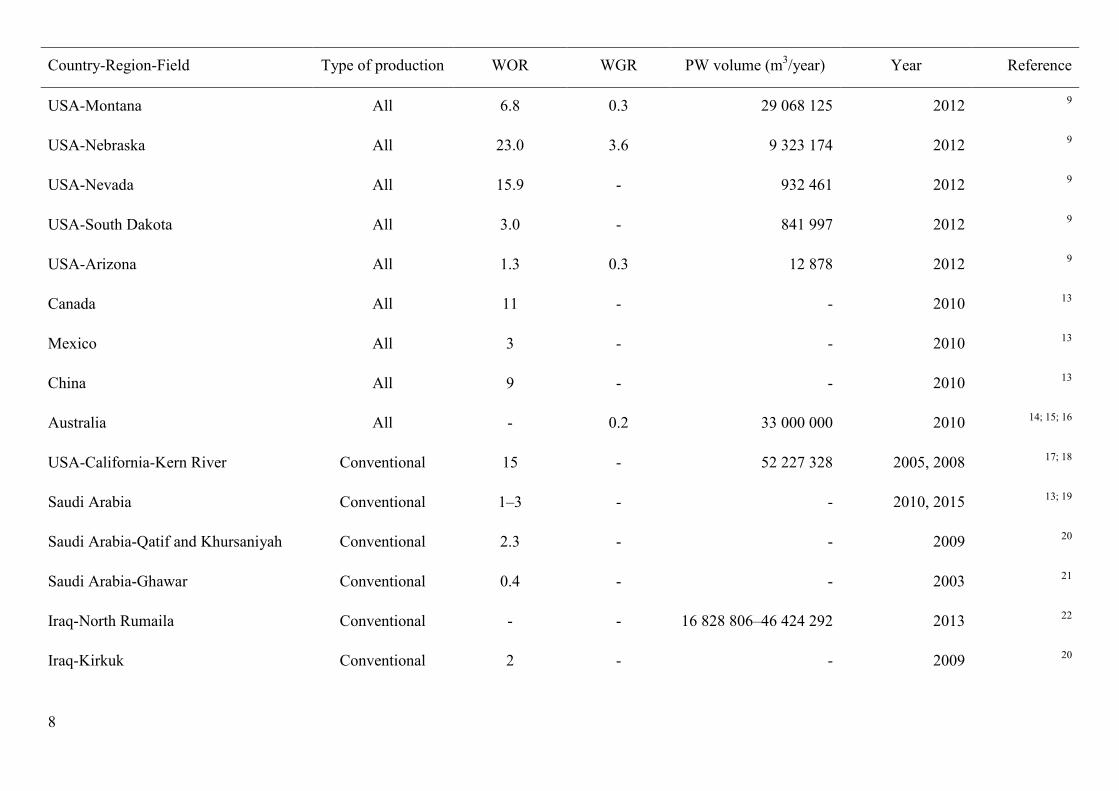
8
Country-Region-Field Type of production WOR WGR PW volume (m3/year) Year Reference
USA-Montana All 6.8 0.3 29 068 125 2012 9
USA-Nebraska All 23.0 3.6 9 323 174 2012 9
USA-Nevada All 15.9 - 932 461 2012 9
USA-South Dakota All 3.0 - 841 997 2012 9
USA-Arizona All 1.3 0.3 12 878 2012 9
Canada All 11 - - 2010 13
Mexico All 3 - - 2010 13
China All 9 - - 2010 13
Australia All - 0.2 33 000 000 2010 14; 15; 16
USA-California-Kern River Conventional 15 - 52 227 328 2005, 2008 17; 18
Saudi Arabia Conventional 1–3 - - 2010, 2015 13; 19
Saudi Arabia-Qatif and Khursaniyah Conventional 2.3 - - 2009 20
Saudi Arabia-Ghawar Conventional 0.4 - - 2003 21
Iraq-North Rumaila Conventional - - 16 828 806–46 424 292 2013 22
Iraq-Kirkuk Conventional 2 - - 2009 20
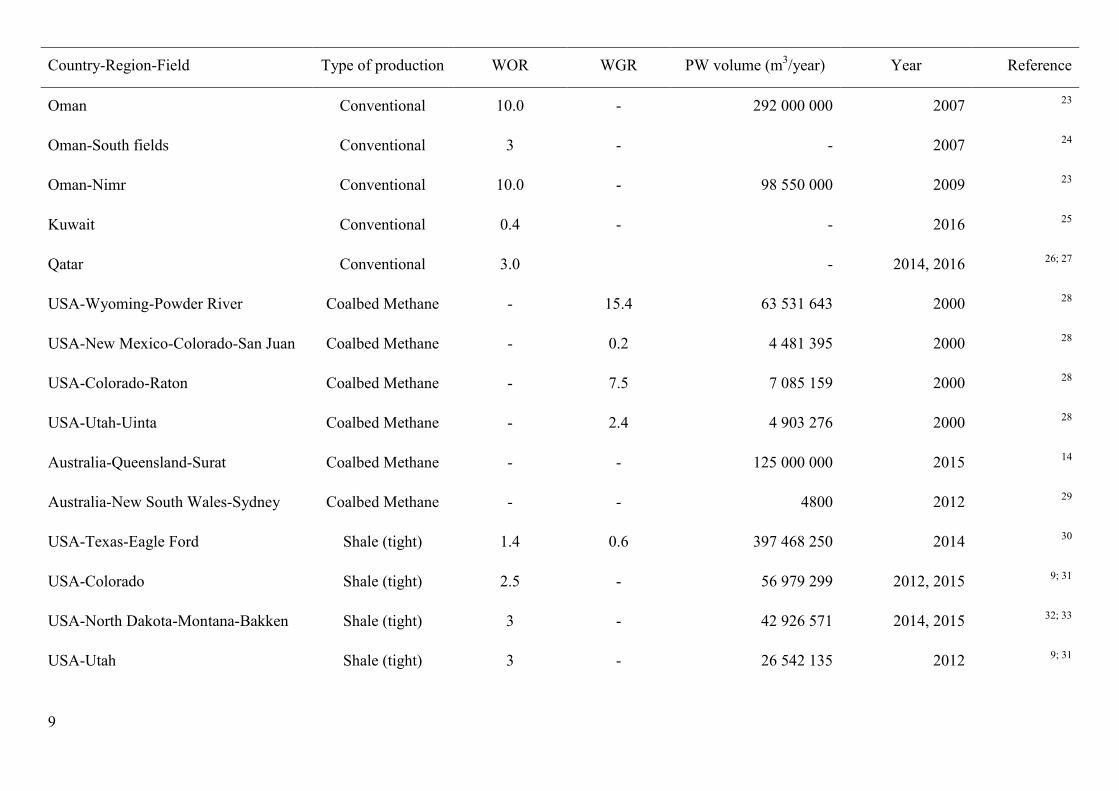
9
Country-Region-Field Type of production WOR WGR PW volume (m3/year) Year Reference
Oman Conventional 10.0 - 292 000 000 2007 23
Oman-South fields Conventional 3 - - 2007 24
Oman-Nimr Conventional 10.0 - 98 550 000 2009 23
Kuwait Conventional 0.4 - - 2016 25
Qatar Conventional 3.0 - 2014, 2016 26; 27
USA-Wyoming-Powder River Coalbed Methane - 15.4 63 531 643 2000 28
USA-New Mexico-Colorado-San Juan Coalbed Methane - 0.2 4 481 395 2000 28
USA-Colorado-Raton Coalbed Methane - 7.5 7 085 159 2000 28
USA-Utah-Uinta Coalbed Methane - 2.4 4 903 276 2000 28
Australia-Queensland-Surat Coalbed Methane - - 125 000 000 2015 14
Australia-New South Wales-Sydney Coalbed Methane - - 4800 2012 29
USA-Texas-Eagle Ford Shale (tight) 1.4 0.6 397 468 250 2014 30
USA-Colorado Shale (tight) 2.5 - 56 979 299 2012, 2015 9; 31
USA-North Dakota-Montana-Bakken Shale (tight) 3 - 42 926 571 2014, 2015 32; 33
USA-Utah Shale (tight) 3 - 26 542 135 2012 9; 31
10
Country-Region-Field Type of production WOR WGR PW volume (m3/year) Year Reference
China-Liaoning-Liaohe Heavy oil - - 7 300 000 2011 34
Mexico-Maya Heavy oil 3 - - 2009 20
Canada-Alberta Oil sands 0.4–5.0 - - 2010, 2013 35; 36
1(BP, 2017);
2(Dal Ferro and Smith, 2007);
3(SPE, 2011);
4(Khatib and Verbeek, 2002);
5(Fakhru’l-Razi et al., 2009);
6(Stanic, 2014);
7(Transparency Market
Research, 2016); 8(Burnett, 2004);
9(Clark and Veil, 2015);
10(Digital H2O, 2015);
11(Sharr, 2014);
12(Waterfind, 2016);
13(Jacobs Consultancy, 2010);
14(Commonwealth of Australia, 2014);
15(IESC, 2014);
16(Blackam, 2017);
17(Robles, 2016);
18(Waldron, 2005);
19(Al-Haddabi et al., 2015);
20(Keesom et al.,
2009); 21
(Sorkhabi, 2010); 22
(Kuraimid, 2013); 23
(Breuer, 2011); 24
(Al-Mahrooqi et al., 2007); 25
(Alanezi, 2016); 26
(Ahan, 2014); 27
(Gulf Intelligence, 2016); 28
(Rice and Nuccio, 2000); 29
(NSW Government, 2013); 30
(Scanlon et al., 2014); 31
(Gordon, 2015); 32
(Kurz et al., 2016); 33
(Terrel, 2015); 34
(Vaz and Di Falco,
2011); 35
(Williams and Simmons, 2013); 36
(Miller, 2010)
11
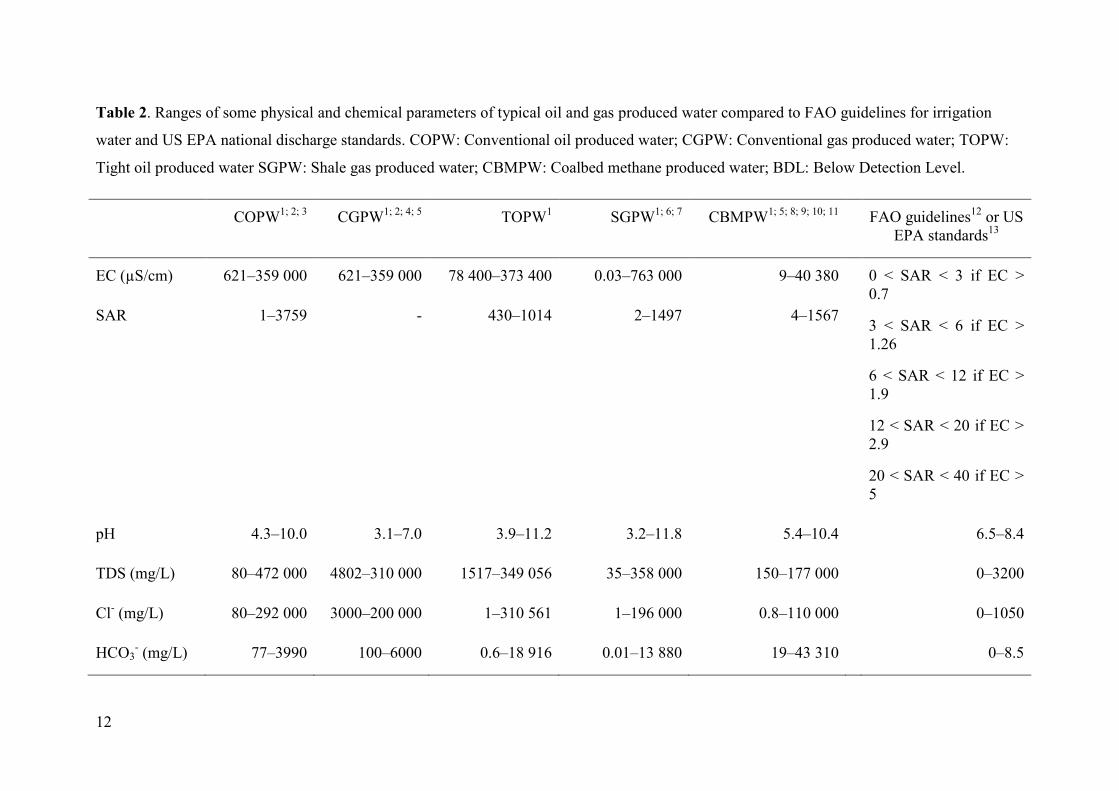
3 Quality of produced water
PW contains a mixture of organic and inorganic materials (Table 2) including dissolved
and dispersed oil, dissolved formation minerals, production chemical compounds, production
solids (e.g. formation solids, corrosion and scale products, bacteria, waxes, and asphaltenes),
naturally occurring radioactive materials (NORM) and dissolved gases (Deng et al., 2008;
Ekins et al., 2007; Fakhru’l-Razi et al., 2009; Hansen and Davies, 1994; McCormack et al.,
2001; Neff, 2002; Neff et al., 2011; Stephenson, 1992; Veil et al., 2004; Wang et al., 2001).
The detailed chemical composition and physical characteristics of PW partly depend on the
type of hydrocarbon associated with PW. For example, PW from gas production usually has
lower total dissolved solids (TDS), oil, and grease content than that from oil production. PW
quality also differs according to the geology of the storage formation from which they are
withdrawn, the operational conditions, the age of the well, and the chemicals used in process
facilities (Abousnina et al., 2015; Igunnu and Chen, 2014; Neff et al., 2011; Pichtel, 2016;
Veil et al., 2004). In addition, like the volume, the composition of PW can vary over time
within the same well (Veil et al., 2004).
12
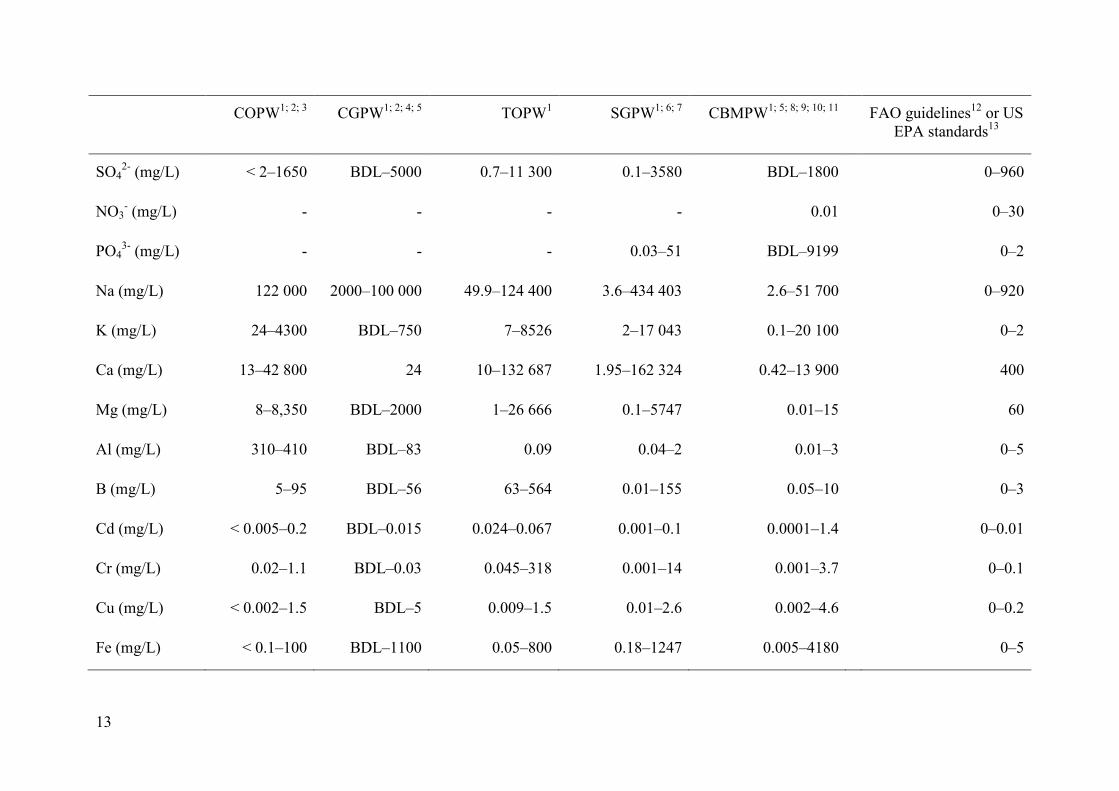
Table 2. Ranges of some physical and chemical parameters of typical oil and gas produced water compared to FAO guidelines for irrigation
water and US EPA national discharge standards. COPW: Conventional oil produced water; CGPW: Conventional gas produced water; TOPW:
Tight oil produced water SGPW: Shale gas produced water; CBMPW: Coalbed methane produced water; BDL: Below Detection Level.
COPW1; 2; 3
CGPW1; 2; 4; 5
TOPW1 SGPW
1; 6; 7 CBMPW
1; 5; 8; 9; 10; 11 FAO guidelines
12 or US
EPA standards13
EC (µS/cm) 621–359 000 621–359 000 78 400–373 400 0.03–763 000 9–40 380 0 < SAR < 3 if EC >
0.7
3 < SAR < 6 if EC >
1.26
6 < SAR < 12 if EC >
1.9
12 < SAR < 20 if EC >
2.9
20 < SAR < 40 if EC >
5
SAR 1–3759 - 430–1014 2–1497 4–1567
pH 4.3–10.0 3.1–7.0 3.9–11.2 3.2–11.8 5.4–10.4 6.5–8.4
TDS (mg/L) 80–472 000 4802–310 000 1517–349 056 35–358 000 150–177 000 0–3200
Cl- (mg/L) 80–292 000 3000–200 000 1–310 561 1–196 000 0.8–110 000 0–1050
HCO3- (mg/L) 77–3990 100–6000 0.6–18 916 0.01–13 880 19–43 310 0–8.5
13
COPW1; 2; 3
CGPW1; 2; 4; 5
TOPW1 SGPW
1; 6; 7 CBMPW
1; 5; 8; 9; 10; 11 FAO guidelines
12 or US
EPA standards13
SO42-
(mg/L) < 2–1650 BDL–5000 0.7–11 300 0.1–3580 BDL–1800 0–960
NO3- (mg/L) - - - - 0.01 0–30
PO43-
(mg/L) - - - 0.03–51 BDL–9199 0–2
Na (mg/L) 122 000 2000–100 000 49.9–124 400 3.6–434 403 2.6–51 700 0–920
K (mg/L) 24–4300 BDL–750 7–8526 2–17 043 0.1–20 100 0–2
Ca (mg/L) 13–42 800 24 10–132 687 1.95–162 324 0.42–13 900 400
Mg (mg/L) 8–8,350 BDL–2000 1–26 666 0.1–5747 0.01–15 60
Al (mg/L) 310–410 BDL–83 0.09 0.04–2 0.01–3 0–5
B (mg/L) 5–95 BDL–56 63–564 0.01–155 0.05–10 0–3
Cd (mg/L) < 0.005–0.2 BDL–0.015 0.024–0.067 0.001–0.1 0.0001–1.4 0–0.01
Cr (mg/L) 0.02–1.1 BDL–0.03 0.045–318 0.001–14 0.001–3.7 0–0.1
Cu (mg/L) < 0.002–1.5 BDL–5 0.009–1.5 0.01–2.6 0.002–4.6 0–0.2
Fe (mg/L) < 0.1–100 BDL–1100 0.05–800 0.18–1247 0.005–4180 0–5
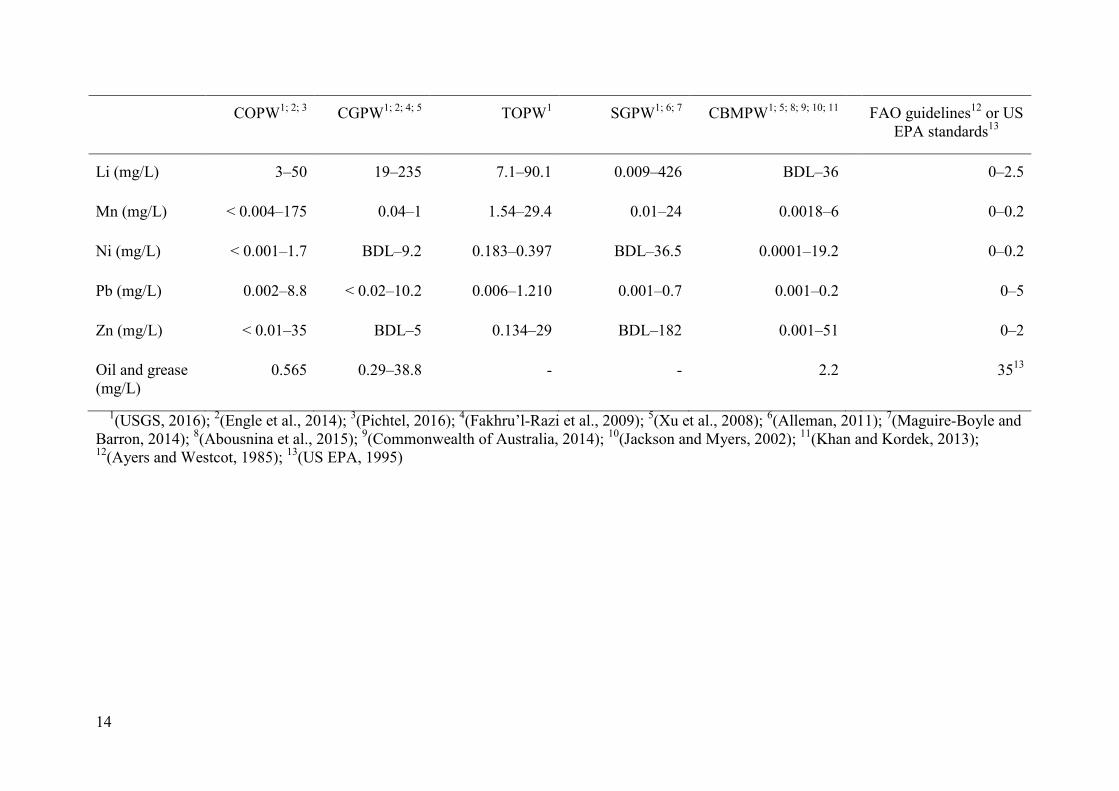
14
COPW1; 2; 3
CGPW1; 2; 4; 5
TOPW1 SGPW
1; 6; 7 CBMPW
1; 5; 8; 9; 10; 11 FAO guidelines
12 or US
EPA standards13
Li (mg/L) 3–50 19–235 7.1–90.1 0.009–426 BDL–36 0–2.5
Mn (mg/L) < 0.004–175 0.04–1 1.54–29.4 0.01–24 0.0018–6 0–0.2
Ni (mg/L) < 0.001–1.7 BDL–9.2 0.183–0.397 BDL–36.5 0.0001–19.2 0–0.2
Pb (mg/L) 0.002–8.8 < 0.02–10.2 0.006–1.210 0.001–0.7 0.001–0.2 0–5
Zn (mg/L) < 0.01–35 BDL–5 0.134–29 BDL–182 0.001–51 0–2
Oil and grease
(mg/L)
0.565 0.29–38.8 - - 2.2 3513
1(USGS, 2016);
2(Engle et al., 2014);
3(Pichtel, 2016);
4(Fakhru’l-Razi et al., 2009);
5(Xu et al., 2008);
6(Alleman, 2011);
7(Maguire-Boyle and
Barron, 2014); 8(Abousnina et al., 2015);
9(Commonwealth of Australia, 2014);
10(Jackson and Myers, 2002);
11(Khan and Kordek, 2013);
12(Ayers and Westcot, 1985);
13(US EPA, 1995)
15
As we see in Table 2 the ranges of chemical concentration in the different kinds of O&G
PW vary widely. From an agronomic point of view, PW typically has high TDS, high
electrical conductivity (EC), high sodium adsorption ratio (SAR), acidic to alkaline pH. PW
also contains moderate to high amounts of various heavy metals such as B, Cd, Cr, Cu, Pb,
Ni, and Zn (ALL Consulting, 2003; Clark and Veil, 2009; Hansen and Davies, 1994; Pichtel,
2016; Van Voast, 2003).
4 Management of produced water
Due to its complex composition, PW needs to be managed in order to avoid environmental
damage. Treatment and reuse or disposal options depend on the constituents of PW, the
location of the oil or gas field (e.g. onshore or offshore) and the environmental regulation of
the territory where the hydrocarbon is produced. For example, oil and grease receive the most
attention for both onshore and offshore PW, whereas salt content is of concern for onshore
PW.
4.1 Treatment
The treatment options include de-oiling, desalination, degassing, suspended solids removal,
organic compounds removal, heavy metal and radionuclides removal, and disinfection (SPE,
2011). These treatment goals are essentially the same for beneficial reuse or disposal,
although the level of contaminant removal required for reuse in irrigation can be significantly
higher, depending on the original quality of the PW and the type of reuse. Achieving the
various treatment goals requires the use of multiple treatment technologies, including
physical, chemical, and biological treatment processes (Fakhru’l-Razi et al., 2009). The
treatment cost strongly depends on the quality of PW (which can vary widely among
production fields and change over time within a given field) and the regulatory environment.
Therefore, technology solutions for treatment and reuse of PW would need to be adapted
according to the properties of the PW and the amount of water to be treated (SPE, 2011).
16
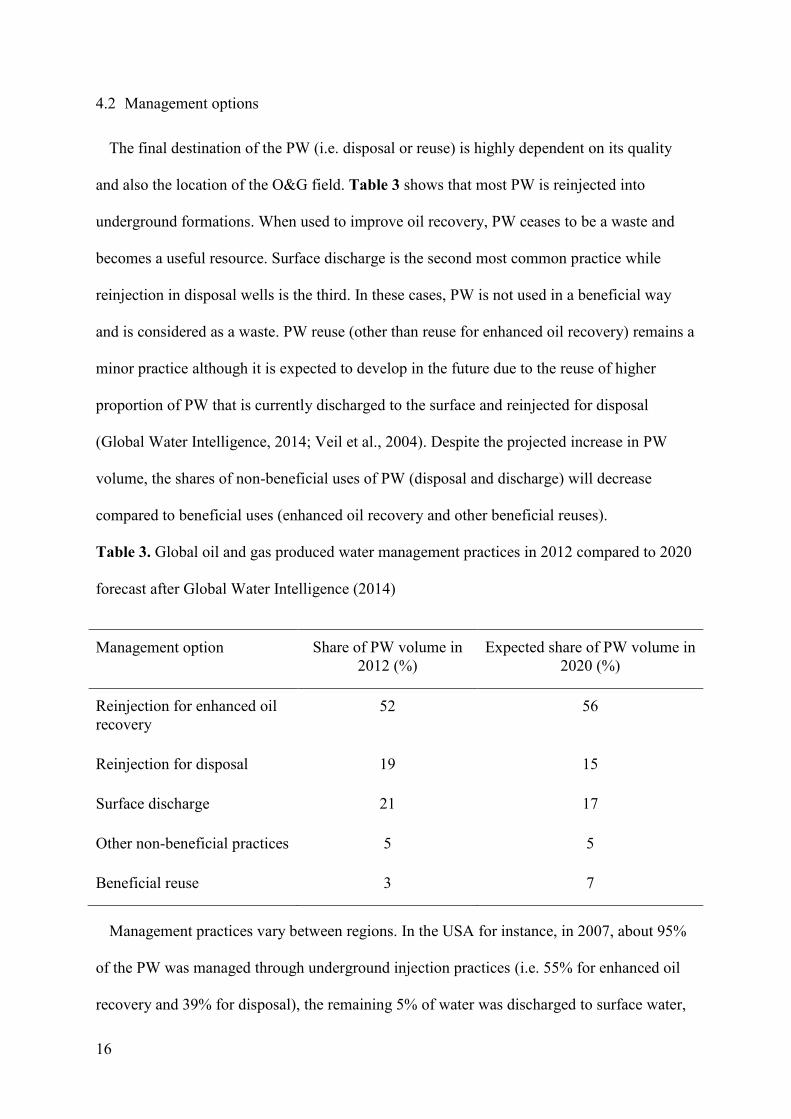
4.2 Management options
The final destination of the PW (i.e. disposal or reuse) is highly dependent on its quality
and also the location of the O&G field. Table 3 shows that most PW is reinjected into
underground formations. When used to improve oil recovery, PW ceases to be a waste and
becomes a useful resource. Surface discharge is the second most common practice while
reinjection in disposal wells is the third. In these cases, PW is not used in a beneficial way
and is considered as a waste. PW reuse (other than reuse for enhanced oil recovery) remains a
minor practice although it is expected to develop in the future due to the reuse of higher
proportion of PW that is currently discharged to the surface and reinjected for disposal
(Global Water Intelligence, 2014; Veil et al., 2004). Despite the projected increase in PW
volume, the shares of non-beneficial uses of PW (disposal and discharge) will decrease
compared to beneficial uses (enhanced oil recovery and other beneficial reuses).
Table 3. Global oil and gas produced water management practices in 2012 compared to 2020
forecast after Global Water Intelligence (2014)
Management option Share of PW volume in
2012 (%)
Expected share of PW volume in
2020 (%)
Reinjection for enhanced oil
recovery
52 56
Reinjection for disposal 19 15
Surface discharge 21 17
Other non-beneficial practices 5 5
Beneficial reuse 3 7
Management practices vary between regions. In the USA for instance, in 2007, about 95%
of the PW was managed through underground injection practices (i.e. 55% for enhanced oil
recovery and 39% for disposal), the remaining 5% of water was discharged to surface water,
17
stored in surface impoundments, reused for irrigation, or reused for hydraulic fracturing
(Clark and Veil, 2009; Hladik et al., 2014).
Management practices also differ between onshore and offshore fields. Most onshore O&G
PW is reinjected whilst offshore O&G PW tends to be discharged, due to the isolation of
offshore O&G facilities from potential reuse options. Indeed, globally, in 2014, an estimated
844 million m3 of PW were discharged offshore (IOGP, 2014) representing 84% of the total
volume of offshore PW in 2013 (Water Online, 2014). The variability of offshore PW
management practices is less compared to onshore PW. For example, the estimated total
volume of PW generated in the USA’s federal waters in 2007 was about 93 million m3, 91%
was treated and discharged to the ocean and only 9% of this PW was reinjected underground
for enhanced recovery or disposal (Clark and Veil, 2009). In Europe’s offshore waters
(mainly the North Sea), about 419 million m3
of PW were discharged in 2014 whereas about
100 million m3 were reinjected in 2012 (Garland, 2005; IOGP, 2014).
PW that is discharged, disposed of, and not used beneficially represented 45% of global
PW volume in 2012 (Table 3). Thus, considering the 18.86 billion m3 of PW generated in
2015 (Table 1), about 8.5 billion m3
of PW is potentially available for agricultural irrigation.
5 Potential of produced water for reuse in irrigation
5.1 Experience of irrigation with oil and gas produced water
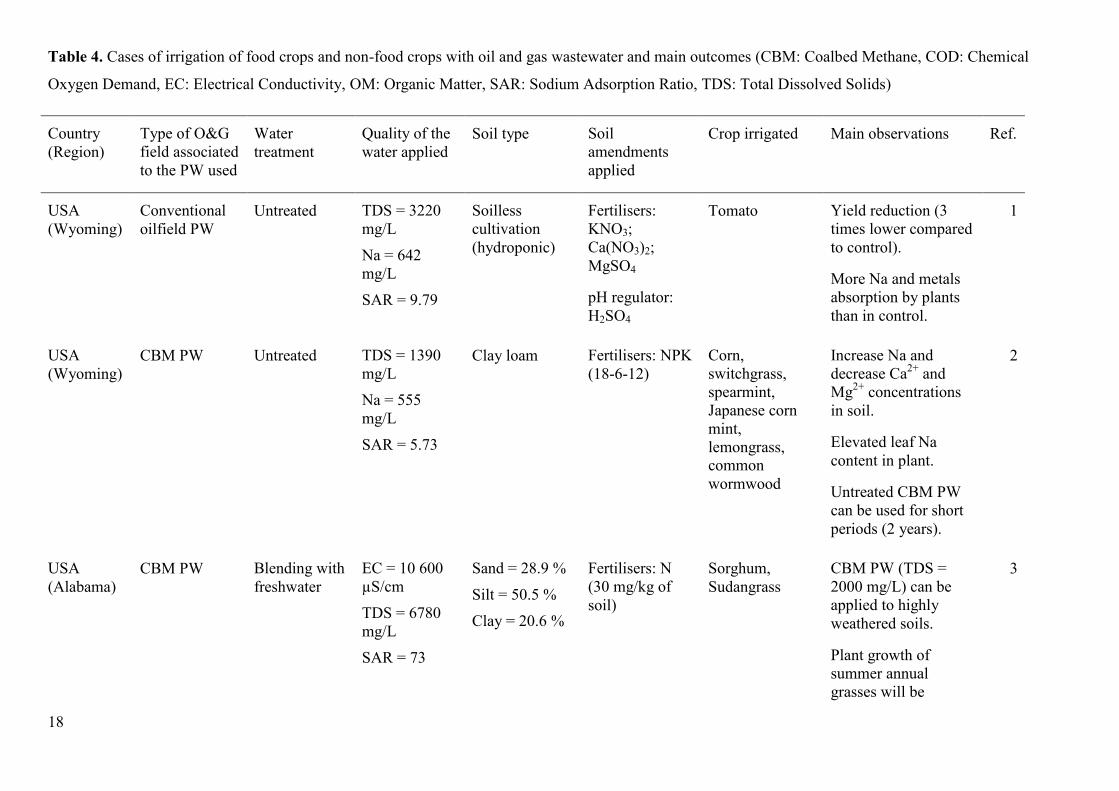
Among the possible beneficial reuses of PW, agricultural irrigation (especially of food
crops) could be particularly relevant in drylands. Table 4 presents theoretical research,
laboratory and field experiments, as well as examples of large-scale use of PW for irrigation
in different parts of the world. Table 4 helps to identify the challenges faced when PW is
used for irrigation in dry zones. It also supports the idea that PW in conjunction with adapted
management has an important potential to increase water resources in drylands.
18
Table 4. Cases of irrigation of food crops and non-food crops with oil and gas wastewater and main outcomes (CBM: Coalbed Methane, COD: Chemical
Oxygen Demand, EC: Electrical Conductivity, OM: Organic Matter, SAR: Sodium Adsorption Ratio, TDS: Total Dissolved Solids)
Country
(Region)
Type of O&G
field associated
to the PW used
Water
treatment
Quality of the
water applied
Soil type Soil
amendments
applied
Crop irrigated Main observations Ref.
USA
(Wyoming)
Conventional
oilfield PW
Untreated TDS = 3220
mg/L
Na = 642
mg/L
SAR = 9.79
Soilless
cultivation
(hydroponic)
Fertilisers:
KNO3;
Ca(NO3)2;
MgSO4
pH regulator:
H2SO4
Tomato Yield reduction (3
times lower compared
to control).
More Na and metals
absorption by plants
than in control.
1
USA
(Wyoming)
CBM PW Untreated TDS = 1390
mg/L
Na = 555
mg/L
SAR = 5.73
Clay loam Fertilisers: NPK
(18-6-12)
Corn,
switchgrass,
spearmint,
Japanese corn
mint,
lemongrass,
common
wormwood
Increase Na and
decrease Ca2+
and
Mg2+
concentrations
in soil.
Elevated leaf Na
content in plant.
Untreated CBM PW
can be used for short
periods (2 years).
2
USA
(Alabama)
CBM PW Blending with
freshwater
EC = 10 600
µS/cm
TDS = 6780
mg/L
SAR = 73
Sand = 28.9 %
Silt = 50.5 %
Clay = 20.6 %
Fertilisers: N
(30 mg/kg of
soil)
Sorghum,
Sudangrass
CBM PW (TDS =
2000 mg/L) can be
applied to highly
weathered soils.
Plant growth of
summer annual
grasses will be
3
19
Country
(Region)
Type of O&G
field associated
to the PW used
Water
treatment
Quality of the
water applied
Soil type Soil
amendments
applied
Crop irrigated Main observations Ref.
optimised if an
irrigation system is
used to apply PW at a
rate to maintain soil
moisture at or near
field capacity.
USA
(California)
Conventional
oilfield PW
Mechanical
separation,
sedimentation,
air flotation
and filtration
TDS = 500
mg/L
Na = 130
mg/L
Saline-alkaline
soils with
diverse texture
- Grape, almond,
citrus, pistachio,
apple, peach,
plum, melon,
potato,
vegetables
Trace of organic
chemical below
drinking standards.
Water considered safe
for irrigation.
4;
5: 6
Oman Conventional
oilfield PW
Reed, solar
distillation
TDS ≤ 50
mg/L
- None Eucalyptus,
Kuwaiti tree,
paspalum,
cotton
The PW is desalinised
using a commercial
solar powered system
called ‘Solar Dew’
which is especially
adapted to arid
environments. The
desalination cost 0.5‒
2 USD/m3 is thus
much lower compared
to an electric or fuel-
powered desalination
unit. After treatment
by reeds, the PW is
saline (TDS = 6980
mg/L). The solar
desalination system
7;
8; 9
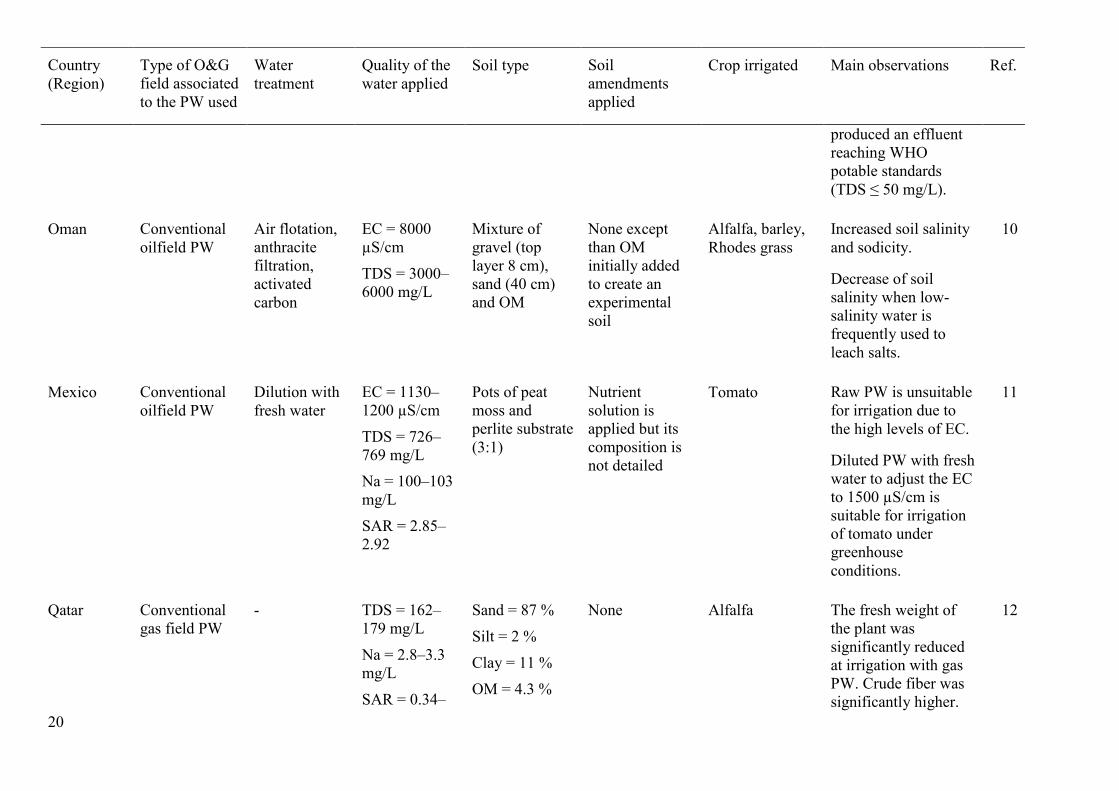
20
Country
(Region)
Type of O&G
field associated
to the PW used
Water
treatment
Quality of the
water applied
Soil type Soil
amendments
applied
Crop irrigated Main observations Ref.
produced an effluent
reaching WHO
potable standards
(TDS ≤ 50 mg/L).
Oman Conventional
oilfield PW
Air flotation,
anthracite
filtration,
activated
carbon
EC = 8000
µS/cm
TDS = 3000–
6000 mg/L
Mixture of
gravel (top
layer 8 cm),
sand (40 cm)
and OM
None except
than OM
initially added
to create an
experimental
soil
Alfalfa, barley,
Rhodes grass
Increased soil salinity
and sodicity.
Decrease of soil
salinity when low-
salinity water is
frequently used to
leach salts.
10
Mexico Conventional
oilfield PW
Dilution with
fresh water
EC = 1130–
1200 µS/cm
TDS = 726–
769 mg/L
Na = 100–103
mg/L
SAR = 2.85–
2.92
Pots of peat
moss and
perlite substrate
(3:1)
Nutrient
solution is
applied but its
composition is
not detailed
Tomato Raw PW is unsuitable
for irrigation due to
the high levels of EC.
Diluted PW with fresh
water to adjust the EC
to 1500 µS/cm is
suitable for irrigation
of tomato under
greenhouse
conditions.
11
Qatar Conventional
gas field PW
- TDS = 162–
179 mg/L
Na = 2.8–3.3
mg/L
SAR = 0.34–
Sand = 87 %
Silt = 2 %
Clay = 11 %
OM = 4.3 %
None Alfalfa The fresh weight of
the plant was
significantly reduced
at irrigation with gas
PW. Crude fiber was
significantly higher.
12
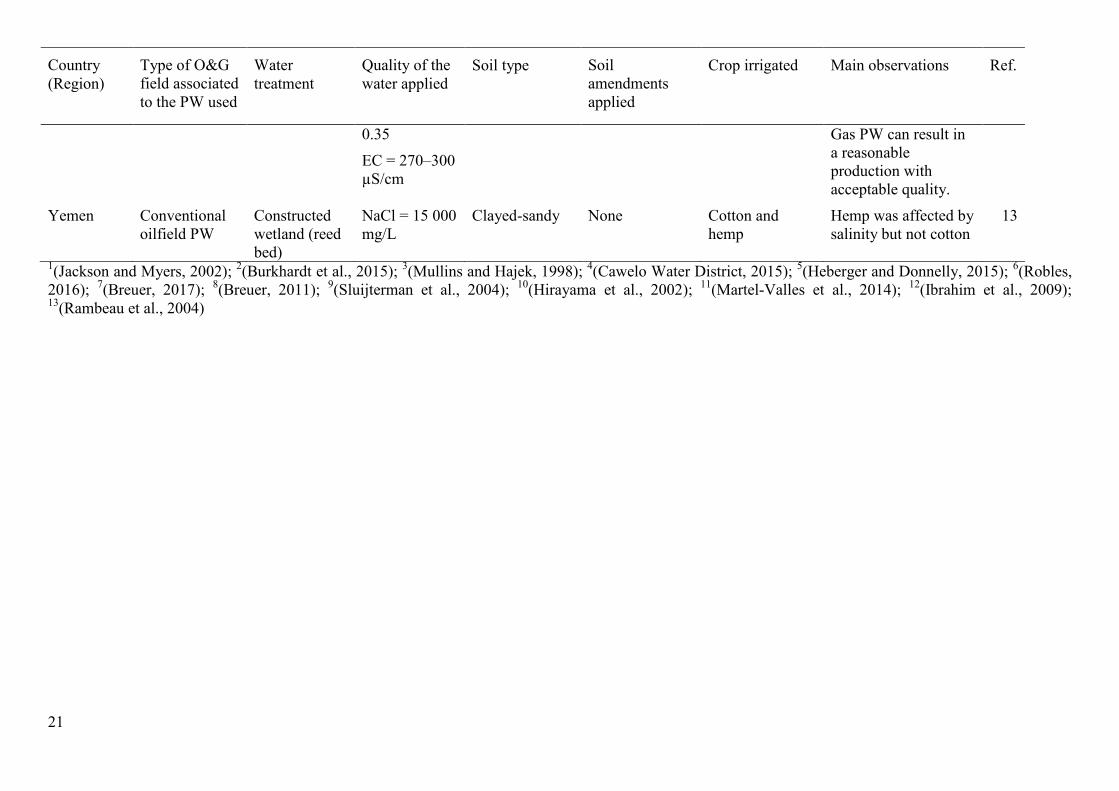
21
Country
(Region)
Type of O&G
field associated
to the PW used
Water
treatment
Quality of the
water applied
Soil type Soil
amendments
applied
Crop irrigated Main observations Ref.
0.35
EC = 270–300
µS/cm
Gas PW can result in
a reasonable
production with
acceptable quality.
Yemen Conventional
oilfield PW
Constructed
wetland (reed
bed)
NaCl = 15 000
mg/L
Clayed-sandy None Cotton and
hemp
Hemp was affected by
salinity but not cotton
13
1(Jackson and Myers, 2002);
2(Burkhardt et al., 2015);
3(Mullins and Hajek, 1998);
4(Cawelo Water District, 2015);
5(Heberger and Donnelly, 2015);
6(Robles,
2016); 7(Breuer, 2017);
8(Breuer, 2011);
9(Sluijterman et al., 2004);
10(Hirayama et al., 2002);
11(Martel-Valles et al., 2014);
12(Ibrahim et al., 2009);
13(Rambeau et al., 2004)
22
5.2 Agro-environmental risks associated with irrigation with oil and gas produced water
The concentration ranges of salts (measured through TDS and EC) particularly sodium and
some heavy metals (Al–Zn) are very often over the values recommended by the FAO
guidelines that we use as a reference for the quality of irrigation water (Table 2) (Alley et al.,
2011; Ayers and Westcot, 1985). These components remain in high concentration even after
conventional treatment, which mainly targets organic pollutants (Fakhru’l-Razi et al., 2009).
The other components of PW represent lower risks to the soil because they are either initially
present in low concentrations (e.g. nutrients and radioactive elements) or their concentrations
are highly reduced during treatment processes and are particularly targeted by regulation (e.g.
hydrocarbons) (Fakhru’l-Razi et al., 2009). Thus, hydrocarbons represent a minor hazard for
soil compared to salts and heavy metals. Indeed, oil and grease concentration in most
documented PW is quite low compared to US EPA standards for agricultural use of PW
(Table 2). PW that could be reused at a large scale would otherwise be disposed or
discharged into the environment and would therefore be treated up to tertiary level, having a
final oil and grease concentration below 10 mg/L (SPE, 2011); which is also below US EPA
standards. In addition, hydrocarbons do not tend to accumulate in the long term as salts or
metals do, this is because of their organic nature enabling biological degradation in soil
(Pichtel, 2016).
As a result, the challenging components of PW remain in dissolved formation minerals (i.e.
salts and sodium) and metalloids. If PW is used in agricultural irrigation, these elements can
accumulate in the soil; creating risks of soil salinisation and sodification as observed in most
case studies (Table 4). These risks are not specific to PW but they are also related to
irrigation with both municipal and industrial wastewaters that are often saline and sodic
(Elgallal et al., 2016; Maassen, 2016).
5.2.1 Risks related to the salinity and sodicity of produced water
23
Generally, salinity and sodicity are closely linked because the main ions in PW are sodium
(Na+) and chloride (Cl
-). Other cations such as K
+, Ca
2+, Mg
2+, Ba
2+, Sr
2+, Fe
2+ and anions
like SO42-
, CO32-
, HCO3- also affect PW salinity and buffering capacity (Hansen and Davies,
1994), but at a lower scale than Na+
and Cl- due to lower concentrations in PW. However, on
some sites that use seawater for enhanced oil recovery, SO42-
concentration is high and
contribute significantly to PW salinity (Neff, 2002). The salt concentration of most PW varies
from 1000 to 300 000 mg/L classifying it between ‘slightly saline’ to ‘brine’ (Jacobs et al.,
1992; Rhoades et al., 1992).
The misuse of PW in irrigation can increase soil salinity and sodicity to unsustainable
levels for crops and soil’s health even on a short term (Burkhardt et al., 2015; Hirayama et
al., 2002; Rambeau et al., 2004) (Table 4)Table 4.
Excessive salinity and sodicity of PW used for irrigation can dramatically and irreversibly
alter soil structure in drylands. Salt accumulates in soil, particularly in the root zone, as a
result of high rates of evaporation and low precipitation (Burkhardt et al., 2015; Elgallal et
al., 2016; Safriel et al., 2006). The build-up of salt could lead to elevated levels of
exchangeable sodium and SAR in soil if Na+ is dominant ion (Ayers and Westcot, 1985;
Beletse et al., 2008; Johnston et al., 2008; Stefanakis, 2016; Toze, 2006) causing a decrease
in water infiltration and dispersion of clay which destroys clay-humus complex and finally
lead to possible nutrient deficiencies, such as Ca and Mg, which are displaced by the high Na
content, or unavailable because the roots cannot penetrate into the subsurface (Hillel, 2004).
A vicious circle can set up once soils are sodic. Indeed, when sodic soils are wet, they
become sticky, and when they dry, they form a crusty layer that is nearly impermeable. Then
more water is lost due to evaporation or runoff and salts accumulate even more in the topsoil,
this worsens salinity and sodicity problems. Elevated salinity affects the ability of plants to
24
take up water to facilitate biochemical processes such as photosynthesis and plant growth
(Vance et al., 2004).
For example, a 2-year study conducted in the Powder River Basin (USA) showed that
irrigation with untreated CBM PW increased soil sodicity from 1.4 to 2.8 mmol/L (measured
on a saturated extract) while concentrations of Ca and Mg decreased, Na concentration
increased reaching levels that are potentially toxic to the crop (Burkhardt et al., 2015).
Another study in the same area showed that CBM PW increased the soil EC about two-fold
compared to pre-irrigation level (Johnston et al., 2008). Similar results were observed in
Alabama (USA) where CBM PW was used continuously for 30 days to irrigate sorghum and
sudangrass. The exchangeable Na percentage reached 40% indicating that long-term use of
CBM PW could lead to degradation of soil physical properties (Mullins and Hajek, 1998). In
Oman, irrigation with conventional oilfield PW increased soil EC from 1.63 to 7.08 dS/m
after 102 days of irrigation although fresh water was used at a regular frequency (28 days
totally) to leach salts, in the meantime, the SAR increased dramatically from 2.31 to 68.10
(Hirayama et al., 2002).
5.2.2 Risks related to heavy metals of produced water
Metalloids are generally studied because of their impact on human health and on the
environment, although some metals such as boron are known to be phytotoxic at high
concentration and are therefore an agronomic issue too (Qadir and Drechsel, 2016; Tal,
2016). Heavy metals do not biodegrade like organic pollutants, they chemically and
physically interact with naturally occurring substances, which alter their mobility. In fact,
some heavy metals are adsorbed, or bound to other particles, reducing their chance of
migration or absorption into plants. The degree to which different heavy metals are
immobilised in the soil is determined by the natural composition of the soil, pH, water
content, and temperature (Dube et al., 2001) although still not completely documented
25
(Pedrero et al., 2010). Heavy metals concentrate in plants (particularly leafy vegetables) and
can transfer into the food chain posing a threat to humans (Farrag et al., 2016; Rattan et al.,
2005). There is evidence of accumulation of Cu and Zn in soil using PW for irrigation in
Qatar (Ibrahim et al., 2009).
5.3 Adapting produced water to irrigation
From an agronomic perspective, soil salinisation and sodification are critical as they can
immediately impact soil structure and fertility because of the high loads of salt brought by
irrigation with saline-sodic PW. In contrast, heavy metals concentrations in PW may create
problems of toxicity to plants over a longer term (Table 2). Therefore, in order to use PW for
irrigation in dry areas, the water salinity and sodicity have to be within the suitable EC-SAR
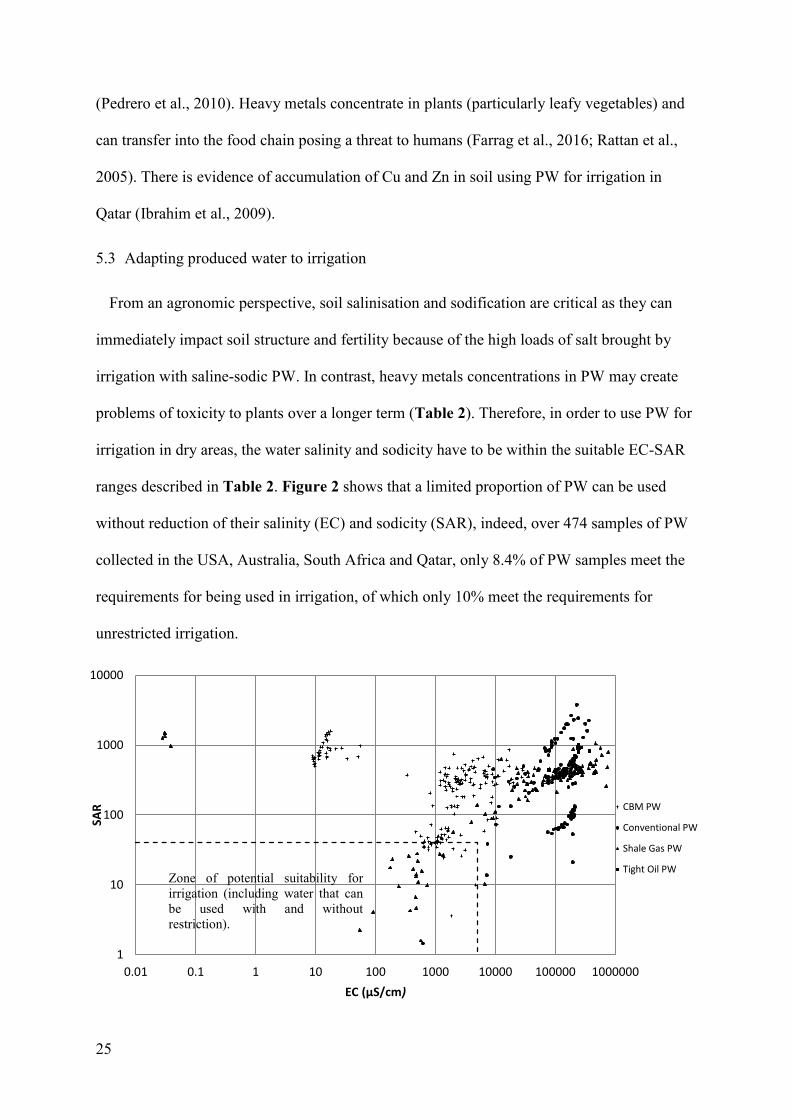
ranges described in Table 2. Figure 2 shows that a limited proportion of PW can be used
without reduction of their salinity (EC) and sodicity (SAR), indeed, over 474 samples of PW
collected in the USA, Australia, South Africa and Qatar, only 8.4% of PW samples meet the
requirements for being used in irrigation, of which only 10% meet the requirements for
unrestricted irrigation.
1
10
100
1000
10000
0.01 0.1 1 10 100 1000 10000 100000 1000000
SAR
EC (µS/cm)
CBM PW
Conventional PW
Shale Gas PW
Tight Oil PWZone of potential suitability for
irrigation (including water that can
be used with and without
restriction).
26
Figure 2. Sodicity (SAR) and salinity (EC) of 474 samples of PW associated to different
hydrocarbon types (CBM, conventional shale gas and tight oil) compared to irrigation water
quality guidelines based on salinity and sodicity hazard adapted from (ALL Consulting,
2003; Ayers and Westcot, 1985; Beletse et al., 2008; Brown et al., 2010; Burkhardt et al.,
2015; Dresel and Rose, 2010; Ganjegunte et al., 2005; Jackson and Myers, 2002; Janson et
al., 2015; Johnston et al., 2007; Mullins and Hajek, 1998; Myers, 2014; Szép and Kohlheb,
2010; USGS, 2016; Xu et al., 2008).
Although most PW cannot be sustainably used for irrigation, there are solutions for
reducing EC and SAR of PW in order to use it for irrigation. Blending of PW with low
salinity freshwater and PW desalination using reverse osmosis are the two principal solutions
commonly cited in the literature (Fisher et al., 2010; Guerra et al., 2011; Hagstrom et al.,
2016; Jakubowski et al., 2013; Sullivan Graham et al., 2015; Xu et al., 2008).
In California, the oil firm Chevron supplies Cawelo Water District with 44 million m3 of
treated PW which is then blended with fresh water to irrigate18,600 ha of food crops (Arnold
et al., 2004; Heberger and Donnelly, 2015; Martel-Valles et al., 2016). Another study in the
Powder River Basin (USA) showed that PW is suitable for irrigation when mixed with fresh
water in 1:3 ratio (Burkhardt et al., 2015). PW blending does not necessarily require a source
of high-quality freshwater. Treated municipal sewage, for example, can be mixed with PW to
obtain water suitable for irrigation.
Desalination can also be used to reduce PW salinity and sodicity. In the USA, CBM PW
has been treated to irrigation standards using ultra-low pressure reverse osmosis (ULPRO) at
an estimated cost of USD 0.24/m3 (Xu et al., 2008). Although desalination cost has always
been a limitation for using desalinated water in irrigation, the value of water resources
increases with water scarcity (Maton et al., 2010). Thus, in dry regions with developed
economies, such as the Gulf States, Israel and Spain, desalination could be justified for high-
value crops (Burn et al., 2015). Moreover, treating relatively low salinity PW instead of more
27
saline alternatives (e.g. brackish groundwater or seawater) might be economic (Kaner et al.,
2017; Qadir et al., 2007).
In addition to reducing the salinity and sodicity of PW, soil and crop management can be
adapted to be more resilient against the risks of soil salinisation and sodification. Selecting
salt-tolerant crops was found to be the principal factor for the sustainability of wastewater
irrigation (Ayers and Westcot, 1985; Maas and Grattan, 1999). Suitable crops should also
demonstrate a good marketing value in order to compensate the associated costs of using PW
(Fonseca et al., 2007).
Soil ameliorants help to counter undesirable effects of salinity and sodicity of PW. In fact,
irrigation with PW in combination with gypsum (CaSO4) and sulphur increase the sulphate
content of the soil, helping to mitigate soil dispersion by Na+ (Johnston et al., 2008). These
soil ameliorants individually and/or in combination are used in Australia and in the USA for
CBM PW application to agricultural croplands and grasslands (Biggs et al., 2012; Fisher et
al., 2010). Gypsum is used as a surface soil ameliorant to increase the level of Ca2+
in the
system (Amezketa et al., 2005; Guerra et al., 2011; Mace et al., 1999). Sulphur is used as a
surface soil ameliorant to decrease soil pH and enhance calcite (CaCO3) dissolution to release
Ca2+
into the soil solution to counter Na+ (Johnston et al., 2008). The addition of significant
organic amendments such as poultry manure (rich in calcium) can contribute to re-balance
the SAR (Pichtel, 2016). Other types of soil improvers may prove to be beneficial in treating
soil irrigated with PW. For example, use of synthetic polymers (e.g., polyacrylamides) to
stabilise aggregates has proved to be successful in improving the physical properties of sodic
soils (Alberta Environmental Sciences Division, 2001; Sumner, 1993).
Soil dilution may relieve salinity problems following the release of PW. Indeed, in arid and
semi-arid climates, contaminants tend to accumulate in the topsoil. Mixing of the less-
28
contaminated deeper soil with the surface soil can result in dilution of contaminants (Wolf et
al., 2015).
Leaching salts below the root zone helps to control soil salinity. It also contributes to the
restoration of the SAR to a suitable range of values by leaching excess sodium (Johnston et
al., 2008). The volume of water and the frequency of leaching fractions depend on the PW
quality, crop and climate.
Combining leaching and soil ameliorants (sulphur burners) has been proved to be efficient to
stabilise soil sodicity when CBM PW has been used for irrigation (Vance et al., 2004).
6 Conclusion
A significant part of current and forecast volumes of PW will be produced in drylands
where water scarcity demands alternative irrigation water sources. PW could be an effective
resource in drylands; indeed, at the global scale, about 45% of PW is discharged, disposed of,
or not reused in a beneficial way. However, quality remains the principal challenge for the
reuse of this massive quantity of PW in irrigation. In fact, most PW are high in salts ([TDS] =
35–472 000 mg/L) and sodium ([Na] = 3–435 000 mg/L). As a consequence, the main risks
for the soil of using PW in irrigation are soil salinisation and sodification as observed in the
reviewed experiences of irrigation with PW. Nonetheless, these issues are not unique to PW,
and dryland farming is often prone to challenges in soil salinity management.
Of the PW samples from around the world summarised in this paper, only a limited
proportion (8.4%) were potentially suitability for irrigation in terms of EC-SAR, and for most
PW, water treatment, water blending and/or farm-based management techniques would be
required to mitigate the risks of soil degradation. The costs of achieving the desired water
quality will be very site-specific and will depend, for example, on the PW quality, the cost of
energy, and the opportunity cost and availability of alternative water supplies. Similarly, the
benefit of using PW for irrigation will depend on the local market for the crop produced and
29
cost of alternative PW disposal methods. However, in arid areas, where alternative water
sources are not available and where the desalination industry is well established with
competitive costs, using treated PW to produce and economic output may provide social,
economic and environmental advantages over alternative methods of disposal.
Although well-documented studies exist, they are often limited to particular cases (e.g.
field experiments in specific locations with their specific soils, climates and economic
backgrounds) and cannot easily be extrapolated to world drylands. Also, the reuse of PW for
the irrigation of food crops is still not widely considered compared to non-food crops,
although food crops could be a resource of primary interest in drylands. Further integrated
research is necessary regarding the understanding of the sustainability of food crop irrigation
with PW in drylands including its economic feasibility.
30
Acknowledgment
This work was made possible by the support of a National Priorities Research Programme
(NPRP) grant from the Qatar National Research Fund (QNRF), grant reference number NPRP8-
1115-2-473. The statements made herein are solely the responsibility of the authors.
References
Abousnina, R.M., Nghiem, L.D., Bundschuh, J., 2015. Comparison between oily and coal seam
gas produced water with respect to quantity, characteristics and treatment technologies: A
review. Desalin. Water Treat. 54, 1793–1808.
Ahan, J.A., 2014. Characterization of produced water from two offshore oil fields in Qatar. MSc
thesis, Qatar Univiversity. doi:10.1007/s13398-014-0173-7.2. Available at:
http://quspace.qu.edu.qa/bitstream/handle/10576/3287/Ahan, Jumana Ahmad.pdf (accessed
18.04.18).
Al-Haddabi, M., Vuthaluru, H., Mushtaque, A., Znad, H., 2015. Use of Ceramic Membrane
Technology for Sustainable Management of Oil Production Water: A Review, in: Baawain,
M., Choudri, B.., Ahmed, M., Purnama, A. (Eds.), Recent Progress in Desalination,
Environmental and Marine Outfall Systems. Springer International Publishing, New York,
pp. 11–24. doi:10.1007/978-3-319-19123-2
Al-Mahrooqi, M.A., Marketz, F., Hinai, G., 2007. Improved well and reservoir management in
horizontal wells using swelling elastomers, in: SPE Annual Technical Conference and
Exhibition. Society of Petroleum Engineers, Anaheim, pp. 1–8.
Alanezi, Y.H.., 2016. Cross-flow microfiltration of synthetic oily wastewater using multi-
channel ceramic membrane, in: Ismail, A.F., Matsuura, T. (Eds.), Membrane Technology
for Water and Wastewater Treatment, Energy and Environment. CRC Press, London, pp.
31
71–83.
Alberta Environmental Sciences Division, 2001. Salt Contamination Assessment and
Remediation Guidelines. Edmonton. doi:10.1007/s13398-014-0173-7.2. Available at:
http://archive.org/details/saltcontaminatio00albe (accessed 18.04.18).
ALL Consulting, 2003. Handbook on Coal Bed Methane Produced Water: Management and
Beneficial Use Alternatives. Ground Water Protection Research Foundation, U.S.
Department of Energy, National Petroleum Technology Office, Bureau of Land
Management. Tulsa. Available at: http://www.gwpc.org/e-
library/documents/general/Coalbed Methane Produced Water Management and Beneficial
Use Alternatives.pdf (accessed 18.04.18).
Alleman, D., 2011. Treatment of shale gas produced water for discharge. Presentation at the EPA
Technical Workshops for the Hydraulic Fracturing Study -Water Resources Management,
Washington D.C., March 29-30. Available at: http://www.epa.gov/hfstudy/17_Alleman_-
_Produced_Water_508.pdf (accessed 18.04.18).
Alley, B., Beebe, A., Rodgers, J., Castle, J.W., 2011. Chemical and physical characterization of
produced waters from conventional and unconventional fossil fuel resources. Chemosphere
85, 74–82.
Amezketa, E., Aragüés, R., Gazol, R., 2005. Efficiency of sulfuric acid, mined gypsum, and two
gypsum by-products in soil crusting prevention and sodic soil reclamation. Agron. J. 97,
983–989.
Arnold, R., Burnett, D.B., Elphick, J., Feeley III, T.J., Galbrun, M., Hightower, M., Jiang, Z.,
Khan, M., Lavery, M., Luffey, F., Verbeek, P., 2004. Managing Water - From Waste to
Resource. Oilf. Rev. 16, 26–41.
32
Ayers, R.S., Westcot, D.W., 1985. Water quality for agriculture. Food and Agricultural
Organization (FAO). Irrig. Drain. Pap. 29, 174.
Barrow, C.., 1992. World atlas of desertification. United Nations Environment Programme
(UNEP), Land Degradation and Development. Wiley-Blackwell, London.
doi:10.1002/ldr.3400030407
Beletse, Y.G., Annandale, J.G., Steyn, J.M., Hall, I., Aken, M.E., 2008. Can crops be irrigated
with sodium bicarbonate rich CBM deep aquifer water? Theoretical and field evaluation.
Ecol. Eng. 33, 26–36.
Biggs, A., Witheyman, S., Williams, K., Cupples, N., 2012. Assessing the salinity impacts of
coal seam gas water on landscapes and surface streams. Final Report of Activity 3 of the
Healthy HeadWaters Coal Seam Gas Water Feasibility Study. Department of Natural
Resources and Mines, Toowoomba. Available at:
http://www.protectlimestonecoast.org.au/wp-content/uploads/2015/01/water-salinity-csg-
headwaters.pdf (accessed 18.04.18).
Blackam, M., 2017. The relationship between energy and water in unconventional gas: Source,
fate and water-energy intensity. Available at: http://www.coffey.com/en/ingenuity-
coffey/water-and-energy-in-unconventional-gas (accessed 18.04.18).
BP, 2017. British Petroleum (BP) Energy Outlook 2017 edition: data tables [WWW Document].
URL http://www.bp.com/en/global/corporate/energy-economics/energy-outlook/energy-
outlook-downloads.html (accessed 3.8.17).
Breuer, R., 2017. Nimr Water Treatment Plant, in: Produced Water Workshop. NEL, Aberdeen,
p. 14. Available at: http://www.tuvnel.com/site2/subpage/pww2017pres (accessed
18.04.18).
33
Breuer, R., 2011. Produced water treatment using wetlands - Reducing the environmental impact
of oilfield operations. SPE European Health, Safety and Environmental Conference in Oil
and Gas Exploration and Production, 22-24 February, Vienna, Austria. Available at:
http://doi.org/10.2118/140124-MS (accessed 18.04.18).
Brown, T., Morris, J., Richards, P., Mason, J., 2010. Effects of Irrigating with Treated Oil and
Gas Product Water on Crop Biomass and Soil Permeability: Final Technical Report.
Pittsburgh. doi:10.2172/1007996. Available at: http://www.osti.gov/servlets/purl/1007996-
NS1Xsy/ (accessed 18.04.18).
Burkhardt, A., Gawde, A., Cantrell, C.L., Baxter, H.L., Joyce, B.L., Stewart, C.N., Zheljazkov,
V.D., 2015. Effects of produced water on soil characteristics, plant biomass, and secondary
metabolites. J. Environ. Qual. 44, 1938–1947.
Burn, S., Hoang, M., Zarzo, D., Olewniak, F., Campos, E., Bolto, B., Barron, O., 2015.
Desalination techniques - A review of the opportunities for desalination in agriculture.
Desalination 364, 2–16.
Burnett, D.B., 2004. Potential for beneficial use of oil and gas produced water, Global Petroleum
Institute, Texas Water Resources Institute.
Cawelo Water District, 2015. 2015 Agricultural Water Management Plan. Bakersfield. Available
at: http://www.water.ca.gov/wateruseefficiency/sb7/docs/2016/Cawelo WD 2016
AWMP.pdf (accessed 18.04.18).
CGIAR, 2015. Assessing the importance of agricultural and tree biodiversity in dryland
production systems [WWW Document]. URL
http://www.bioversityinternational.org/news/detail/assessing-the-importance-of-
agricultural-and-tree-biodiversity-in-dryland-production-systems/ (accessed 3.8.17).
34
Clark, C., Veil, J., 2015. U.S. Produced Water Volumes and Management Practices in 2012,
Groundwater Protection Council. Available at:
http://www.gwpc.org/sites/default/files/Produced Water Report 2014-GWPC_0.pdf
(accessed 18.04.18).
Clark, C.E., Veil, J., 2009. Produced Water Volumes and Management Practices in the United
States, Argonne National Laboratory. Argonne. doi:10.2172/1007397. Available at:
http://www.ipd.anl.gov/anlpubs/2009/07/64622.pdf (accessed 18.04.18).
Commonwealth of Australia, 2014. Co-produced Water: Risks to Aquatic Ecosystems,
Background review. Canberra. Available at: http://www.environment.gov.au/water/coal-
and-coal-seam-gas/publications/background-review-co-produced-water (accessed
18.04.18).
Dal Ferro, B., Smith, M., 2007. Global Onshore and Offshore Water Production. Oil Gas Rev.
OTC Ed. 34–36.
Deng, S., Yu, G., Chen, Z., Wu, D., Xia, F., Jiang, N., 2008. Characterization of suspended
solids in produced water in Daqing oilfield. Colloids Surfaces A Physicochem. Eng. Asp.
332, 63–69.
Digital H2O, 2015. Produced water disposal trends in the permian basin. Presentation. Available
at: http://www.lbcg.com/media/downloads/events/615/pp17-piers-wells.11331.pdf
(accessed 18.04.18).
Dresel, P., Rose, A., 2010. Chemistry and origin of oil and gas well brines in western
Pennsylvania, Pennsylvania Geol. Surv., 4th series. Harrisburg. doi:Open-File Report
OFOG 1001.0
Dube, A., Zbytniewski, R., Kowalkowski, T., Cukrowska, E., Buszewski, B., 2001. Adsorption
35
and migration of heavy metals in soil. Polish J. Environ. Stud. 10, 1–10.
EIA, United States Energy Information Administration (EIA) [WWW Document], 2016. URL
http://www.eia.gov/beta/international/rankings/#?prodact=53-
1&cy=2015&pid=53&tl_type=a&aid=1&tl_id=1-A (accessed 3.8.17).
Ekins, P., Vanner, R., Firebrace, J., 2007. Zero emissions of oil in water from offshore oil and
gas installations: Economic and environmental implications. J. Clean. Prod. 15, 1302–1315.
El-Zanfaly, H.T., 2015. Wastewater reuse in agriculture: A way to develop the economies of arid
regions of the developing countries. J. Environ. Prot. Sustain. Dev. 1, 144–158.
Elgallal, M., Fletcher, L., Evans, B., 2016. Assessment of potential risks associated with
chemicals in wastewater used for irrigation in arid and semiarid zones: A review. Agric.
Water Manag. 177, 419–431.
Engle, M.A., Cozzarelli, I.M., Smith, B.D., 2014. USGS investigations of water produced during
hydrocarbon reservoir development. Available at: http://pubs.usgs.gov/fs/2014/3104/
(accessed 18.04.18).
Fakhru’l-Razi, A., Pendashteh, A., Abdullah, L.C., Biak, D.R.A., Madaeni, S.S., Abidin, Z.Z.,
2009. Review of technologies for oil and gas produced water treatment. J. Hazard. Mater.
170, 530–551.
FAO, 2016. Trees, forests and land use in drylands: The first global assessment. Rome.
Available at: http://www.fao.org/3/a-i5905e.pdf (accessed 18.04.18).
Farrag, K., Elbastamy, E., Ramadan, A., 2016. Health risk assessment of heavy metals in
irrigated agricultural crops, El-Saff wastewater canal, Egypt. Clean - Soil, Air, Water 44,
1174–1183.
Feng, S., Fu, Q., 2013. Expansion of global drylands under a warming climate. Atmos. Chem.
36
Phys. 13, 10081–10094.
Fisher, W.L., Bauder, J.W., Clements, W.H., Hua, I., Maest, A.S., Ray, A.W., Riese, W., Siegel,
D.I., Thyne, G., 2010. Management and Effects of Coalbed Methane Produced Water in the
United States. National Academies Press, Washington D.C. Available at:
http://www.nap.edu/catalog/12915/management-and-effects-of-coalbed-methane-produced-
water-in-the-western-united-states (accessed 18.04.18).
Fonseca, A.F. da, Herpin, U., Paula, A.M. de, Victória, R.L., Melfi, A.J., 2007. Agricultural use
of treated sewage effluents: agronomic and environmental implications and perspectives for
Brazil. Sci. Agric. 64, 194–209.
Freyman, M., 2014. Hydraulic Fracturing and Water Stress: Water Demand by the Numbers.
Ceres, Boston. Available at: http://www.ceres.org/resources/reports/hydraulic-fracturing-
water-stress-water-demand-numbers (accessed 18.04.18).
Galbraith, K., 2013. Fracking increase spurs fears over water use [WWW Document]. Texas
Trib. URL http://www.texastribune.org/2013/03/08/texas-water-use-fracking-stirs-concerns/
(accessed 3.8.17).
Ganjegunte, G.K., Vance, G.F., King, L.A., 2005. Tracking salt and sodium build up due to
irrigation with coalbed natural gas product water: Soil solution lysimeter and soil saturated
paste extract studies. J. Am. Soc. Min. Reclam. 378–387.
Garland, E., 2005. Environmental regulatory framework in Europe: An update, in:
SPE/EPA/DOE Exploration and Production Environmental Conference. Society of
Petroleum Engineers, Galveston, pp. 1–10.
Gassert, F., Landis, M., Luck, M., Reig, P., Shiao, T., 2014. Aqueduct global maps 2.1:
Constructing decision-relevant global water risk indicators, World Resources Institute.
37
Washington DC. Available at:
http://www.wri.org/sites/default/files/Aqueduct_Global_Maps_2.1.pdf (accessed 18.04.18).
Global Water Intelligence, 2014. Water for offshore oil and gas 122. Available at:
http://www.globalwaterintel.com/client_media/uploaded/Chantal/Water_for_Offshore_Oil_
and_Gas_Sample_pages.pdf (accessed 18.04.18).
Gordon, D., 2015. The abundance of oils in the water-stressed Rockies [WWW Document].
Carnegie Endow. Int. Peace. URL http://carnegieendowment.org/2015/01/05/abundance-of-
oils-in-water-stressed-rockies-pub-57637 (accessed 3.8.17).
Gratzfeld, J., 2003. Introduction, in: Gratzfeld, J. (Ed.), Extractive Industries in Arid and Semi-
Arid Zones: Environmental Planning and Management. IUCN, Gland, pp. 6–9.
doi:10.2305/IUCN.CH.2004.CEM.1.en
Guerra, Dahm, K., Dundorf, S., 2011. Oil and Gas Produced Water Management and Beneficial
Use in the Western United States, Reclamation. Denver. doi:3180. Available at:
http://www.usbr.gov/research/dwpr/reportpdfs/report157.pdf (accessed 18.04.18).
Gulf Intelligence, 2016. Produced water: Five key recommendations [WWW Document]. URL
http://www.thegulfintelligence.com/Docs.Viewer/6138f24c-a23c-43e2-8270-
793ec8a51dfd/default.aspx (accessed 3.8.17).
Hagstrom, E.L., Lyles, C., Pattanayek, M., DeShields, B., Berkman, M.P., 2016. Produced water:
Emerging challenges, risks, and opportunities. Environ. Claims J. 28, 122–139.
Hansen, B., Davies, S., 1994. Review of potential technologies for the removal of dissolved
components from produced water. Chem. Eng. Res. Des. 72, 176–188.
Healy, R.W., Alley, W.M., Engle, M.A., McMahon, P.B., Bales, J.D., 2015. The Water-Energy
Nexus: An Earth Science Perspective: U.S. Geological Survey Circular 1407. USGS,
38
Reston. doi:10.3133/cir1407
Heberger, M., Donnelly, K., 2015. Oil, Food, and Water: Challenges and Opportunities for
California Agriculture. Oakland. Available at: http://pacinst.org/wp-
content/uploads/2015/12/PI_OilFoodAndWater_.pdf (accessed 18.04.18).
Hillel, D., 2004. Chapter 9: Solute Movement and Soil Salinity, in: Introduction to
Environmental Soil Physics. Elsevier Academic Press, San Diego, pp. 167–186.
doi:10.1017/CBO9781107415324.004
Hirayama, A., Maegaito, M., Kawaguchi, M., Ishikawa, A., Sueyoshi, M., Al-Bemani, A.S.,
Mushtaque, A., Esechie, H., Al-Mazrui, S.A., Al-Haddabi, M.H., Al-Khanjari, S.S., 2002.
Omani oil fields produced water: Treatment and utilization, in: SPE International Petroleum
Conference and Exhibition in Mexico. Society of Petroleum Engineers, Villahermosa.
Hitaj, C., Boslett, A., Weber, J.G., 2014. Shale development and agriculture. Choices 29, 1–7.
Available at: http://choicesmagazine.org/choices-magazine/theme-articles/is-the-natural-
gas-revolution-all-its-fracked-up-to-be-for-local-economies/shale-development-and-
agriculture (accessed 18.04.18).
Hladik, M.L., Focazio, M.J., Engle, M., 2014. Discharges of produced waters from oil and gas
extraction via wastewater treatment plants are sources of disinfection by-products to
receiving streams. Sci. Total Environ. 466–467, 1085–1083.
Ibrahim, Y., Marroff, A., Wafi, M., 2009. Effect of irrigation with gas produced water enriched
with CO2 on alfalfa growth, quality and mineral content. J.Sc. Tech 10, 36–46.
IEA, 2013. World Energy Outlook 2013, 2nd ed, International Energy Agency (IEA). IEA
Publications, Paris. doi:10.1787/20725302
IESC, 2014. Coal seam gas extraction and co-produced water, fact sheet, Independent Expert
39
Scientific Committee on Coal Seam Gas and Large Coal Mining Development. Available
at: http://www.iesc.environment.gov.au/publications/csg-extraction-and-co-produced-water
(accessed 18.04.18).
Igunnu, E.T., Chen, G.Z., 2014. Produced water treatment technologies. Int. J. Low-Carbon
Technol. 9, 157–177.
IOGP, 2014. Environmental Performance Indicators: 2014 Data. International Association of Oil
and Gas Producers (IOGP). London. Available at:
http://www.iogp.org/bookstore/theme/environmental-performance-indicators/ (accessed
18.04.18).
Jackson, L., Myers, J., 2002. Alternative use of produced water in aquaculture and hydroponic
systems at Naval Petroleum Reserve No. 3. Aquaculture 3, 1–11. Available at:
http://www.gwpc.org/sites/default/files/event-sessions/Lorri_Jackson_PWC2002_0.pdf
(accessed 18.04.18).
Jacobs Consultancy, 2010. Estimating crude oil production carbon intensity. Presentation at the
California Air Resources Board. Available at:
http://www.arb.ca.gov/fuels/lcfs/lcfs_meetings/050610jacobs-prstn.pdf (accessed 18.04.18).
Jacobs, R.P.W.M., Grant, R.O.H., Kwant, J., Marquenie, J.M., Mentzer, E., 1992. The
composition of produced water from Shell operated oil and gas production in the North Sea,
in: Ray, J.P., Engelhardt, F.R. (Eds.), Produced Water: Technological Environmental Issues
and Solutions. Plenum Press, San Diego, pp. 13–21. doi:10.1007/978-1-4615-2902-6_2
Jakubowski, R., Haws, N., Ellerbroek, D., Murtagh, J., Macfarlane, D., 2013. Development of a
management tool to support the beneficial use of treated coal seam gas water for irrigation
in Eastern Australia. Mine Water Environ. 33, 133–145.
40
Janson, A., Katebah, M., Santos, A., Minier-Matar, J., Hussain, A., Adham, S., Judd, S., 2015.
Assessing the biotreatability of produced water from a Qatari gas field, in: International
Petroleum Technology Conference. Doha, pp. 1113–1119.
Johnston, C.R., Vance, G.F., Ganjegunte, G., 2007. Changes in soil physical and chemical
properties of a cropland irrigated with CBNG co-produced water, in: National Meeting of
the American Society of Mining and Reclamation. American Society of Mining and
Reclamation, Gillette, pp. 350–372. doi:10.21000/JASMR07010350
Johnston, C.R., Vance, G.F., Ganjegunte, G.K., 2008. Irrigation with coalbed natural gas co-
produced water. Agric. Water Manag. 95, 1243–1252.
Kaner, A., Tripler, E., Hadas, E., Ben-Gal, A., 2017. Feasibility of desalination as an alternative
to irrigation with water high in salts. Desalination 416, 122–128.
doi:10.1016/j.desal.2017.05.002
Keesom, W., Unnasch, S., Moretta, J., 2009. Life Cycle Assessment Comparison of North
American and Imported Crudes. Alberta Energy Research Institute, Chicago. Available at:
http://climateactionnetwork.ca/2009/07/18/09-07-jacobs-consultancy-life-cycle-assessment-
comparison-of-north-american-and-imported-crudes/ (accessed 18.04.18).
Khan, S., Kordek, G., 2013. Coal Seam Gas : Produced Water and Solids. Prepared for the Office
of the New South Wales Chief Scientist and Engineer (OCSE). Available at:
http://www.chiefscientist.nsw.gov.au/__data/assets/pdf_file/0017/44081/OCSE-Final-
Report-Stuart-Khan-Final-28-May-2014.pdf (accessed 18.04.18).
Khatib, Z., Verbeek, P., 2002. Water to value: Produced water management for sustainable field
development of mature and green fields, in: SPE International Conference on Health, Safety
and Environment in Oil and Gas Exploration and Production. Society of Petroleum
41
Engineers, Kuala Lumpur, p. 4. doi:10.2118/73853-MS
Kuraimid, Z.K., 2013. Treatment of produced water in north Rumela oil field for re-injection
application, in: SPE Kuwait Oil and Gas Show and Conference. Society of Petroleum
Engineers, Kuwait City, p. 12. doi:10.2118/167670-MS
Kurz, B.A., Stepan, D.J., Glazewski, K.A., Stevens, B.G., Doll, T.E., Kovacevich, J.T., Wocken,
C.A., 2016. Bakken water management practices and potential outlook. Grand Forks.
Available at:
http://www.undeerc.org/bakken/pdfs/Bakken_Water_Management_Practices_and_Potential
_Outlook.pdf (accessed 18.04.18).
Maas, E. V., Grattan, S.R., 1999. Crop yields as affected by salinity, in: van Schilfgaarde, J.,
Skaggs, R.. (Eds.), Agricultural Drainage. American Society of Agronomy, pp. 55–108.
doi:10.2134/agronmonogr38.c3
Maassen, S., 2016. Bibliometric analysis of research on wastewater irrigation during 1991-2014.
Irrig. Drain. 65, 644–653.
Mace, J.E., Amrhein, C., Oster, J.D., 1999. Comparison of gypsum and sulfuric acid for sodic
soil reclamation. Arid Soil Res. Rehabil. 13, 171–188.
Maguire-Boyle, S.J., Barron, A.R., 2014. Organic compounds in produced waters from shale gas
wells. Environ. Sci. Process. Impacts 16, 2237–2248.
Martel-Valles, F., Benavides-Mendoza, A., Mendoza-Villarreal, R., Zermeño-González, A.,
Juárez-Maldonado, A., 2014. Agronomic use of produced water in tomato plants under
greenhouse conditions. Rev. Int. Contam. Ambient. 30, 365–377.
Martel-Valles, J.F., Foroughbakchk-Pournavab, R., Benavides-Mendoza, A., 2016. Produced
waters of the oil industry as an alternative water source for food production. Rev. Int.
42
Contam. Ambient. 32, 463–475.
Maton, L., Psarras, G., Kasapakis, G., Ravn Lorenzen, J., Andersen, M., Boesen, M., Nøhr Bak,
S., Chartzoulakis, K., Marcus Pedersen, S., Kloppmann, W., 2010. Assessing the net
benefits of using wastewater treated with a membrane bioreactor for irrigating vegetables in
Crete. Agric. Water Manag. 98, 458–464.
McCormack, P., Jones, P., Hetheridge, M.., Rowland, S.., 2001. Analysis of oilfield produced
waters and production chemicals by electrospray ionisation multi-stage mass spectrometry
(ESI-MSn). Water Res. 35, 3567–3578.
Millenium Ecosystem Assessment, 2005. Ecosystems and Human Well-Being: Desertification
Synthesis. World Resources Institute, Washington DC. Available at:
http://collections.unu.edu/view/UNU:2636 (accessed 18.04.18).
Miller, J., 2010. California drought is no problem for Kern County oil producers [WWW
Document]. URL http://www.circleofblue.org/2010/world/california-drought-is-no-
problem-for-kern-county-oil-producers/ (accessed 3.8.17).
Mullins, G.L., Hajek, B.F., 1998. Effects of coalbed methane-produced water on sorghum-
sudangrass growth and soil chemical properties. Commun. Soil Sci. Plant Anal. 29, 2365–
2381.
Myers, J.E., 2014. Chevron San Ardo Facility Unit (SAFU) Beneficial Produced Water Reuse
for Irrigation, in: SPE International Conference on Health, Safety and Environment. Society
of Petroleum Engineers, Long Beach, pp. 1–11.
Neff, J., 2002. Chapter 1: Produced water, in: Neff, J. (Ed.), Bioaccumulation in Marine
Organisms: Effect of Contaminants from Oil Well Produced Water. Elsevier, Amsterdam,
p. 468. doi:10.1016/S0146-6380(02)00213-9

43
Neff, J., Lee, K., DeBlois, E.M., 2011. Produced Water: Environmental Risks and Advances in
Mitigation Technologies, 6th ed. Springer, New York. doi:10.1007/978-1-4614-0046-2
NSW Government, 2013. Water and Coal Seam Gas Fact Sheet 4: Managing coal seam gas
produced water. New South Wales Government, Office of Water. Parramatta. Available at:
http://www.water.nsw.gov.au/__data/assets/pdf_file/0010/548713/groundwater_coal_seam_
gas_managing_produced_water.pdf (accessed 18.04.18).
NSW Government, 2011. Water pollution and the freshwater crisis. New South Wales (NSW)
Government [WWW Document]. URL
http://www.environment.nsw.gov.au/stormwater/HSIEteachguide/WaterPoln.htm (accessed
3.8.17).
Pedrero, F., Kalavrouziotis, I., Alarcón, J.J., Koukoulakis, P., Asano, T., 2010. Use of treated
municipal wastewater in irrigated agriculture: Review of some practices in Spain and
Greece. Agric. Water Manag. 97, 1233–1241.
Pedrick, C., 2012. Strategies for Combating Climate Change in Drylands Agriculture, in:
International Conference on Food Security in Drylands. ICARDA, Doha, p. 27. Available
at: http://ccafs.cgiar.org/publications/strategies-combating-climate-change-drylands-
agriculture-synthesis-dialogues-and (accessed 18.04.18).
Pichtel, J., 2016. Oil and gas production wastewater: Soil contamination and pollution
prevention. Appl. Environ. Soil Sci. 2016, 24.
Qadir, M., Drechsel, P., 2016. Contaminant Management in Water Reuse Systems, in: Eslamian,
S. (Ed.), Urban Water Reuse Handbook. CRC Press, Boca Raton, pp. 525–532.
Qadir, M., Sato, T., 2015. Water Reuse in Arid Zones, in: Eslamian, S. (Ed.), Urban Water Reuse
Handbook. CRC Press, Boca Raton, pp. 867–874.
44
Qadir, M., Sharma, B.R., Bruggeman, A., Choukr-Allah, R., Karajeh, F., 2007. Non-
conventional water resources and opportunities for water augmentation to achieve food
security in water scarce countries. Agric. Water Manag. 87, 2–22.
Rambeau, O., Morales de Lafond, R., Baldoni, P., Gosselin, J.P., Baccou, J.C., 2004. Low salt
petroleum produced water reuse: A farming alternative outside the food chain. Water Sci.
Technol. 50, 139–147.
Rattan, R.K., Datta, S.P., Chhonkar, P.K., Suribabu, K., Singh, A.K., 2005. Long-term impact of
irrigation with sewage effluents on heavy metal content in soils, crops and groundwater: A
case study. Agric. Ecosyst. Environ. 109, 310–322.
Reid, V., 2014. Drylands: some of the most biodiverse habitats in the world. Biodiversity 15, 65–
66.
Rhoades, J.D., Kandiah, A., Mashali, A.., 1992. The use of saline waters for crop production
(No. 48), FAO Irrigation and Drainage Paper. Rome.
Rice, C., Nuccio, V., 2000. Water produced with coal-bed methane. U.S Geol. Surv. Available
at: http://pubs.usgs.gov/fs/fs-0156-00/fs-0156-00.pdf (accessed 18.04.18).
Robles, H., 2016. Irrigation Water Quality Evaluation Cawelo Water District Bakersfield,
California. Available at:
http://www.waterboards.ca.gov/rwqcb5/water_issues/oil_fields/food_safety/data/studies/ca
welo_irrstudy.pdf (accessed 18.04.18).
Safriel, U., Adeel, Z., Niemeijer, D., Puigdefabregas, J., White, R., Lal, R., Winslow, M.,
Ziedler, J., Prince, S., Archer, E., King, C., Shapiro, B., Wessels, K., Nielsen, T., Portnov,
B., Reshef, I., Thonell, J., Lachman, E., McNab, D., 2006. Chapter 22: Dryland Systems, in:
El-Kassas, M., Ezcurra, E. (Eds.), Ecosystems and Human Well-Being: Current State and
45
Trends, Volume 1. Island Press, Washington DC, pp. 625–656.
Scanlon, B.R., Reedy, R.C., Nicot, J.-P., 2014. Comparison of water use for hydraulic fracturing
for unconventional oil and gas versus conventional oil. Environ. Sci. Technol. 48, 12386–
12393.
Shah, Y.T., 2014. Chapter 2: Role of Water in Recovery and Production of Raw Fuels, in: Water
for Energy and Fuel Production. CRC Press, Boca Raton, pp. 17–32.
Sharr, A., 2014. Water management trends and the Eagle Ford. Presentation at the EFCREO
Shale Oil and Gas Development Workshop: Management of Water Resources, Air
Resources and Oilfield Waste. Available at:
http://www.tamuk.edu/eagleford/pdf/Baker_Hughes_April Sharr.pdf (accessed 18.04.18).
Sluijterman, A.C., Al-Lawati, Y., Al-Asmi, S., Verbeek, P.H.J., Schaapveld, M.A.S.,
Cramwinckel, J., 2004. Opportunities for re-use of produced water around desert oil fields,
in: Abu Dhabi International Conference and Exhibition. SPE, Abu Dhabi, pp. 1–7.
doi:10.2118/88667-MS
Sorkhabi, R., 2010. The King of Giant Fields. Geoexpro 7, 24–31. Available at:
http://www.geoexpro.com/articles/2010/04/the-king-of-giant-fields (accessed 18.04.18).
Sorrell, S., Speirs, J., Bentley, R., Miller, R., Thompson, E., 2011. Shaping the global oil peak: A
review of the evidence on field sizes, reserve growth, decline rates and depletion rates.
Energy 37, 709–724.
SPE, 2011. Challenges in reusing produced water: SPE White Paper. Soc. Pet. Eng. 1–6.
Available at: http://www.spe.org/industry/challenges-in-reusing-produced-water.php
(accessed 18.04.18).
Stanic, J., 2014. Unconventional oil and gas production drives trends in water management and
46
treatment. Glob. Water Intell. 10–15. Available at: http://spe.org/en/print-article/?art=269
(accessed 18.04.18).
Stefanakis, A., 2016. Chapter 19: Ecological impact of water reuse, in: Eslamian, S. (Ed.),
Handbook of Urban Water Reuse. CRC Press, Boca Raton, pp. 219–227.
Stephenson, M.T., 1992. Part 1: A survey of produced water studies, in: Ray, J.P., Engelhardt,
F.R. (Eds.), Produced Water: Technological Environmental Issues and Solutions. Springer,
Boston, pp. 1–13. doi:10.1007/978-1-4615-2902-6
Sullivan Graham, E.J., Jakle, A.C., Martin, F.D., 2015. Reuse of oil and gas produced water in
south-eastern New Mexico: Resource assessment, treatment processes, and policy. Water
Int. 40, 809–823.
Sumner, M.E., 1993. Sodic soils: New perspectives. Aust. J. Soil Res. 31, 683–750.
Szép, A., Kohlheb, R., 2010. Water treatment technology for produced water. Water Sci.
Technol. 62, 2372–2380. doi:10.2166/wst.2010.524
Tal, A., 2016. Rethinking the sustainability of Israel’s irrigation practices in the drylands. Water
Res. 90, 387–394.
Terrel, H., 2015. Oil in water: Good to the last microdrop. World Oil 23. Available at:
http://www.nov.com/WorkArea/DownloadAsset.aspx?id=13137 (accessed 18.04.18).
Toze, S., 2006. Reuse of effluent water: Benefits and risks. Agric. Water Manag. 80, 147–159.
Transparency Market Research, 2016. Produced water treatment systems market: Global industry
analysis, size, share, growth, trends and forecast 2012-2020. Albany.
UN, 2012. Managing Water under Uncertainty and Risk. The Unided Nations (UN) World Water
Development Report 4, Volume 1. Paris. Available at:
http://www.unesco.org/new/fileadmin/MULTIMEDIA/HQ/SC/pdf/WWDR4 Volume 1-
47
Managing Water under Uncertainty and Risk.pdf (accessed 18.04.18).
UN, 2010. 2010–2020: United Nations (UN) decade for deserts and the fight against
desertification [WWW Document]. URL
http://www.un.org/en/events/desertification_decade/whynow.shtml (accessed 3.8.17).
US Department of Agriculture, 2015. California Drought: Crop Sectors [WWW Document].
URL http://www.ers.usda.gov/topics/in-the-news/california-drought-farm-and-food-
impacts/california-drought-crop-sectors.aspx (accessed 3.8.17).
US Department of Commerce, 2015. Bureau of Economic Analysis [WWW Document]. URL
http://www.bea.gov/ (accessed 3.8.17).
US EPA, 1995. United States Environmental Protection Agency (US EPA), Code of Federal
Regulations, Title 40–Protection of Environment, Chapter I, Subchapter N, Part 435–Oil
and Gas Extraction Point Source Category , Subpart E–Agricultural and Wildlife Water Use
Subcate [WWW Document]. Electron. Code Fed. Regul. URL http://www.ecfr.gov
(accessed 4.18.18).
USGS, 2016. U.S. Geological Survey National Produced Waters Geochemical Database v2.2
[WWW Document]. URL
http://energy.usgs.gov/EnvironmentalAspects/EnvironmentalAspectsofEnergyProductionan
dUse/ProducedWaters.aspx (accessed 6.19.17).
Van Voast, W.A., 2003. Geochemical signature of formation waters associated with coalbed
methane. Am. Assoc. Pet. Geol. Bull. 87, 667–676.
Vance, G.F., King, L.A., Ganjegunte, G.K., 2004. Soil and plant responses from land application
of saline-sodic waters: Implications of management. J. Environ. Qual. 37, S139-48.
Vaz, L., Di Falco, G., 2011. Advanced produced-water treatment & reuse for oilfields. Water
48
Today 36–46. Available at:
http://pdfs.semanticscholar.org/1c77/4e301c94e476fbedd86a8a2eb36b5a4aa351.pdf
(accessed 18.04.18).
Veil, J., 2011. Produced Water Management Options and Technologies, in: Lee, K., Neff, J.
(Eds.), Produced Water: Environmental Risks and Advances in Mitigation Technologies.
Springer, New York, pp. 537–571. doi:10.1007/978-1-4614-0046-2_29
Veil, J., Puder, M.G., Elcock, D., Redweik, R.J., 2004. A white paper describing produced water
from production of crude oil, natural gas, and coal bed methane. Available at:
http://109.4iranian.com/uploads/prodwaterpaper_1270.pdf (accessed 18.04.18).
Waldron, J., 2005. Southwest Hydrology. SAHRA, NSF Sci. Technol. Cent. 26–27. Available at:
http://www.swhydro.arizona.edu/archive/V4_N6/feature5.pdf (accessed 18.04.18).
Wang, W., Li, X., Chen, Y., Zhang, S., Jiang, Y., 2001. The technology of microbial treating
drained water of oil field, in: SPE Asia Pacific Improved Oil Recovery Conference. Society
of Petroleum Engineers, Kuala Lumpur, p. 4. doi:10.2118/72192-MS
Water Online, 2014. Testing the waters for offshore treatment [WWW Document]. URL
http://www.wateronline.com/doc/testing-the-waters-for-offshore-treatment-0001 (accessed
3.8.16).
Waterfind, 2016. California Water Board to investigate use of oilfield wastewater to irrigate
crops [WWW Document]. URL http://www.waterfindusa.com/news-posts/california-water-
board-to-investigate-use-of-oilfield-wastewater-to-irrigate-crops/ (accessed 3.8.17).
Williams, E.., Simmons, J.., 2013. Chapter 2: Water in fossil fuel and uranium extraction, in:
Williams, E.. (Ed.), Water in the Energy Industry: An Introduction. pp. 17–44. Available at:
http://www.bp.com/content/dam/bp/pdf/sustainability/group-reports/BP-ESC-water-
49
handbook.pdf (accessed 18.04.18).
Wolf, D.C., Brye, K.R., Gbur, E.E., 2015. Using soil amendments to increase Bermuda grass
growth in soil contaminated with hydraulic fracturing drilling fluid. Soil Sediment Contam.
An Int. J. 24, 846–864.
World Bank [WWW Document], 2016. URL
http://data.worldbank.org/indicator/SP.POP.TOTL?locations=ZQ (accessed 3.8.17).
Xu, P., Drewes, J.E., Heil, D., 2008. Beneficial use of co-produced water through membrane
treatment: Technical-economic assessment. Desalination 225, 139–155.