Embed Size (px)
Citation preview

Return on Investment Metrics:An Army Perspective
Presented by Noel Bishop
Presented at the 2010 ISPA/SCEA Joint Annual Conference and Training Workshop - www.iceaaonline.com

Purpose
To provide a Headquarters Department of the Army (HQDA) cost analyst’s perspective on what Return on Investment (ROI ) analysis is all about, when the analysis is required and some common pitfalls to avoid.
Presented at the 2010 ISPA/SCEA Joint Annual Conference and Training Workshop - www.iceaaonline.com

Agenda
• What is Return on Investment (ROI)?• When are ROI metrics used in the Army?• ROI Metric discussion
– Definitions– Sample of calculations
• The most important ROI Metrics• Avoiding the ROI Pitfalls• Summary
Presented at the 2010 ISPA/SCEA Joint Annual Conference and Training Workshop - www.iceaaonline.com
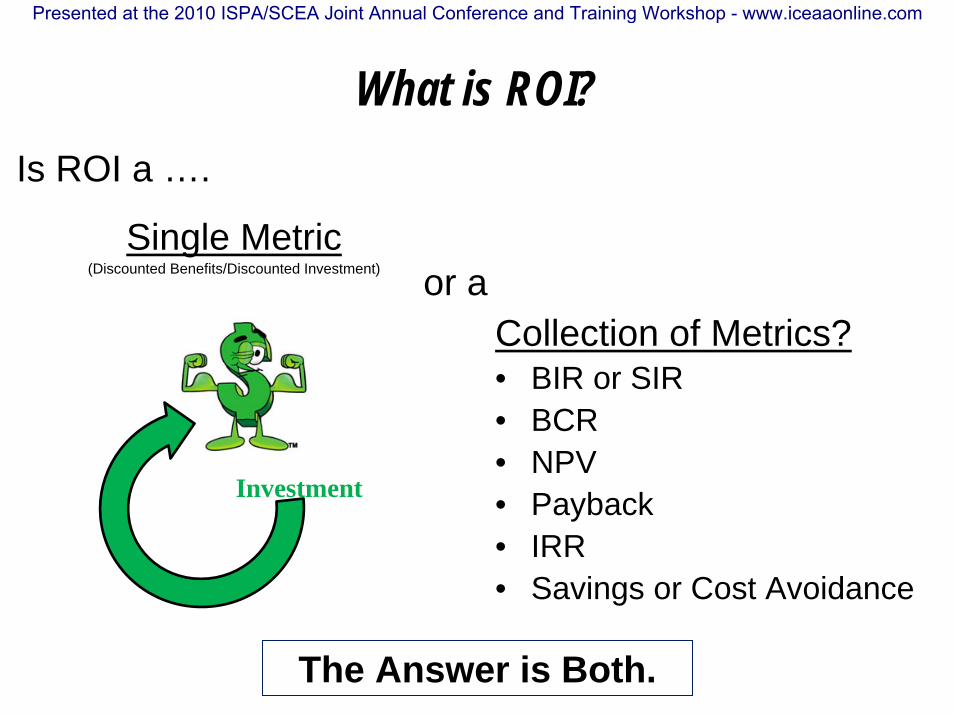
What is ROI?
Single Metric(Discounted Benefits/Discounted Investment)
Collection of Metrics?• BIR or SIR• BCR• NPV• Payback• IRR• Savings or Cost Avoidance
Is ROI a ….
or a
The Answer is Both.
Investment
Presented at the 2010 ISPA/SCEA Joint Annual Conference and Training Workshop - www.iceaaonline.com

When are ROI Metrics used in the Army
• Economic Analysis (EA)– Required for Major Automated Information Systems at
MS A (may be combined with AoA), MS B, and the Full Deployment Decision Review (FDDR) – DoDI 5000.02
• Cost Benefit Analysis (CBA)– Required when an unfunded requirement and new or
expanded program proposal submitted to the Secretary of the Army, Chief of Staff, Army, Under Secretary of the Army or Vice Chief of Staff, Army –USA/VCSA Memo, 30 Dec 2009
Presented at the 2010 ISPA/SCEA Joint Annual Conference and Training Workshop - www.iceaaonline.com

ROI Metrics
• Benefit to Cost Ratio (BCR) - The ratio of the present value (PV) of the total benefits (savings and cost avoidances) divided by the present value of the total costs. It does not include sunk costs.
BCR = PV Benefits / PV Costs
• Benefit to Investment Ratio – The ratio of the present value of the quantifiable benefits (savings and cost avoidances) divided by the present value of the investment (development, production, military construction, and fielding) of the alternative. It does not include benefits that are associated with sunk cost.
BIR = PV Benefits / PV Investment
• Savings to Investment Ratio – The ratio of the present value of savings to the present value of the investment required to produce savings. It does not include sunk costs.
SIR = PV Savings / PV Investment
Presented at the 2010 ISPA/SCEA Joint Annual Conference and Training Workshop - www.iceaaonline.com

ROI Metrics
• Break-Even Point – The point in time, for example, number of years or fractional years, at which the savings in current dollars equals the investment in current dollars. It does not include sunk cost.
Break-Even Point = Cum Investment = Cum Savings
• Net Present Value – The difference between the present value of the benefits and the present value of the costs.
NPV = PV Savings – PV Investment
All definitions are from the U.S. Army Cost Benefit Analysis Guide.
Presented at the 2010 ISPA/SCEA Joint Annual Conference and Training Workshop - www.iceaaonline.com

ROI SampleDiscount Rate1 2.2%
1 2 3 4 5 6 7 8 9 10Annual Discount Factor2 0.9892 0.9679 0.9470 0.9267 0.9067 0.8872 0.8681 0.8494 0.8311 0.8132
RDTE BY 2010 Composite Rates3 1.0121 1.0283 1.0455 1.0633 1.0814 1.0998 1.1185 1.1375 1.1568 1.1765OMA BY 2010 Composite Rates4 1.0095 1.0268 1.0440 1.0617 1.0798 1.0981 1.1168 1.1358 1.1551 1.1747
FY 2010 FY 2011 FY 2012 FY 2013 FY 2014 FY 2015 FY 2016 FY 2017 FY 2018 FY 2019 TotalInvestment Costs BY2010 $M 30.0 25.0 10.0 65.0 Investment Costs PV $M 29.7 24.2 9.5 63.3
Status Quo Cost BY2010 $M 50.0 50.0 50.0 50.0 50.0 50.0 50.0 50.0 50.0 50.0 500.0 Status Quo Costs PV $M 49.5 48.4 47.4 46.3 45.3 44.4 43.4 42.5 41.6 40.7 449.3
Alterative Costs BY2010 $M 50.0 50.0 50.0 15.0 15.0 15.0 15.0 15.0 15.0 15.0 255.0 Alterative Costs PV $M 49.5 48.4 47.4 13.9 13.6 13.3 13.0 12.7 12.5 12.2 236.4
Savings BY2010 $M - - - 35.0 35.0 35.0 35.0 35.0 35.0 35.0 245.0 Savings PV2010 $M - - - 32.4 31.7 31.1 30.4 29.7 29.1 28.5 212.9
Other Benefits BY2010 $M 15.0 15.0 15.0 15.0 15.0 15.0 15.0 105.0 Other Benefits PV$M - - - 13.9 13.6 13.3 13.0 12.7 12.5 12.2 91.2
Total Benefits BY2010 $M - - - 50.0 50.0 50.0 50.0 50.0 50.0 50.0 350.0 Total Benefits PV$M - - - 46.3 45.3 44.4 43.4 42.5 41.6 40.7 304.1
Investment Costs TY $M 30.4 25.7 10.5 - - - - - - - Cumulative Investment Costs TY$M 30.4 56.1 66.5 66.5 66.5 66.5 66.5 66.5 66.5 66.5
Savings TY $M - - - 37.2 37.8 38.4 39.1 39.8 40.4 41.1 Cumulative Savings TY $M - - - 37.2 75.0 113.4 152.5 192.2 232.7 273.8
Cum Savings - Cum Investment (30.4) (56.1) (66.5) (29.4) 8.4 46.9 85.9 125.7 166.1 207.2
1. 10 Year Real Discount Rate Per OMB Circular 94, December 2009 3.4 2. Mid-year discount factor equation: 1/(i+1)n-.5 4.8 3. 2010 Army Inflation Indices, January 2010 1.0 4. 2010 Army Inflation Indices, January 2010 149.5 5. SIR equation: PV Savings/PV Investments 20146. BIR equation: PV Benefits/PV Investments7. BCR equation: PV Benefits/PV Costs8. NPV equation: Discounted Savings-Discounted Investment9. Break Even: Year that cumulative savings - cumulative investment >1
Net Present Value8
Break Even Year9
Savings to Investment Ratio (SIR)5
Return on Investment Metrics Example
Benefits to Investment Ratio (BIR)6
Benefits to Cost Ratio (BCR)7
Presented at the 2010 ISPA/SCEA Joint Annual Conference and Training Workshop - www.iceaaonline.com

The Most Important ROI Metric
• Cost Reductions – A reduction in the number of dollars needed to meet an established requirement. There are two type of Cost Reductions: Savings and Cost Avoidances.
– Savings occur when an Army Manager can remove funds that are already programmed or budgeted and apply them to other needs.
– Cost Avoidances are cost reductions that are not savings. For example, a cost avoidance may be renegotiating lower server prices for an approved Army program that has not yet budgeted for that particular requirement.
• Enhancing productivity through a more efficient process does not necessarily mean there will be a cost reduction.
Savings Cost Avoidances
Cost Reductions
Presented at the 2010 ISPA/SCEA Joint Annual Conference and Training Workshop - www.iceaaonline.com

Determining a Cost Reduction
Will cost reduction enable a manger to remove
programmed or budgeted funds and apply them for
other uses ?
Will economic efficiency improvement result in a cost
reduction?
Economic Efficiency Improvement
Savings
Cost Avoidance
Productivity Improvement
Yes
Yes
No
No
Presented at the 2010 ISPA/SCEA Joint Annual Conference and Training Workshop - www.iceaaonline.com

Avoiding the ROI Pitfalls
• Know your audience and pick metrics that help make a good case while are easy to explain.
• Do not arbitrarily add years to your analysis to beef up your benefits so the ratios look better.
• Be careful to select the correct discount rates for the PV calculations.– Nominal discount rates are used for current year dollar flows– Real rates are used for constant year dollar flows– Select the correct rate corresponding to the number of years of your analysis
3 -Year 5-Year 7-Year 10-Year 20-Year 30-Year2.3 3.1 3.5 3.9 4.4 4.5
3 -Year 5-Year 7-Year 10-Year 20-Year 30-Year0.9 1.6 1.9 2.2 2.7 2.7
of Specified Maturities (in percent)
Nominal Interest Rates on Treasury Notes and Bondsof Specified Maturities (in percent)
Real Interest Rates on Treasury Notes and Bonds
Presented at the 2010 ISPA/SCEA Joint Annual Conference and Training Workshop - www.iceaaonline.com
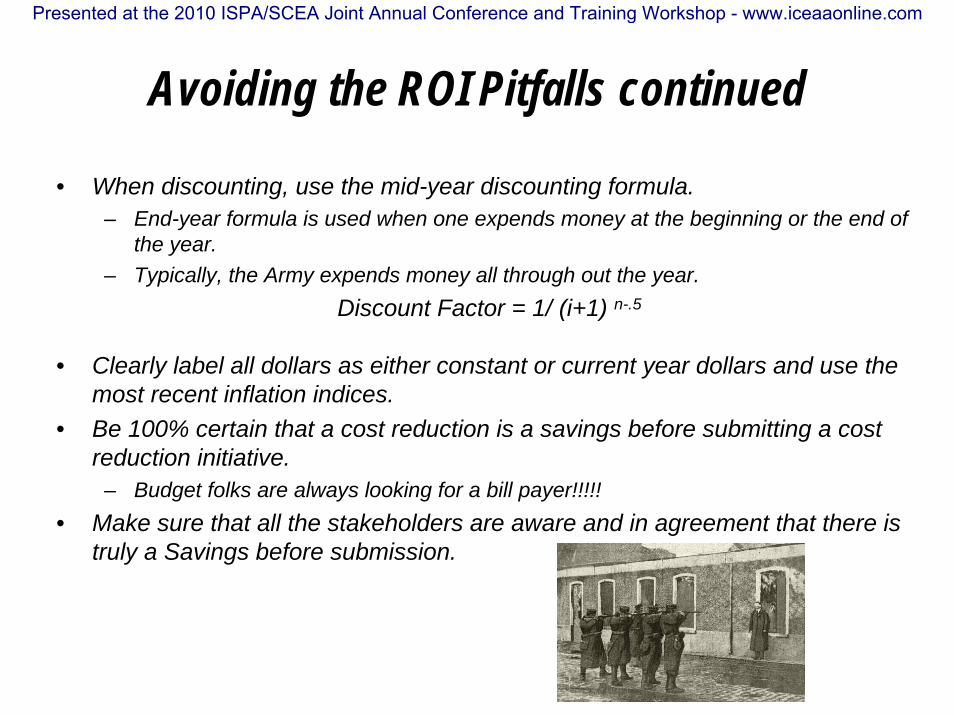
Avoiding the ROI Pitfalls continued
• When discounting, use the mid-year discounting formula.– End-year formula is used when one expends money at the beginning or the end of
the year.– Typically, the Army expends money all through out the year.
Discount Factor = 1/ (i+1) n-.5
• Clearly label all dollars as either constant or current year dollars and use the most recent inflation indices.
• Be 100% certain that a cost reduction is a savings before submitting a cost reduction initiative.
– Budget folks are always looking for a bill payer!!!!!• Make sure that all the stakeholders are aware and in agreement that there is
truly a Savings before submission.
Presented at the 2010 ISPA/SCEA Joint Annual Conference and Training Workshop - www.iceaaonline.com

Summary
• ROI can either be a single or collection of metrics.
• The Army uses ROI analysis in EAs and CBAs
• Clearly defined Cost Reductions are the most important metrics.
• Avoid falling into a ROI Pitfall!
Contact Noel Bishop at [email protected] with questions
Presented at the 2010 ISPA/SCEA Joint Annual Conference and Training Workshop - www.iceaaonline.com