Embed Size (px)
Citation preview
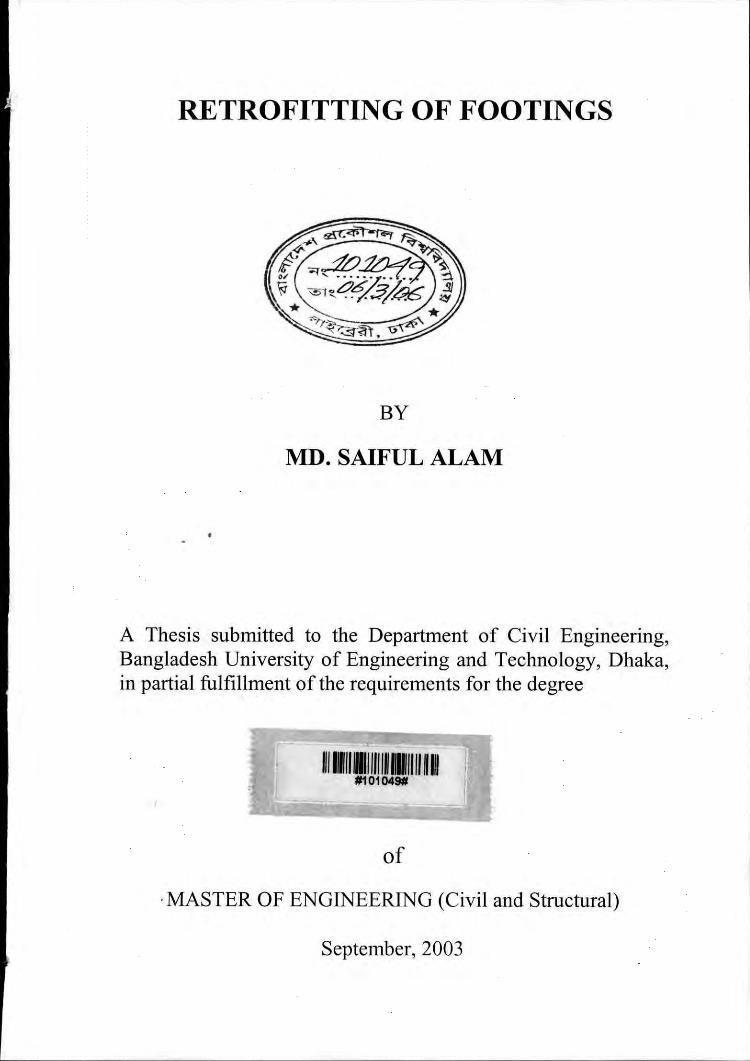
RETROFITTING OF FOOTINGS
BY
MD. SAIFUL ALAM
A Thesis submitted to the Department of Civil Engineering,Bangladesh University of Engineering and Technology, Dhaka,in partial fulfillment of the requirements for the degree
11/1111" 1111111111111111" " II "' '#101049#
of
.MASTER OF ENGINEERING (Civil and Structural)
September, 2003

The Project titled "RETROFITTING OF FOOTINGS" submitted by MD. SAIFUL
ALAM, Roll No. 9404326, Session: 1993-94-95 has been accepted as satisfactory in
partial fulfillment of the requirement for the degree of "Master of Engineering( Civil
and StnIcturaI)" on September 3,2003.
BOARD OF EXAMINERS
I.
2.
3.
Dr. Salek M. Seraj(Supervisor)Professor'Department of Civil Engineering, BUET, Dhaka.
Dr. Ishtiaque AhmedProfessorDepa,1ment of Civil Engineering, BUET, Dhaka.
~------Pl"OfessorDepa'lment of Civil Engineering, BUET, Dhaka.
Chairman
Member
Member

ToMy Teachers

ACKNOWLEDGEMENT
The author wishes to express the indebtedness and heartfelt gratitude to his supervisorDr. Salek M. Seraj, Professor, Department of Civil Engineering, BUET, for all theguidance, valuable advice and generous help at every step of the research work aswell as selecting the research topic with continued inspiration and encouragement,without which the work could not be finished at all.
Sincere appreciation and gratitude to the members of the Board of Post GraduateStudies of Civil Engineering Dept. BUET and all my teachers of this departmentwhose teachings brought me to my present stage.
The author owes thanks especially to Md. Mynul Hossain, a colleague andpostgraduate research student of Civil Engineering Dept. for his immeasurable helpand encouragement during the work.
The technical staff of concrete laboratory and strength of material laboratory werevery helpful during the experimental works. Thanks to all of them, especially Mr.Julhas Uddin, Mr. Barnard Rojario and Mr. Golam Rabbani.
The author wishes to thank his family members and friends for their continuousefforts and encouragement during the study and completion of the work.
Finally, the acknowledgements rendered towards the greatest blessings of theAlmighty Allah, the best Structural Engineer, Who has provided so many examples ofstructures and variations in his creations and given us knowledge to utilize them.
v
ABSTRACT
Footing is onc of thc most important structural e1cmcnts in the field of construction.Punching shear is a govel11ing factor to be considered in the dcsign of footings. Depthof footing is a major concern of punching strcngth calculation. Hence the increase offooting depth is expectcd to contributc to thc punching strength of existing footings.
A total of twelve model footings were cast and tested in the laboratory in an effort toascertain the effect of concrete overlay on the punching shear capacity of footings. Inthis regard model footings wcrc prepared with different combinations of concreteoverlay, compressive reinforcement, dowel bars. Test program was carried out togather basic infol111ation on real punching behavior of footings subjected toconccntrated loading.
The punching strength of footings with ovcrlay has been found to be significantlyhigher than that of footings without ovcrlay and having lesser thickness. It has beenobserved that footings having concrcte overlay could attain punching capacity verynear to the capacity of footings having similar thickness, but cast monolithically. Thecode specified strengths of thc specimens wcre calculated in accordance with ACI318-95, BS 8110-85, CAN3-A23.3-M84 and CEB-FIB. It appears that most of thecodes do not recognize the role of percentage of longitudinal stcel on the punchingshear strength. Overlay on old concrete provide additional punching strength; dowelbars and compressive rcinforccmcnt did not increasc the punching strength, but thesecontributed significantly in other ways. Dowels provided bonding between oldconcrete and overlay. Hencc, the samplcs of overlay with dowel behavedmonolithically at the timc of failure. On the other hand, overlay without dowel barswas separated during failure. Compressive reinforcement showed some significancefor the samples without overlay to rcduce the deflection. But it was not verysignificant for the samples with overlay.
VI,
CONTENTS
ACKNOWLEDGEMENT
ABSTRACT
CONTENTS
LIST OF FIGURES
LIST OF TABLES
NOTATIONS
Chapter ONE: INTRODUCTION1.1 General
1.2 Present State of Art of the Research Topic
1.3 Objective of the Study
1.4 Methodology
Chapter TWO : LITERATURE REVIEW2.1 General2.2 Relationship of Punching Shear Capacity of
Reinforced Concrete with different parameters
Page No.
v
VIVII
xXIIIXIV
1
1
2
2
4
4
2.2.12.2.22.2.3
Concrete Strength
Effect of Size
Effeet of Footing Thickness
4
4
5
2.3 Strengthening of Reinforced Concrete Footing 5
2.3.12.3.2
Strengthening by Overlay
Concrete overlay with reinforcement
at compression area
VII
5
5
Chapter THREE: EXPERIMENTAL PROGRAM3.1 General3.2 Materials
3.2.1 General3.2.2 Cement3.2.3 Fine Aggregate3.2.4 Coarse Aggregate
3.2.5 Water3.2.6 Water Cement Ratio3.2.7 Reinforcement
666667
777
Concrete Work3.3
3.3.1
3.3.23.3.33.3.43.3.53.3.63.3.73.3.83.3.93.3.10
FormworkLayout of ReinforcementMixing of ConcretePlacing of concreteDowel BarReinforcement at compression zoneConcrete OverlayCasting of CylinderCuring of ConcreteTest Specimen
8
888
88999910
3.4 Testing Procedure 28
4.2.6 Summary of Code of Provision
3232
American (ACI 318, 1995) Code 32British (BS 8110, 1985) Code 33Canadian (CAN 3-A23.3-M84, 1984) Code 33European (CEB-FIP, 1978) Code 34Bangladesh (BNBC, 1993) Code 34
35
4.2.14.2.24.2.34.2.44.2.5
Chapter FOUR: CODE OF PROVISION4.1 Introduction4.2 Recognized Code of Provisions
VIII
Chapter FIVE: EXPERIMENTAL RESULTS AND DISCUSSION
5.1 General
5.2 Ultimate Load Capacity
5.3 Effect of Overlay
5.4 Effect of Dowel Bar
5.5 Effect of Reinforecmcnt Bar at Compression Area
5.6 Effect of Higher Strength Concrete for Overlay
5.7 Load Deflection Characteristics
5.8 Cracking Pattcrn
5.9 Comparison of Test results with Different Codes
Chapter SIX: CONCLUSION AND RECOMMENDATIONS
6.1 Conclusions
6.2 Recommendation for Future Research
REFERENCES
36
3642
42
43
43
43
6262
7171
72
APPENDIX A
APPENDIX B
APPENDIX C
Calculation of punching shear strength according todi fferent code of prediction
Cylinder strength of concrete on the day of testing ofFootings
Load -deflection table from test results
IX
73
78
80
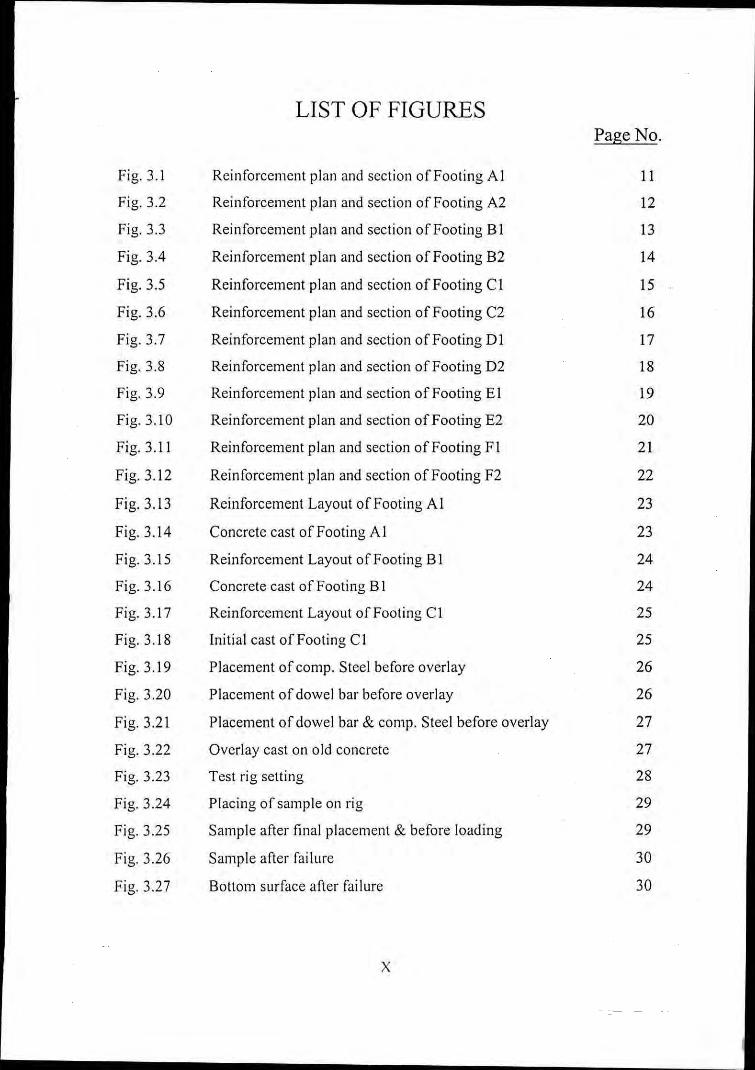
LIST OF FIGURESPage No.
Fig. 3.1 Rcinforccmcnt plan and scction of Footing Al II
Fig. 3.2 Rcinforcemcnt plan and section of Footing A2 12
Fig. 3.3 Rcinforccmcnt plan and scction of Footing B I 13
Fig. 3.4 Rcinforccmcnt plan and scction of Footing B2 14
Fig. 3.5 Rcinforccmcnt plan and scction of Footing CI 15
Fig. 3.6 Rcinforccmcnt plan and scction of Footing C2 16
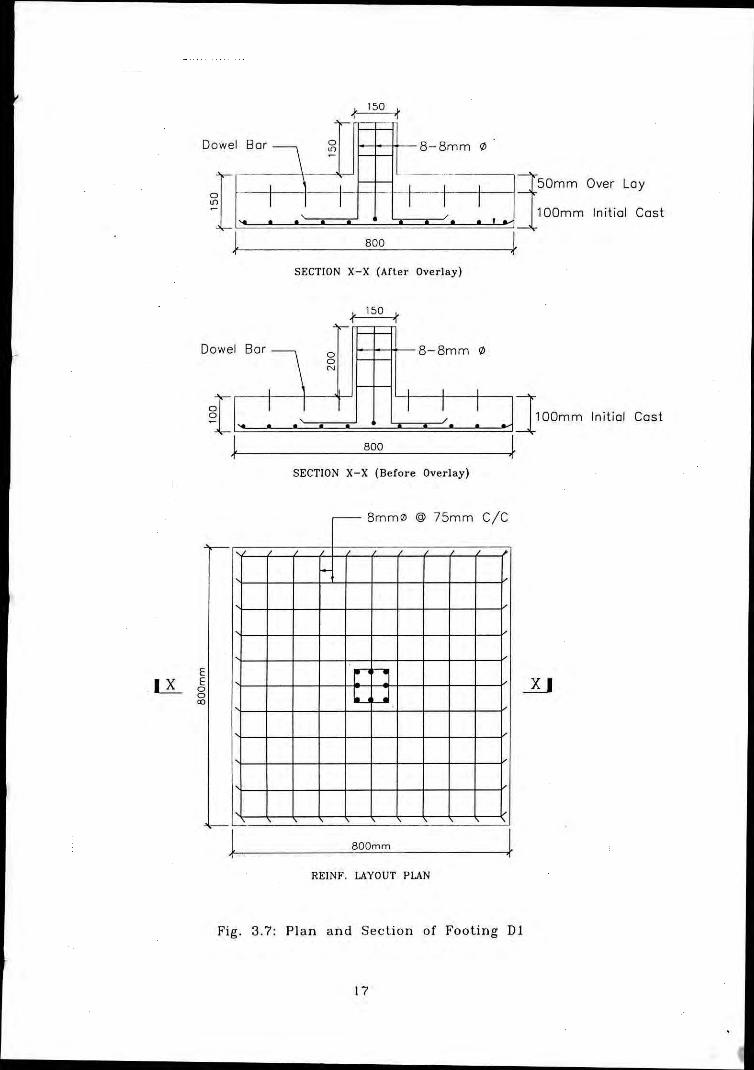
Fig. 3.7 Rcinforccmcnt plan and scction of Footing DI 17
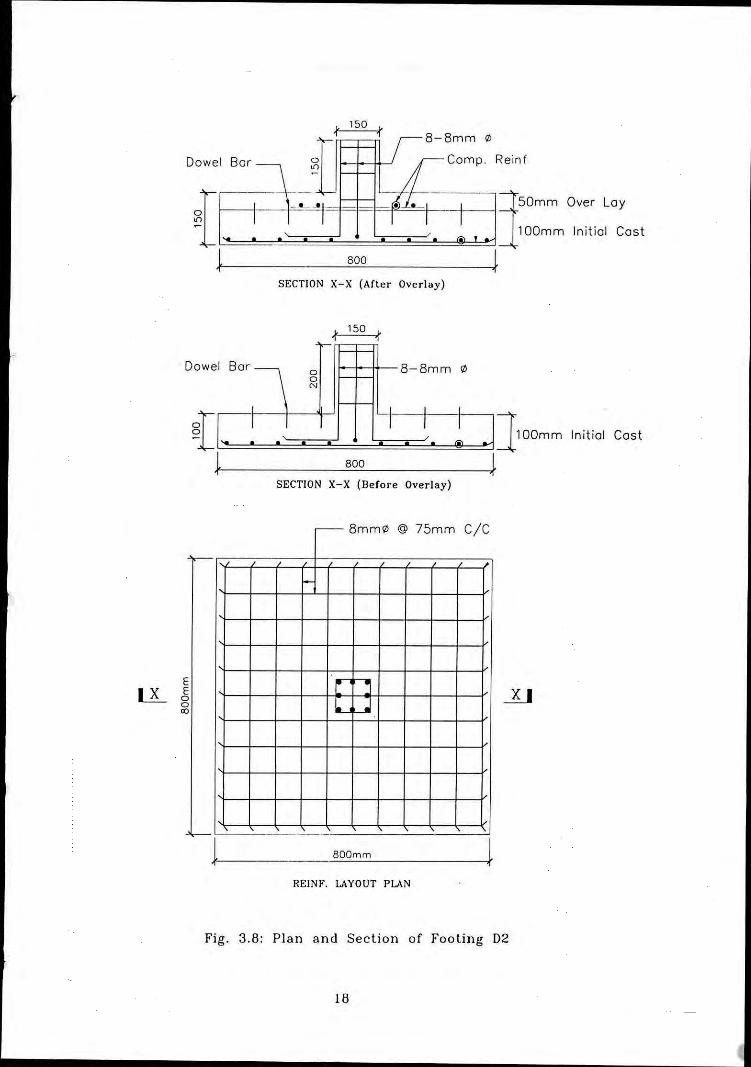
Fig. 3.8 Rcinforccmcnt plan and scction of Footing D2 18
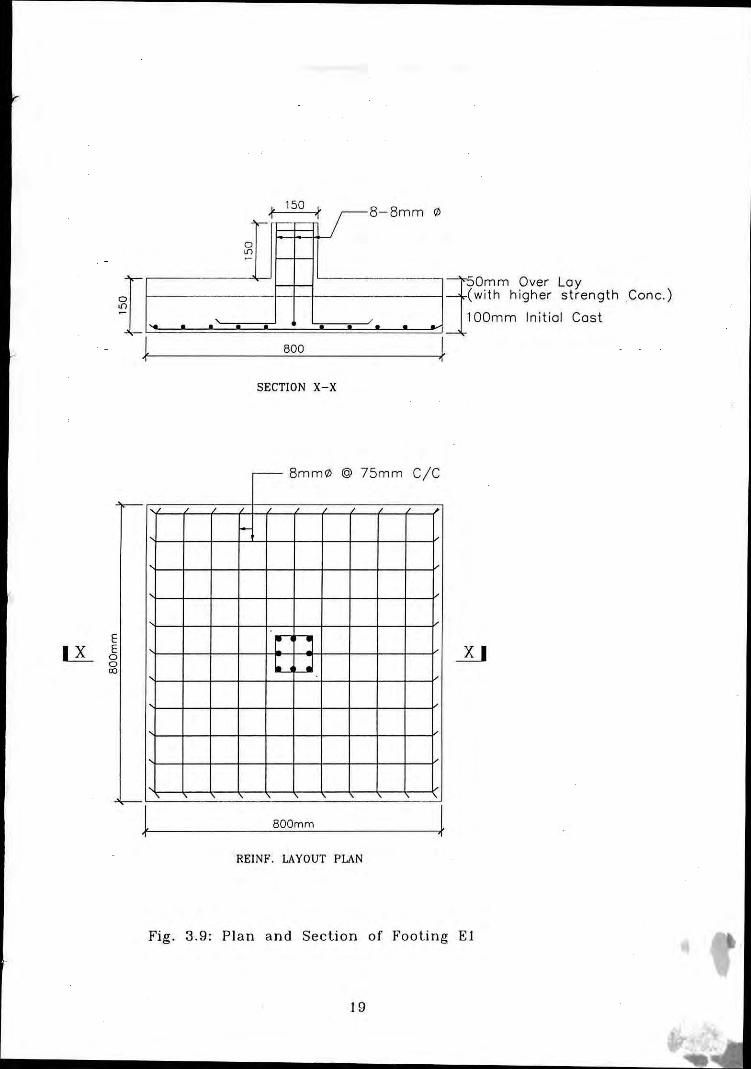
Fig. 3.9 Rcinforccmcnt plan and scction of Footing EI 19
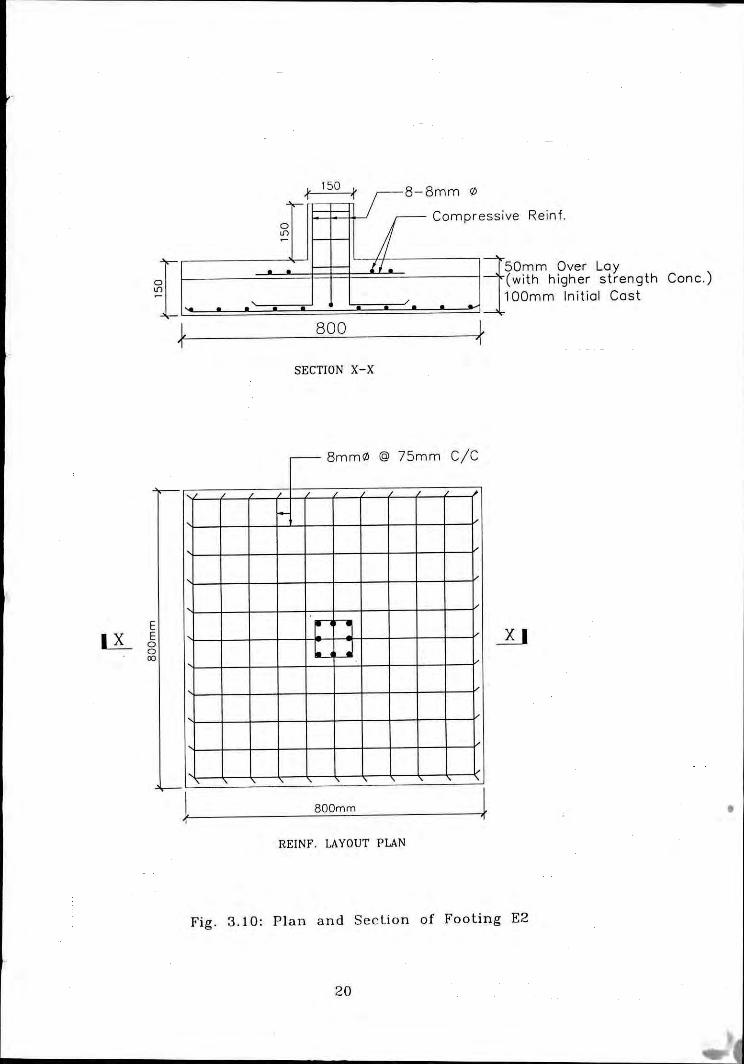
Fig.3.10 Rcinforccmcnt plan and scction of Footing E2 20
Fig.3.11 Reinforccmcnt plan and scction of Footing FI 21
Fig. 3.12 Rcinforccment plan and section of Footing F2 22
Fig.3.13 Reinforcement Layout of Footing A I 23
Fig. 3.14 Concrete cast of Footing Al 23
Fig. 3.15 Rcinforccmcnt Layout of Footing B I 24
Fig.3.16 Concrctc cast of Footing B I 24
Fig. 3.17 Reinforcement Layout of Footing C I 25
Fig. 3.18 Initial cast of Footing C 1 25
Fig. 3.19 Placement of compo Steel beforc overlay 26
Fig. 3.20 Placement of dowel bar before ovcrlay 26
Fig. 3.21 Placement of dowel bar & compo Steel before overlay 27
Fig. 3.22 Overlay cast on old concrete 27
Fig. 3.23 Test rig setting 28
Fig. 3.24 Placing of sample on rig 29
Fig. 3.25 Samplc after final placemcnt & before loading 29
Fig. 3.26 Sample after failure 30
Fig. 3.27 Bottom surfacc ancr failure 30
x
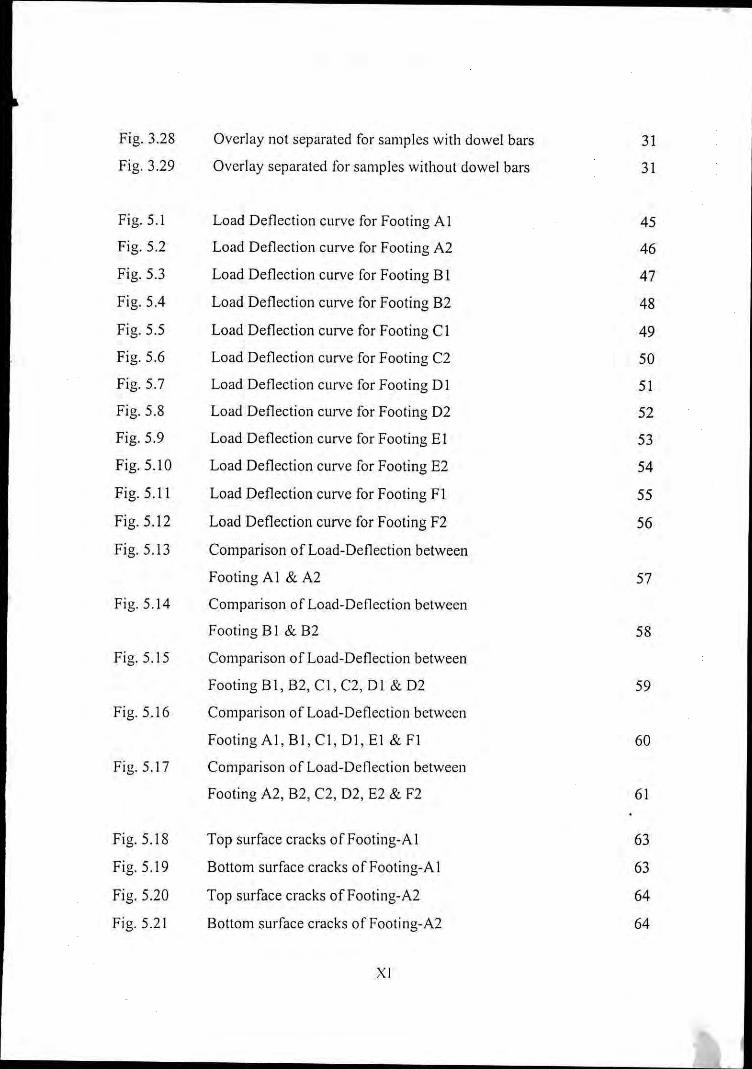
Fig. 3.28 Overlay not separated for samples with dowel bars 31
Fig. 3.29 Overlay separated for samples without dowel bars 31
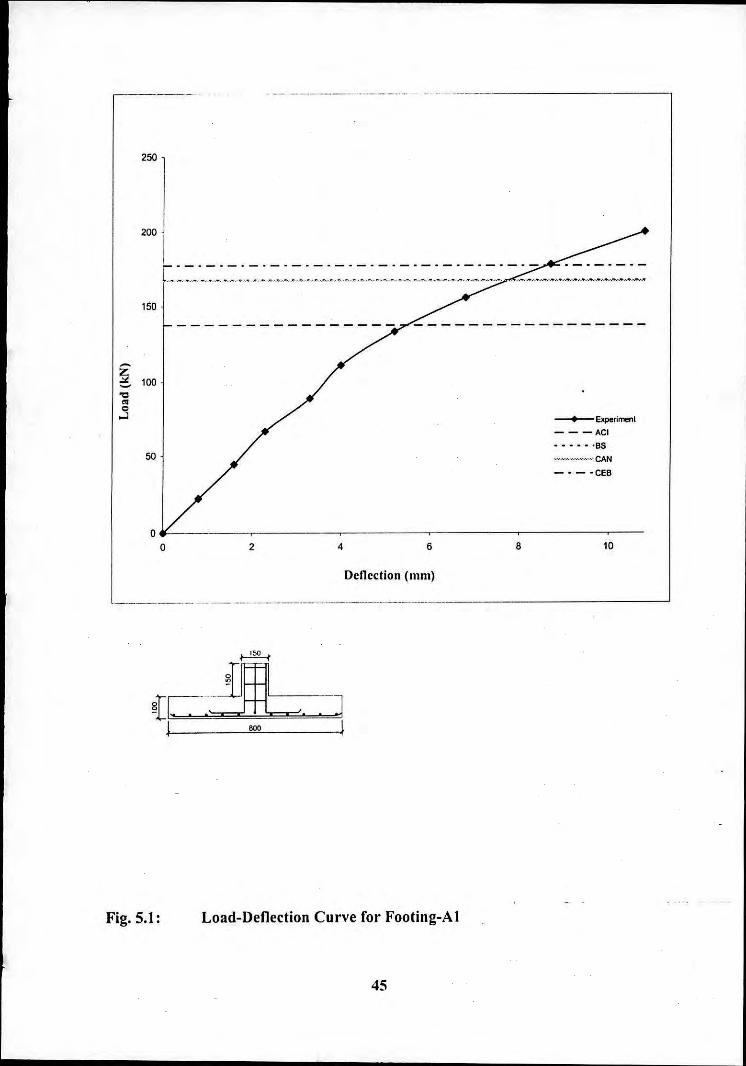
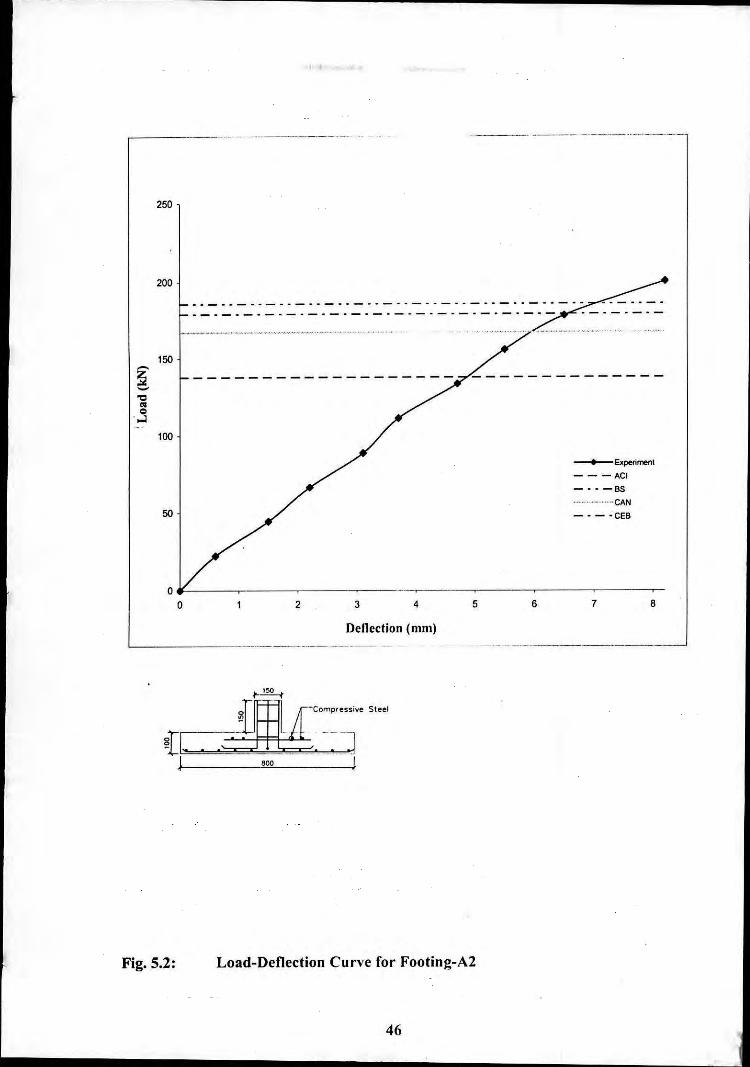
Fig. 5.1 Load Deflection curve for Footing AI 45Fig. 5.2 Load Deflection curve for Footing A2 46
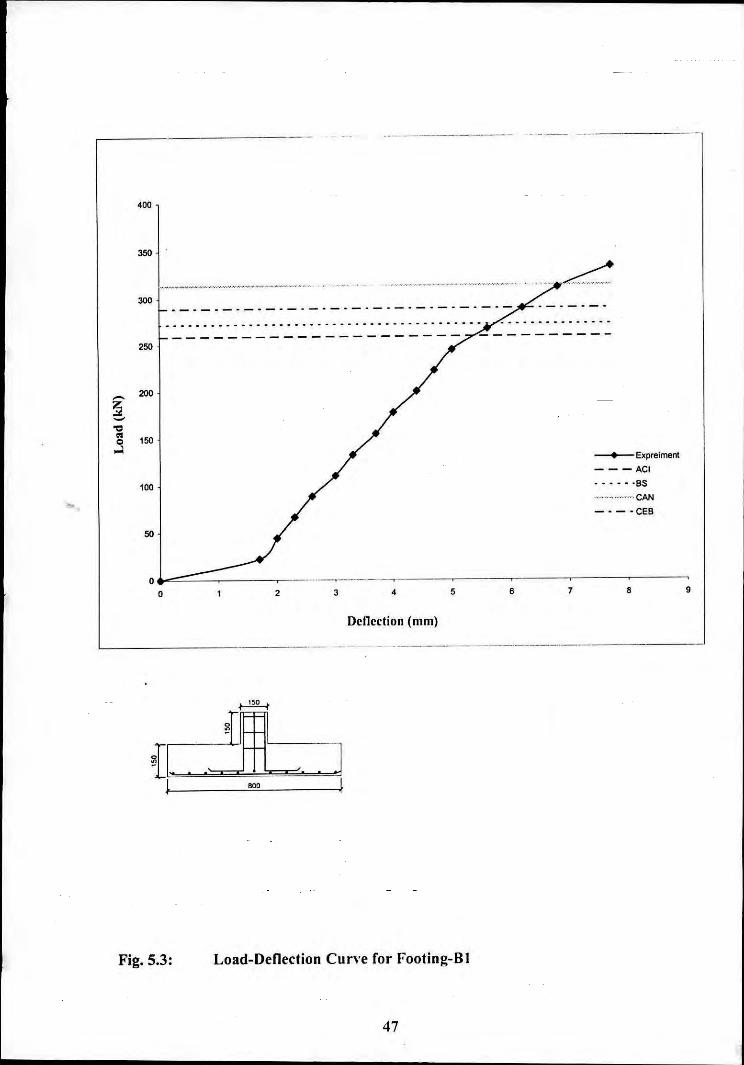
Fig. 5.3 Load Deflection curve for Footing B I 47
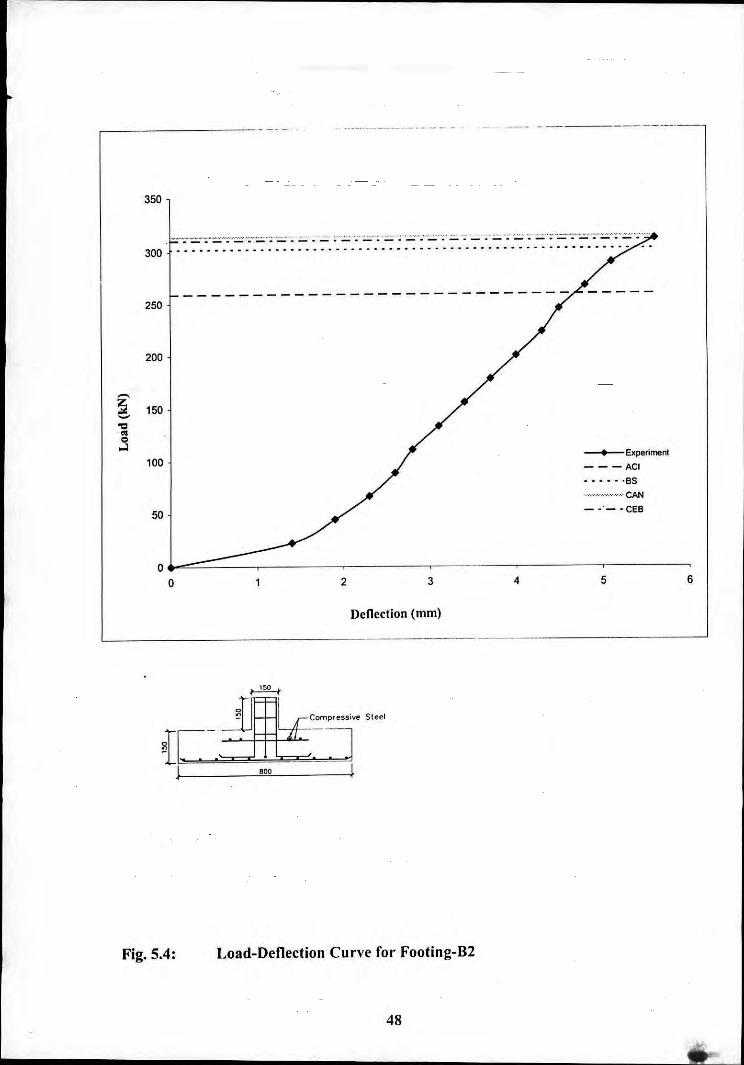
Fig. 5.4 Load Deflection curve for Footing B2 48
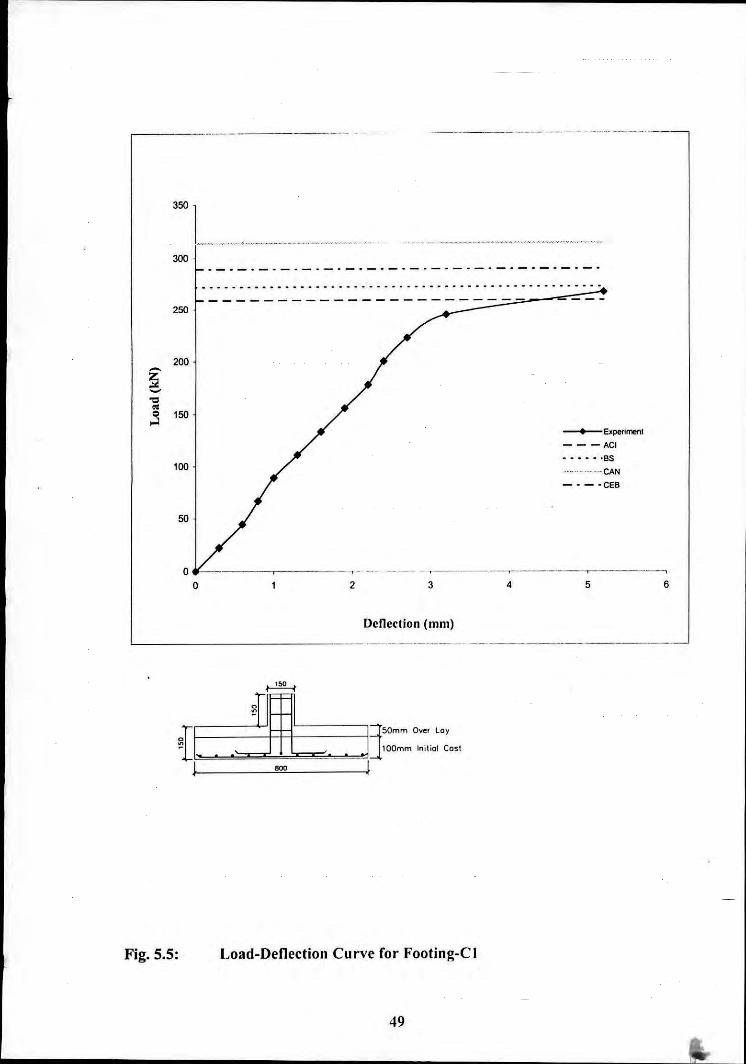
Fig. 5.5 Load Deflection curve for Footing C I 49
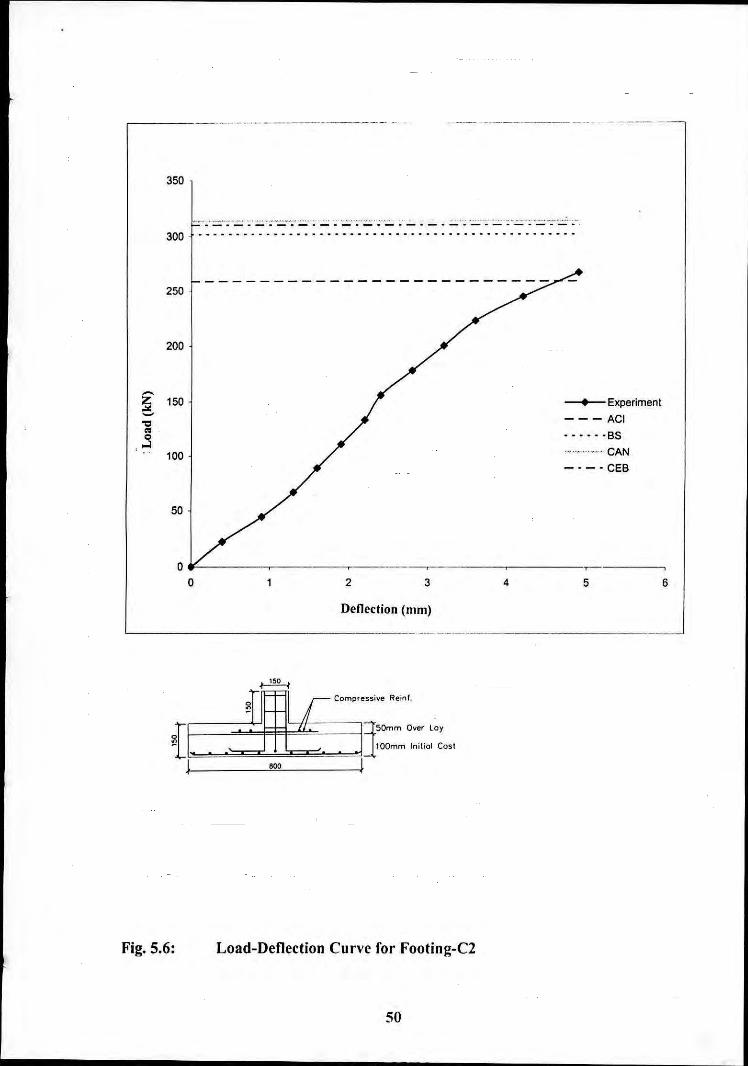
Fig. 5.6 Load Deflection curve for Footing C2 50
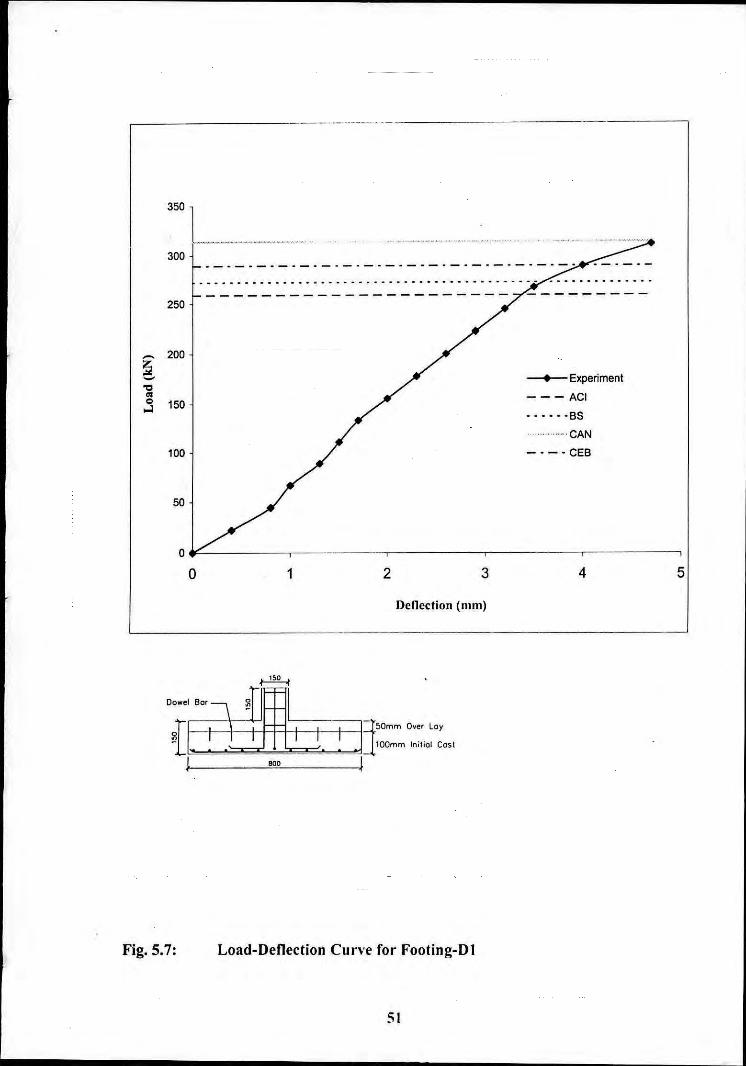
Fig. 5.7 Load Deflection curve for Footing 0 I 51
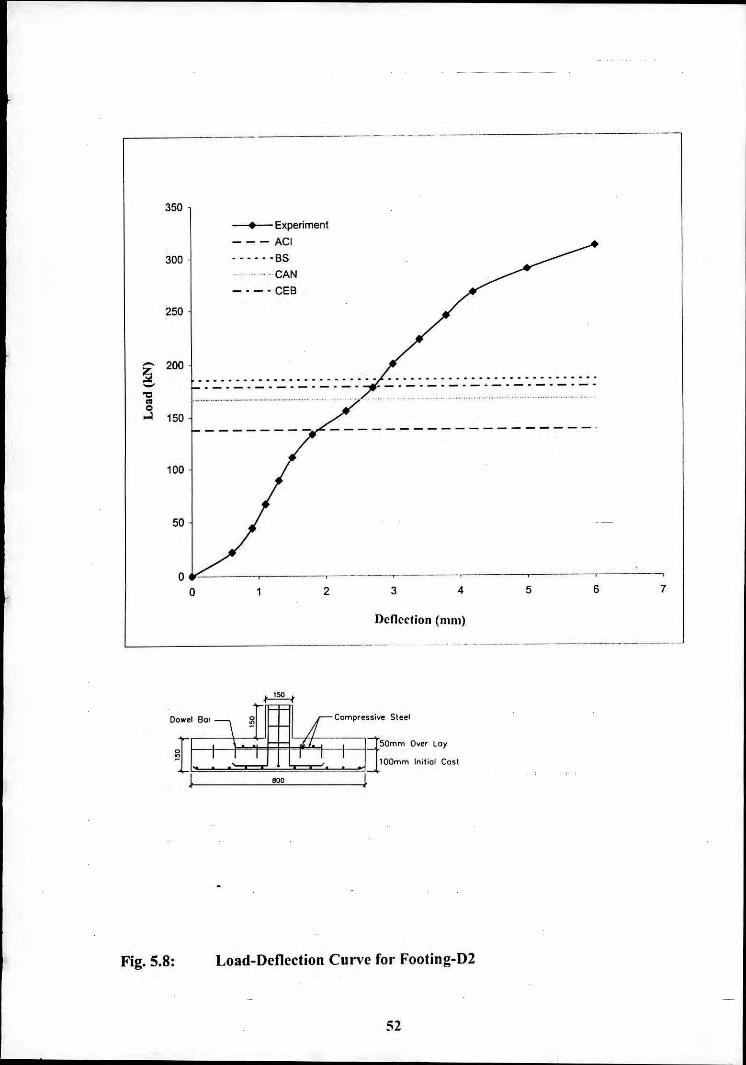
Fig. 5.8 Load Deflection curve for Footing 02 52
Fig. 5.9 Load Deflection curve for Footing E I 53
Fig. 5.10 Load Deflection curve for Footing E2 54
Fig.5.11 Load Deflection curve for Footing FI 55
Fig. 5.12 Load Deflection curve for Footing F2 56
Fig. 5.13 Comparison of Load-Deflection between
Footing Al & A2 57
Fig. 5.14 Comparison of Load-Deflection between
Footing B I & 82 58
Fig. 5.15 Comparison of Load-Deflection between
Footing B I, B2, CI, C2, 01 & 02 59
Fig. 5.16 Comparison of Load-Deflection between
Footing AI, BI, CI, 01, EI & FI 60
Fig.5.17 Comparison of Load-Deflection between
Footing A2, B2, C2, 02, E2 & F2 61
Fig.5.18 Top surface cracks of Footing-A I 63
Fig.5.19 Bottom surface cracks of Footing-A I 63
Fig. 5.20 Top surface cracks of Footing-A2 64
Fig. 5.21 Bottom surface cracks of Footing-A2 64
XI
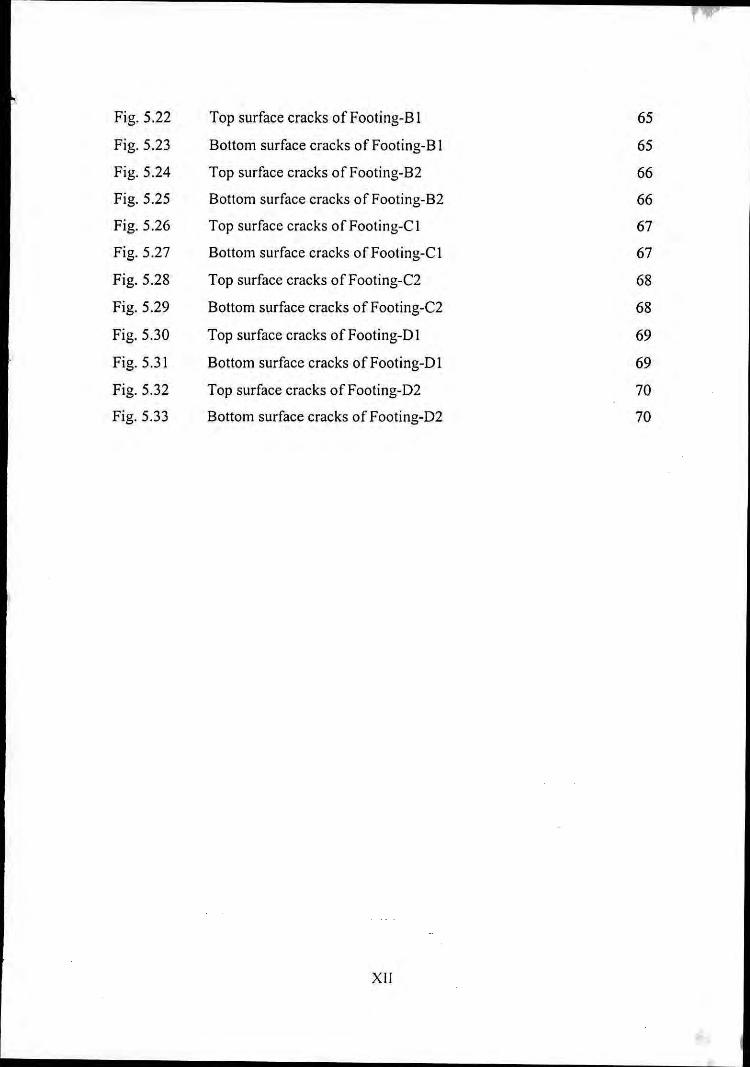
Fig. 5.22 Top surface cracks of Footing-B 1 65
Fig. 5.23 Bottom surface cracks of Footing-B 1 65
Fig. 5.24 Top surface cracks of Footing-B2 66
Fig. 5.25 Bottom surface cracks of Footing-B2 66
Fig. 5.26 Top surface cracks ofFooting-CI 67
Fig. 5.27 Bottom surface cracks ofFooting-CI 67
Fig. 5.28 Top surface cracks ofFooting-C2 68
Fig. 5.29 Bottom surface cracks ofFooting-C2 68
Fig. 5.30 Top surface cracks ofFooting-DI 69
Fig. 5.31 Bottom surface cracks of Footing-D I 69
Fig. 5.32 Top surface cracks ofFooting-D2 70
Fig. 5.33 Bottom surface cracks of Footing-D2 70
XII
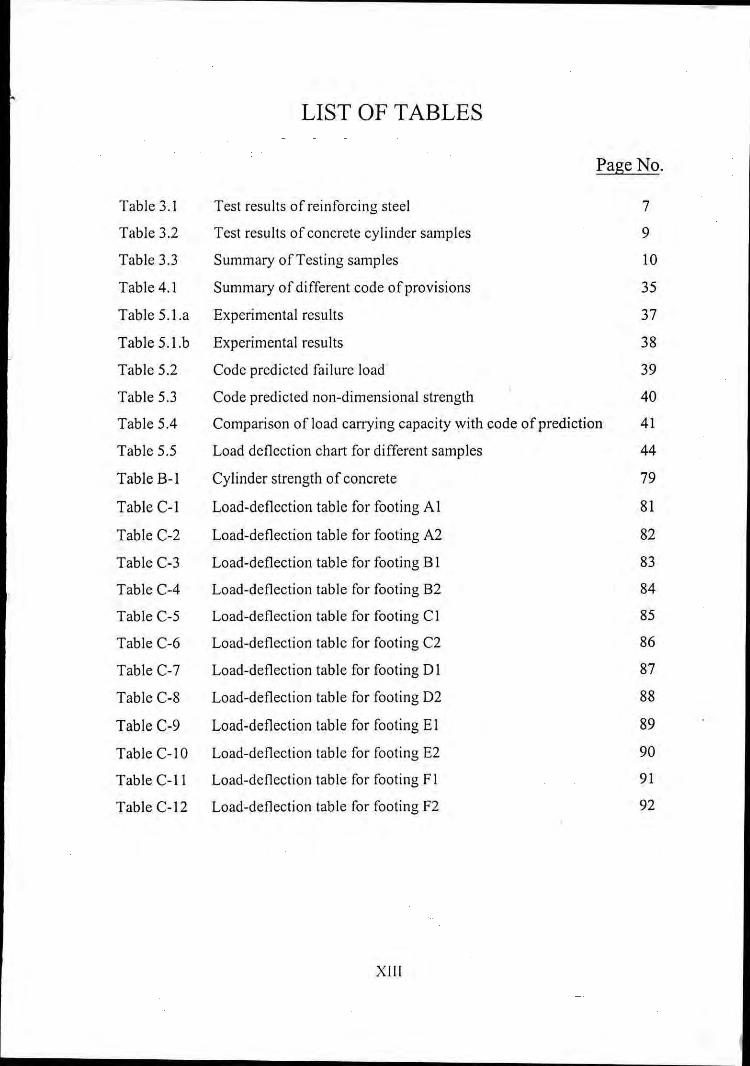
LIST OF TABLES
Page No.
Table 3.1 Test results of reinforcing steel 7
Table 3.2 Test results of concrete cylinder samples 9
Table 3.3 Summary ofTcsting samples 10
Table 4.1 Summary of differcnt code of provisions 35
Tablc 5.I.a Experimcntal rcsults 37
Table 5.I.b Experimental results 38
Table 5.2 Codc prcdictcd failurc load 39
Table 5.3 Codc predictcd non-dimensional strcngth 40
Table 5.4 Comparison of load carrying capacity with code of prediction 41
Table 5.5 Load deflection chart for different samples 44
Table B-I Cylinder strength of concrcte 79
Table C-I Load-deflection table for footing A I 81
Table C-2 Load-deflection table for footing A2 82
Table C-3 Load-deflcction table for footing B I 83
Table C-4 Load-deflection table for footing B2 84
Table C-5 Load-deflection table for footing C I 85
Table C-6 Load-deflection table for footing C2 86
Table C-7 Load-deflection table for footing 0 I 87
Table C-8 Load-deflection table for footing 02 88
Tablc C-9 Load-dcflection table for footing E I 89
Table C-I 0 Load-deflection table for footing E2 90
Table C-II Load-deflection table for footing F I 91
Table C-12 Load-deflection table for footing F2 92
XIII
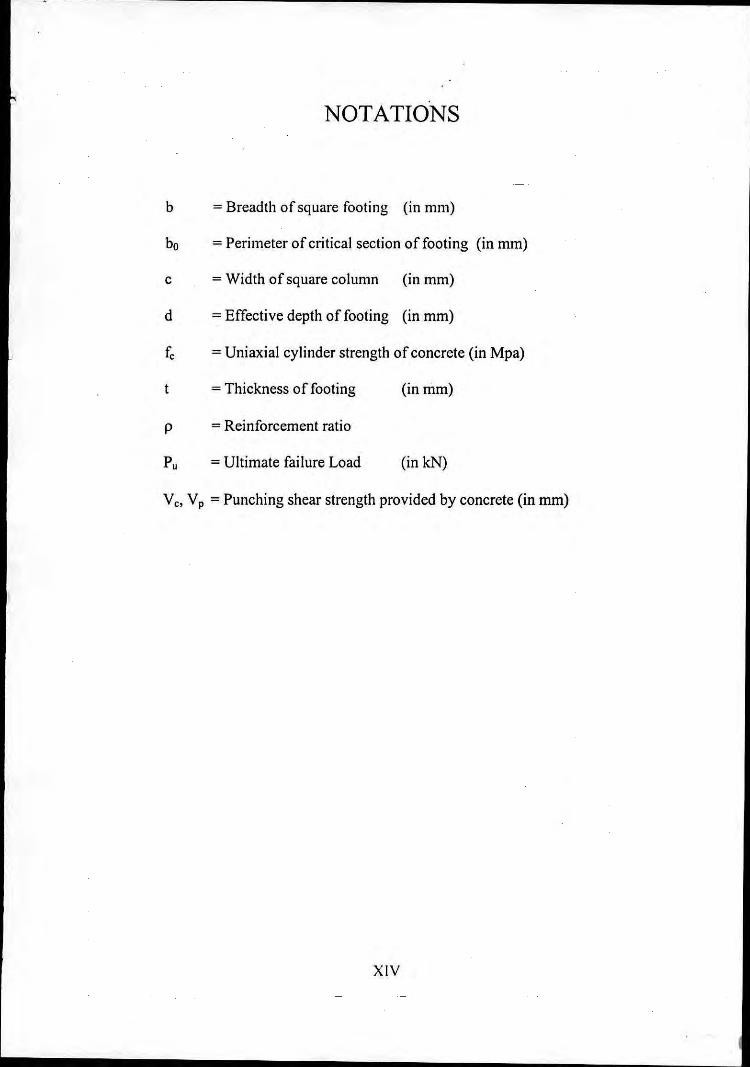
NOTATIONS
b = Breadth of square footing (in mm)
bo = Perimeter of critical section of footing (in mm)
c = Width of square column (in mm)
d = Effective depth of footing (in mm)
fc = Uniaxial cylinder strength of concrete (in Mpa)
t = Thickness of footing (in mm)
p = Reinforcement ratio
Pu = Ultimate failure Load (in kN)
vc, Vp = Punching shear strength provided by concrete (in mm)
XIV
CHAPTER ONE
INTRODUCTION
1.1 General
Stmctural engineers as well as different institutions are becoming interested in thevertical expansion of some existing buildings by strengthening various structuralelements. Footing is the most important part of the building to bear the vertical loads.To withstand the additional loads due to the vertical expansion, footings should becapable of bearing the loads without fai lure. So retrofitting of the existing footings isvery important.
Punching shear is an important criterion for the design of concrete column footings,mat foundations, bridge decks and tlat plates. Column tends to punch through thefooting because of the shear stresses, which act in the footing around the perimeter ofthe column. At the same time, the concentrated compression stresses from the columnspread out into the footing so that concrete adjacent to the column remains in verticalor slightly inclined compression in addition to shear.
1.2 Present State of Art of the Research Topic
Footing is that part of the structure, which is usually placed below the surface of theground and which transmits load to the underlying soil or rock. There are differenttypes of footings. In Bangladesh, 'single-column footings' arc commonly used forlow-rise buildings. If the soil condition is well and the vertical load of the building iswithin the pennissible limit, then single-column footing is also economical.
The present context of Bangladesh is quite di fferent from the previous days. Toaccommodate the huge population, government institutions are allowing people toexpand the existing buildings vertically. Apart from possible vertical extension,present-day house owners arc increasingly becoming more concerned about safety oftheir structures and in many occasions they prefer retrofitting various structuralelements to rectify design/construction lapses. If the footings of the existingbuildings can sustain the increased loads after some modification (strengthening),then it will be economical to strengthen them rather than demolishing them. InBangladesh, although repair and strengthening of footings of some of the existingbuildings have takcn place in the past. no systcmatic laboratory study has becn carriedout in support of such tcchniques.
1.3 Objectives of the Study
The main objective of this research work is to critically examine the experimentalresults in an effort to find out the advantages of strengthening footings by overlay,through the following investigation:
I) To evaluate the punching shear strength of RCC footing subjected toslowly applied load.
2) To find the effect of overlay on punching shear strength of footings byincreasing thickness with overlay.
3) To compare the punching shear strength of two footings of same initialthickness, but depth of one is increased by overlay.
4) To compare the punching shear strength of two footings of samethickness; one is cast in single go and the other is in layered cast withoverlay.
5) To compare the punching shear strength of two footings overlaid withdowel bar and without dowel bar and to find the effect of dowel bar.
6) To find out the contribution of compression reinforcement towards thepunching shear strength.
7) Probable crack pattem and deflection prediction.
8) To compare the proposed empirical codes of practice with the' actualpunching shear strcngth of footing.
9) To compare the test rcsults with various Code of provisions.
1.4 Methodology
The study begins with a review of the existing information and some case study.Based on the preliminary investigation, twelve footings were cast with differentcriteria. Some footings were cast in one go, for others layered construction techniquewere completed, with provision of dowel bars at the interface. Additionally, somereinforcement bar was provided in compression zone to find the effects on punchingstrength.
2
In the present case, an extensive experimental study has been conducted on footingssubjected to concentrated loading of failure at the geometrical center using a universaltesting machine. When a footing is heavily loaded with a concentrated load, diagonalcracks foml that encircle the load or column. These cracks are not visible, except asflexural cracks. Such cracks extend into compression area of the footings andencounter resistance ncar the load, similar to the shear-compression condition. Thefooting continues to take load and finally fails around and against the load or columnpunches out as a pyramid of concrete.
The details of model footings tested along with the test program, testing set-up aswell as materials used, are described in Chapter 3. The punching shear provisions ofvarious codes are given in Chapter 4. The test results obtained from this study havebeen analyzed and critically discussed in Chapter 5. Also in Chapter 6, the findings ofthe present study have been summarized as conclusions and some recommendationsarc incorporated in this chapter.
3
CHAPTER TWO
LITERATURE REVIEW
2.1 General
Strengthening of footings of existing building is an important consideration in thepresent context. Since usually the failure of footing is govemed by the punchingshear, therefore, it is desirable to strengthen the footing by increasing the punchingshear capacity. It is expected that by increasing section depth of a footing, by addinga new layer of concrete on the top of the existing footing, is an effective method forstrengthening or repairing. Present codes consider only the concrete strength andignore the possible positive effect of percentage of steel, punching area, footingthickness, etc. Also, the effect of the reinforcement in the compression zone is notknown. This is because no systematic experiment has been carried out to find theprocedure for strengthening or retrofitting of footings. To find the answer, severalexperiments have been carried oul during the study. A short discussion of differentexperimental results is stated here.
2.2 Relationship of Punching shear capacity of Reinforced ConcreteFooting with different parameters:
2.2.\ Concrete Strength
Gardner (1990) presents the result of an investigation relating punching shear toconcrete strength and steel ratio. He concluded that the shear capacity is proportionalto the cube root of concrete strength and steel ratio and that the AC\ 3\8(1983) andCSA A23.3-M84 (1984) provision should be reviewed. He also opined that the shearperimeter should be increased by using large columns and column capitals if thepunching shear capacity is in doubt.
2.2.2 Effect of Size
Bazant and Coa (1987) carried out tests on punching shear of geometrically similarreinforced concrete slabs of different sizes and concluded that the nominal shearstress at failure is not constant as assumed in the current design fonnula. Theysummarized that the punching shear failure of slab without stirrup is not plastic butbrittle. They found that the larger the slab thickness, the steeper the post-peak declineof the load deflection diagram.
2.2.3 Effect of Footing Thickness
Seraj and Mostafa (1997) prescnt non-dimensional punching shear strength of footingto the thickness of the footing, keeping all othcr parameters constant. In all thefootings, same reinforcement was uscd in both directions. Thus, although the amountof steel in all the specimcns wcrc thc samc, thc pcrcentage of steel actually decreasedwith an increase in footing thickncss. Similar to the presently adopted code, theysuggcst that the thickncss has a lincar contribution towards the punching shearstrength of footings.
2.3 Strengthening of Reinforced Concrete Footing
2.3.1 Strengthening by Concrete Overlay.
One of the most straightforward proccdures to increase the capacity of existing RCCfootings is to add a concrcte overlay. But there was no significant study carried outfor this type ofrctrofitting of structures.
2.3.2 Concrete Overlay with Reinforcement at Compression area
According to the code provision, punching shear is calculated on the basis of concretestrength, punching arca and cffcctivc dcpth of footing. But no significant study hasbcen carried out to datc to know the contribution of the additional reinforcement atthe compression arca of footing towards the punching strcngth.
:;
CHAPTER THREE
EXPERIMENTAL PROGRAM
3.1 General
A series of square reinforccd concretc footing specimens was cast and tested in thisstudy. The main reasons for casting numerous footings with different parameters wereto compare the footing samples with one another and also to compare the results withdifferent code predictions.
3.2 Materials
3.2.1 GeneralThe concrete used in casting the footing models was the combination of OrdinaryPortland Cement, Natural Sand and 12mm down graded Stone chips. The water-cement ratio for the mix was 0.40 for all the samples. Deformed bars of 8mmdiameter having yield strength of276Mpa were used for all members.
3.2.2 Cement
Cement is the material with adhesive and cohesive properties, which makes it capableof bonding mineral fragments into a compact whole. Although cement occupies onlyabout 7 to 15% of the lolal volume of concrete mixture, it is the most importantcomponent of concrete for its active binding properties.
All cement used for the casting of model footings were Ordinary Portland Cementconforming to the requirements of the ASTM. All footings were cast with same brandof cement. It was carefully protected against moisture and exposure to air.
3.2.3 Fine Aggregate
Fine aggregate is the filler material between the coarse aggregate and it contributes tothe increase in weight of concrete. It is natural sand or sand derived by crushinggravel or stone and free from coagulated lump, alkaline or acidic reaction and otherdeleterious matters. Sand is the fine aggregate used for this study. A good qualitysand should consist of shall), angular and hard grains, which should be approximatelycubical in shape.
6
3.2.4 Coarse Aggregate
Aggregate usually occupies 75 to 80% of total volume of mass of concrete in whichcoarse aggregate takes the major part. The remainder consists of hardened cementpaste, fine aggregate, air void, ctc. So, thc more densely the aggregate can be packed,the better the strength, weathcr resistance and economy of concrete. Hence itsselection and proportioning is a major conccrn for the quality control of concretestructures.
Coarse aggregate used for this study were crushed stones, of angular or rounded inshape with granular, crystalline or smooth non-powdery surface, free from friable,flaky and laminated pieces, mica and shale and all other materials which might beinjurious to the concrete. The size used for this test was 12 mm down graded. Coarseaggregates used for both initial casting and overlay was from the same sample ofstones.
3.2.5 Water
Water is an important component of concrete. It has been estimated that on anaverage, 23% of water by weight cement is required for the chemical reaction withPortland cement compound. Water used for the study was free from oils, acids,alkalis, organic and inorganic impurities. It was also free from iron, vegetable matteror any other hamlful substances.
3.2.6 Waterl Cement Ratio
During the present study a constant water/ccmcnt ratio of 0.40 was used for initialslab casting as well as during application of overlay.
3.2.7 Reinforcement
Defomled 40 grade stcel bars having nominal diameter of 8 mm were used in thefootings as longitudinal and transverse reinforcement. Column reinforcement for boththe main bar and tics were of the samc sizes. Strength characteristics of 8 mm barused is given in Table 3.1.
Tablc 3.1; Strength Characteristics of Reinforcing Bars Used.
Nominal Diameter Yield Strength Ultimate Strength(mm) (MPa) (MPa)
8 291.72 409.5
7
3.3 Concrete Wor-k
3.3.1 Formwork
The design and preparation of fOllnwork was perfollned as per the size and shape ofthe footing. Concretc floor was uscd as thc boltom surface of the fOllnwork. The outerfour sides of thc fOI111\vorkwcrc madc with 38mm thick wooden plank and weresufficiently anchorcd to prevcnt latcral movement during concrete placement.Polythcnc shcct was uscd at thc boltom and four sides to make it leak proof. Allsurfaces of the fOllmvork were properly cleaned before the casting of concrete.
3.3.2 Layout of Reinforcement
The 8 mm diametcr defol111edbars were placed at 75mm clc as main reinforccmentfor all the footings.
3.3.3 Mixing of Concrete
The concrete ingredients were mixed unifollnly with proper proportion. The platformwas cleaned so that no foreign particle could be mixed with concrete. Adding ofadditional water was totally prohibited.
3.3.4 Placing of Concrete
Care was taken during the placing and transportation of concrete so that consistencyremained in the mixes, and objectionable scgregation could not happen. After thedeposition, concrete was thoroughly consolidated around reinforcement by rodding,spading and by using electric vibrator.
3.3.5 Dowel Bar
Dowel bars of 8 mm diamctcr and 60 mm length rod wcrc used in different footingsbetween the interfaccs of thc laycrcd construction. These bars were embedded intothe initial cast concrcte by drilling after 30 days of casting with 40 mm ofembcdment. It was providcd to find the effect of bonding between the old concreteand the overlay. The spacing betwcen the dowcl bars was 100 mm clc in both thedirections.
8
3.3.6 Reinforcement at Compression zone
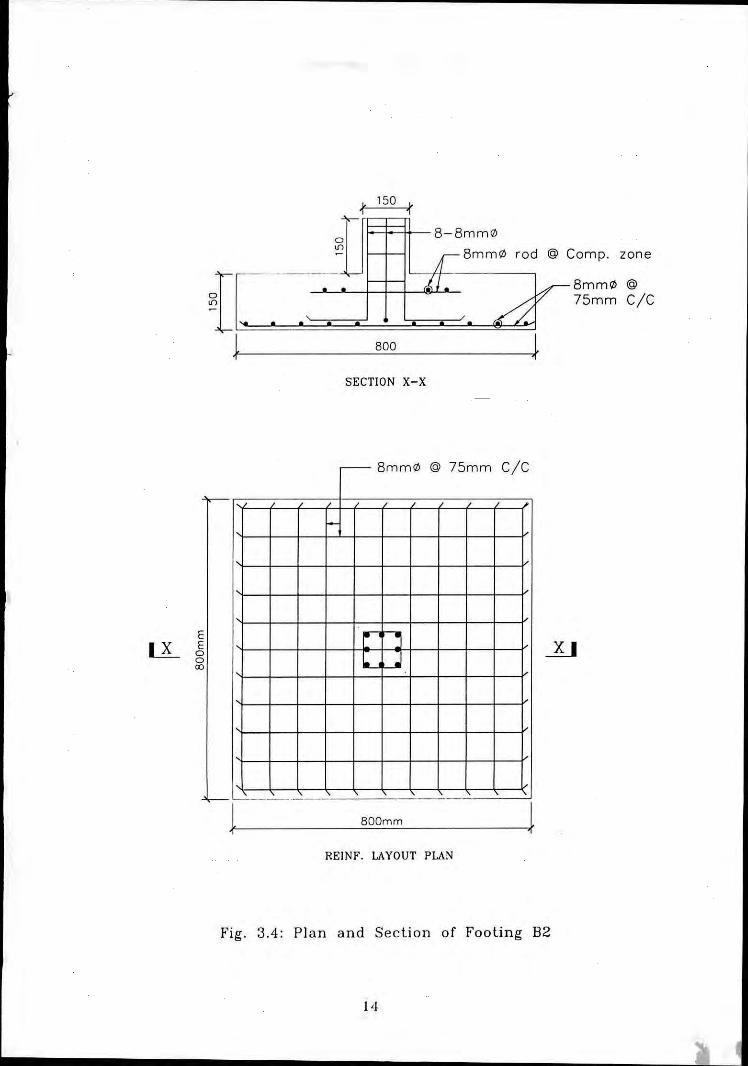
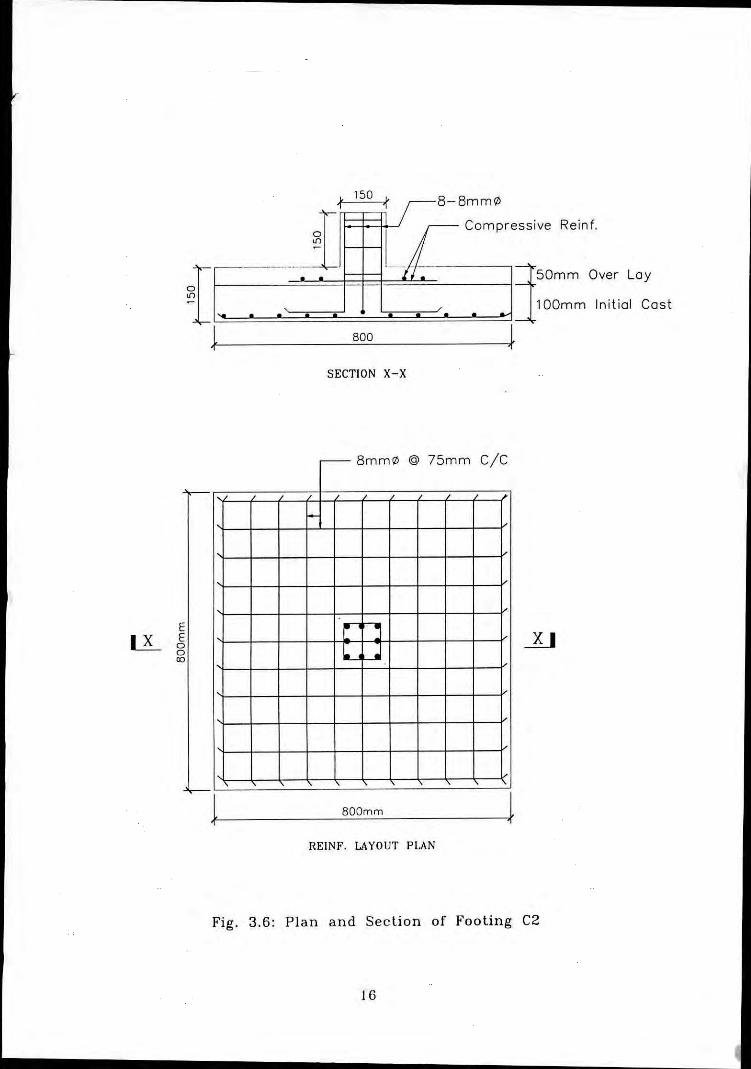
8 mm diameter de fanned bars were placed in the compression zone of footings inorder to evaluate the possible contribution of compression reinforcement on thepunching capacity of the structural member. In this purpose two bars were put on allthe sides of columns at 75 mm e/c.
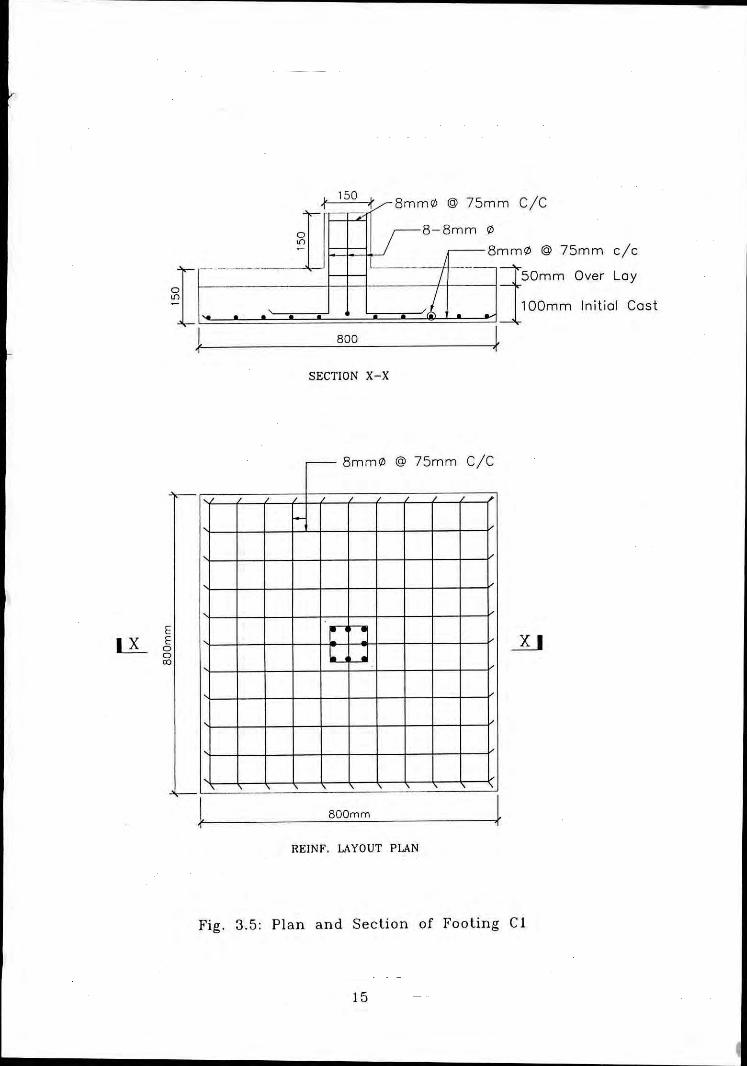
3.3.7 Concrete Overlay
After 45 days, when the initial casting of concrete reached its ultimate strength, theconcrete overlay was applied on different footings. It was done with the view to findout the effect of the concrete overlay on the punching capacity of footings.
3.3.8 Casting of Cylinder
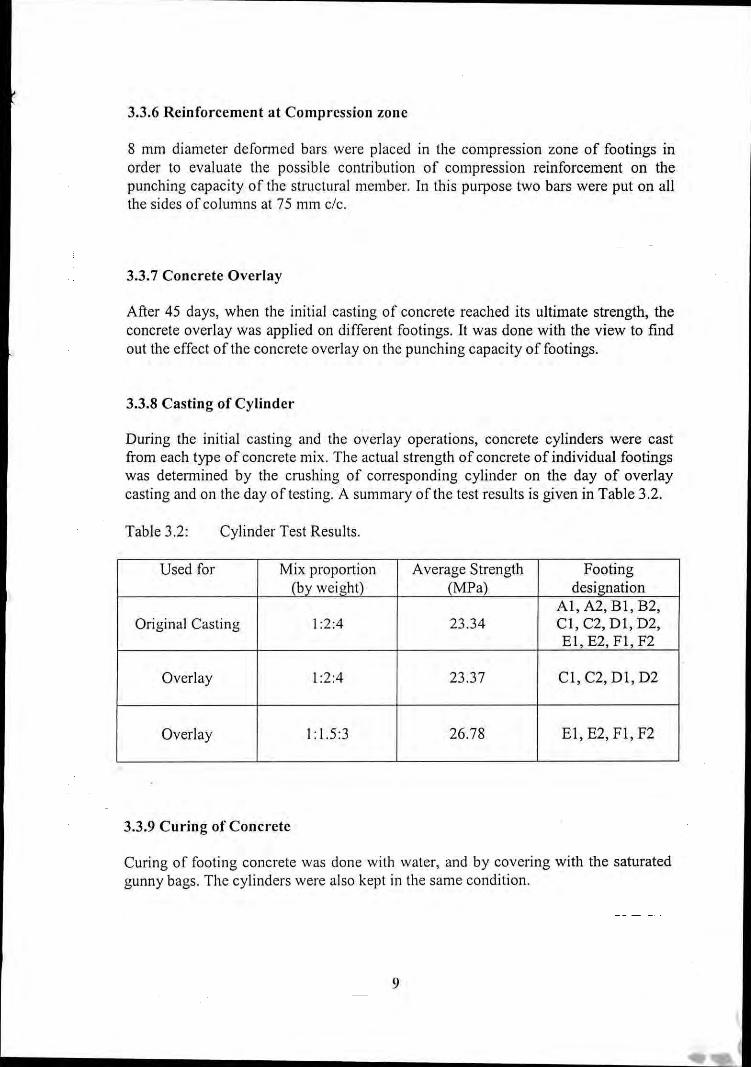
During the initial casting and the overlay operations, concrete cylinders were castfrom each type of concrete mix. The actual strength of concrete of individual footingswas detemlined by the cnIshing of corresponding cylinder on the day of overlaycasting and on the day of testing. A summary of the test results is given in Table 3.2.
Table 3.2: Cylinder Test Results.
Used for Mix proportion Average Strength Footing(by weight) (MPa) designation
AI, A2, BI, B2,Original Casting 1:2:4 23.34 CI, C2, 01, D2,
EI, E2, FI, F2
Overlay 1:2:4 23.37 CI, C2, DI, D2
Overlay I: 1.5:3 26.78 El,E2,Fl,F2
3.3.9 Curing of Concrete
Curing of footing concrete was done with water, and by covering with the saturatedgunny bags. The cylinders were also kept in the same condition.
9
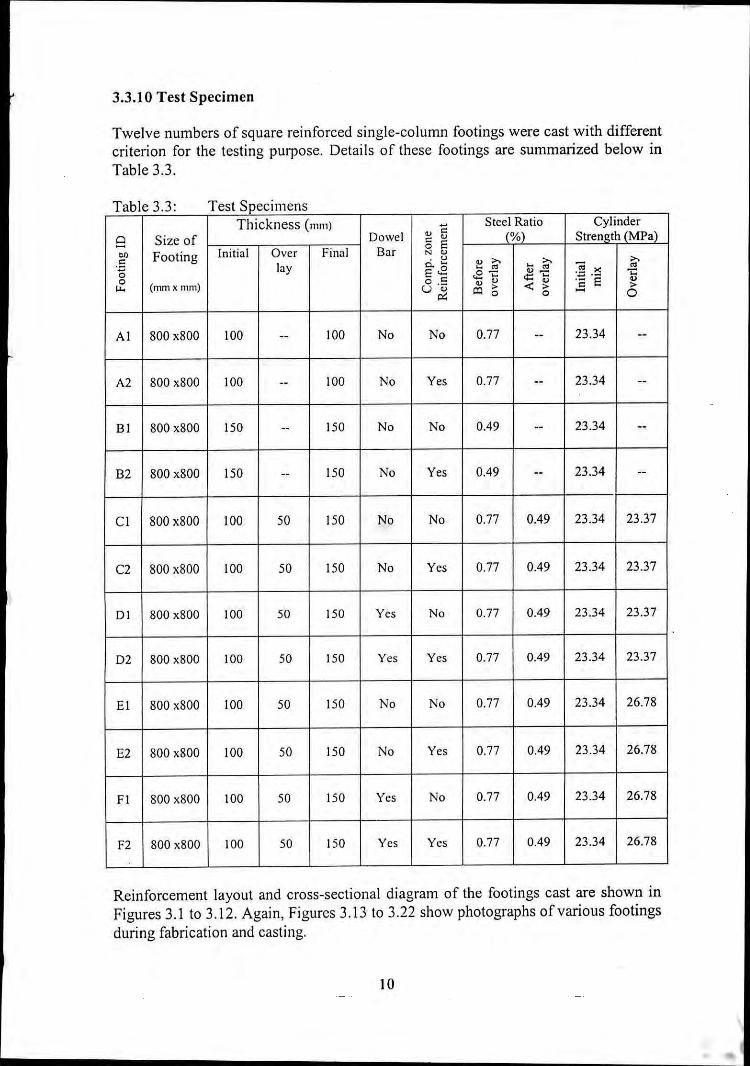
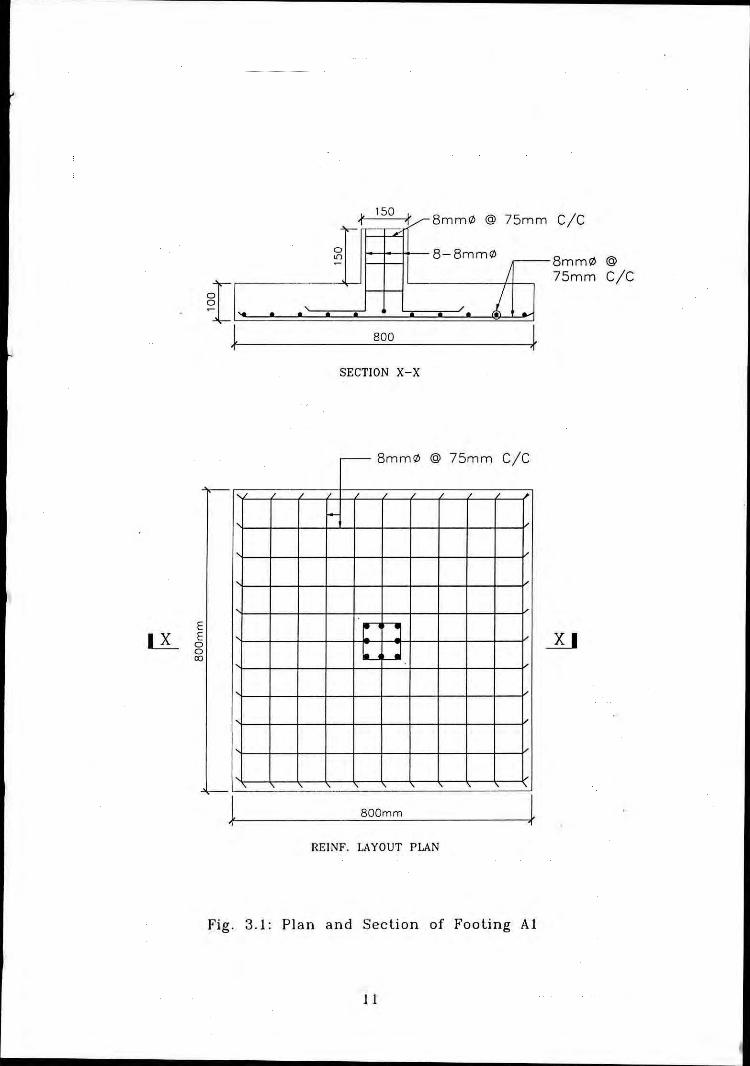
3.3.10 Test Specimen
Twelve numbers of square reinforccd single-column footings were cast with differentcriterion for the testing purpose. Details of these footings are summarized below in
Table 3.3.
bl 3 TTa e .3: est SpeClll1enSThickness (111111) ;; Steel Ratio Cylinder
Cl Sizeof DO\vcl ~ ~ (%) Strenpth (MPa)g 6en Footing Initial Over Final Bar N ~.:: . u
~ '" '" '"lay o.~ ~ '"' ~ '"' ~ ~ '"0 6..2 '£-'::: ~- ".:: ~ ] 'S0 (mm x 111m) o .: ~ ~ -< ~ ~u.. U ~ c:l ~ >
'" 0 0
Al SOOxSOO 100 -- 100 No No 0.77 -- 23.34 --
A2 SOOxSOO 100 -- tOO No Yes 0.77 -- 23.34 --
BI SOOxSOO 150 -- ISO No No 0.49 -- 23.34 --
B2 SOOxSOO 150 -- ISO No Yes 0.49 -- 23.34 --
Ct SOOxSOO 100 50 ISO No No 0.77 0.49 23.34 23.37
C2 SOOxSOO 100 50 150 No Yes 0.77 0.49 23.34 23.37
DI SOOxSOO 100 50 150 Yes No 0.77 0.49 23.34 23.37
D2 SOOxSOO 100 50 150 Yes Yes 0.77 0.49 23.34 23.37
EI SOOxSOO 100 50 150 No No 0.77 0.49 23.34 26.78
E2 800 xSOO 100 50 150 No Yes 0.77 0.49 23.34 26.78
FI SOOxSOO 100 50 150 Yes No 0.77 0.49 23.34 26.78
F2 SOOxSOO 100 50 150 Yes Yes 0.77 0.49 23.34 26.7S
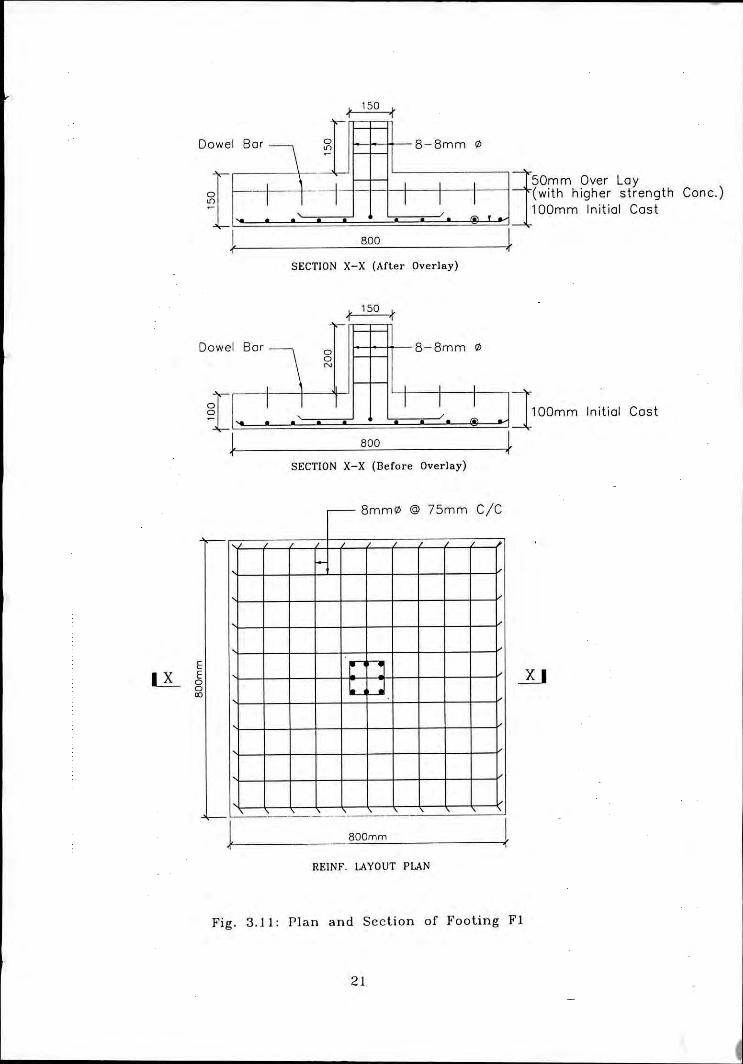
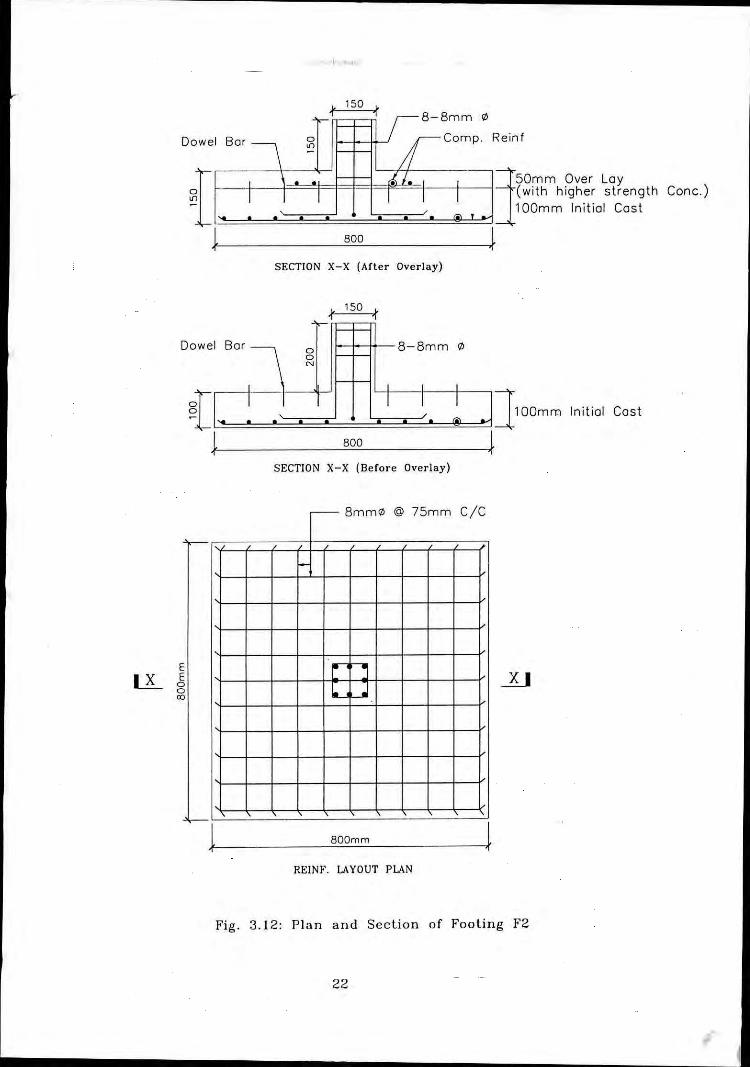
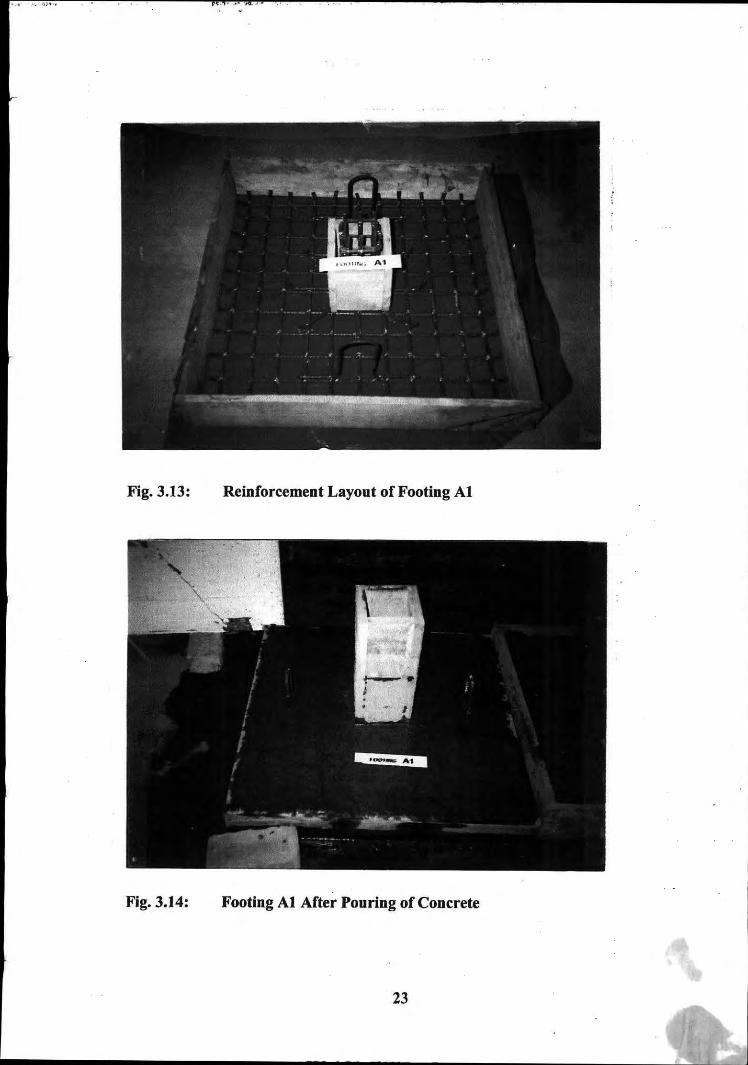
Reinforcement layout and cross-sectional diagram of the footings cast are shown inFigures 3.1 to 3.12. Again, Figures 3.13 to 3.22 show photographs of various footings
during fabrication and casting.
10
, 150 , 8mm0 @ 75mm CIC1 1- ---
0 8-8mm0 8mm0"' I@
2rl~ ---~~ jJ75mmCIC
, / 1. . . . . • •
~800 Jr
SECTION X-X
,- 8mm0 @ 75mm CIC
~
E I:' JIl E LI0~ ~0
<Xl
~t -SOOmm J
HEINF. LAYOUT PLAN
Fig. 3.1 : Plan and Seclion of Footing Al
1 I

m0 @ rodessive ZoneSmml'l @
75mm CIC
800
___~D,~L/ Smm0
S-SmCompr
/• !., j j,
SECTION x-x
clCo @ 75S- mm mm
[ Jl .J
ELL ~o
"'
BOOmm
REINF. LAYOUT PLAN
Fig. 3.2: Plan and Seclion of Fooling A2
12
I, 150 I,
1 1
CIC
r --1~ 8-8
_-= L. ,. . .
m.mItLD~m;;~~~r[------,-1~. .
~ 8_00 ~JSECTION X-X
CICIt @ 758~ mm mm
L j[ J
EIl g
o<Xl
BOOmm
HElm'. LAYOUT PLAN
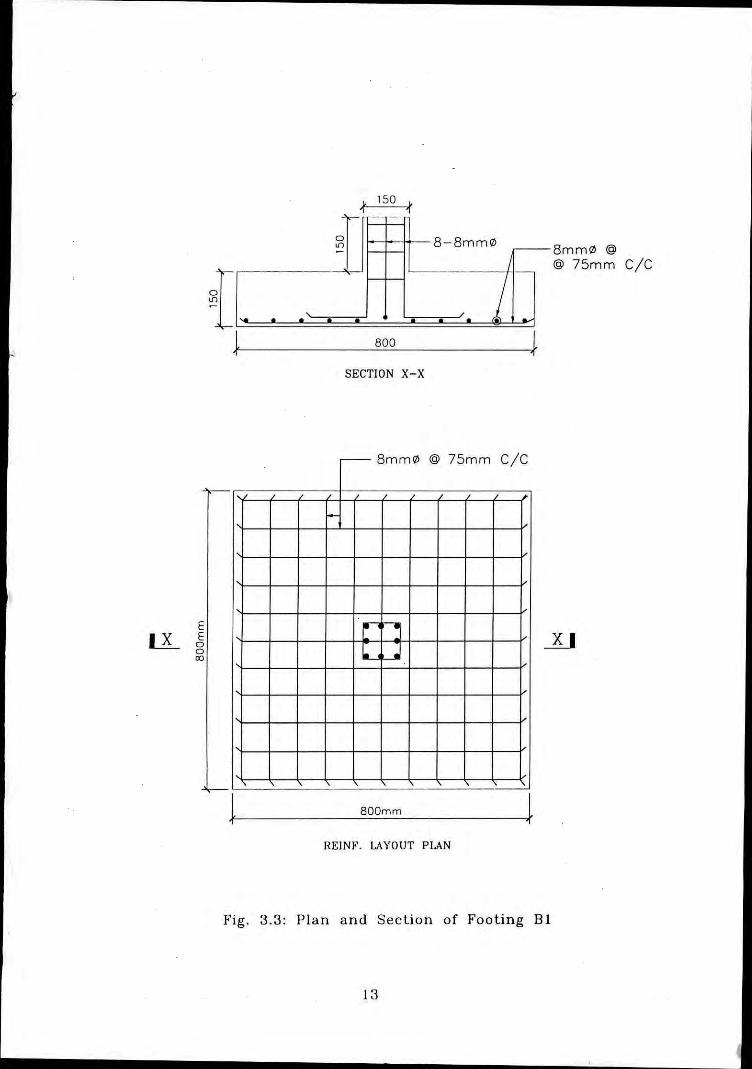
Fig. 3,3: Plan and Seclion of Fooling Bl
13
150 ,1II
8-8mm0
l 8mm0 rod @ Camp. zone.l~-~-;;r-~~:~~/C
800 J..
,1
tSECTION X-X
r-- 8mm0 @ 75mm C/C
-
ELL .5o
ro
[ 1l .I
BOOmm
REINF. LAYOUT PLAN
Fig. 3.4: Plan and Section of Fooling B2
,
" 150 { 8mm0 @ 75mm CIC
o 8-8mm 0"'- 8mm0 @ 75mm c/c
~-'-.-.'-~~--~-:~j100mm IniliO~O~OSI
~ BOO }
SECTION X-X
- 8mm0 @ 75mm CIC
EL.X... 8o
<Xl
BOOmm
REINF. LAYOUT PLAN
J
Fig. 3.5: Plan and Section of Fooling C1
15
•
jj50mm Over Lay
100mm Initial Cast.J
•
Compressive Rein!.
.
8-8mm0
..BOO
..
L. 150 r.1 1-~-I
JSECTION X-X
r-- 8mm0 @ 75mm CIC
-
-
ELL ,5o
"'
BOOmm
REINF. LAYOlJT PLAN
Fig. 3.6: Plan and Section of Footing C2
16
r. 150 ~'\ 'I
- - 50mm Over Lay~--j--I-- --1--1---, , 100mm Initial Cast...........
J 800 JSECTION x-X (After Overlay)
ooN
~ 150,
800
~
1l, 8-8mm ,\1l
I I IiJ100mm
JInitial Cast
SECTION X-X (Before Overlay)
,- 8mm\1l @ 75mm ClC
BOOmm
REINF. LAYOUT PLAN
Fig. 3.7: Plan and Section of Fooling DI
17
, 150 y
1'~ _~ 8-8mm 0
Dowel Bo~__ ,_~II li~rcomp_ Rein!
~[~~'_=..!=!I=e--I=M=__-tj]5Dmm Over Loy, , 100mm Initial Cost
'" , '. '.' '" @
J 800 JSECTION X-X (After Overlay)
8-8mm 0
SECTION X-X (Defore Overlay)
- 8mm0 @ 75mm CIC
Initial Cast
ELX... ~o
"'
BOOmm
REINF. LAYOUT PLAN
Fig. 3.8: Plan and Seclion of Fooling D2
~
<D~:f 8-8mm f/J
~II~ ~ L----~j50mm Over LoyCone.)
, ~
(with higher strength
100mm Initial Cast. • . . . . .J BOO J
SECTION X-X
- 8mmf/J @ 75mm C/C
-
E I" "ILL E .-D0~ .I0
OJ
~t ---
BOOmm JREINF. LAYOUT PLAN
Fig. 3.9: Plan and Seelion of Fooling El '>
19
~tt;"r
~IE .,. . .
~
ELX... 8o
aJ
"f"-ll j~';,:':''''''R,'"': .7:- J]50mm Over Loy(with higher strength
~ 100mm Initial Cost. . .800 ~
SECTION X-X
r- 8mm0 @ 75mm clC
r'"l J
BOOmm
REINF. LAYOUT PL\N
Fig. 3.10: Plan and Sec lion of Fooling E2
20
Cone.)
•
~ --I---~-I--- -j-I-- (with higher strength Cone.), ~ 100mm Inltlol Cost
..•.•••••• er.
~ BOO JSECTION X-X (After Overlay)
, 150 >, 1
]100mm Initial Cast
JBOO
SECTION X-X (Defore Overlay)
I~
0 ~::0N
~:J,. . . . • • • @
Oowel Bar
CIC@ 758
t~------_Bo_o_m_m k
- mm0 mm
~
rhI.- ~
._- - .
ELL ~o
'"
HEINF. LAYOUT PLAN
Fig. 3.11: Plan and Section of Fooling F1
21
150
800
,~ 8-8mm 'l>1J rcomp. Reinf
L~t1J]50mm Over Loy1 (with higher strength100mm Initial Cost.J
Cone.)
SECTION x-x (After Overlay)
, 150 ~'1 '
""<- --
Oowel Bor'I'
~I-l~
ooN
__ l8-8mm'l>-- ,I-I I
. ~
800
IJ100mm Initial Cost
JSECTION x-x (Before Overlay)
- Bmm'l>@ 75mm CIC
I- (,I,I,
( ( (I
EIl J3o
<0
l, BOOmm
REINF. LAYOUT PLAN
J
Fig. 3.12: Plan and Seclion of Fooling F2
22
.• ,', -l:"",
Fig. 3.13: Reinforcement Layout of Footing Al
Fig. 3.14: Footing Al After Pouring of Concrete
23
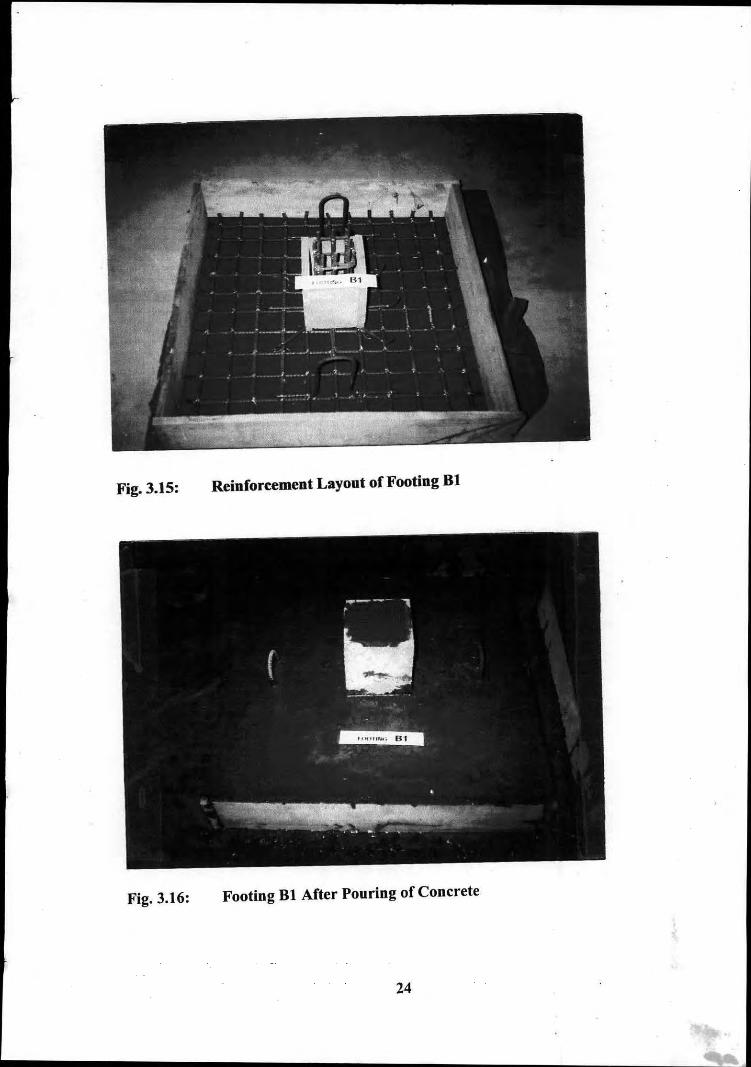
Fig. 3.15: Reinforcement Layont of Footing 81
Fig. 3.16: Footing 81 After Pouring of Concrete
24
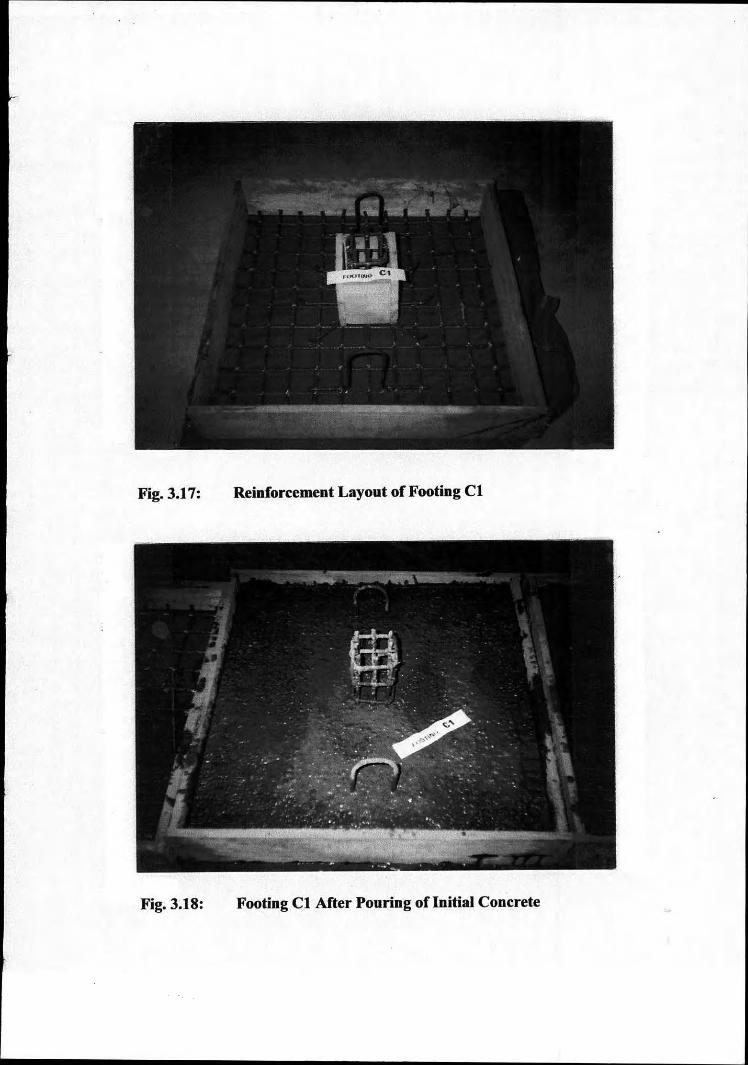
Fig. 3.17: Reinforcement Layout of Footing CI
Fig. 3.18: Footing C1 After Pouring oflnitial Concrete
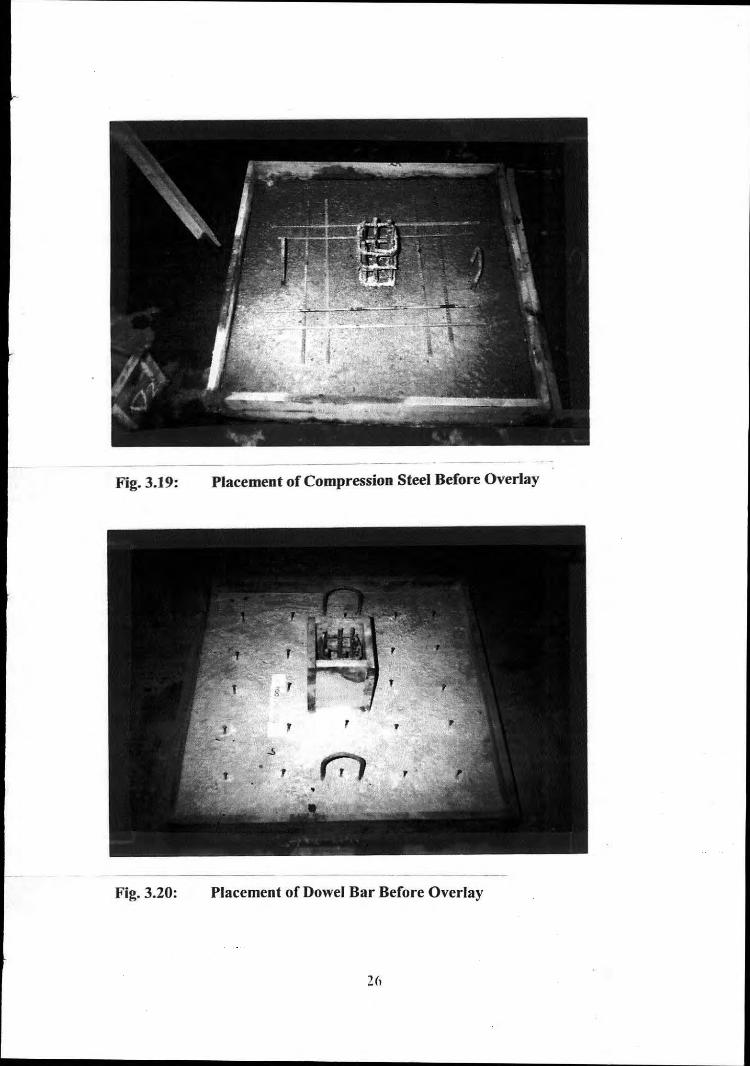
Fig. 3.19: Placement of Compression Steel Before Overlay
Fig. 3.20: Placement of Dowel Bar Before Overlay
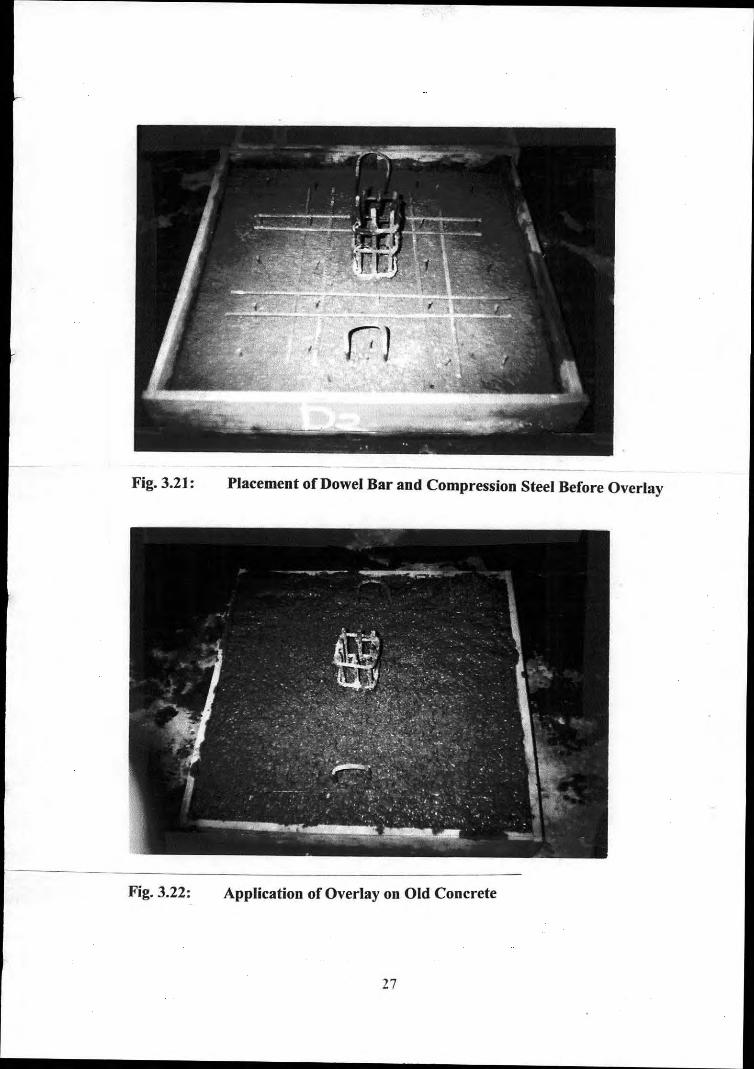
Fig. 3.21: Placement of Dowel Bar and Compression Steel Before Overlay
Fig. 3.22: Application of Overlay on Old Concrete
27
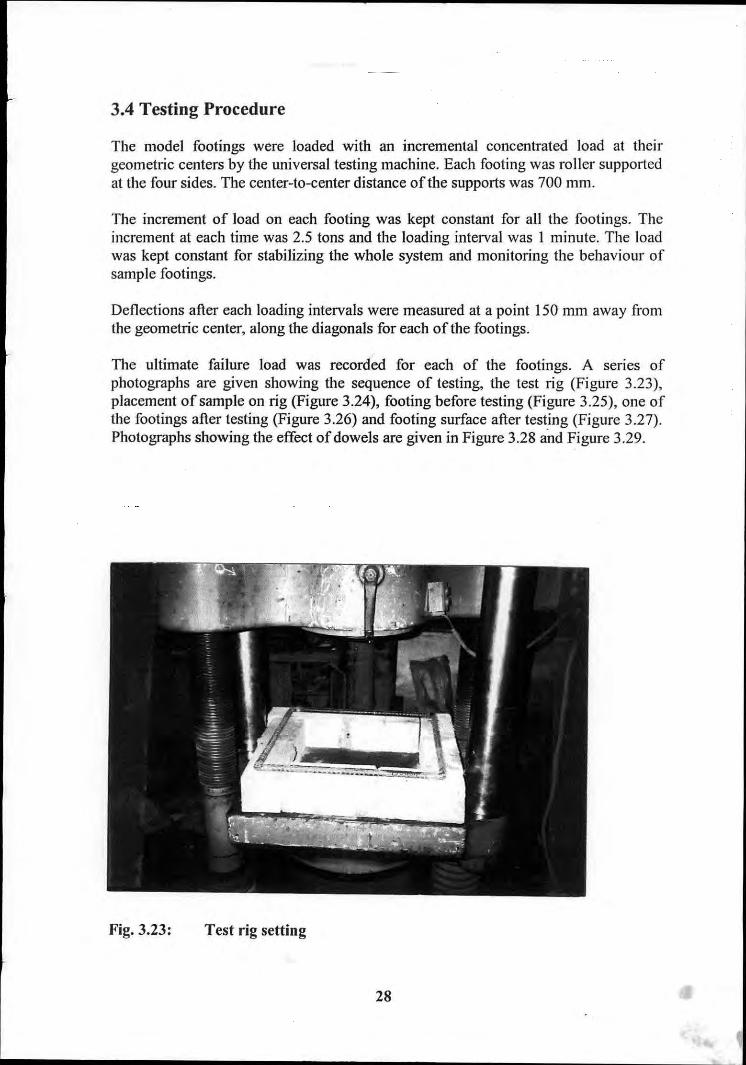
3.4 Testing Procedure
The model footings were loaded with an incremental concentrated load at theirgeometric centers by the universal testing machine. Each footing was roller supportedat the four sides. The center-to-center distance of the supports was 700 111m.
The increment of load on each footing was kept constant for all the footings. Theincrement at each time was 2.5 tons and the loading interval was I minute. The loadwas kept constant for stabilizing the whole system and monitoring the behaviour ofsample footings.
Deflections after each loading intervals were measured at a point 150 111maway fromthe geometric center, along the diagonals for each of the footings.
The ultimate failure load was recorded for each of the footings. A series ofphotographs are given showing the sequence of testing, the test rig (Figure 3.23),placement of sample on rig (Figure 3.24), footing before testing (Figure 3.25), one ofthe footings after testing (Figure 3.26) and footing surface after testing (Figure 3.27).Photographs showing the effect of dowels are given in Figure 3.28 and Figure 3.29.
Fig. 3.23: Test rig setting
28
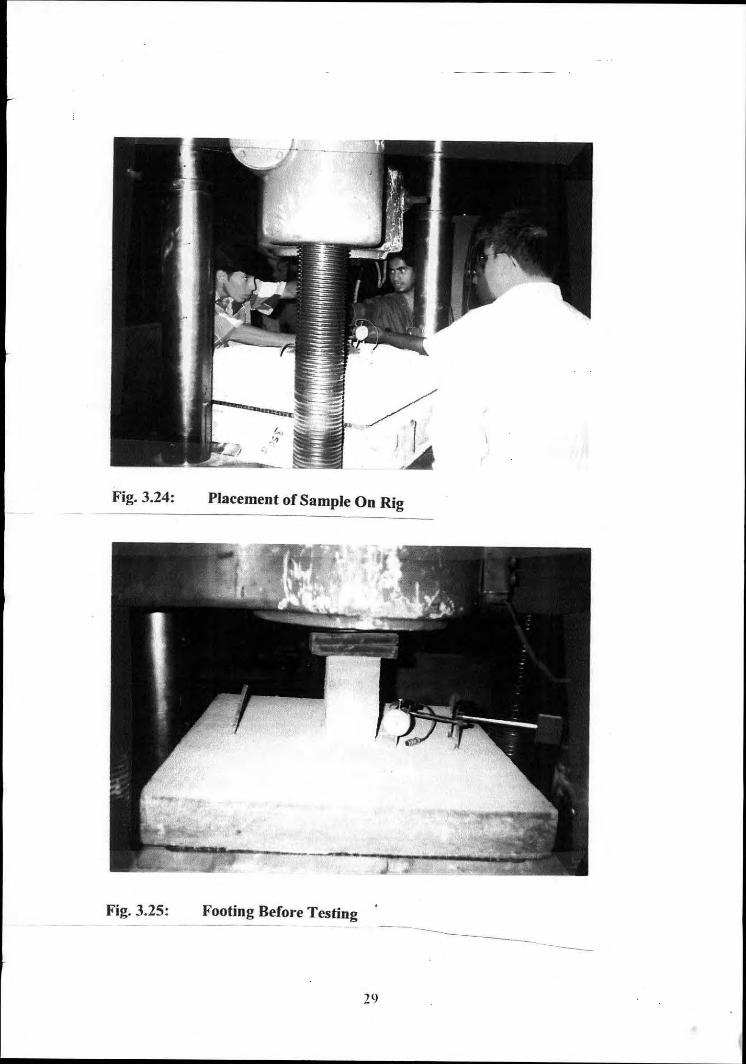
Fig. 3.24: Placement of Sample On Rig
Fig. 3.25: Footing Before Testing
19
------ --
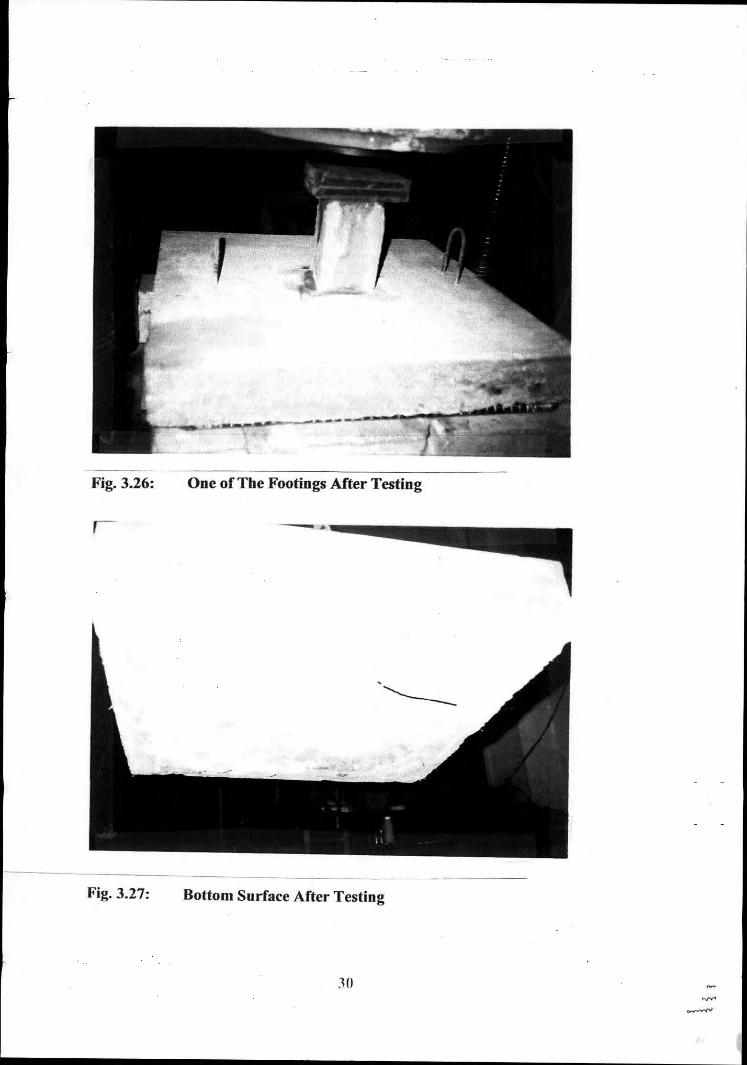
Fig. 3.26:
,-
-~------------One of The Footings After Testing
-.
----- ---
Fig. 3.27: Bottom Surface After Testing
.10
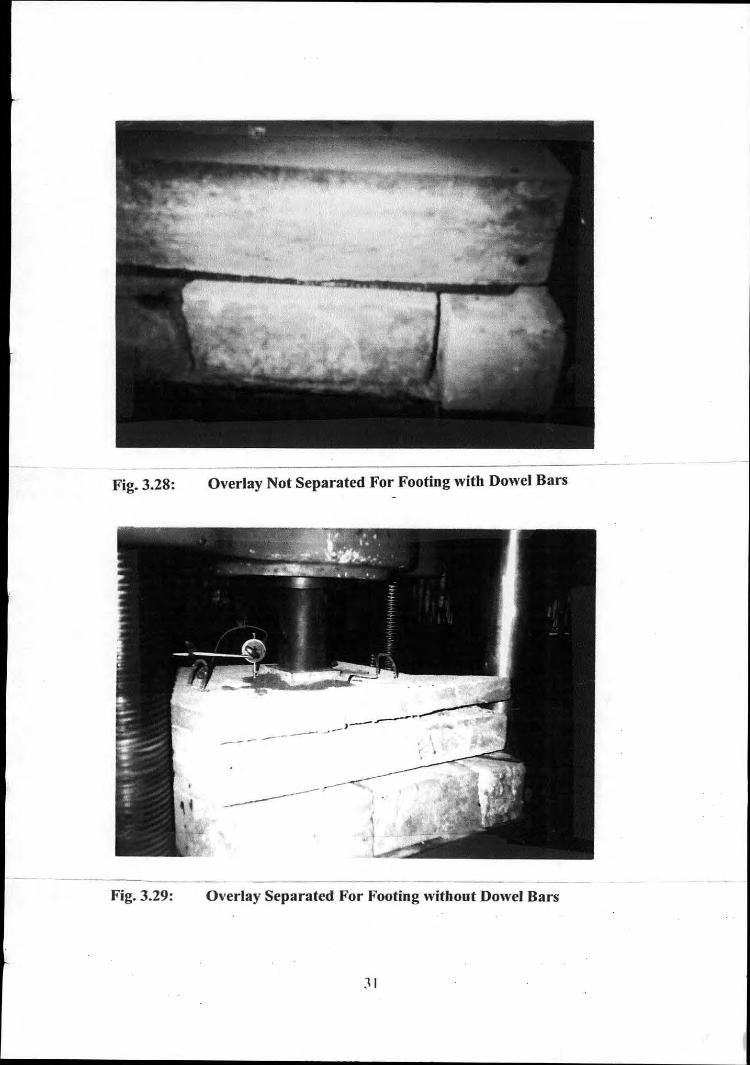
Fig. 3.28:
Fig. 3.29:
Overlay Not Separated For Footing with Dowel Bars
---------
Overlay Separated For Footing without Dowel Bars
.11
CHAPTER FOUR
CODE OF PROVISIONS
4.1 Introduction
For the design of column footings, punching shear strength of concrete in the vicinityof the column is an important dcsign criterion and it usually governs the design.Different code provisions usually rcpresent punching shear strength merely as afunction of concrete strength and ignores the possible effects of percentage of steel,footing size, footing thickness, loading interval, ctc.
4.2 Recognized Code Provisions
4.2.1 American (ACI 318, 1995) CodeAccording to ACI 318 (1995) Code provision, the critical section for shear in slabssubjected to bending in two directions follows the perimeter (bo) located at a distanced/2 from the periphery of the concentrated load. According to this Code, for non-prestressed slabs and footings, nominal punching shear strength provided by concreteshall be the smallest of the following three equations,
For FPS unitV c = (2 + 4/Pc) -Yfc' bodVc = (2 + asd/ bo )-Yfc' bodV c = 4 -Yfc' bod
For SI unitVc = (I + 2/Pc) -Yfc' b"d/6V, = (1 + 0.5asd/ b" )..Jfc' b"d/6V, = 0.33 -Yfc' b"d
Here,
(4.1)(4.2)(4.3)
(4.4)(4.5)(4.6)
V, = Punching shear strength in pounds or NewtonPc = Ratio of long side to short side of concentrated load or reaction areafc' = Uniaxial cylinder (compressive) strength of concrete in psi or MPab" = Perimeter of critical section of footing in inch or mmd = Effectivc dcpth in inch or nll11as = 40 for intcrior column, 30 for cdgc column and 20 for comer column.
32
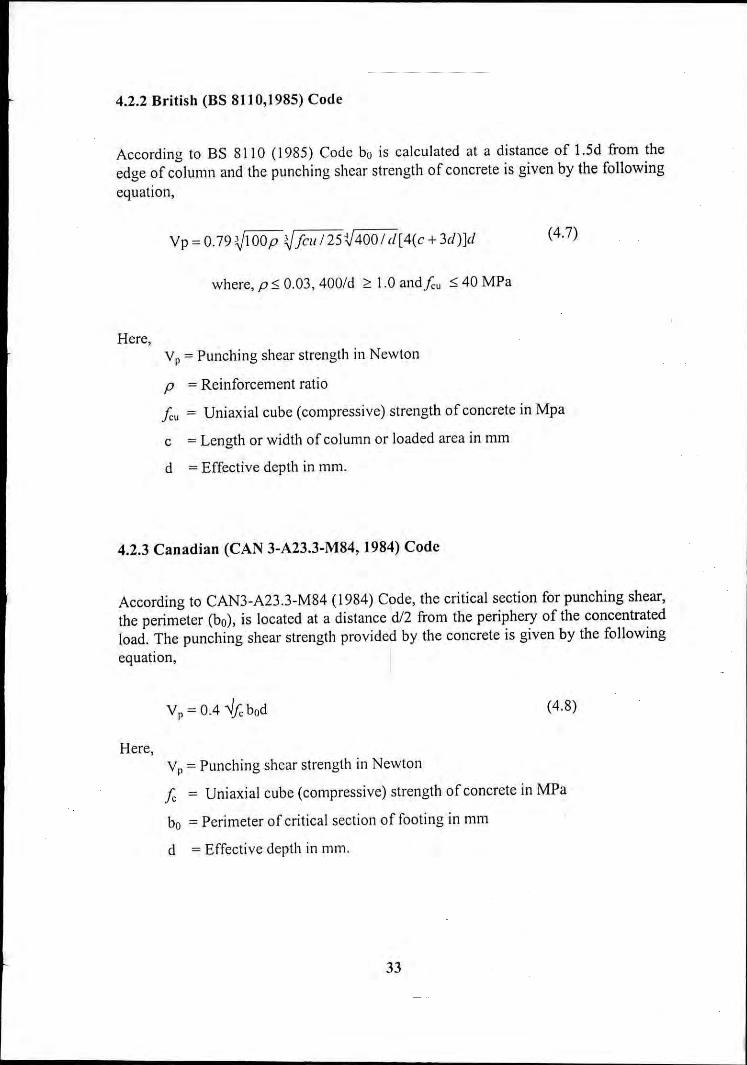
4.2.2 British (BS 8110,1985) Code
According to BS 8110 (1985) Code bo is calculated at a distance of 1.5d from theedge of column and the punching shear strength of concrete is given by the followingequation,
Vp = 0.79 VIOOp Vjc/I I 25V4001 d[ 4(c + 3d)]d
where, p ~ 0.03, 400/d ~ 1.0 andlc" ~ 40 MPa
(4.7)
Here,Vp = Punching shear strength in Newton
p = Reinforcement ratio
Icu = Uniaxial cube (compressive) strength of concrete in Mpa
e = Length or width of column or loaded area in mm
d = Effective depth in mm.
4.2.3 Canadian (CAN 3-A23.3-M84, 1984) Code
According to CAN3-A23.3-M84 (1984) Code, the critical section for punching shear,the perimeter (bo), is located at a distance d/2 from the periphery of the concentratedload. The punching shear strength provided by the concrete is given by the followingequation,
v p = 0.4 -Vic bod (4.8)
Here,v p = Punching shear strength in Newton
Ic = Uniaxial cube (compressive) strength of concrete in MPa
bo = Perimeter of critical section of footing in mm
d = Effective depth in mm.
33
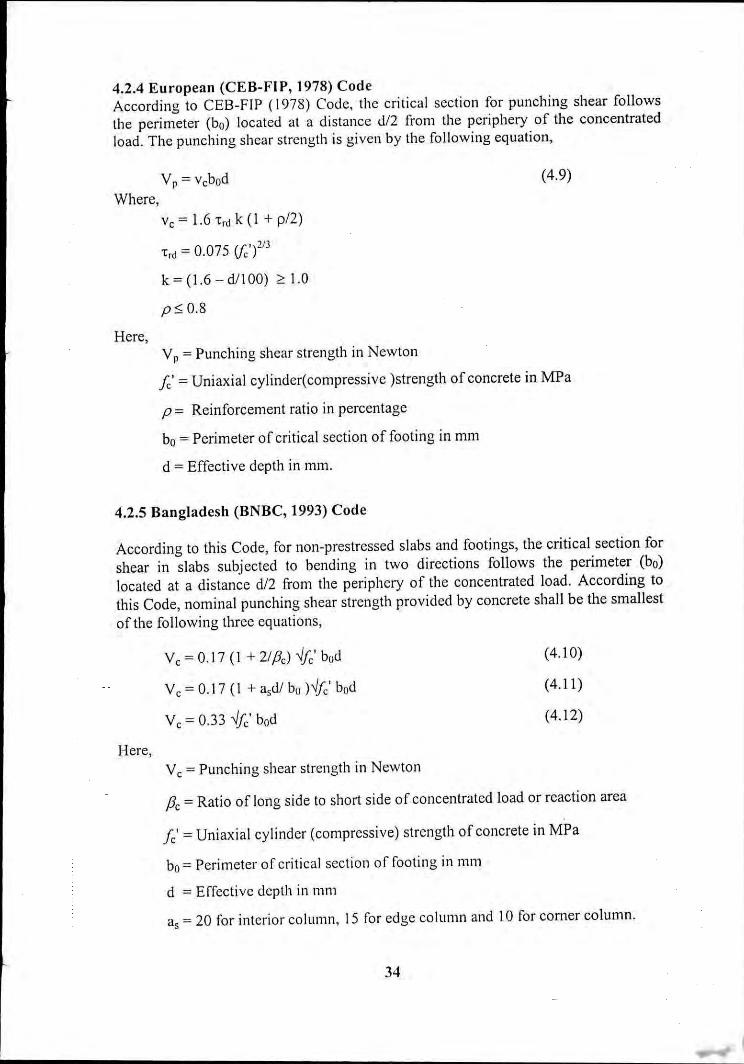
4.2.4 European (CEB-FI P, 1978) CodeAccording to CEB-FIP (1978) Code. thc critical section for punching shear followsthe perimeter (bo) locatcd at a distancc d/2 from the periphery of the concentratedload. The punching shear strength is givcn by the following equation,
Vp = vcbodWhere,
Vc = 1.6',,1 k (I + p/2)
- 0 075 If ,)2/3'rd -. v'k = (1.6 - dll 00) :2:1.0
pSO.8
Here,
(4.9)
v p = Punching shear strength in Newton
!c' = Uniaxial cylinder(compressive )strength of concrete in MPa
p = Reinforcement ratio in percentage
bo = Perimeter of critical section of footing in mm
d = Effective depth in mm.
4.2.5 Bangladesh (BNBC, 1993) Code
According to this Code, for non-prestressed slabs and footings, the critical section forshear in slabs subjected to bending in two directions follows the perimeter (bo)located at a distance d/2 from the periphery of the concentrated load. According tothis Code, nominal punching shear strength provided by concrete shall be the smallestof the following three equations,
Here,
Vc = 0.17 (1 + 21/3c) 'lfc' bod
Vc = 0.17 (1 + asdl bo )..Jfc' bod
Vc = 0.33 'lfc' bod
Vc = Punching shear strength in Newton
(4.10)
(4.11 )
(4.12)
/3c= Ratio of long side to short side of concentrated load or reaction area
fc' = Uniaxial cylinder (compressive) strength of concrete in MPa
bo = Perimeter of critical section of footing in nll11
d = Effective depth in 111m
as = 20 for interior column, 15 for edge column and 10 for comer column.
34
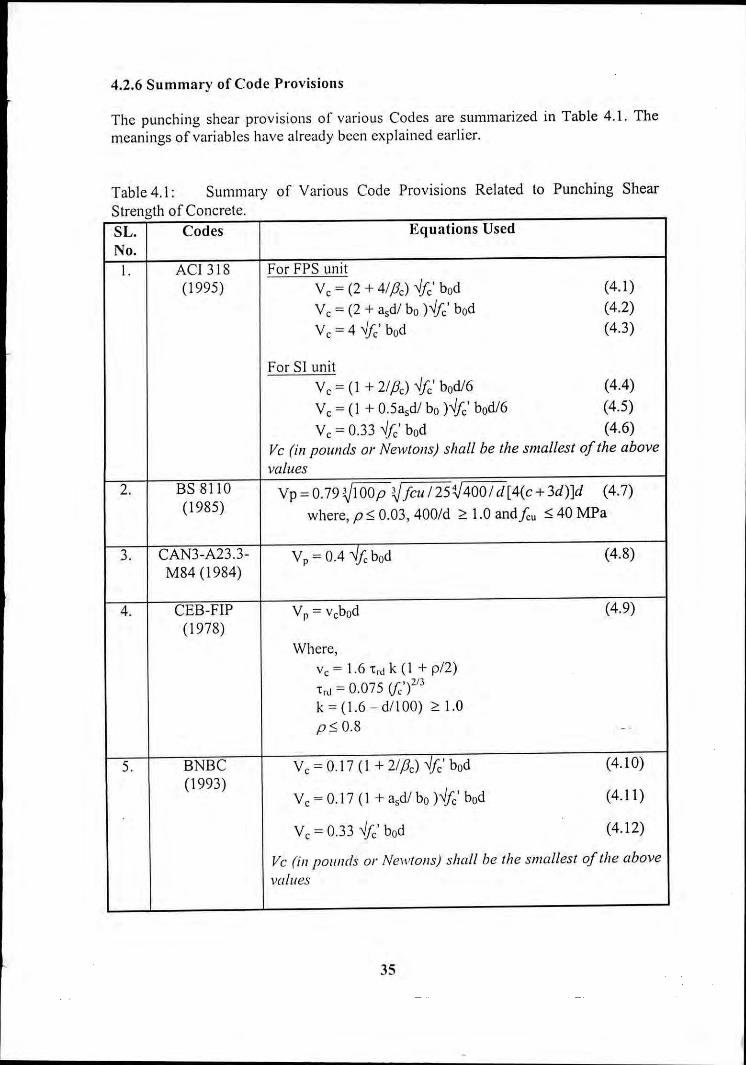
4.2.6 Summary of Code Provisions
The punching shear provisions of various Codes are summarized in Table 4.1. Themeanings of variables have already been explained earlier.
Table 4.1: Summary of Various Code Provisions Related to Punching ShearStrength of Concrete.SL. Codes Equations UsedNo.I. ACI318 For FPS unit
(1995) V, = (2 + 4/Pc) ..Jfc' bod (4.1)V, = (2 + asd/ bo )..Jfc' bod (4.2)V, = 4 ..Jfc' bod (4.3)
For SI unitV, = (I + 2/Pc) ..Jfc' bod/6 (4.4)V, = (1 + 0.5asd/ bo )..Jfc' bod/6 (4.5)V, = 0.33 ..Jfc' bod (4.6)
Ve (ill pOllllds or Newtolls) shall be the smallest of the abovevailles
2. BS 8110 Vp = 0.79 VIOOp Vfell /25V400/ d[4(e + 3d)]d (4.7)(1985) where, p:O; 0.03, 400/d ::0: 1.0 andfcu :0; 40 MPa
3. CAN3-A23.3- Vp = 0.4 .,jfc bod (4.8)M84 (1984)
4. CEB-FIP Vp = v,bod (4.9)( 1978)
Where,v, = 1.6 't,,, k (1 + p/2)
o if., 2IJ't,,, = .075 ,)k = (1.6 - d/l 00) ::0: 1.0p:O; 0.8 -
5. BNBC V, = 0.17 (I + 2/Pc) ..Jfc' bod (4.10)(1993 )
V, = 0.17 (I + asd/ bo )..Jfc' bod (4.11 )
V, = 0.33 ..Jfc' bod (4.12)
Ve (ill pOllllds or Ne\\'tolls) shall be the smallest of the abovevalues
35
CHAPTER FIVE
EXPERIMENTAL RESULTS AND DISCUSSIONS
5.1 General
Present study was carried out to find out the cffect of overlay on old footings inincreasing their punching shear capacity, which is a very important criterion in thedesign of footings. Different combinations of dowel bars for bonding between oldconcrete and overlay and reinforcemcnt at compressive zone were used with overlaycasting to find their contributions along with overlay. To have comparative results,main reinforcement and all other parameters such as size, thickness, etc. were kept thesame for all the footings. Experimental test results and code predicted results fordifferent footings are summarized in this chapter. Overlay enhanced the strength offootings. The use of dowel bar provided substantial bonding between old and newconcrete. Use of compressive steel could not signify any remarkable contributionalong with overlay.
5.2 Ultimate Load Capacity
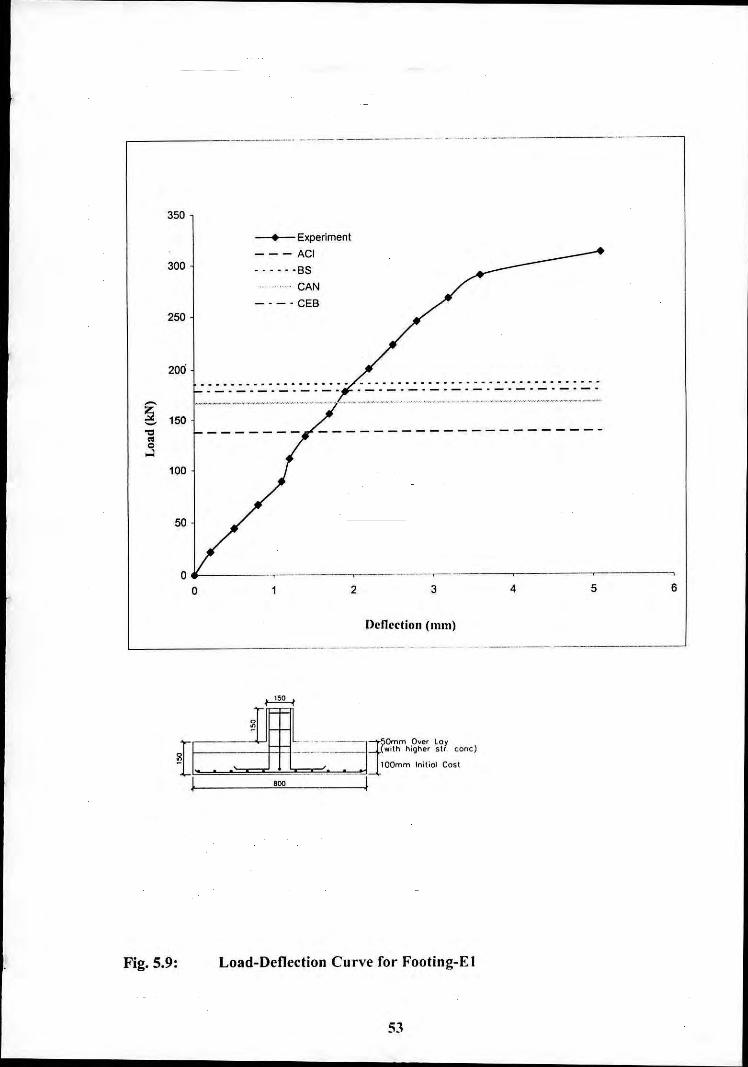
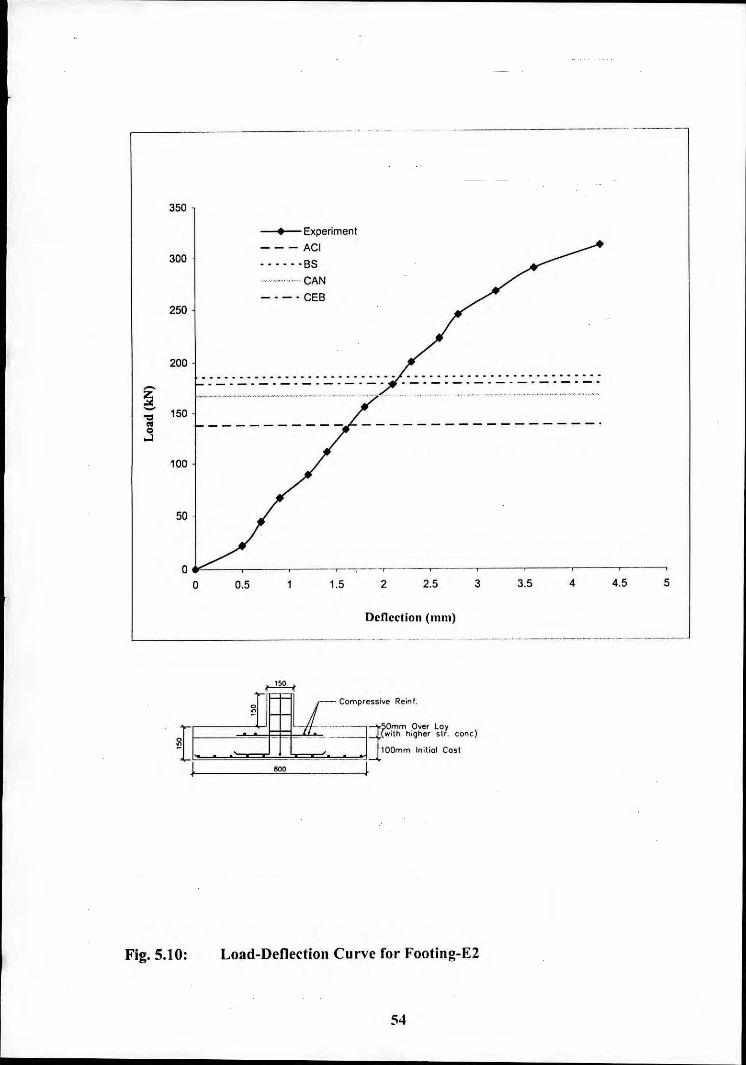
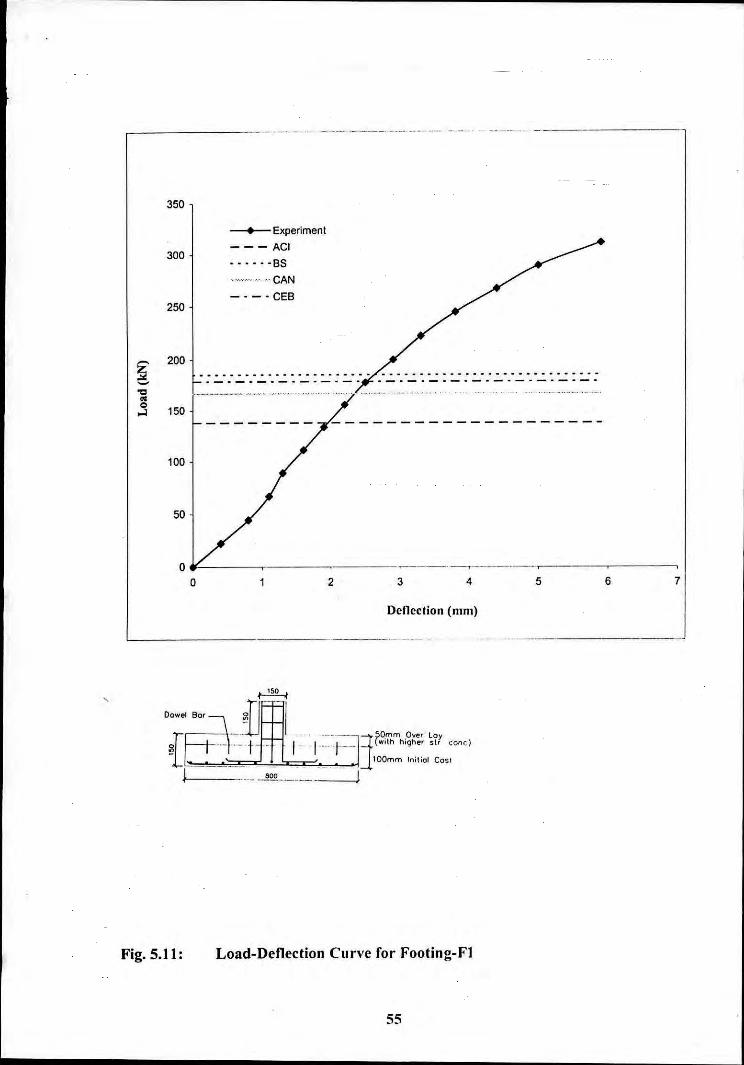
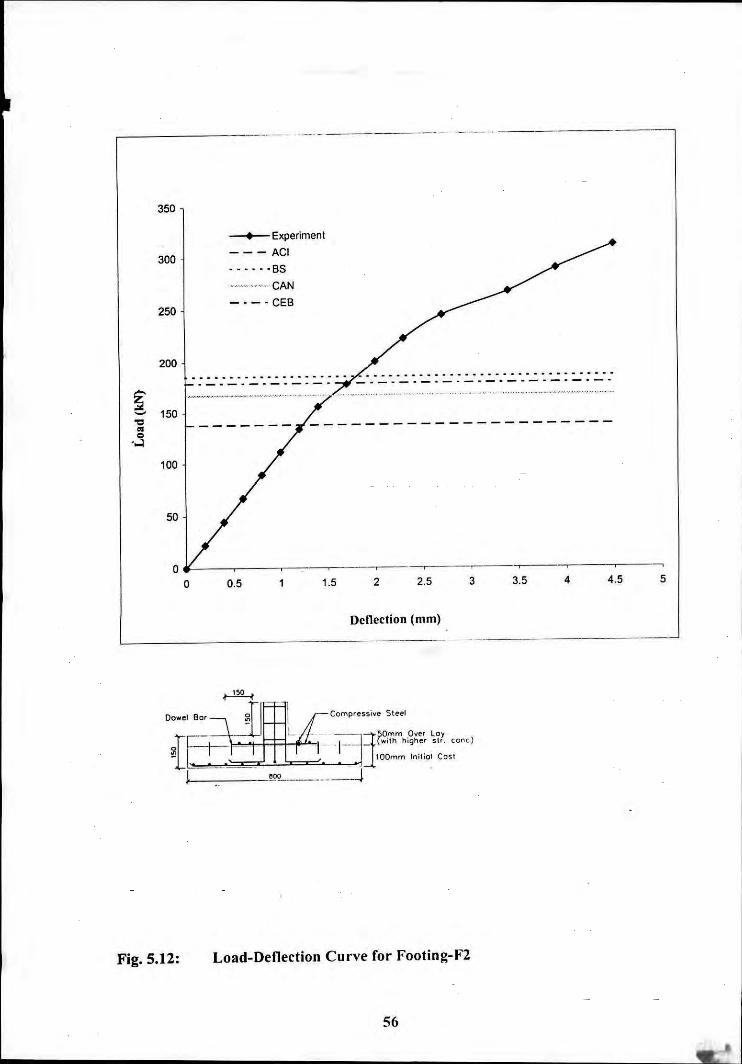
It is essential to know the ultimate load carrying eapacity of any structural members,including footings. Ultimate load carrying capacity of all the footings obtained fromtest results is summarized in Table 5.1a and 5.1b. Code predicted results for ACI 318-95, BS 8110-85, CAN3-A23.3-M84, and CEB-FIP are summarized in Table 5.2.Non-dimensional punching shear strength (P,,'/bodf,') of each of the footings tested,as well as code prcdicted rcsults, arc calculated, compared and presented in Tables5.3 and 5.4. Usc of overlay incrcascd thc ultimate load capacity of footingssignificantly. All of the footings failed in a punching shear mode. Code predictedresults wcrc quite conservative exccpt for Canadian code, which was close to the testresults. Test results of two footing CI & C2 differ from other samples in ultimate loadcarrying capacity. It may have happened due to possible lapses during construction ofthese set of footings. Use of dowcl bars and compressive reinforcement could notshow any significant contribution towards increasing the ultimate load capacity offootings with overlay. Ultimate load carrying capacity of footings \vith overlay washigher than those originally cast and it matched well with the ultimate load carryingcapacity of footings without overlay but having comparable depth.
36
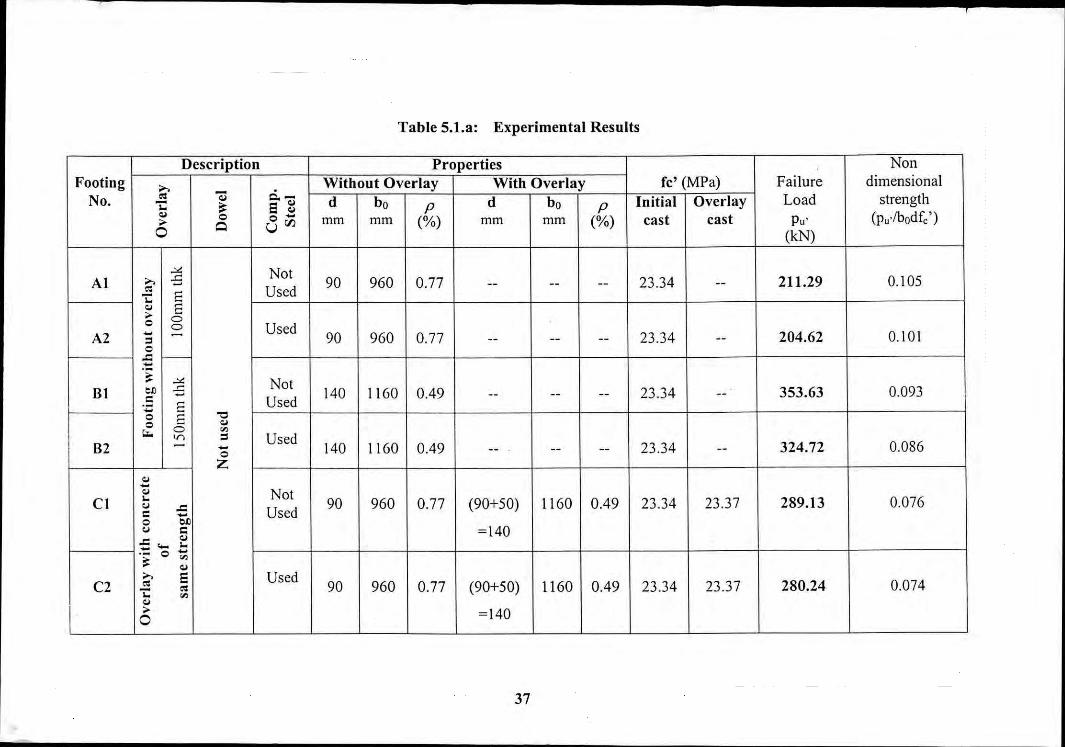
Table 5.l.a: Experimental Results
Description Properties NonFooting ..., Without Overlay With Overlay fe' (MPa) Failure dimensionalNo. " <l c..- d bo d bo Initial Overlay Load strengthi: ~ 5 1l p p
" 0 o - (%) (%) cast cast Pll' (p"./bodfc')... Q U'" mm mm mm mm0 (kN)
"" NotAI ;.., ;: 90 960 0.77 -- -- -- 23.34 -- 211.29 0.105.:: E Used..." ~... c
00 0 UsedA2 - - 90 960 0.77 23.34 204.62 0.101::l -- -- -- --~ --~ "" NotHI :D ~ 140 1160 0.49 23.34 353.63 0.093c Used -- -- -- --- c0 ;:: "::l
~C "0 '"I 'r> ::l UsedI H2 - 140 1160 0.49 23.34 324.72 0.086I - -- -- -- --0
Z"-" NotC1 ... 90 960 0.77 (90+50) 1160 0.49 23.34 23.37 289.13 0.076" -= Used" -0 ••" " =140
"::-l...';: 0 t;~ "•... 5 UsedC2 " 90 960 0.77 (90+50) 1160 0.49 23.34 23.37 280.24 0.074;: "'""... =1400
37
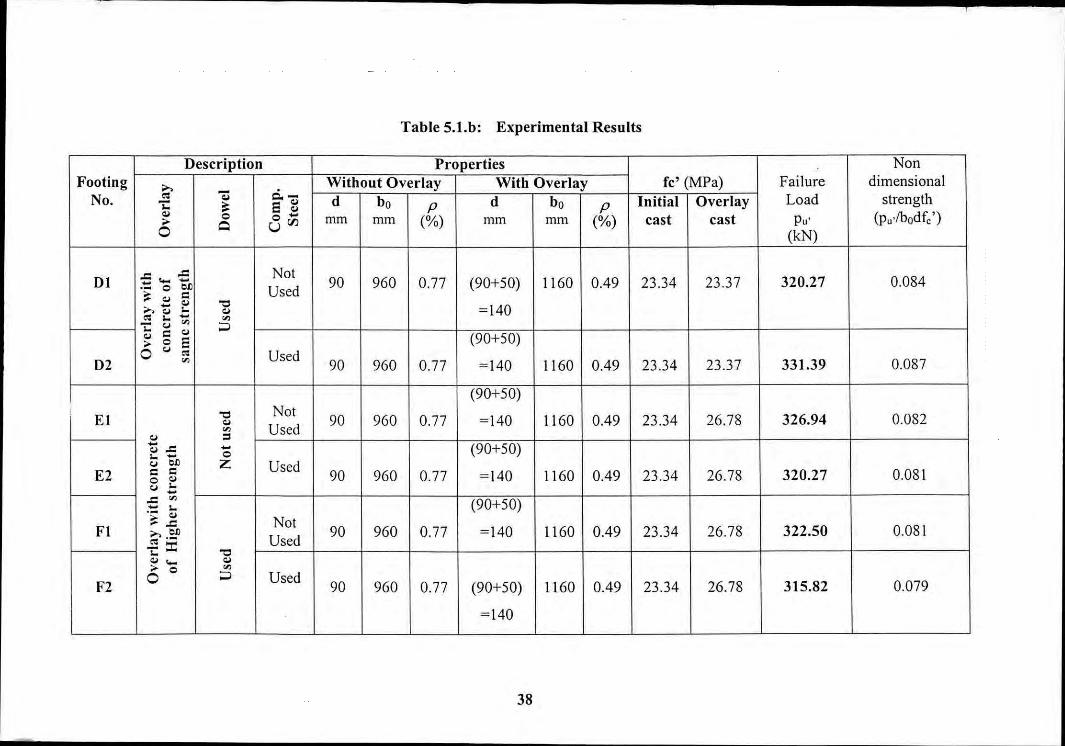
Table 5.l.b: Experimental Results
Description
~ c..-:: e ~o 0 -Q Urn
fe' (MPa)Initial Overlaycast cast
PropertiesWithout Overlay With Overlayd bo p d bo pmm (%) mm (%)
0,081
0.079
0.081
0.082
0.087
0.084
Nondimensionalstrength(Po,fbodf,')
315.82
322.50
320.27
326.94
331.39
320.27
FailureLoadpo'(kN)
26.78
26.78
26.78
26.78
23.37
23.37960 I 0.77 I (90+50) I 1160 I 0.49 I 23.34
=140
(90+50)~l =140 11160 I0.491~4(90+50)
960 I 0.77 1 =140 11160 I 0.49 1 23.34
(90+50)
~ =140 11160 I 0.491~4(90+50)
960 I 0.77 1 =140 11160 1 0.49 1 23.34
960 I 0.77 I (90+50) I 1160 I 0.49 I 23.34
=140
90
90
90
90
90
90
NotUsed
Used
Used
NotUsed
Used
NotUsed
-oZ
"'""::>
"""=
"""::>
;;.,
";:'";.o
'"-C,)..c•.. -" OJ)c co "" •....c ";.."::: l-
;.. "~ -=~ .?p1:="' ...~ -o -
- -::-':"; 0 OJ)
~ '" c~- ~::-. C,.l l-." l- --;: C.J r.Il
" C ". 0 -6 C.J ::~
FI
EI
F2
E2
DI
D2
FootingNo.
38
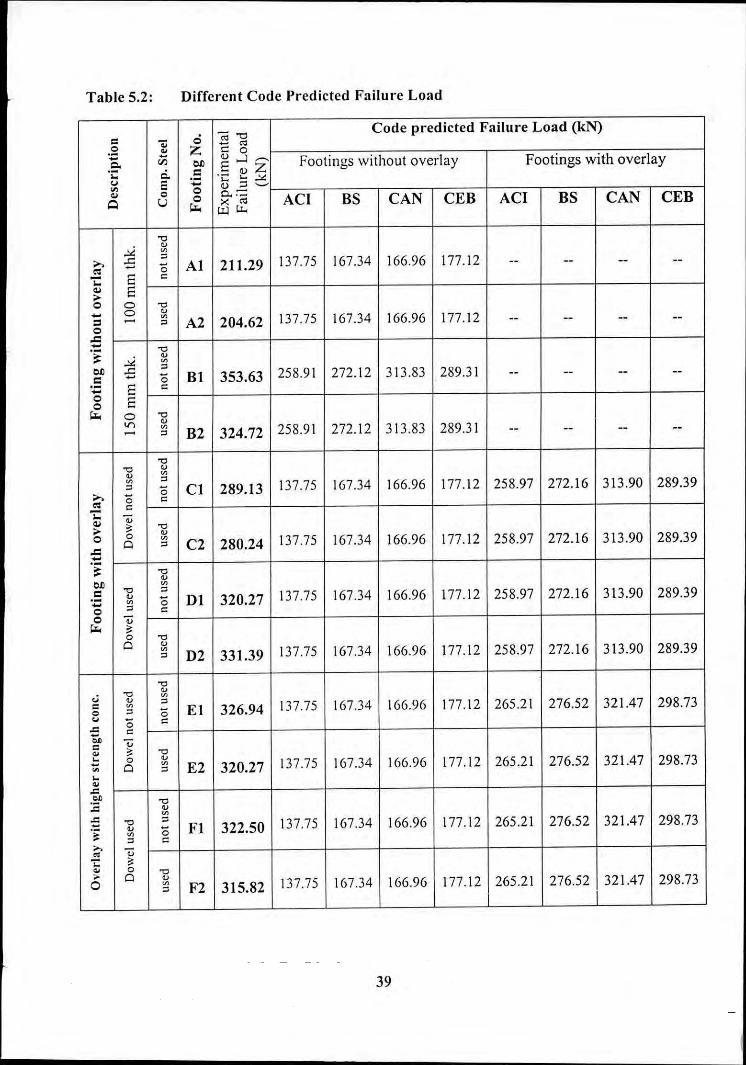
Table 5.2: Different Code Predicted Failure Load
0 ,,-0 Code p,'edicted Failure Load (kN)";; ~ "
"E ~ z ::: 0<ii 0) .....l ~ Footings without overlay Footings with overlayCo OJ) E 0) Z.;: c. .: ';: l- ~
" :: - IJ):=I-~ 0" 0 0 0.::: ACI BS CAN CEB ACI BS CAN CEBQ u x "\>;., wu..
"0
-'"•..~::>--. -5 '0 Al 21 1.29 137.75 167.34 166.96 177.12 -- -- -- --
";: ~ :::::
" ~;. :::0 0 "0- 0 •..~ 137.75 167.34 166.96 177.12= - " A2 204.62 -- -- -- --0-=.": "0:: -'"
•..~OJ) -5 " 258.91 272.12c '0 BI 353.63 313.83 289.31 -- -- -- --
~ ::- :::0 E0\>;., 0 "0
or> •..~ 258.91 272.12 313.83 289.31- " B2 324.72 -- -- -- --
"0"0 •..•.. ~~ "" '0 CI 289.13 137.75 167.34 166.96 177.12 258.97 272.16 313.90 289.39
;.. '0 ::
'" ::;: -;;0) ~ "0;.
0 •..0 ~ 137.75 167.34 166.96 177.12 258.97 272.16 313.90 289.390 :: C2 280.24-=.":;. "0, •..OJ) ~
"0 ".S '" '0 01 320.27 137.75 167.34 166.96 177.12 258.97 272.16 313.90 289.39- ~0 " ::0 -;;\>;., ~
0 "00 '"~ 137.75 167.34 166.96 177.12 258.97 272.16 313.90 289.39
" 02 331.39
"0"0
•..~
~'" " 137.75 167.34 166.96 177.12 265.21 276.52 321.47 298.73
0 ~ '0 E1 326.94•..• '0 ::
e. ::
:: -;;~ ~ "0
t: 0 •.. 137.75 167.34 166.96 177.12 265.21 276.52 321.47 298.730 ~ E2 320.27~ ::
~~-=.e!' "0-= •..~"0 " 137.75 167.34 166.96 177.12 265.21 276.52 321.47 298.73.~ •.. '0 F1 322.50~" ::... -;;
'"~ ~~ 0 "0•• 0 •.. 298.730 ~ F2 315.82 137.75 167.34 166.96 177.12 265.21 276.52 321.47"
39
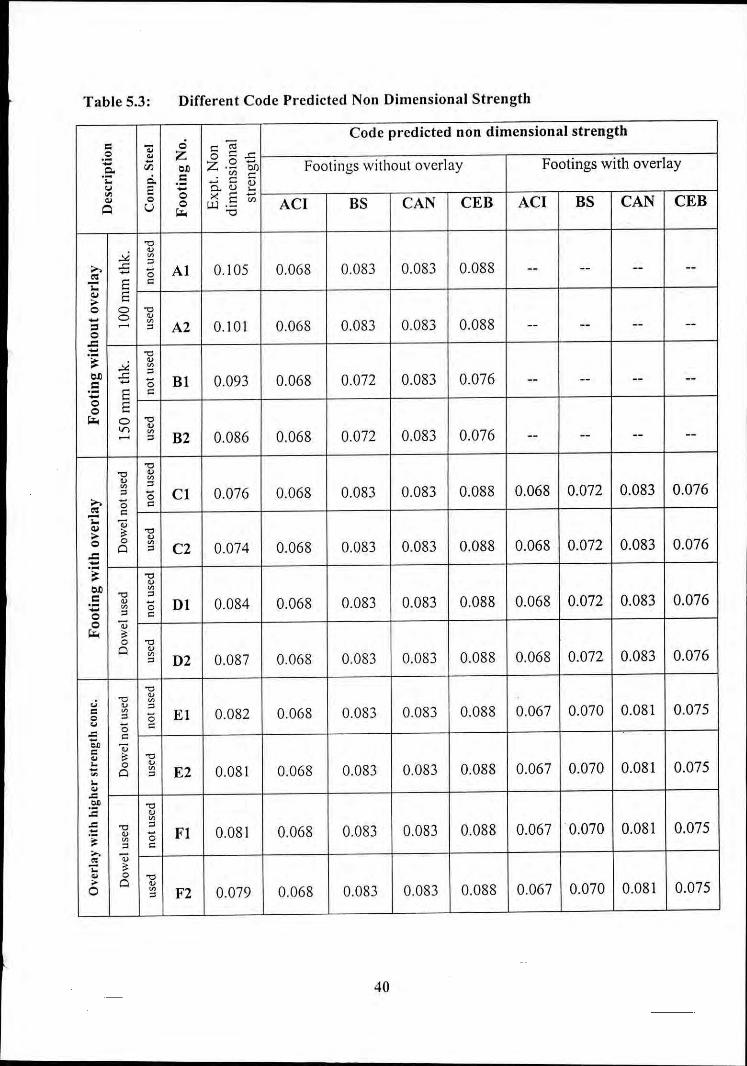
Table 5.3: Different Code Predicted Non Dimensional Strength
Code predicted non dimensional strength
Footings with overlayFootings without overlay
CAN CEBBSCAN CEll ACIllSACI
o t:~Z 0 g..:::CD Z.- Of)= V'J ,-....::: V__ o...~1...OX •...• -o WCU')
':.-.. "0
o ."o ~- ~
AI
A2
131
132
0.105
0.101
0.093
0.086
0.068
0.068
0.068
0.068
0.083
0.083
0.072
0.072
0.083
0.083
0.083
0.083
0.088
0.088
0.076
0.076
0.076
0.076
0.076
0.076
0.083
0.083
0.083
0.083
0.072
0.072
0.072
0.072
0.068
0.068
0.068
0.068
0.088
0.088
0.088
0.088
0.083
0.083
0.083
0.083
0.083
0.083
0.083
0.083
0.068
0.068
0.068
0.068
0.084
0.087
0.074
0.076
01
C2
02
CI
."•..~"o"
."•..~~
C. ."" •..'Z IIIo ~o V~ ~
o ."Cl ~~
."•..~~o"
."•..~" EI 0.082 0.068 0.083 0.083 0.088 0.067 0.070 0.081 0.075
E2 0.081 0.068 0.083 0.083 0.088 0.067 0.070 0.081 0.075
o"
FI
F2
0.081
0.079
0.068
0.068
0.083
0.083
0.083
0.083
0.088
0.088
0.067 0.070 0.081
0.067 0.070 0.081
0.075
0.075
40
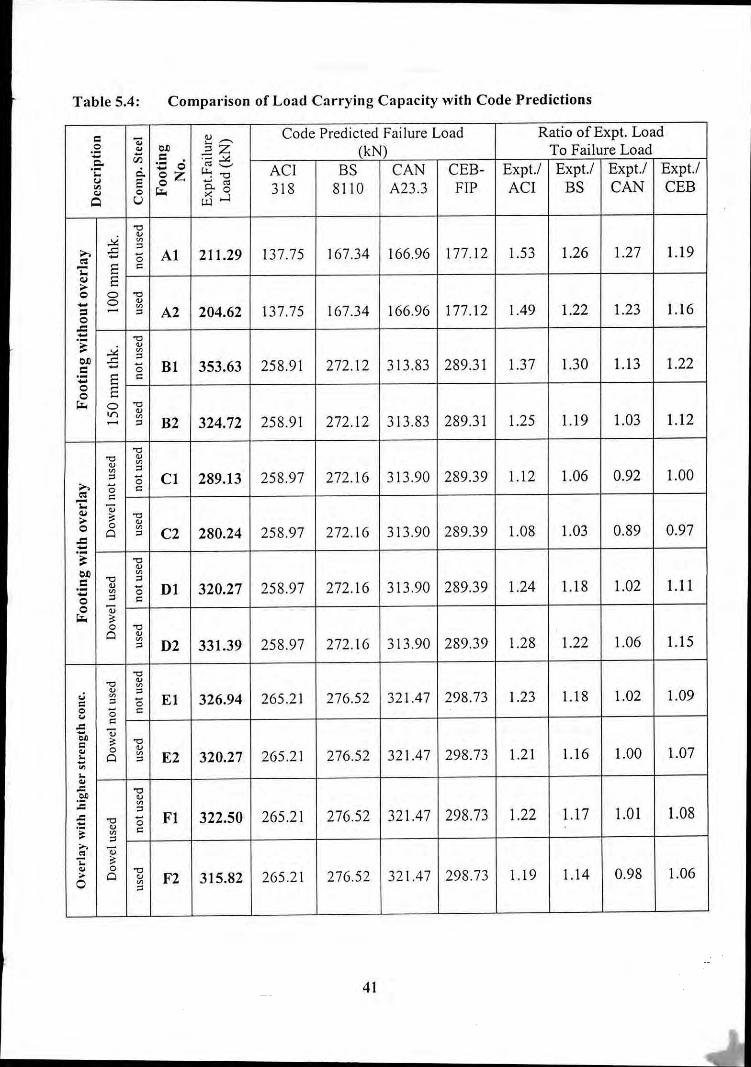
Table 5.4: Comparison of Load Carrying Capacity with Code Predictions
" ";; ~~ Code Predicted Failure Load Ratio of Expt. Load
'i ~ C£ =z (kN) To Failure LoadVi .: ::::..::.::::0 " ~.;: ci. - "- ACI BS CAN CEB- Expt./ Expt.! Expt.! Expt.!gz . -0
" - "'" :; ~ ~ ~ 318 8110 A23.3 FIP ACI BS CAN CEB.,Q U UJ-
"C
-'" "~">. -5 "0 Al 211.29 137.75 167.34 166.96 177.12 1.53 1.26 1.27 1.19<:: ~ ";:; <:
'" E0 0 "C- 0 "~" - " A2 204.62 137.75 167.34 166.96 177.12 1.49 1.22 1.23 1.160-5
"Cos:-'" "~ ~
c£ -5 "c "0 B1 353.63 258.91 272.12 313.83 289.31 1.37 1.30 1.13 1.22- E "0 ~0 <:~ 0 "C
<r) "~- " B2 324.72 258.91 272.12 313.83 289.31 1.25 1.19 1.03 1.12
"C"C ""
~~ "" "0 CI 289.13 258.97 272.16 313.90 289.39 1.12 1.06 0.92 1.00
>. "0 "<:: "i: ";;.,~ "C
'" "0 0 ~Q " C2 280.24 258.97 272.16 313.90 289.39 1.08 1.03 0.89 0.97..c-.~ "C
"c£ ~C "C "" "0 DI 320.27 258.97 272.16 313.90 289.39 1.24 1.18 1.02 1.11- ~0 " "0 ";;~ ~
0 "CQ "~ D2 331.39 258.97 272.16 313.90 289.39 1.28 1.22 1.06 1.15
"C"C ~~" "'"'~
"0 EI 326.94 265.21 276.52 321.47 298.73 1.23 1.18 1.02 1.09g ""0 "~"
~";;~ "C
~ 0 "~ 265.21 276.52 321.47 298.73 1.21 1.16 1.00 1.07~ Q " E2 320.27~~~~
"C
".:: ~""C "0 FI 322.50 265.21 276.52 321.47 298.73 1.22 1.17 1.01 1.08
'E " "~";..
" v;: ~~ 0 "C;. Q v F2 315.82 265.21 276.52 32 1.47 298.73 1.19 1.14 0.98 1.060 ~
"
41
5.3 Effect of Overlay
Main objective of the present study was to find out the effectiveness of the use ofconcrete overlay on existing footings. Two sets of footings were cast without overlay.One of those (A I, A2) had the same thickness, as that of the initial cast of thefootings before overlay and other (B I, B2) had the thickness equal to the total depthof footings after overlay. Remaining footing samples had overlay with differentcombinations of dowels and compressive steel. Experimental results (Table 5.2)shows that ultimate load carrying capacity of all the footings increased substantiallyafter the application of concrete overlay. In general, the ultimate capacity of footingswith overlays matched well with the footings having a total depth equal to thesummation of the depth of original cast plus the overlay. This clearly portrays thepositive contribution of overlay on old concrete to enhance the ultimate load carryingcapacity of footings.
5.4 Effect of Dowel Bar
Dowel bar was used in footings D I, D2, FI and F2 for bonding between old and newconcrete. Previous research by Gosh (2000), using dowel bars with initial castingcould not find the contribution of dowels. For the present study dowel bars weredrilled into the old concrete before overlay cast, which provided a significantcontribution for bonding between old and new concrete. It is evident from Fig. 3.28and 3.29 that dowel bars contributed in enhancing the bond between old and newconcrete.
However, dowels could not bring any signi ficant contribution to Increase of theultimate load capacity of footings
42
5.5 Effcct of Rcinforccmcnt Bar at Comp,'cssion Arca
Additional reinforccment was used at comprcssive zonc of the footings with overlayas well as without ovcrlay, to find its cffcctivcncss towards increasing the punchingstrength. But it could not show any positive contribution, rather the ultimate capacityof the footings with compressive steel was lower than those without compressive steelinmost of the cases except footing-D2, which had ultimate load more than DI.
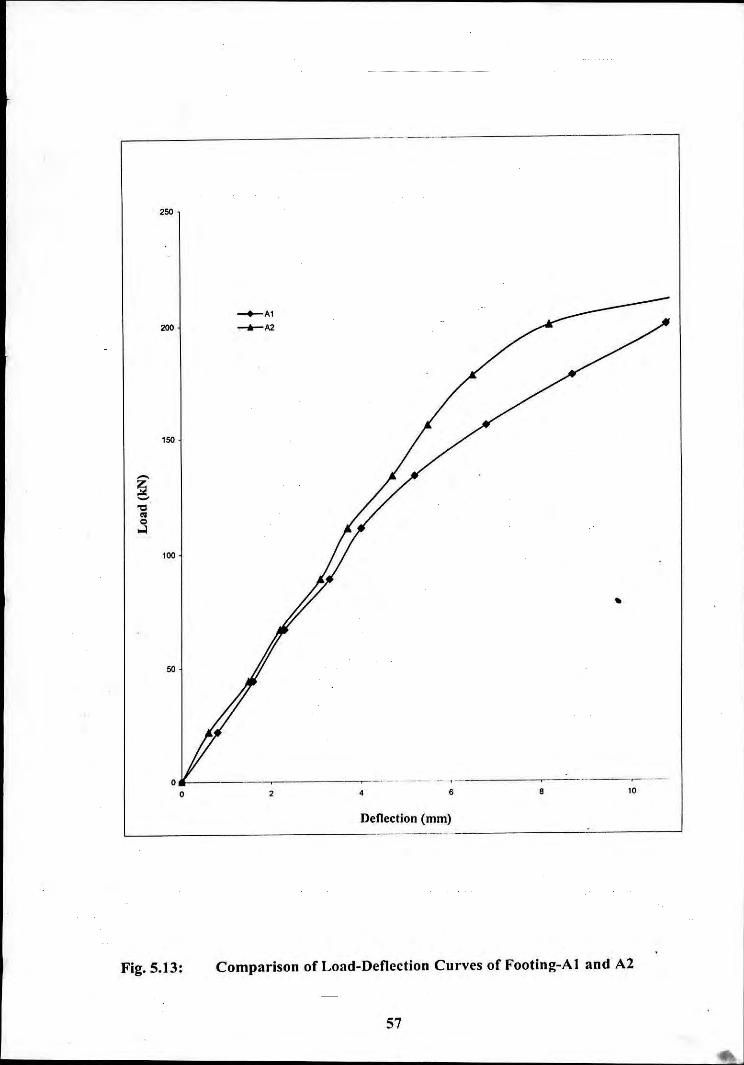
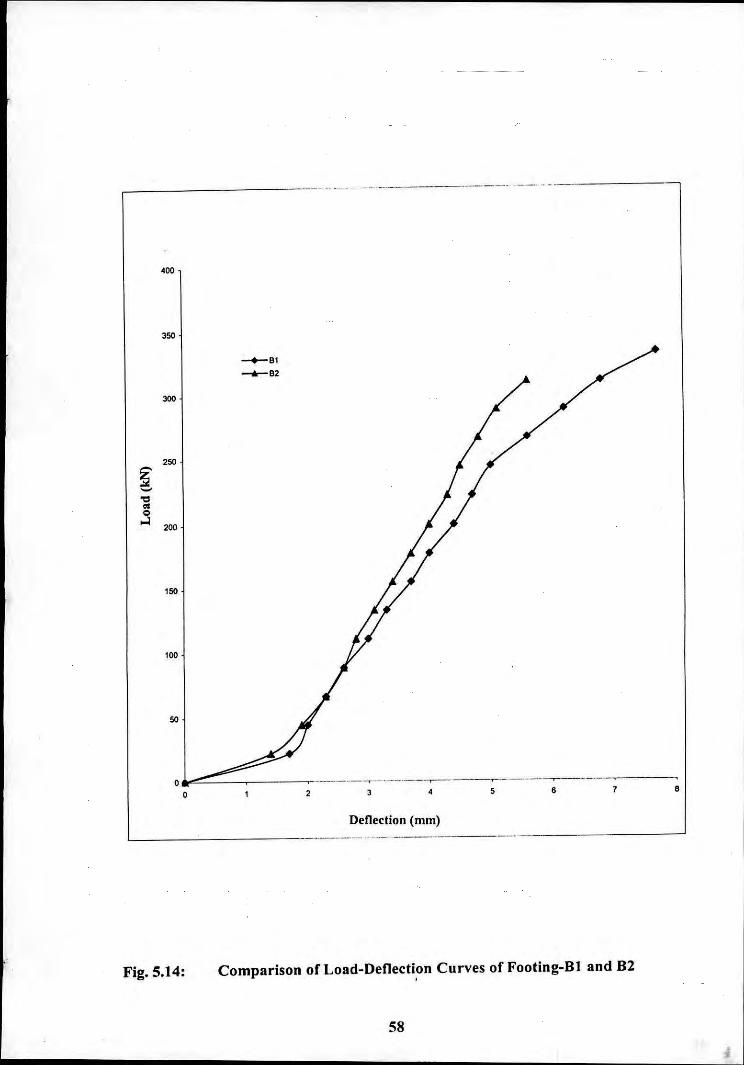
From load-deflection curve in Fig. 5.13 and 5.14 it is elear that footings withcompressive steel (A2, 82) have lcss deflection than footings without compressivesteel (A 1, 8 I), which is also evident from Fig. 5.15. Moreover, load-deflection curvefor footings with compressive stcel in Fig. 5.17 seems to be more rational than that offootings without compressive stcel (Fig. 5.1G), which may signify the contribution ofcompressive stcel towards thc rational, i.e. more unifonn deflection of the samples.
5.6 Effcct of higher strcngth concrctc for ovcrlay
Footing E1, E2, Fl and F2 were to have overlay with higher strength concrete. Butthe strength of overlay concrete for these samples could not be achieved up to the.desired level, though the mixing ratio was maintained to have a higher strength.Consequently, no significant contribution of concrete strength used in overlay couldbe detected.
5.7 Load Dcflcction Charactcristics
The load-deflection curvcs of individual footings and in various combinations aregiven in Fig. 5.1 to Fig. 5.17, in order to undcrstand the load-deflection behaviour oftest footings. It has been observed that footings having less thickness (A I, A2) havedeflected more due to their lack 0 f sti ffiless in comparison to other thicker footings.Again, footings having additional compressive steel have demonstrated slightlyhigher stiffness when compared to their counterparts having no compressive steel.
43
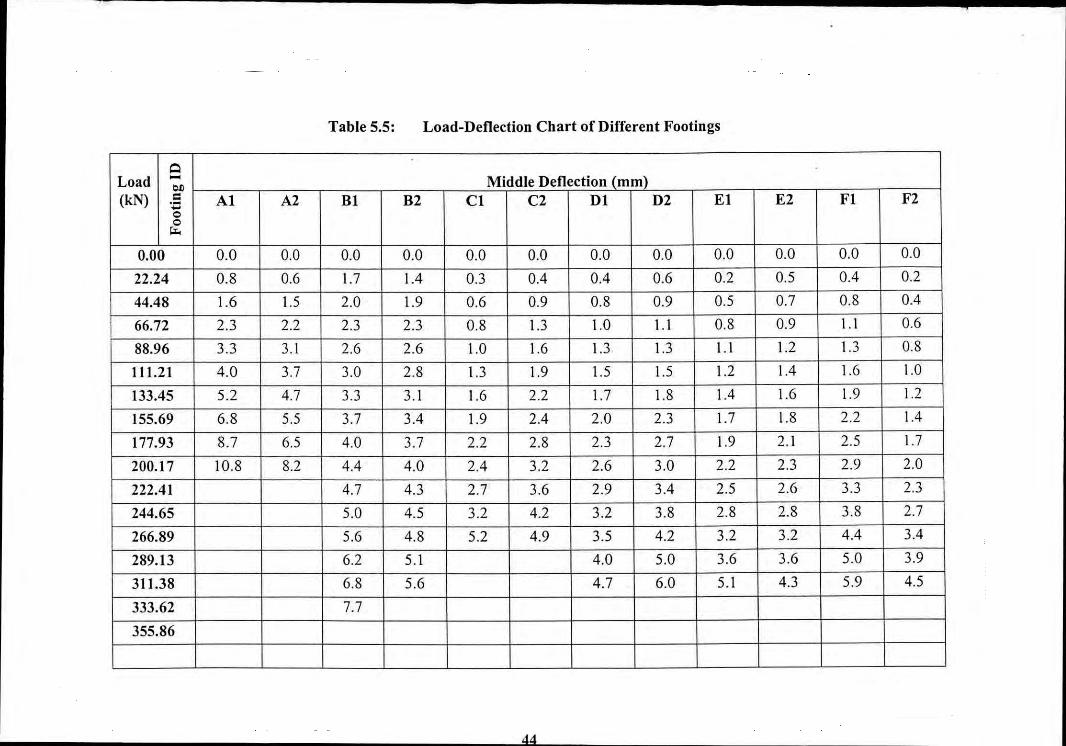
Table 5.5: Load-Deflection Chart of Different Footings
0 Middle Deflection (mm)Load -OJ)(kN) = Al A2 B\ B2 C\ C2 DI D2 EI E2 F\ F2-0
01.0.
0.00 0.0 0.0 0.0 0.0 0.0 0.0 0.0 0.0 0.0 0.0 0.0 0.022.24 0.8 0.6 1.7 1.4 0.3 0.4 0.4 0.6 0.2 0.5 0.4 0.244.48 1.6 1.5 2.0 1.9 0.6 0.9 0.8 0.9 0.5 0.7 0.8 0.466.72 2.3 2.2 2.3 2.3 0.8 1.3 1.0 1.1 0.8 0.9 1.1 0.688.96 3.3 3.1 2.6 2.6 1.0 1.6 1.3 1.3 1.1 1.2 1.3 0.8\11.2\ 4.0 3.7 3.0 2.8 1.3 1.9 1.5 1.5 1.2 1.4 1.6 1.0133.45 5.2 4.7 3.3 3.1 1.6 2.2 1.7 1.8 1.4 1.6 1.9 1.2155.69 6.8 5.5 3.7 3.4 1.9 2.4 2.0 2.3 1.7 1.8 2.2 1.4\77.93 8.7 6.5 4.0 3.7 2.2 2.8 2.3 2.7 1.9 2.1 2.5 1.7200.\7 10.8 8.2 4.4 4.0 2.4 3.2 2.6 3.0 2.2 2.3 2.9 2.0222.4\ 4.7 4.3 2.7 3.6 2.9 3.4 2.5 2.6 3.3 2.3244.65 5.0 4.5 3.2 4.2 3.2 3.8 2.8 2.8 3.8 2.7266.89 5.6 4.8 5.2 4.9 3.5 4.2 3.2 3.2 4.4 3.4289.13 6.2 5.1 4.0 5.0 3.6 3.6 5.0 3.93\ 1.38 6.8 5.6 4.7 6.0 5.1 4.3 5.9 4.5333.62 7.7355.86
44
200 I
[ ~:--. '.-::.-::.-' ::-. ::-.~:--.'.-::.-' :.-'::-. ::-.~:--...-:.:.-.: - .-
150 j
~ 100'C
"j
50
--+-- Experirrenl
- - -ACt•••••. as---~~~.~ CAN
----CEB
o ----~o 2 4 6
Dcncction (mm)
8 10
Fig. 5.1: Load-Deflection Curve for Footing-A I
45
250
._- .. ------------------ --- _ .. _ .. ---_ .. ---.----_.----_.---------------------
--+-- Experiment
- - -ACI_ .. -BS
.... CAN
----CEB
8765432oo
50
200
150~~~'C
"CO. ...l100
Dellectioll (mm)
Fig. 5.2: Load-Deflection Curve for Footing-A2
46
400
350
._---------------------_.----------------------------
9
~Expreiment
---ACI-._ .•. 85
.. CAN
----CE8
87653 42oo
50
... --- .. ---_ .. ----_ .. _. _.- ----_. _ .... - ... -
100
250
300
Dcncclioll (mm)
. - _ .._--.~~------------_.__ ._------_ ..._------------------'
Fig. 5.3: Load-Denection Curve for Footinl(-B I
47
---------------------1
-+-- Experimenl---ACI-- •••. 8S,.--.--.'-'.'-.- CAN
- .'- -CEB50
----------------------------
150
100
300 - ••••••••••.••..••.•.•••••...•.•....••••...•••••.•••• - • • • • .. .•
200
350
1 ._~".;.,.;;;;;;:-~-~-:-.=..~..;.;;:.:..;"=,.~";.;... - ;,;...-~'-;;;,.:,.;.::.;...~,.~'-;,.:.;;:;,..•..:.;,.:,;..;- - • ....:';-.;.:..'~' - '; -;;';"';'="';";;';;;;"~"=-';"'=-'-;"-'
250
oo 2 3 4 5 6
Dcncction (mm)
--------------~-_._-- -_.----------------
Fig. 5.4: Load-Deflection Curve for Footing-B2
48
300 ---_._---_._-----_.------_.----------. - -- - - _ _ _ _. - - - - _ - - - _. - - - _.-
250
100
50
---+-- Experimenl
- - -ACI
••• - - "as...... CAN
---.CEB
o ------~-~-- ..---,.o 2 3
Denertion (mm)
4 5 6
lE-Jlrt1_1-4j50mm0,,, Lo,1 3lJ J IOOmm 'o,hol CO"J' ._,~ !
Fig. 5.5: Load-Deflection Curve for Footing-C I
49
350
300
•••••••••••••• ,_e'_'__ ._._._. 0_._._. .
---r--------r-.-'-----~-----,
250
200
~ 150~."••o..l
100
50
oo 2 3 4
----.- Experiment---ACI• ••••• BS
...... CAN
_. _. CEB
5 6
Deflection (mm)
Fig. 5.6: Load-Deflection Curve for Footing-C2
50
350
.----------_.--------------_.------
250
o
300
~200
- ~Experiment'tl
" - -- ACI" 150...l •••• --B5
.......CAN
100 - - _. CEB
50
a 1 2 3 4 5
Deflection (111m)
Fig. 5.7: Load-Deflection Curve for Footing-OJ
51
-_._.~-_._..._-- - ..._ .. _._----------_. ----_ •.•._.
350
-r--'- .._-.--,...---.--~---------"--------,
76543
------------------_.
2
&. & _. - & & &. - - - & & & ••••• &. - _ •• & - - _ ••• & - - - - & - & & -- _. - & & &.
250
oo
~Experiment
--- ACI
300 ------B5
-'-CAN
- - - - CEB
100
50
~ 200
"C
"o...J 150
Deflection (111m)
Fig. 5.8: Load-Deflection Curve for Footing-D2
52
350
300
250
200
--+-- Experiment
- - - ACI•.•••. B5
CAN_. _. CEB
•••••• ••• ••••• 0 ••• ••• •••• _ •••••• --
---------------------
--------~------~-,..-_ .._---~---
~ 150'C
"c...l100
50
oo 2 3
Deflection (111m)
4 5----"
6
lEJml.=.. _-.: __=-~=+r~:;'hmhi~h~'~~I'0"')"1- .:::tII . .,.....jjlOomm ,",Ii" Co",~ - _om -- '00' )
Fig. 5.9: Load-Denection Curve for Footing-E I
53
350
4.5 543.532.521.5
-+- Experiment---ACI
•• ----B5
CAN_. - - CEB
0.5
---------- ----------------_.
•• __ - - - _ •• e ••••• •••••• - - - - _ •• - - - - - - _ ••• - - --
50
oo
200
250
100
150
300
Deflection (nun)
~
~_ ..."..,[ ~ - -_ '.lj'omm .0", lo,s:: - ._-- _. - _. - _._- (wIth tllgher sir. cone)
~ •• • • •• 100mm Initial Cast
) a';' ._-~
Fig. 5.10: Load-Deflection Curve for Footing-E2
S4
~----_.. --~--~----~._'----_..-----
"C••oS
350
300
250
200
150
100
50.
--+-- Experiment
---ACI
------88.. CAN
----CE8
2 3 4 5 6 7
Dctlection (mm)
00 •• 1 Soc ~ lJ~[~
.. J. 1_ j50mm 0"., Lo,~ - -.. "-.1. 1-- .1 1-- ( ,Ih higher sir I;onr.)
.. ... IOOmm Initiol Cost
J .... ..'lQ.O I
Fig. 5.11: Load-Deflection Curve for Footing-FI
55
-----_.- ....._-------------
350
~.--r--.-._-.-~--.~---~---~--~
----------------------
54.543.532.52
.---_.- - _ .. -_ .... - ... -_ ... --_ .. --------_.--_.--_.-._-_._-
1.5
---+---- Experiment
---ACI
--- •.. B5.- ..•..... CAN_. _. CEB
100
150
200
300
250
'C
"=•...l
Dcl1cction (mm)-----_._._----- --- - ---------------------
Compressive Steel
~~--_=-14(2;'lhmhi~h~r~~rCOn(.)
j100mm Initiol Cost
~_-_--~OQ...._-----~--j .
Dowel Bor
Fig. 5.12: Load-Deflection Curve for Footing-F2
250
-----,-----_ .._-------------------
200
150
100
50
oo
-+-Al
--+-'"
2 4 6 a '0
Fig. 5.13:
Deflection (mm)
Comparison of Load-Deflection Curves of Footing-AI and A2
57
'00
3SO
.,. -. - -- _ ..._._------_.- ---- .-_ ... ~-_ ..
----.- -----_ .. _---,.--- ._-_ .._--...----- •.....- ------~-_._---.-----,
300
2SO
,so
100
so
oo
-+-Bl
-+-82
2 3 , 5 6 7 ,
Fig. 5.14:
Denection (mm)-_.--------, .... - -_._---._-----_.-_._-------
Comparison of Load-Deflecti?n Curves of Footing-81 and 82
58
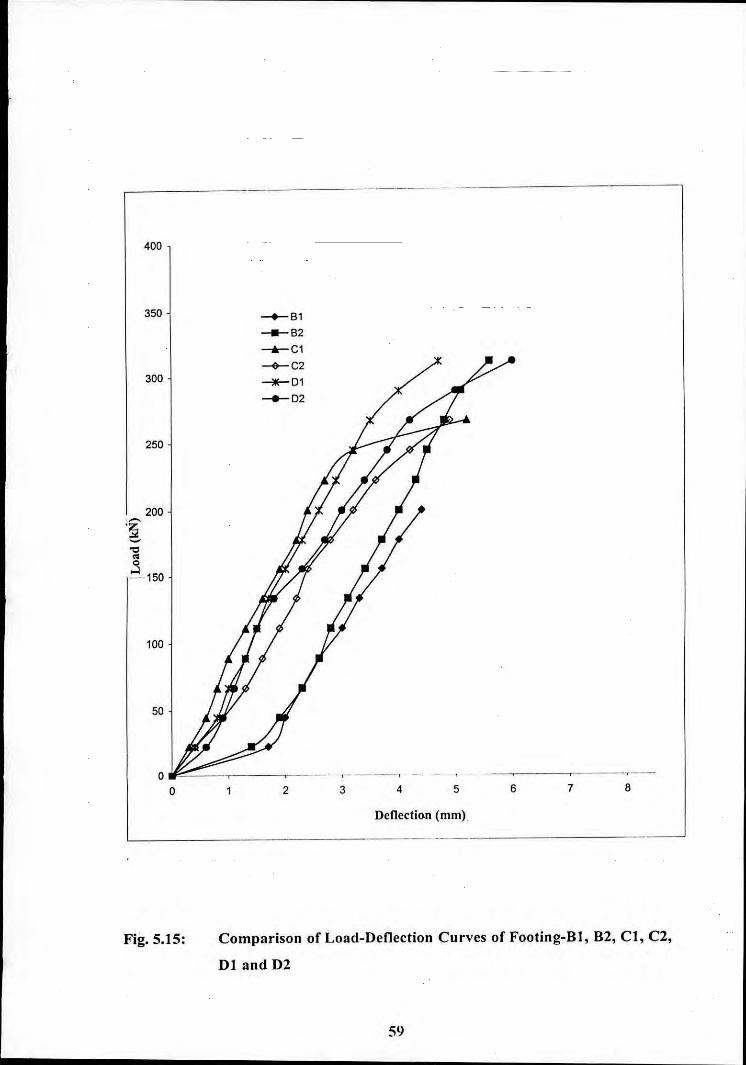
400
--_ .._-----~-_._----_.~._.
350 -+-B1__ B2
-.-Cl-<>-C2
300 -JlE- D1__ D2
250
200:£C."".,...l.. - 150
100
50
oo 2 3 4 5 6 7 8
Fig. 5.15:
Deneetion (mm).
---------_ .._-------- ._._---_._---------_. __.-
Comparison of Load-Oenection Curves of Footing-BI, B2, CI, C2,
01 and 02
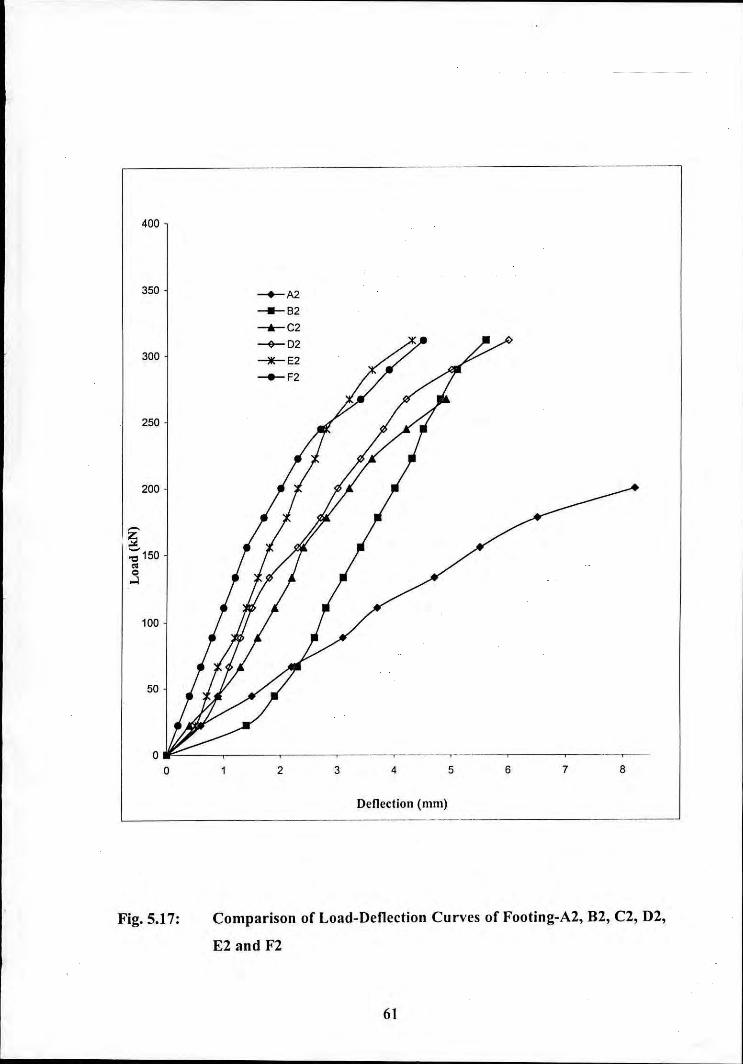
S9
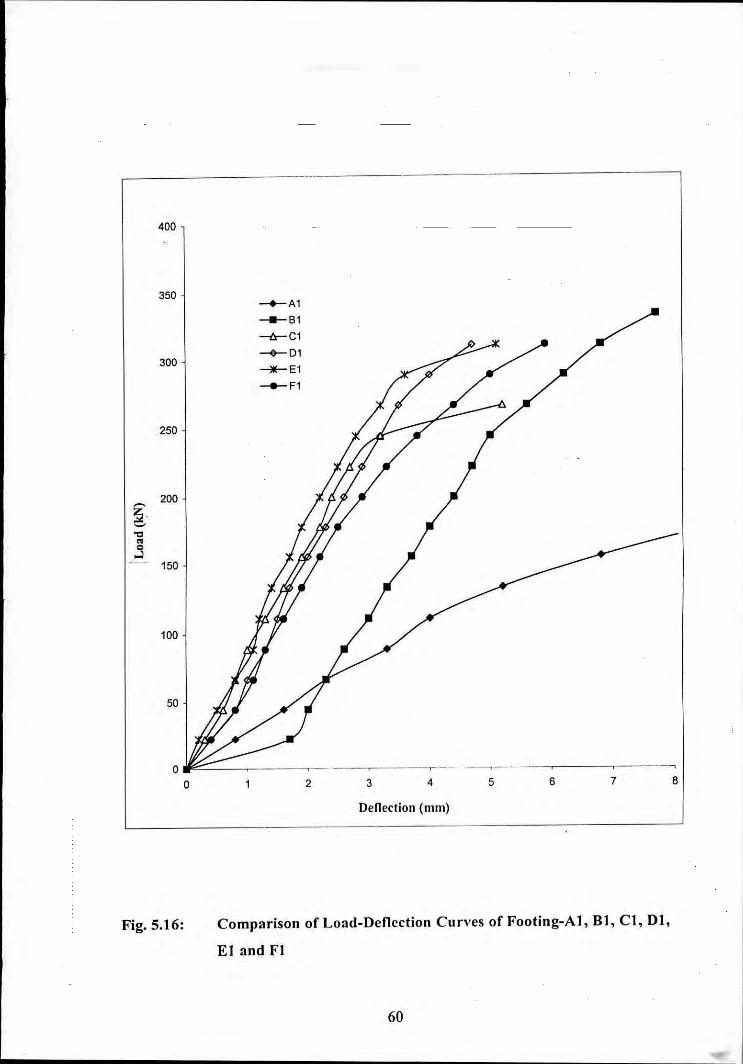
---------_._--------------------
400
350-+-A1__ 81
--i>-C1--<r-D1
300 -llE-E1-+-F1
250
------,--_. ----.----- ..._- -_._,-~-----r---~--------875 6432
oo
50
100
200
~-~"0
"0...l150
Deflection (mm)--~--_._---------------------
Fig. 5.16: Comparison of Load-Denection Curves of Footing-A1, BI, C1, 01,
El and FI
60
350 ---+-A2_____82
-.-C2~D2
300__ E2
-+-F2
250
400
200
~'tl 150"o..J
100
50
oo 2 3 4 5
Dcllcction (mOl)
6 7 8
Fig. 5.17:
--------------------~--------
Comparison of Load-Deflection Curves of Footing-AZ, BZ, CZ, DZ,
EZ and FZ
61
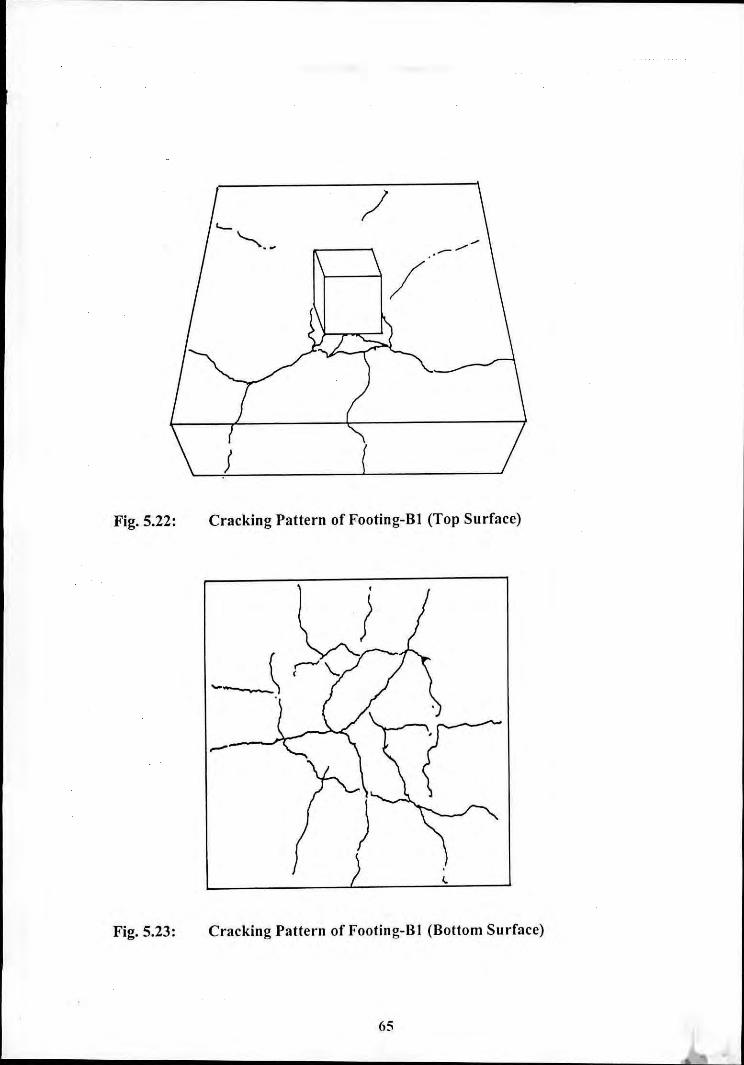
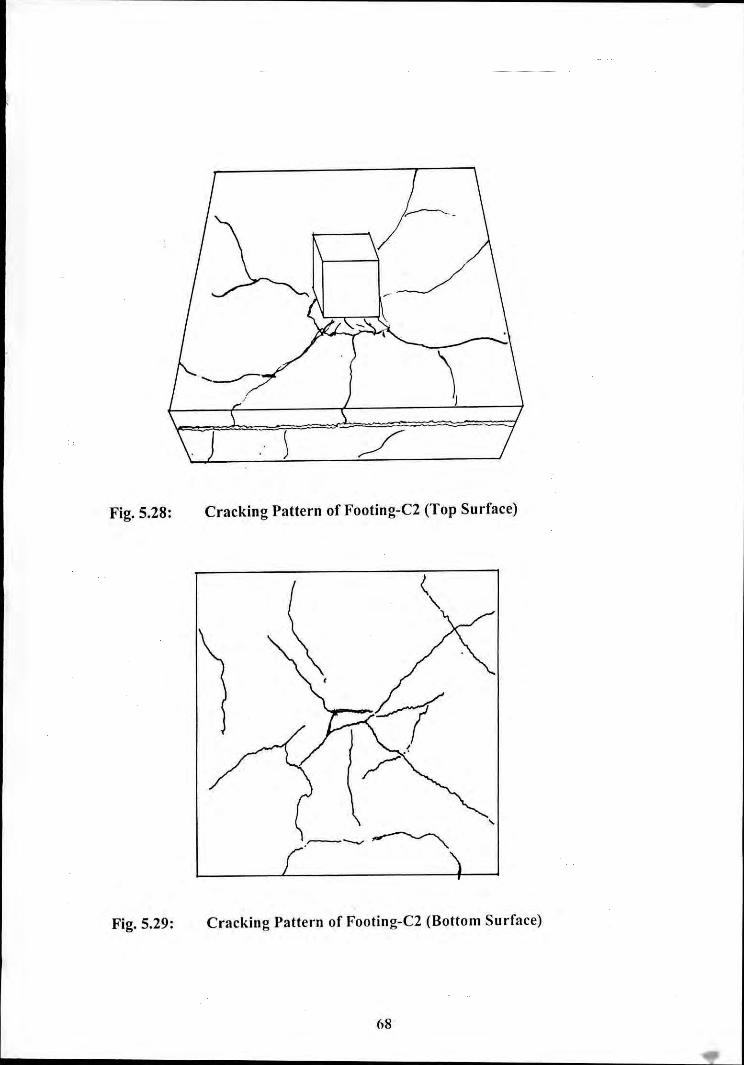
5.8 Cracking Pattern
Development of cracks on the top surface of footings were observed carefully andmonitored at various load increments. Cracking on bottom surface of footings wereobserved at the end of the tests. Cracks also developed at the edges of the samplesthat were cast in a single go i.e. footings without overlay (A I, A2, B], B2) as well asthe footings using overlay with dowel bars (D I, D2, Fl, F2). In casc of footings withoverlay but without dowel bars, thc overlay portion gol separated during the laterstage of loading. A large crack developed at the interface of overlay and old concretefor these samples. Crack lines from observation are presented on Figures 5.18 to 5.33.Most of the footings failed in a pure punching failure mode. Top surface cracks onfootings without overlay were relatively less than that on the overlay surface. Crackon overlay surface were more visible. For footings without overlay, large cracksdeveloped at the area of punching while the footings with overlay had relatively lesscracks.
5.9 Comparison of Results with different Code of Provisions
A comparison of the experimental failure loads and punching shear strengthspredicted by various Codes of provision (ACI 3 I8-95, BS8l] 0-85, CAN3-A23.3-M84 and CEB-FIP) are summarized in Table: 5.4. Test results for all the samples arehigher than the code predicted results, except the samples C I & C2. These twosamples have failure loads less than Canadian & European code, but higher thanothers. Test results of the sample CI & C2 seem to be not rational with other samples,which could happen due to the construction problem. Canadian code predicted resultsare closer to the experimental results for most of the cases, but other code predictionresults are quiet conservative with experimental results. Among those, ACI code isthe most conservative.
62
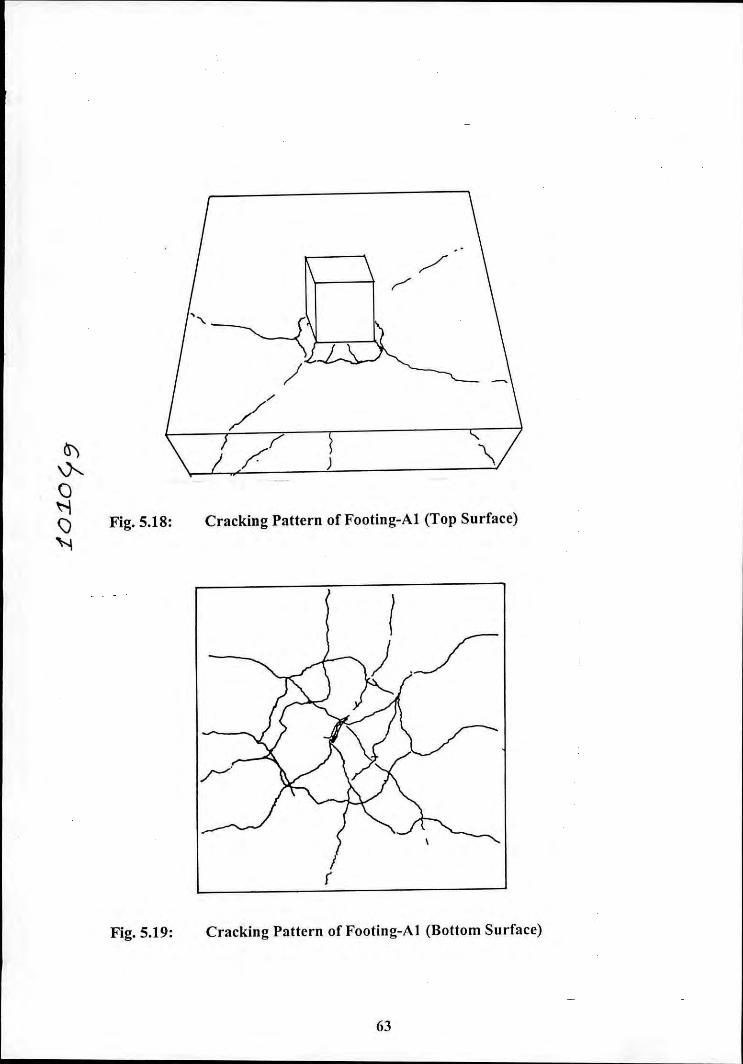
~
'"o~\) Fig. 5.18:
"'I
Fig. 5.19:
Cracking Pattern of Footing-AI (Top Surface)
I(
Cracking Pattern of Footing-AI (Bottom Surface)
63
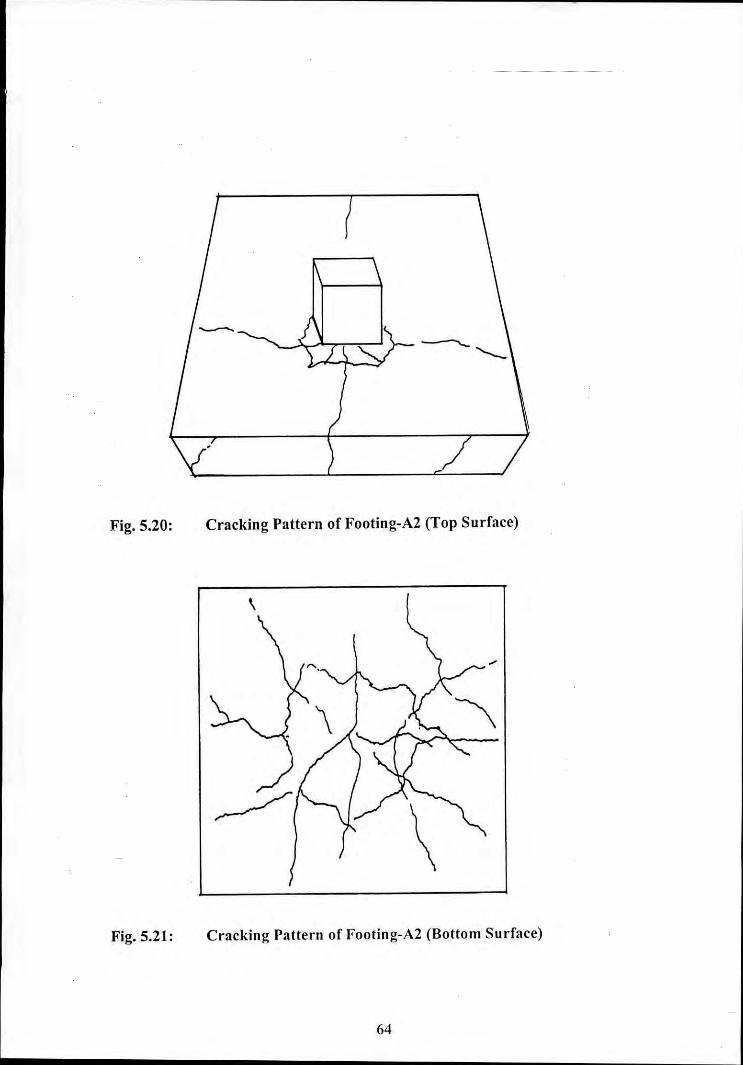
Fig. 5.20: Cracking Pattern of Footing-A2 (Top Surface)
Fig. 5.21: Cracking Pattern of Footing-A2 (Bottom Surface)
/
Fig. 5.22:
Fig. 5.23:
Cracking Pattern of Footing-BI (Top Surface)
Cracking Pattern of Footing-BI (Bottom Surface)
65
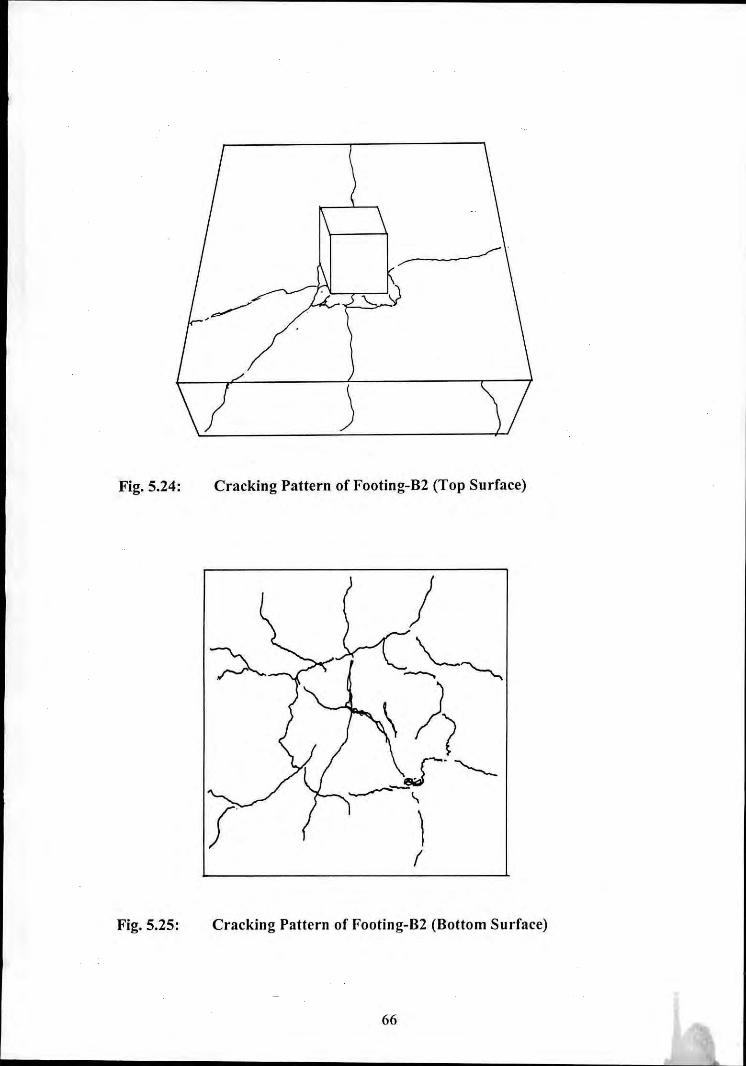
Fig. 5.24:
Fig. 5.25:
Cracking Pattern of Footing-B2 (Top Surface)
Cracking Pattern of Footing-B2 (Bottom Surface)
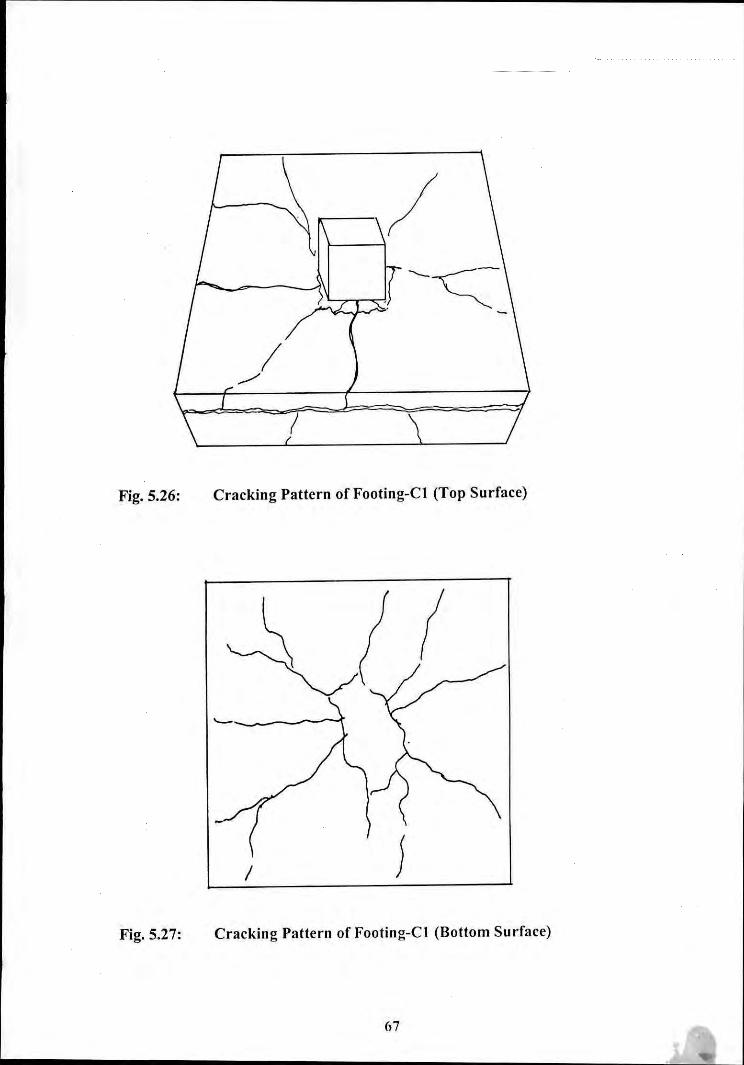
Fig. 5.26:
I.-/
!
Cracking Pattern of Footing-CI (Top Surface)
/j
Fig. 5.27: Cracking Pattern of Footing-Cl (Bottom Surface)
67
~J
Fig. 5.28:
Fig. 5.29:
Cracking Pattern of Footing-C2 (Top Surface)
Cracking Pattern of Footing-C2 (Bottom Surface)
68
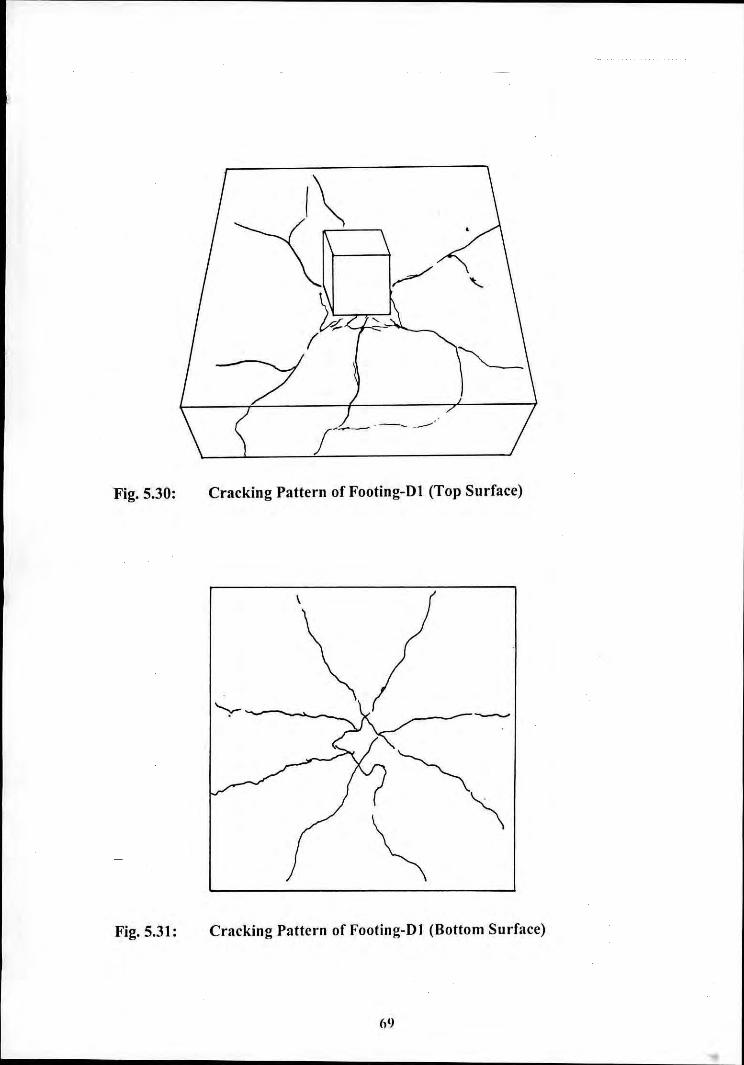
Fig. 5.30:
Fig. 5.31:
Cracking Pattern of Footing-Ol (Top Surface)
Cracking Pattcrn of Footing-OJ (Bottom Surfacc)
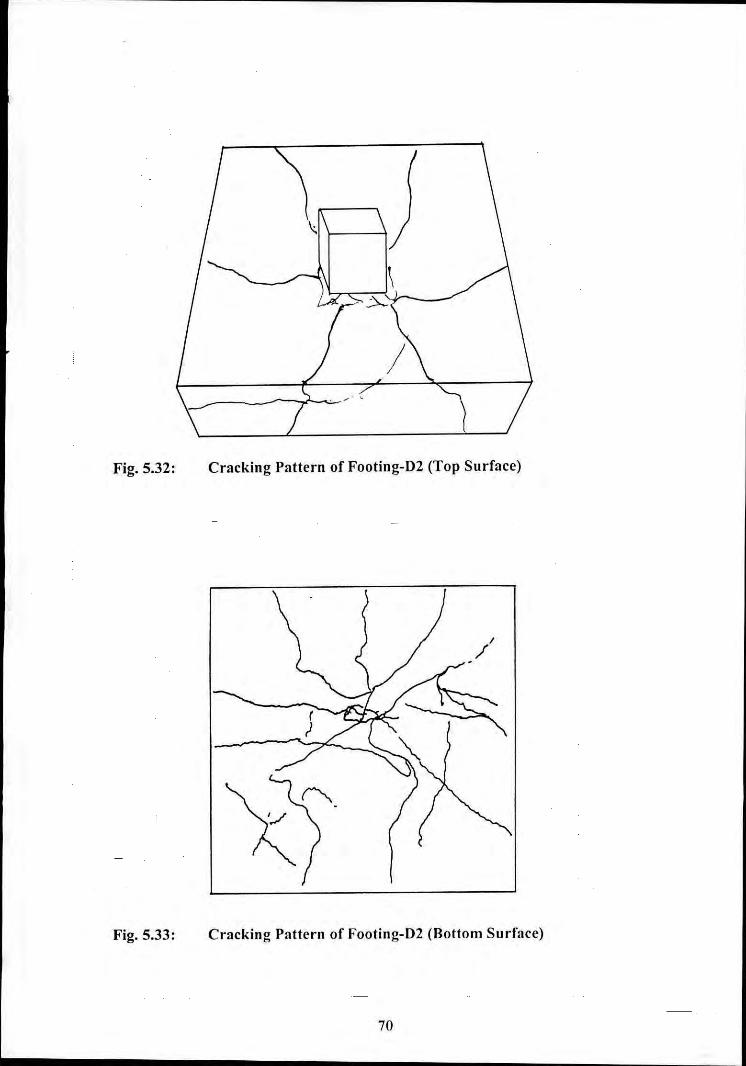
Fig. 5.32:
Fig. 5.33:
Cracking Pattern of Footing-D2 (Top Surface)
Cracking Pattern of Footing-D2 (Bottom Surface)
70
CHAPTER SIX
CONCLUSIONS AND RECOMMENDATIONS
6.1 Conclusions
The experimental results obtained from the test of different model footings providedinformation of the effectiveness of overlay on footings as well as the contribution ofdowel bar and compressive reinforcement. Footings were subjected to concentratedloading and all the footings failed in a punching shear mode. Punching shear capacityincreased significantly with the increase of footing depth with overlay. Ultimate loadcapacity of all the footings with overlay was higher than that of the footings withoutoverlay and having less thickncss. The punching capacity of footings after thcapplication of overlay nearly matched with the capacity of monolithically cast footingsof similar total thickness. This providcs for the effectiveness of overlay. Additional~einforcement at compressive zone could not provide any additional punching shearcapacity, but 10ad-deDcction curve for footings with compressive rcinforccmcnt showedbetter unifomlity in comparison to thosc without comprcssivc stccl. Dowcl barscontributed positivcly in bonding betwccn ovcrlay and old concretc.
6.2 Recommendations for the FutUl'e Research
In this study, increasing depth with overlay was used to improve the punching shearcapacity of retrofitted footings. Dowel bars and additional reinforcement at compressionarea were used for some of the samples with different combinations.
Main objective of this study was to improve punching capacity of footings. For futurestudy, experiments with increasing footing area may be incorporated.
In the present experiments, columns were cast at the time of overlay rather at thc timeof initial cast. For more practicability, casting of columns with initial concrete may befollowed for future experiments. Moreover, dowels can be used for bonding betweencolumns and overlay concrete.
Overlay for this test was cast after 45days of initial cast. For practicability this durationmay be extended for substantial maturity of old concrete.
71
References
[I] Seraj, S.M. and Alam, A.K.MJ.(l997)"Effect of Edge Restraint on Punching Behavior of Slabs," in Current Trends inConcrete Engineering and Technology, Proceedings of CONECT'97, the FifthInternational Conference on Concrete Engineering and Technology held inKuala Lumpur, Malaysia, 5-7 May 1997 (edited by H.B. Mahmud, University ofMalaya, Kuala Lumpur, Malaysia,1997) pp.281-290.
[2] Seraj, S.M. and Mostafa, M.G. (1997)"Punching Behavior of Footings on Sand," in Dejormation and ProgressiveFailure in Geomechanics, Proceedings of IS-NAGOYA '97, the InternationalSymposium on Deformation and Progressive Failure in Geomechanics, October4-7, 1997, Nagoya, Japan (edited by A Asaoka, T. Adachi and F. Oka,Pergamon Press, Oxford, England, 1997) pp.775-780.
[3] Alam, AK.MJ.(1997)"Punching Shear Behavior of Reinforced Concrete Slabs" M. Sc. Engineering.Thesis, BUET, 1997.
[4] Mostafa, M.G. (1997)"Punching Behavior of Footings" M. Engineering. Thesis, BUET, 1997.
[5] Haque, S.M. and Sultana, A (1997)"Punching Behavior of Footings on Clay" B. Sc. Engineering. Thesis, BUET,1997.
[6] Gosh, A. (2000)"Effect of Overlay on Punching Shear Capacity of Footings" B. Sc. Engineering.Thesis, BUET, 2000.
[7] ACI 318-83 (1995)"Building Code Requirements for Reinforced Concrete," (ACI 318-83)American Concrete Institute, Detroit.
[8] Nilson, AH. and Winter, G."Design of Concrete Structures (Tenth Edition)", McGRAW-HILLINTERNATIONAL EDITIONS (Civil Engineering series)
72

APPENDIX A
Cnlclllnlioll of PIIIIchin If Sllear Strengtll according to differellt Code of pre dicti 011
73
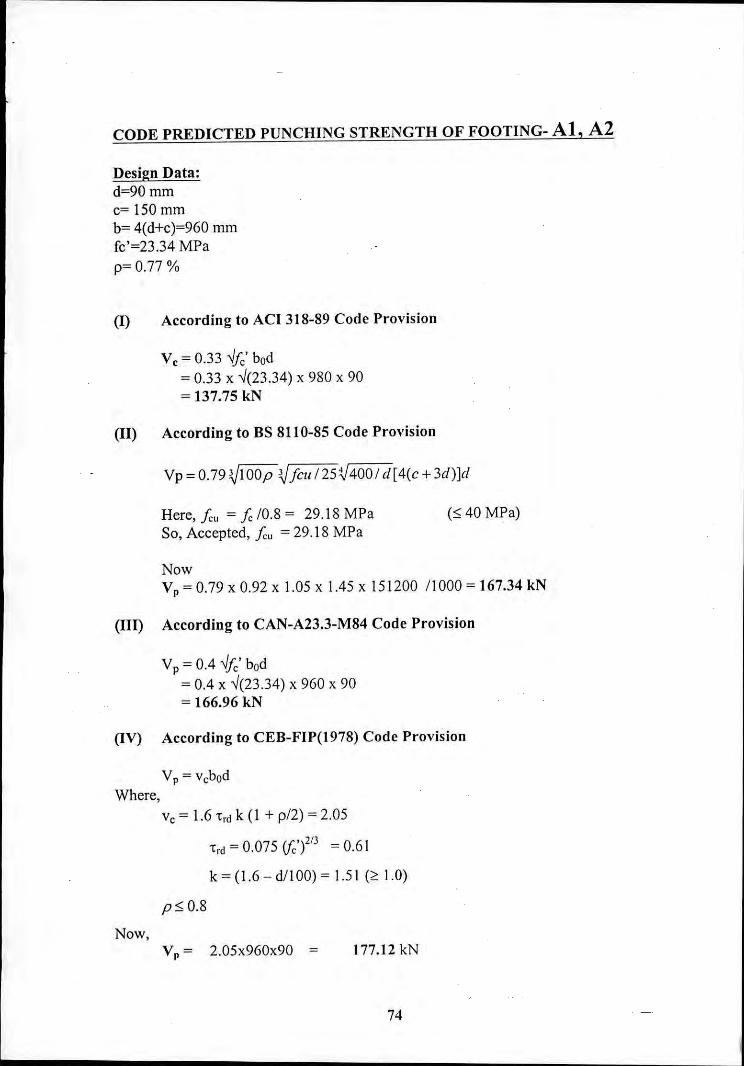
CODE PREDICTED PUNCHING STRENGTH OF FOOTING- AI, A2
Design Data:d=90mmc= ISO mmb= 4(d+c)=960 mmfc'=23.34 MPap= 0.77 %
(I) According to ACI 318-89 Code Provision
vc = 0.33 ..Jfc' bod= 0.33 x ..J(23.34) x 980 x 90= 137.75 kN
(II) According to BS 8110-85 Code Provision
Vp = 0.79 VI OOp V fCII I 25',14001 d[ 4(c + 3d)]<1
Here, fcu = fc 10.8 = 29.18 MPaSo, Accepted, fcu = 29.18 MPa
($ 40 MPa)
NowVp = 0.79 x 0.92 x 1.05 x 1.45 x 151200 11000 = 167.34 kN
(III) According to CAN-A23.3-M84 Code Provision
v p = 0.4 ..Jfc' bod= 0.4 x ..J(23.34) x 960 x 90= 166.96 kN
(IV) According to CEB-FIP(I978) Code Provision
Vp = vcbodWhere,
vc = 1.6 ',d k (I + p/2) = 2.05
',d = 0.075 (!c,)21) = 0.61
k = (1.6 - d1100) = 1.51 (~ 1.0)
p$0.8
Now,Vp = 2.05x960x90 177.12kN
74
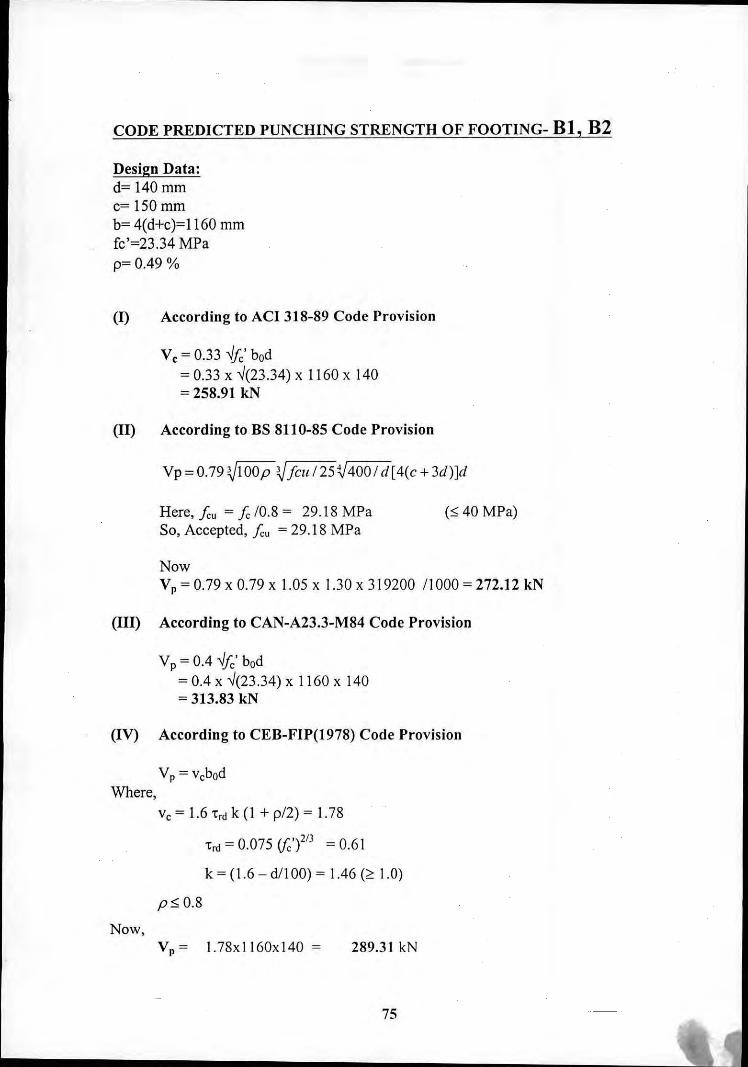
CODE PREDICTED PUNCHING STRENGTH OF FOOTlNG- BI, B2
Design Data:d= 140 mmc= 150 mmb= 4(d+c)=1160 mmfc'=23.34 MPap=0.49 %
(I) According to AC1318-89 Codc Provision
vc= 0.33 'lfc' bod= 0.33 x ;1(23.34) x 1160 x 140= 258.91 kN
(II) According to BS 8110-85 Code Provision
Vp = 0.79 V100p VfClI 125',)4001 d[ 4(c + 3d)]d
Here, leu = Ie 10.8 = 29.18 MPaSo, Accepted, leu = 29.18 MPa
(~40 MPa)
NowVI' =0.79 x 0.79 x 1.05 x 1.30 x 319200/1000 =272.12 kN
(III) According to CAN-A23.3-M84 Code Provision
Vp = 0.4 'lfc' bod= 0.4 x ;1(23.34) x 1160 x 140=313.83 kN
(IV) According to CEB-FIP(1978) Code Provision
VI' = vcbodWhere,
Vc = 1.6 "t,d k (l + p/2) = 1.78
"t,d = 0.075 lfcfJ = 0.6 I
k = (1.6 - d/100) = 1.46 (~ 1.0)
p~ 0.8
Now,VI' = 1.78xl160xl40 = 289.31 kN
75
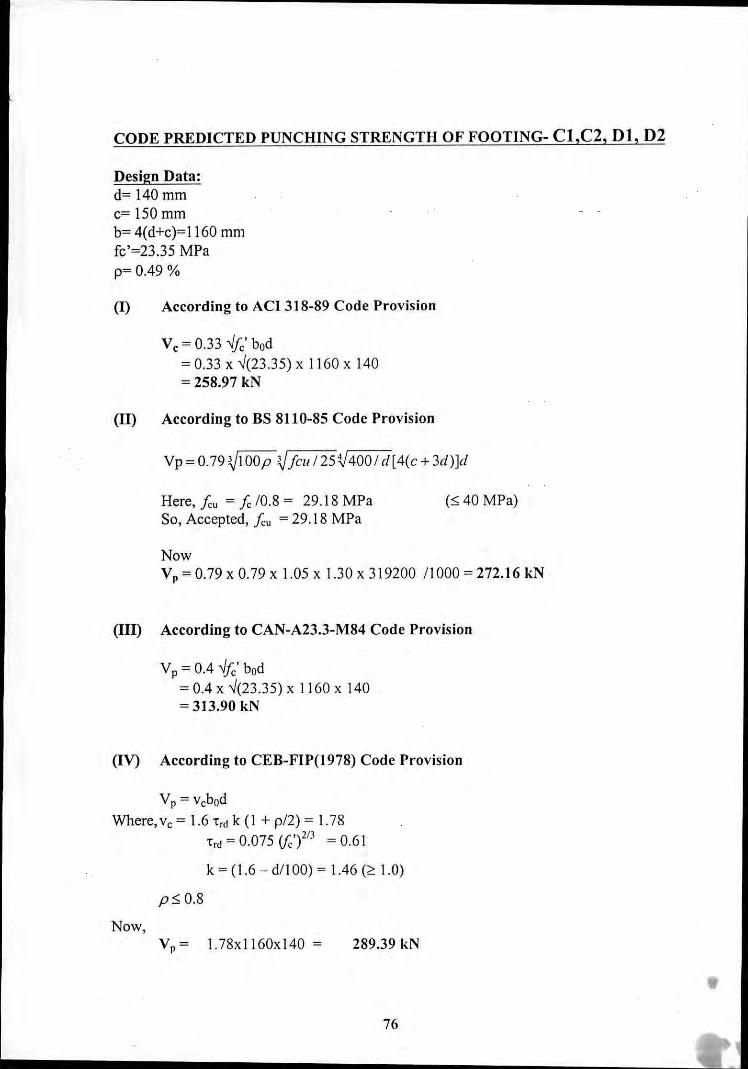
CODE PREDICTED PUNCHING STRENGTH OF FOOTING- C1,C2, 01, 02
Design Data:d= 140 mmc= 150 mmb= 4(d+c)=1160 mmfc'=23.35 MPap= 0.49 %
(I) According to ACI 318-89 Code Provision
vc = 0.33 ../fc' bod= 0.33 x ../(23.35) x 1160 x 140= 258.97 kN
(II) According to BS 8110-85 Code Provision
Vp = 0.79 '.}1OOp '.}JCII I 25;,)4001 d[ 4(c + 3d)]d
Here, fcu = fc 10.8 = 29.18 MPaSo, Accepted, fcu = 29.18 MPa
(:S 40 MPa)
NowVp = 0.79 x 0.79 x 1.05 x 1.30 x 319200 /1000 = 272.16 kN
(III) According to CAN-A23.3-M84 Code Provision
v p = 0.4 'lfc' bod= 0.4 x ../(23.35) x 1160 x 140= 313.90 kN
(IV) According to CEB-FIP(1978) Code Provision
Vp = vcbodWhere,vc = 1.6 TrJ k (I + p/2) = 1.78
TrJ = 0.075 (/c')2/] = 0.61
k = (1.6 - d/lOO) = 1.46 (21.0)
p:S 0.8
Now,Vp = 1.78x1160xl40 = 289.39 kN
76
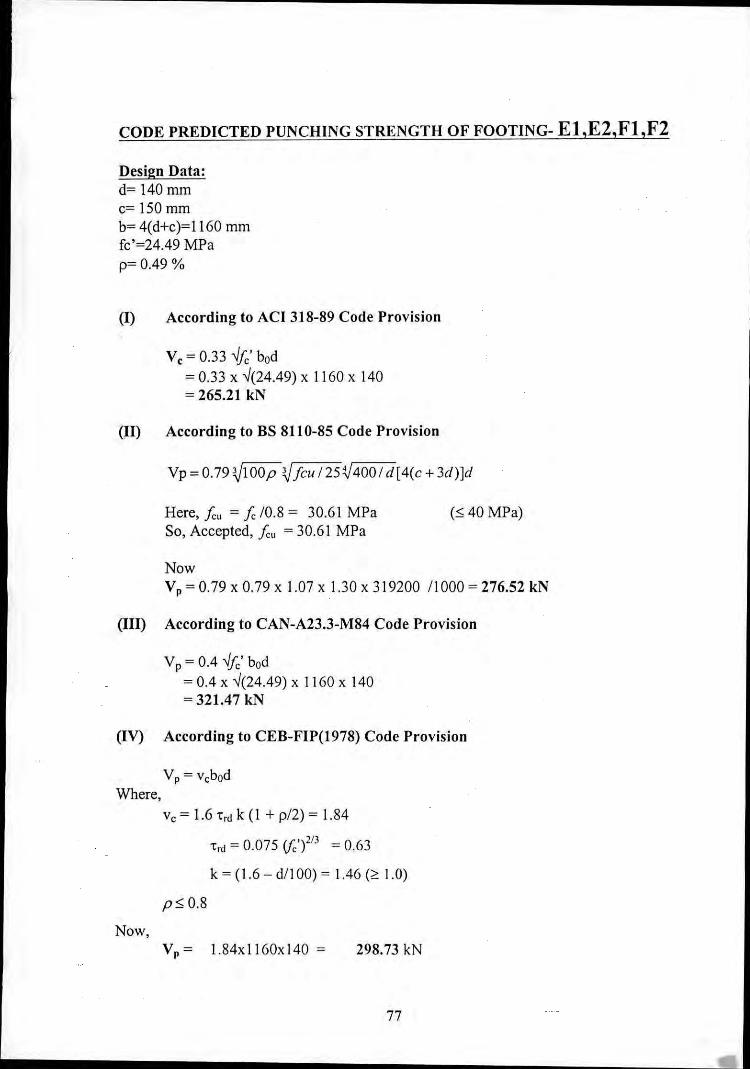
CODE PREDICTED PUNCHING STRENGTH OF FOOTING- El ,E2,Fl ,F2
Design Data:d= 140 mmc= 150 mmb= 4(d+c)=1160 mmfc'=24.49 MPap= 0.49 %
(I) According to ACI 318-89 Code Provision
vc = 0.33 'lfc' bod= 0.33 x ..J(24.49) x 1160 x 140= 265.21 kN
(II) According to BS 8110-85 Code Provision
Vp = 0.79 VI00p VjcII /25;J4001 d[4(c + 3d)]d
Here,!cu = !c 10.8 = 30.61 MPaSo, Accepted,!cu = 30.61 MPa
(S 40 MPa)
NowVp = 0.79 x 0.79 x 1.07 x 1.30 x 319200 II 000 = 276.52 kN
(III) According to CAN-A23.3-M84 Code Provision
Vp = 0.4 ..J.fc' bod= 0.4 x ..J(24.49) x 1160 x 140= 321.47 kN
(IV) According to CEB-FIP(1978) Code Provision
Vp = vcbodWhere,
Vc = 1.6 T,d k (I + p/2) = 1.84
T,d = 0.075 (fc')2/J = 0.63
k = (1.6 - dll 00) = 1.46 (~ 1.0)
pSO.8
Now,Vp = 1.84x1160x140 = 298.73 kN
77

APPENDIX B
Crlil/(/er Strellgth of COlicrete 011the dar of Testillg of Footillgs
78
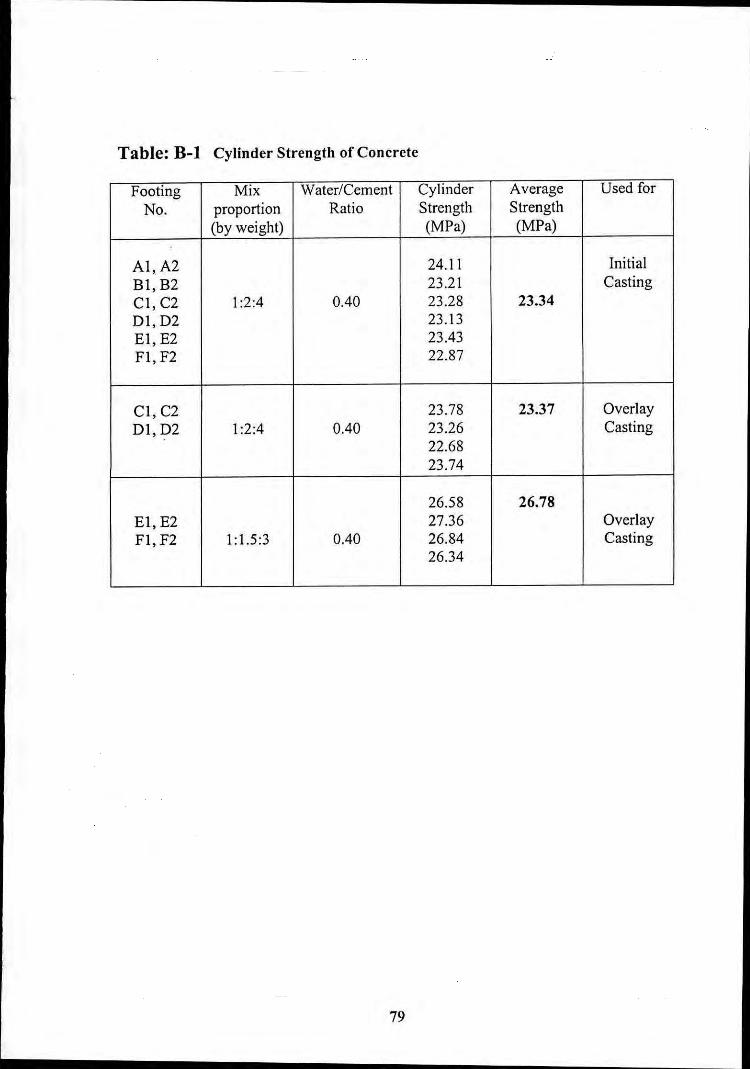
Table: B-1 Cylinder Strength of Concrete
Footing Mix Water/Cement Cylinder Average Used forNo. proportion Ratio Strength Strength
(by weight) (MPa) (MPa)
AI, A2 24.11 InitialBI, B2 23.21 CastingCI, C2 1:2:4 0.40 23.28 23.34DI, D2 23.13EI, E2 23.43FI, F2 22.87
CI, C2 23.78 23.37 OverlayDI, D2 1:2:4 0.40 23.26 Casting
22.6823.74
26.58 26.78EI, E2 27.36 OverlayFI, F2 1:1.5:3 0.40 26.84 Casting
26.34
79

80
APPENDIX C
Load-Deflection Table {rom Test results
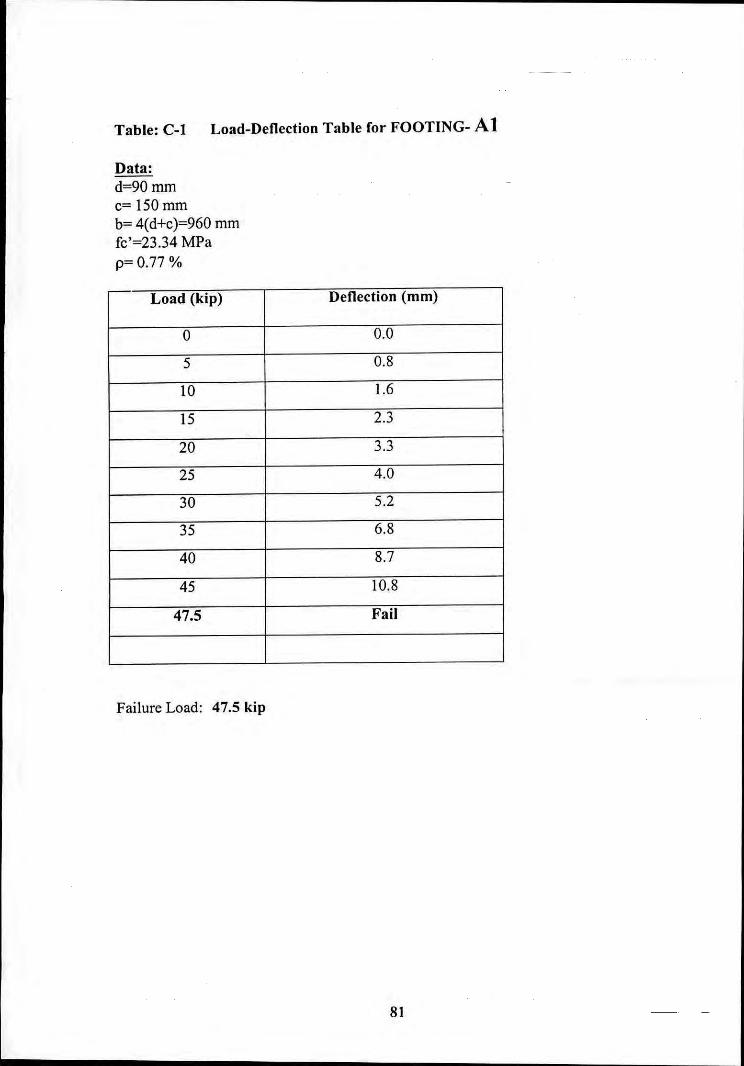
Table: C-l Load-Deflection Table for FOOTlNG- At
Data:d=90mmc= 150 mmb= 4(d+c)=960 mmfc'=23.34 MPap=O.77 %
Load (kip) Deflection (mm)
0 0.0
5 0.8
10 1.6
15 2.3
20 3.3
25 4.0
30 5.2
35 6.8
40 8.7
45 10.8
47.5 Fail
Failure Load: 47.5 kip
8\
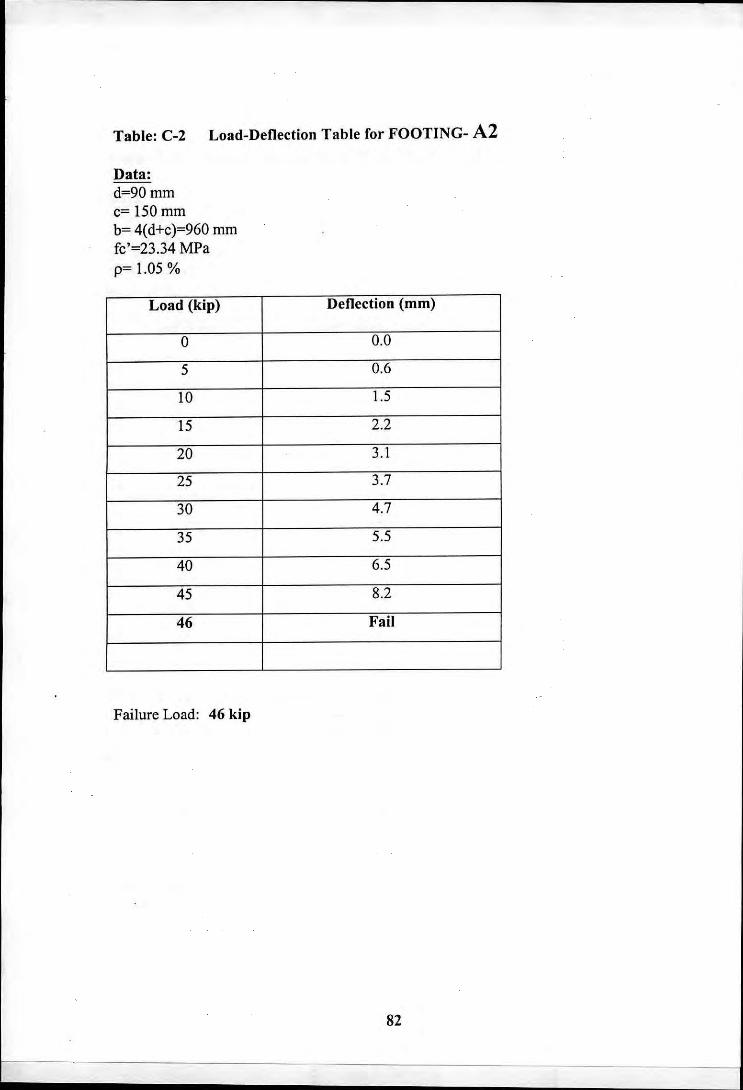
Table: C-2 Load-Deflection Table for FOOTlNG- A2
Data:d=90mmc= 150 mmb= 4(d+c)=960 mmfc'=23.34 MPap= 1.05 %
Load (kip) Deflection (mm)
0 0.0
5 0.6
10 1.5
15 2.2
20 3.1
25 3.7
30 4.7
35 5.5
40 6.5
45 8.2
46 Fail
Failure Load: 46 kip
82
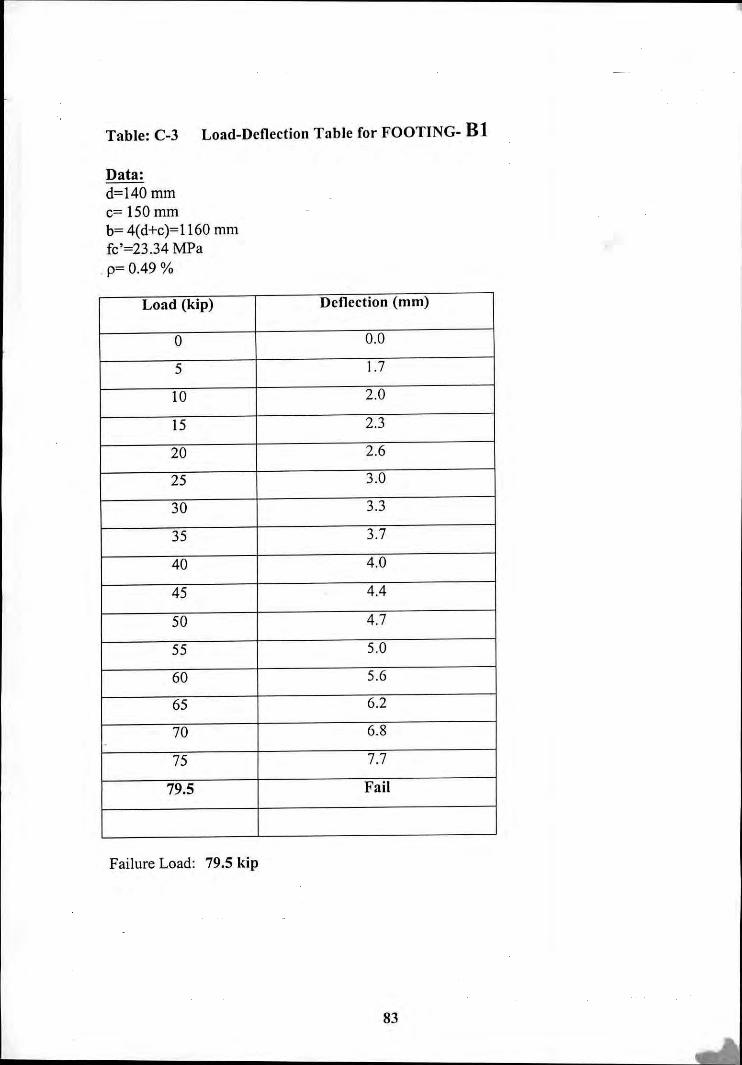
Table: C-3 Load-Deflection Table for FOOTING- B 1
Data:d=140 mmc= 150 mmb= 4(d+c)=IIGO mmfc'=23.34 MPap= 0.49 %
Load (kip) Deflection (mm)
0 0.0
5 1.7
10 2.0
15 2.3
20 2.G
25 3.0
30 3.3
35 3.7
40 4.0
45 4.4
50 4.7
55 5.0
GO 5.6
65 6.2
70 6.8
75 7.7
79.5 Fail
Failure Load: 79.5 kip
83
Table: C-4 Load-Deflection Table for FOOTING- 82
Data:d=140 mmc= 150 mmb= 4(d+c)=1160 mmfc'=23.34 MPap=0.67 %
Load (kip) Deflection (mm)
0 0.0
5 1.4
10 1.9
15 2.3
20 2.6
25 2.8
30 3.1
35 3.4
40 3.7
45 4.0
50 4.3
55 4.5
60 4.8
65 5.1
70 5.6
73 Fail
Failure Load: 73.0 kip
84
Table: C-5 Load-Deflection Table for FOOTlNG- Cl
Data:d=140 mmc= 150 mmb= 4(d+c)=1160 mm. fc'=23.35 MPap= 0.49 %
Load (kip) Deflection (mm)
0 0.0
5 0.3
10 0.6
15 0.8
20 1.0
25 1.3
30 1.6
35 1.9
40 2.2
45 2.4
50 2.7
55 3.2
60 5.2
65 Fail
Failure Load: 65.0 kip
85
Table: C-6 Load-Deflection Table for FOOTING- C2
Data:d=140 mmc= 150 mmb= 4(d+c)=1160 111111
fc'=23.35 MPap= 0.67 %
Load (kip) Deflection (mm)
0 0.0
5 0.4
10 0.9
15 1.3
20 1.6
25 1.9
30 2.2
35 2.4
40 2.8
45 3.2
50 3.6
55 4.2
60 4.9
63 Fail
Failure Load: 63.0 kip
86
Table: C-7 Load-Deflection Table for FOOTING- Dl
Data:d=140 mmc= 150 mmb= 4(d+c)=1160 mmfc'=23.35 MPap= 0.49 %
Load (kip) Deflection (mm)
0 0.0
5 0.4
10 0.8
15 1.0
20 1.3
25 1.5
30 1.7
35 2.0
40 2.3
45 2.6
50 2.9
55 3.2
60 3.5
65 4.0
70 4.7
72 Fail
Failure Load: 72.0 kip
87
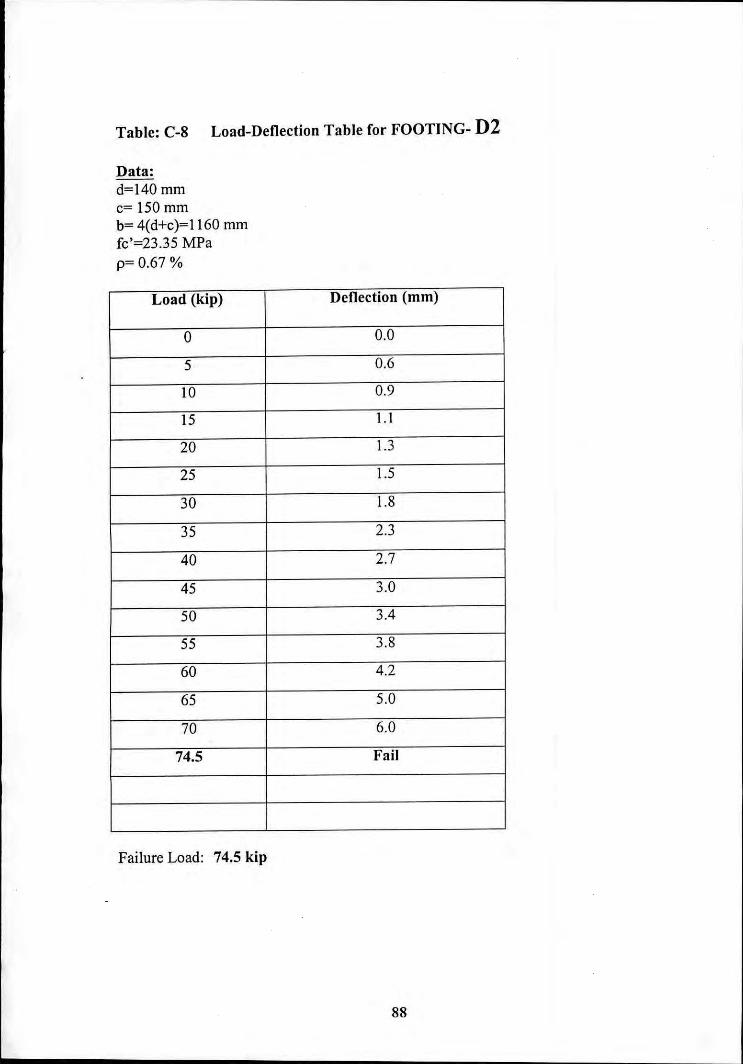
Table: C-8 Load-Deflection Table for FOOTING- D2
Data:d=140 mmc= 150 mmb= 4(d+c)=1160 mmfc'=23.35 MPap= 0.67 %
Load (kip) Deflection (mm)
0 0.0
5 0.6
10 0.9
15 1.1
20 1.3
25 I.5
30 1.8
35 2.3
40 2.7
45 3.0
50 3.4
55 3.8
60 4.2
65 5.0
70 6.0
74.5 Fail
Failure Load: 74.5 kip
88
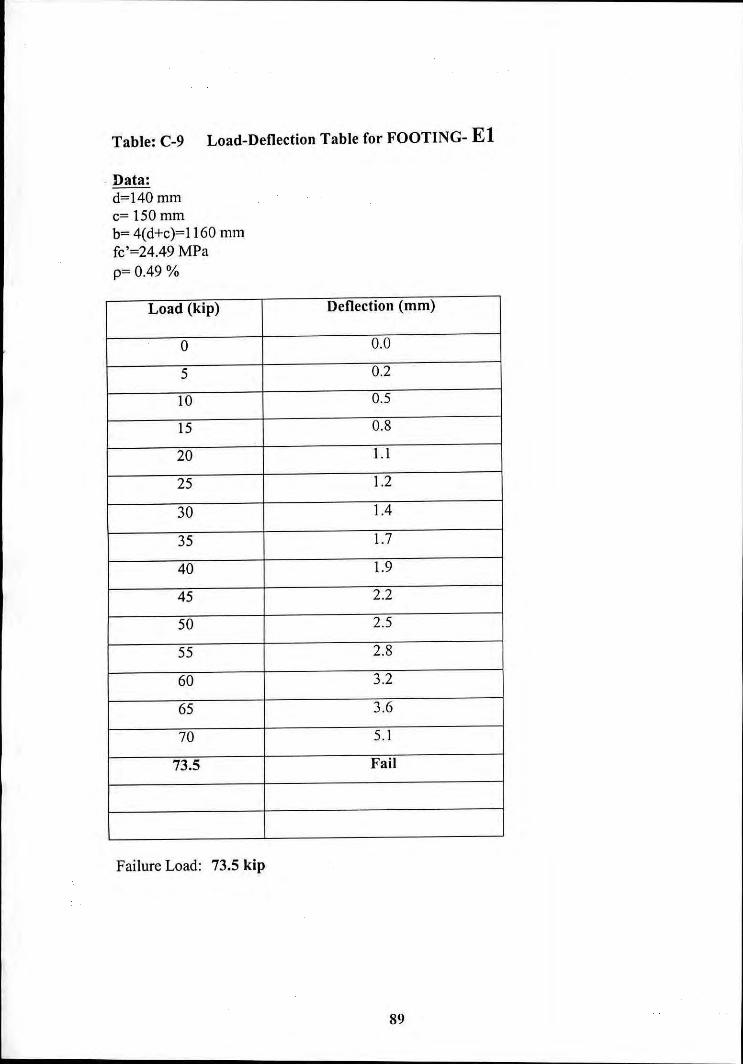
Table: C-9 Load-Deflection Table for FOOTING- El
. Data:d=140 mmc= 150 mmb= 4(d+c)=1160 mmfc'=24.49 MPap= 0.49 %
Load (kip) Deflection (mm)
0 0.0
5 0.2
10 0.5
IS 0.8
20 1.1
25 1.2
30 1.4
35 1.7
40 1.9
45 2.2
50 2.5
55 2.8
60 3.2
65 3.6
70 5.1
73.5 Fail
Failure Load: 73.5 kip
89
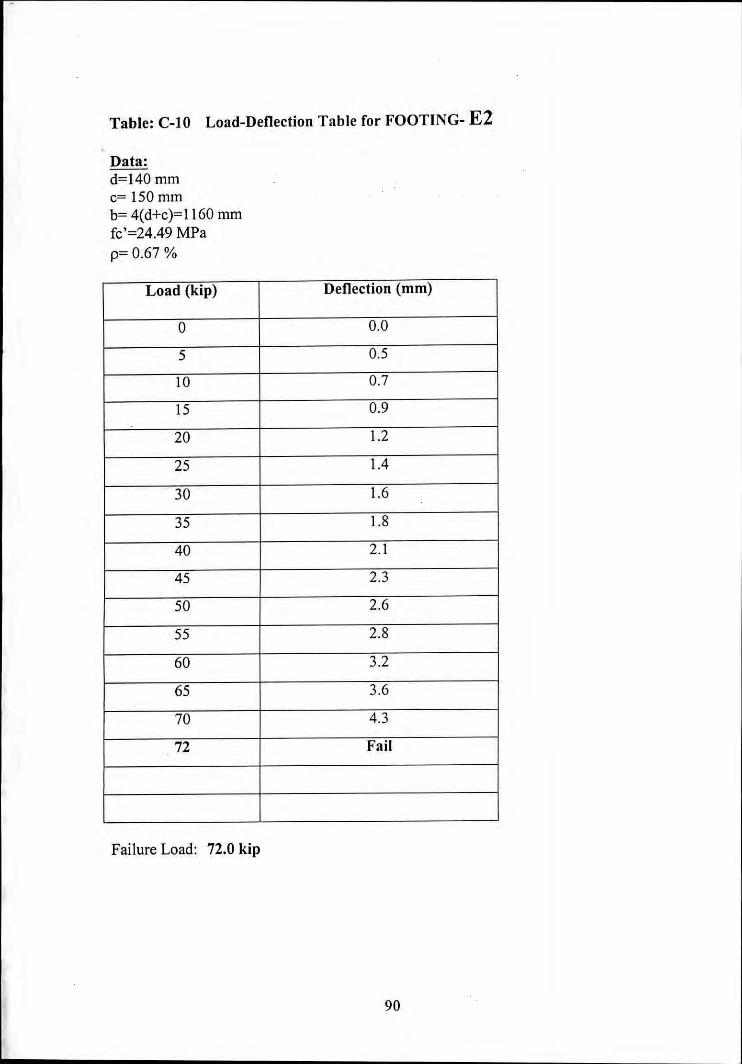
Table: C-IO Load-Deflection Table for FOOTlNG- E2
Data:d=140 mmc= 150 mmb= 4(d+c)=1160 mmfc'=24.49 MPap= 0.67 %
Load (kip) Deflection (mm)
0 0.0
5 0.5
10 0.7
15 0.9
20 1.2
25 1.4
30 1.6
35 1.8
40 2.1
45 2.3
50 2.6
55 2.8
60 3.2
65 3.6
70 4.3
72 Fail
Failure Load: 72.0 kip
90
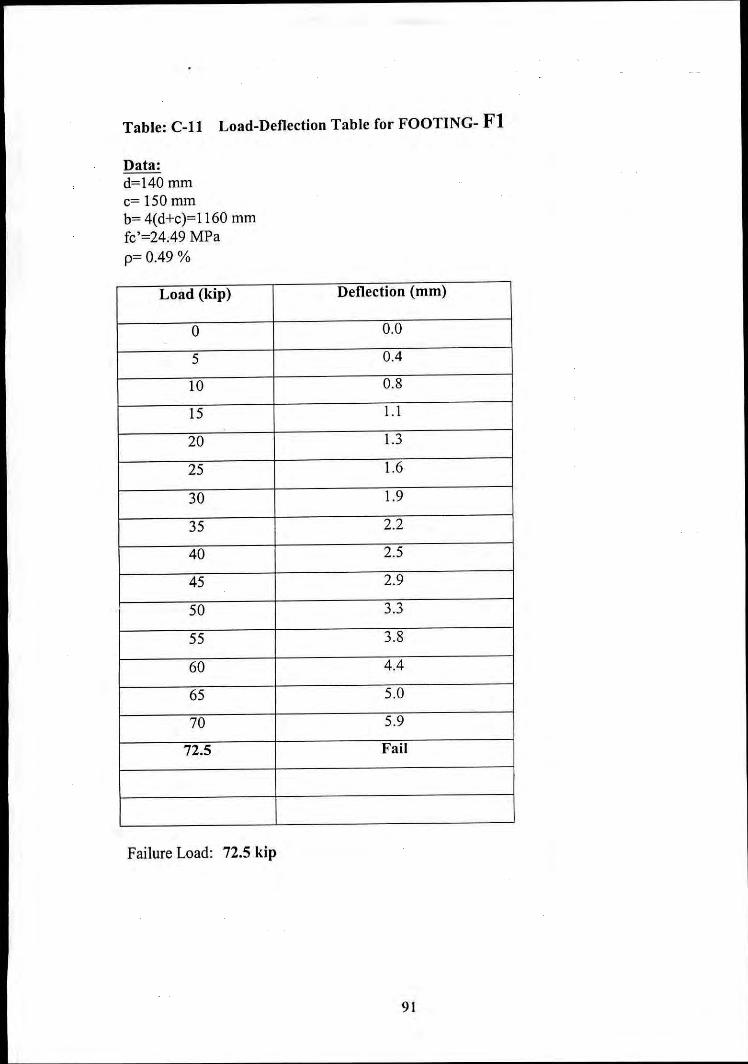
Table: C-ll Load-Defleetion Table for FOOTING- Fl
Data:d=140 mmc= ISO mmb= 4(d+c)=1160 mmfc'=24A9 MPap=OA9 %
Load (kip) Deflection (mm)
0 0.05 OA
10 0.8IS 1.120 1.325 1.630 1.935 2.240 2.545 2.950 3.355 3.860 4A
65 5.070 5.972.5 Fail
Failure Load: 72.5 kip
91
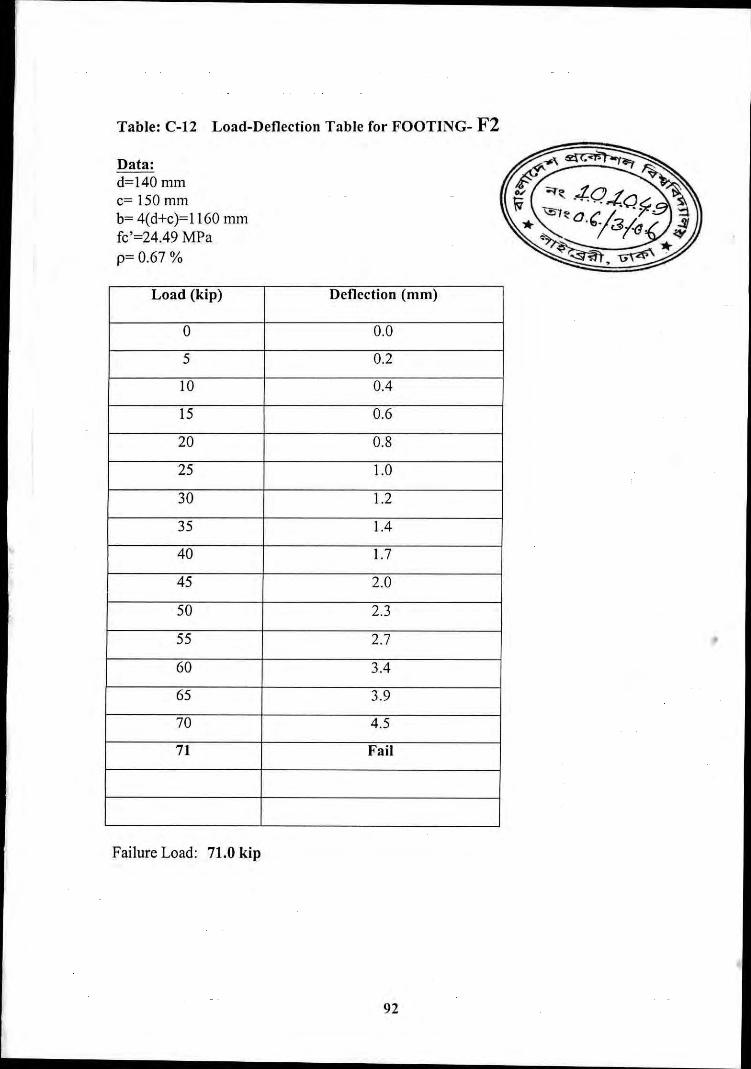
Table: C-12 Load-Deflection Table for FOOTING- F2
Data:d=140 mmc= 150 mmb= 4(d+c)=1160 mmfc'=24.49 MPap= 0.67 %
Load (kip) Deflection (mm)
0 0.0
5 0.2
10 0.4
15 0.6
20 0.8
25 1.0
30 1.2
35 1.4
40 1.7
45 2.0
50 2.3
55 2.7
60 3.4
65 3.9
70 4.5
71 Fail
Failure Load: 71.0 kip
92