Embed Size (px)
Citation preview
Atmos. Chem. Phys., 9, 5813–5827, 2009www.atmos-chem-phys.net/9/5813/2009/© Author(s) 2009. This work is distributed underthe Creative Commons Attribution 3.0 License.
AtmosphericChemistry
and Physics
Retrieval of aerosol single scattering albedo at ultravioletwavelengths at the T1 site during MILAGRO
C. A. Corr 1,*, N. Krotkov 2, S. Madronich3, J. R. Slusser4, B. Holben5, W. Gao4, J. Flynn6, B. Lefer5, andS. M. Kreidenweis1
1Department of Atmospheric Sciences, Colorado State University, Fort Collins, CO 80521, USA2Goddard Earth Sciences and Technology Center, University of Maryland, Baltimore County, MD 20771, USA3Atmospheric Chemistry Division, National Center for Atmospheric Research, Boulder, CO 80407, USA4The USDA UV-B Monitoring and Research Program, Natural Resource Ecology Laboratory, Colorado State University,Fort Collins, CO 80521, USA5Biospheric Sciences Branch, NASA’s Goddard Space Flight Center, Greenbelt, MD 20771, USA6Department of Earth and Atmospheric Sciences, University of Houston, 4800 Calhoun Rd, Houston, TX 77204-5007, USA* now at: Complex Systems Research Center, Institute for the Study of Earth, Oceans, and Space, University of NewHampshire, Durham, NH 03824, USA
Received: 8 January 2009 – Published in Atmos. Chem. Phys. Discuss.: 25 February 2009Revised: 20 July 2009 – Accepted: 20 July 2009 – Published: 12 August 2009
Abstract. Surface measurements of direct and diffuse volt-ages at UV wavelengths were made at the T1 site duringthe MILAGRO (Megacity Initiative: Local and Global Re-search Observations) field campaign in March 2006, usinga multifilter rotating shadowband radiometer (UV-MFRSR).We used the MFRSR data, together with measurements froma co-located CIMEL Sun photometer at the site operatingas part of the AERONET network, to deduce aerosol sin-gle scattering albedo (ω) at 368 and 332 nm for four cloud-free days during the study. Our retrievals suggest that T1aerosols with aerosol extinction optical depthτ368>0.1 thatare influenced by Mexico City emissions, blowing dust, andbiomass burning, are characterized by lowω368=0.73–0.85andω332=0.70–0.86, with small or no spectral variation ofω
between 368 and 332 nm. Our findings are consistent withother published estimates ofω for Mexico City aerosols, in-cluding those that suggest that the absorption attributable tothese aerosols is enhanced at UV wavelengths relative to vis-ible wavelengths. We also demonstrate, via sensitivity tests,the importance of accurateτ and surface albedo measure-ments inω retrievals at UV wavelengths.
Correspondence to:C. A. Corr([email protected])
1 Introduction
Although ultraviolet (UV) radiation only comprises a smallfraction (<10%) of the total radiation reaching Earth’s sur-face, and is therefore frequently ignored in climate mod-eling, it has profound impacts on human and ecosystemhealth. Prolonged exposure to UV-A (315 nm<λ<400 nm)and UV-B (280 nm<λ<315 nm) radiation has been shownto result in negative health effects such as sun burn (ery-thema), DNA damage, cataracts, and suppression of the im-mune systems in humans, and has been linked epidemiolog-ically to skin cancer incidence (Diffey, 1991; Longstreth etal., 1998). Similarly, DNA damage in terrestrial plants hasbeen found with exposure to UV radiation, ultimately re-sulting in adverse changes in plant growth and cell func-tion (Bornman and Teramura, 1993). UV radiation is alsothe primary driver of photochemical processes in the tropo-sphere. Atmospheric oxidant species (e.g., the hydroxyl rad-ical (OH), peroxy radicals (H2O2, RO2) and chlorine rad-icals) are formed when precursor species undergo photoly-sis reactions, primarily in the UV range reaching the surface(300 nm<λ<400 nm). For example, nitrogen dioxide (NO2)
is efficiently photolyzed by UV-A radiation to form ground-state oxygen (O(3P)) which in the atmosphere rapidly reactswith O2 to form O3. Other molecules whose UV photolysis isimportant in the troposphere include O3, hydrogen peroxide(H2O2), nitrous acid (HONO), formaldehyde (CH2O), andvarious other oxygenated organic compounds.
Published by Copernicus Publications on behalf of the European Geosciences Union.
5814 C. A. Corr et al.: UV single-scattering albedos during MILAGRO
Modeling studies have suggested that scattering and ab-sorption by aerosols can cause changes to the surface UVradiation field on the order of those caused by the thinningstratospheric ozone layer, but opposite in sign (Liu et al.,1991; Elminir, 2007; Reuder and Schwander, 1999; Krotkovet al., 1998). These aerosol perturbations to the UV radiationfield can lead to substantial changes in tropospheric photol-ysis reactions and ozone photochemistry. These changes arecomplex and depend on altitude, chemical regime, and therelative extent of aerosol scattering or absorption. Highly ab-sorbing aerosols tend to reduce photolytic radiation, particu-larly near the surface, while scattering aerosols can increasethe radiation throughout the boundary layer and at higher al-titudes above the bulk of the aerosol. The photochemicalproduction of ozone depends on the square root of photoly-sis rates at low NOx and linearly at high NOx (e.g. Kleinman,2005), so that the aerosol-induced UV perturbations have im-portant implications for the production of urban and regionaloxidants. Dickerson et al. (1997) showed that non-absorbingsulfate aerosols cause an increase in regional O3 in the East-ern US, by as much as 10–20 ppb, simply because they in-crease the UV radiation field. He and Carmichael (1999)also indicated that a moderate loading of scattering maritimeand rural (remote) aerosol can increase photolysis rates byseveral percent, with concomitant increases in oxidant con-centrations. On the other hand, Castro et al. (2001) showedthat absorbing aerosols in Mexico City lead to a strong re-duction in surface UV radiation, by 20–30% on two days ofmeasurement in 1994, which implies a reduction of O3 for-mation by about 50 ppb.
Several parameters that describe the interaction betweenradiation and aerosols of particular interest to this work aresingle scattering albedo, aerosol optical depth, and asymme-try parameter. The single scattering albedo at a wavelengthλ,ωλ, describes the contribution of particle scattering relativeto total extinction by particles (absorption plus scattering):
ωλ =bsca,pλ
bext,pλ
(1)
wherebsca,p is the aerosol scattering coefficient andbext,pis the sum of the aerosol scattering and absorption (babs,p)
coefficients:
bext,p = bsca,p + babs,p. (2)
Aerosol optical depth (τλ) is the height-integrated extinctioncoefficient as computed from
τλ =
∫ z2
z1
bext,pλdz (3)
wherez1 and z2 represent the vertical bounds of an atmo-spheric layer. The total optical depth,τTOT,λ, includes con-tributions to extinction from gases as well as from particles.The asymmetry parameter,g, is the phase function-weighted
average of the cosine of the scattering angle over all direc-tions. Assuming azimuthal symmetry, the scattering angleintegration extends from –π to +π :
g =1
2
∫ π
−π
cosθP (θ) sinθ dθ (4)
whereθ is the scattering angle andP(θ) is the phase func-tion. Values forg range from−1 to 1, with a value of−1indicating incident radiation is backscattered and a value of1 indicating forward scattering.
Several methods for the determination of aerosol opti-cal properties in the visible spectral range using measure-ments of sun and sky radiances by Sun photometers and ra-diometers have been implemented. For example, Duboviket al. (2002) demonstrated the retrieval of aerosol opticaland microphysical properties using inversion techniques ap-plied to observations ofτ and the angular distribution ofsky radiances at visible and near-infrared wavelengths, andKassianov et al. (2005) proposed a method for retrieval ofaerosol optical properties at visible wavelengths using mea-sured direct and diffuse irradiances. Compared to the visiblerange, however, use of such methods for the determinationof aerosol optical properties in the UV are more difficult,due to enhanced molecular (Rayleigh) scattering and inter-ference from gaseous absorption (NO2, O3, SO2) (Krotkov etal., 2005c). Additional challenges to the retrieval ofω at UVwavelengths include poorly-characterized surface albedos,which affect the sky radiances and irradiances, and stricterinstrumental requirements, including small signal to noiseratio of measurements, stray light effects, filter stability, andwavelength calibration.
Despite these difficulties, several estimates of aerosolω atUV wavelengths have been reported, as shown in Table 1.The retrievals are based on fitting of measured direct anddiffuse irradiances and their ratios (DDR) using a radiativetransfer (RT) models with different a priori assumptions asindicated in Table 1. Assuming that aerosol optical depth,τ , and the asymmetry factor,g, are known from co-locatedmeasurements, the directω retrieval is possible using singlewavelength measurements as outlined in detail by Wenny etal. (1998) and Petters et al. (2003). Additional required RTmodel input parameters are ozone column, Rayleigh opticaldepth, and optical depth of absorbing gases including NO2,the ground albedo at the wavelength of interestaλ, and solarzenith angle (SZA). Petters et al. (2003) assumed fixed val-ues for all of these parameters exceptω, and iteratively de-termined the best-fitω by varyingω in the radiative transfermodel until the modeled DDR matched the measurements.Wenny et al. (1998) iterated on bothω andg, by adding acall to a Mie code to derive aerosol optical properties froma measured aerosol size distribution and an assumed real re-fractive index. The imaginary part of the refractive indexwas varied in the Mie extinction calculation until values ofg andω were obtained that yielded modeled DDR in agree-ment with measurements. Krotkov et al. (2005a, b) applied
Atmos. Chem. Phys., 9, 5813–5827, 2009 www.atmos-chem-phys.net/9/5813/2009/

C. A. Corr et al.: UV single-scattering albedos during MILAGRO 5815
Table 1. Published studies estimatingω at UV wavelengths, not including studies using in situ point measurements.
Method Location/time λ Surfacealbedo [λ]
τ [λ] g [λ] ω [λ]
Wenny et al. (1998) Modeling of measuredspectral response of UVB-1 radiometer, 280–320broadband
Western NorthCarolina/Jun–Dec1995
312 nm Not specified 0.175–0.871d 0.63–0.76g
0.75–0.93
Hofzumahaus etal. (2002)
Best fit of modeled actinicfluxes to measurementsfrom spectroradiometer
Aegean Sea/Jun1996(2 cases)
355 nm 0.03a Not specifiede 0.70a 0.87∗
and0.95∗
Petters et al. (2003) Modeling of DDR fromUV-MFRSR
Western NorthCarolina/Jul–Dec1999
300 nm332 nm368 nm
0.04b Not specifiedf 0.70b 0.65–0.910.77–0.970.80–0.99
Wetzel et al. (2003) As in Petters et al. (2003) Poker Flat,Alaska/Mar–Apr2001
368 nm Variablec Not specifiedf 0.70b 0.63–0.95
Goering et al. (2005) Modeling of DDR fromUV-MFRSR
Mexico City(MCMA), April200314 April 2003 (re-ported in Barnardet al., 2008)
332 nm368 nm
Not specified Not specifiedf Notspeci-fied
0.68–0.940.7–0.95±0.03
Krotkov et al. (2005b) Modeling of DDR fromUV-MFRSR
Greenbelt,MD/summer2003
325 nm332 nm368 nm
0.028 Not specifiedk Notspecifiedk
0.92p
0.92p
0.94p
Krotkov et al. (2005c) Modeling of DDR fromUV-MFRSR
Greenbelt, MD/10Nov 2003
325 nm 0.02h Not specifiedk Notspecifiedn
0.83–1.0
Bais et al. (2005) Modeling of DDR fromBrewer spectroradiometermeasurements
Thessa-loniki,Greece/Mar–Apr2001(2 cases)
368 nm 0.03b Not specifiedl 0.7b 0.8–0.9;0.65–0.8
Barnard et al. (2008) Inversion of actinic fluxmeasurements from spec-troradiometer
Mexico City(MCMA), April2003
300 nm Not specifiedi Not specifiedm Notspecifiedo
0.67–0.78
a Deduced from fits.b Assumed.c Determined from satellite data.d Extrapolated from visible MFRSR-derivedτ using a linear Angstrom exponent.e Determined from double Brewer spectroradiometer and lidar.f Determined from UV-MFRSR irradiances.g Determined from iterative Mie calculation, with DMPS-measured aerosol size distributions and assumed real refractive index of 1.5.h Determined from TOMS climatology.i Measured from G-1 in MILAGRO in visible; extrapolated to UV.j Determined from UV- MFRSR cosine corrected voltages and AERONET transferred calibration constant (see text).k Determined from UV- MFRSR, but with AERONET transferred calibration (see text).l Determined from direct irradiance measurements.m Determined from direct beam inversions of visible MFRSR data.n Determined from iterative Mie calculations using AERONET-retrieved size distribution and real part refractive index.o Determined from iterative Mie calculations using retrieved size distribution and refractive index at 415 nm.p Average value.
the same methodology as in Wenny et al. (1998), except theyadded a recalibration of theτ and DDR measurements usingseparate, co-located AERONET Sun photometer measure-ments, as described below, and inputs of size distributions
and real refractive indices retrieved from AERONET inver-sions of Sun-sky almucantar measurements at visible wave-lengths. We note that more recently, Goering et al. (2005),Taylor et al. (2008) and Kudo et al. (2008) have proposed
www.atmos-chem-phys.net/9/5813/2009/ Atmos. Chem. Phys., 9, 5813–5827, 2009
5816 C. A. Corr et al.: UV single-scattering albedos during MILAGRO
optimal estimation techniques for the simultaneous retrievalof spectral aerosol optical properties by combining measure-ments at several wavelengths; although a priori constraintsare also needed in those schemes, they are applied differentlythan in the single wavelength methods focused on here.
In this work, we present estimates of aerosol single-scattering albedoω at two independently retrieved UV wave-lengths, 332 and 368 nm, for a site just north of the Mex-ico City basin. Our estimates use measurements of DDR atUV wavelengths made at the T1 site as part of the Megac-ity Initiative: Local and Global Research Objectives (MI-LAGRO) field campaign conducted in and around MexicoCity, Mexico in March 2006. The MILAGRO campaign in-cluded a suite of gas-phase and aerosol-phase measurementson a number of measurement platforms including ground-based and aircraft. Instruments were located at three mainground-based sites, with the T1 site chosen to be repre-sentative of regions influenced by a mixture of fresh andaged pollutants exiting the greater Mexico City metropoli-tan area (Fast et al., 2007). Although the selection of themonth of March for the MILAGRO study was based in parton the expectation of relatively low fire activity, as com-pared with later in the spring, observations showed signif-icant fire activity and analyses suggested that the MILA-GRO sites were impacted by biomass burning emissions(e.g., Moffet et al., 2008; Yokelson et al., 2008; Stone etal., 2008), including local grass fires at the T1 site (Marley etal., 2009). A temporary United States Department of Agri-culture (USDA) UV-B Monitoring and Research Program(UVMRP; http://uvb.nrel.colostate.edu/) research station lo-cated at the T1 site (19.70◦ N, 98.99◦ W, 2270 m) yieldednecessaryτ and DDR data for nearly the entire field cam-paign. The data were measured every 20 s and are archivedat http://uvb.nrel.colostate.edu/. A CIMEL Sun photometeralso collectedτ and aerosol inversion data at T1 as part ofthe AERONET network. Rawτ data are available at approx-imately 15 min resolution athttp://aeronet.gsfc.nasa.gov.
2 Retrieval techniques
As done in the prior studies summarized in Table 1, the re-trieval of aerosol optical properties is accomplished by fit-ting modeled DDR to the observations. The TroposphericUltraviolet model (TUV) version 4.4 was used for all ra-diative transfer calculations (Madronich and Flocke, 1999;http://cprm.acd.ucar.edu/Models/TUV/). As explained byPetters et al. (2003), the TUV4.4 output of direct horizon-tal irradiance normalized to extraterrestrial solar irradiancewas divided by the cosine of SZA, to match the output of theUV-MFRSR, which archives the direct normal voltage. TheDDR is then computed from the measurements as the ratio ofthe direct normal voltage to the diffuse horizontal voltage andcompared to the ratio of the similar solar normalized irradi-ances from the model. Values of DDR were calculated using
the 4-stream discrete ordinate solver, using over 80 equally-spaced vertical layers, for the two longest UV-MFRSR spec-tral channels centered at 368 nm and 332 nm. The defaultvertical aerosol profile in TUV4.4 used to scale the inputτ is the continental aerosol profile reported by Elterman etal. (1969) with a scale (e-folding) height of about 4 km. TUVinputs of latitude and longitude, SZA, climatological col-umn NO2, and surface pressure for the T1 site were obtainedfrom the AERONET database (http://aeronet.gsfc.nasa.gov).Ozone column data were obtained from the Ozone Monitor-ing Instrument (OMI) on board the NASA Aura satellite.
The remaining required TUV inputs for each wavelengthareτ , g, ω, and surface albedo. The measurements, used todetermine bothτ and DDR, were obtained using a UV Multi-filter Shadowband Radiometer (UV-MFRSR; Bigelow et al.,1998), which measures voltages proportional to the total anddiffuse horizontal irradiances at 300, 305, 311, 317, 325,332, and 368 nm with nominal 2 nm resolution (full width athalf maximum, FWHM). Total horizontal voltages are mea-sured when the shadowband is at rest to the side of the dif-fuser and diffuse horizontal voltages are measured with theshadowband completely shadowing the diffuser. Diffuse hor-izontal voltages are corrected for excess sky blocking inter-nally using additional blocking measurements at 9◦ off toeach side of the direct-sun shadowband position (Harrison etal., 1994). The subtraction of the corrected diffuse horizontalvoltages from the total horizontal voltages yields direct hor-izontal voltages that are converted to direct normal voltagesusing laboratory measured angular response functions.
The raw voltage signals (mV) measured by UV-MFRSRare first corrected for non-cosine angular response and darkcurrent and then converted to dimensionless transmittancevalues using channel-specific calibration coefficients,V0,λ
(mV). V0,λ values are determined using either an on-siteLangley regression method (Harrison and Michalsky, 1994;Slusser et al., 2000) or using calibration transfer from a co-located AERONET Sun photometer (Krotkov et al., 2005a),and the equation:
ln Vλ = ln Vo,λ − mτTOT (5)
whereVλ is the measured direct normal voltage andm is theair mass factor (secant of the solar zenith angle, SZA). Theon-site Langley method assumes constant total optical depthτTOT and extrapolates via a linear regression betweenm andlnVλ to zero airmass (m=0) to estimateV0,λ as the interceptvalue (Bigelow et al., 1998). The same calibration constantcan be used for both the diffuse and direct measurements.The main difficulty of the local Langley calibration methodis that at most sites,τTOT does not remain constant duringthe calibration period (typically a few morning hours), whichresults in significant errors in the estimatedV0,λ. To smoothout these errors, a statistical regression is fit to the dailyV0,λ
values to determine smoothed<V0,λ> values, representativeof degradation of the throughput of the instrument, that are
Atmos. Chem. Phys., 9, 5813–5827, 2009 www.atmos-chem-phys.net/9/5813/2009/

C. A. Corr et al.: UV single-scattering albedos during MILAGRO 5817
Figure 1. Spectral interpolation/extrapolation of AERONET τ values (340 nm, 380 nm, 440 nm,
500 nm) to the UV-MFRSR spectral channels (shown in vertical blue lines). The green dashed
line is the linear fit for the 340-380 nm Angström Exponent. The blue curve is a quadratic least-
squares fit of the Angström Exponent to all four AERONET channels.
Fig. 1. Spectral interpolation/extrapolation of AERONETτ val-ues (340 nm, 380 nm, 440 nm, 500 nm) to the UV-MFRSR spectralchannels (shown in vertical blue lines). The green dashed line is thelinear fit for the 340–380 nm Angstrom Exponent. The blue curveis a quadratic least-squares fit of the Angstrom Exponent to all fourAERONET channels.
later used to solve Eq. (5) forτTOT for each individual UV-MFRSR measurement:
τTOT =1
m[ln < Vo,λ > − ln Vλ] (6)
Subtracting Rayleigh and gaseous optical thicknesses fromτTOT yields aerosol optical depth,τ .
The statistical method (Eq. 6) works best for relativelycloud free and pollution free locations, where atmosphericstability requirements are frequently met. However, in pol-luted locations, the data available to estimate<V0,λ> maybe sparse because of few clear-sky measurements. Further,it has been shown that the UV-MFRSR instrument can expe-rience rapid and non-monotonic throughput changes due todiffuser soiling and self-cleaning (after rain events) (Krotkovet al., 2005a), so that the accuracy of the on-site statisticalLangley technique is not always sufficient for aerosol re-trieval applications (Michalsky et al., 2001). An independentcheck on the validity of the derivedV0,λ can be made usingco-located, well-calibrated AERONET data, as explained indetail below. AERONET sites are equipped with the CIMELElectronique 318A, an automatic sun-tracking and sky scan-ning filter radiometer, and undergo standardized calibrationprocedures (Holben et al., 1998). The instrument has twodetectors for the measurement of Sun/aureole and sky ra-diances. Eight ion-assisted deposition interference filtersyield direct-Sun radiance measurements at 340 nm, 380 nm,440 nm, 500 nm, 670 nm, 870 nm, 940 nm, and 1020 nm withband passes (FWHM) of 2 nm for the 340 nm channel, 4 nmfor the 380 nm channel, and 10 nm for all visible wavelengthchannels (Holben et al., 2001). The CIMEL makes additionalalmucantar sky radiance measurements at 440 nm, 670 nm,
Figure 2. Iterative screening process as applied to the determination of ln(V0) at 368nm for the
UV-MFRSR instrument (left axis), using AERONET direct-Sun τ data at the T1 site on 12
March 2006 (DOY 71). The inset lists sample average value for ln(V0) (<ln(V0)>), sample
standard deviation of ln(V0) (σlnV0), and number of measurements in the sample for each
iteration. Red crosses: UV-MFRSR raw V0 data. Black diamonds: estimated V0 after filtering to
49 points (see text). Black horizontal line: final daily average V0, <V0>, applied to UV-MFRSR
data. Black crosses (right axis): derived UV-MFRSR τ368 using <V0>. Blue diamonds (right
axis): Interpolated AERONET τ368. The RMS difference between AERONET and UV-MFRSR
AOT in the final daily sample is within stated uncertainty of AERONET measurements
(~0.004).
Fig. 2. Iterative screening process as applied to the determi-nation of ln(V0) at 368 nm for the UV-MFRSR instrument (leftaxis), using AERONET direct-Sunτ data at the T1 site on 12March 2006 (DOY 71). The inset lists sample average value forln(V0)(<ln(V0)>), sample standard deviation of ln(V0) (σlnV0),and number of measurements in the sample for each iteration. Redcrosses: UV-MFRSR rawV0data. Black diamonds: estimatedV0after filtering to 49 points (see text). Black horizontal line: fi-nal daily averageV0, <V0>, applied to UV-MFRSR data. Blackcrosses (right axis): derived UV-MFRSRτ368 using<V0>. Bluediamonds (right axis): Interpolated AERONETτ368. The RMSdifference between AERONET and UV-MFRSR AOT in the finaldaily sample is within stated uncertainty of AERONET measure-ments (∼0.004).
870 nm, and 1020 nm during each measurement sequencethat are inverted together with direct sun data to estimate par-ticle size distributions and refractive indices (real and imag-inary parts) in the visible wavelengths (Dubovik and King,2000; Dubovik et al., 2000).
In our study values ofV0λ at 332 and 368 nm wereobtained by combining UV-MFRSR direct voltages withAERONETτ values, satellite ozone values and climatologi-cal NO2 values, using the methodology described by Krotkovet al. (2005a, b). First,τ values at UV-MFRSR wavelengths332 and 368 nm were interpolated/extrapolated spectrally us-ing a quadratic least squares fit of ln(λ) versus ln(τ for stan-dard AERONETτ data at 340, 380, 440 and 500 nm (Fig. 1).These values ofτ368 andτ332, along with appropriate valuesof Rayleigh, NO2 and O3 optical thicknesses calculated fromthe AERONET surface pressure and gaseous column concen-tration data, were used in Eq. (5) to determineV0,λ for eachindividual (20 s) UV-MFRSR measurement. If all measure-ments are consistent,V0,λ should remain constant during theday regardless of any changes in atmospheric transmittanceand/or solar elevation and azimuth. Therefore, examining di-urnal trends in raw UVMRPV0,λ data provides insight intopossible systematic calibration errors and yields a tool forscreening non-consistent and/or outlier measurements in aniterative procedure.
www.atmos-chem-phys.net/9/5813/2009/ Atmos. Chem. Phys., 9, 5813–5827, 2009

5818 C. A. Corr et al.: UV single-scattering albedos during MILAGRO
Figure 2 demonstrates the iterative screening process usedto find suitable time periods and corresponding mean daily<V0,λ>, as applied to the determination ofV0,368 on 12March. We initially screened the UV-MFRSR data to selectonly points within 1 min of AERONETτ retrievals, result-ing in an initial set of 323 UV-MFRSR measurements forthis day. Measurements in early morning (before 14:00 UT,where local time = UT−6) and evening (after 22:00 UT)were rejected because of increased noise due to low signallevel. Late morningV0,368 data (14:00 UT–16:00 UT), al-though less noisy, exhibited a systematic increase with SZAand were rejected for that reason. During the noon period(17:00 UT–20:00 UT),V0,368 remained reasonably constant(standard deviation∼1%) and these data were used for cal-culating mean daily<V0,368> to reduce random noise inindividual measurements. The noise was further reduced(by a factor of 3) by removing outlier measurements (thosewith ln(V0,368) outside of±2σ of the ln<V0,368>) and iter-atively re-calculating<V0,368>. The final ln<V0,368> wasused in Eq. (6) to calculate UV-MFRSRτ368 that agree withAERONET-interpolatedτ368 within an rms difference of∼0.004 for the selected time interval (i.e., between 17:00 and20:00 UT). The<V0,368> was also used to normalize diffuseand total UV-MFRSR cosine corrected voltages to obtaincorresponding dimensionless transmittances. The screeningprocedure reduced the 323 raw UV-MFRSR measurementsto a final filtered data set of 49 points retained forω retrievalson this day. Similar calibration results were obtained on otherdays selected for single scattering albedo retrievals, excepton 19 March, affected by dust as explained later.
We obtained estimates ofω368 and ω332 using two ap-proaches: the Krotkov et al. (2005a, b) methodology (here-after called the “Krotkov method”), and a modified ver-sion of the Petters et al. (2003) technique (hereafter referredto as “this work”). The two approaches differ in the as-sumptions used to determine a key input for TUV4.4, theasymmetry parameter,g. In this work, rather than assum-ing a fixed climatological or measured value forg, we ranmultiple simulations for a range ofg values applicable tothe expected aerosol types. To determine an appropriaterange ing, we used data from an AERONET site that hasbeen located in Mexico City (19.33◦ N, 99.18◦ W, 2268 m)since March 1999. We downloaded all valid Version 2 re-trievals for March dates in all available years (1999–2008)and computed a mediang440 of 0.68; 96% of the valueswere between 0.6 and 0.75. These historical data agreedwell with the Level 1.5, Version 2 AERONET almucantarretrievals reported for the T1 site for March 2006: mediang440, 0.68; min, 0.63; max, 0.74. We note that for small par-ticles,g is expected to increase at UV wavelengths. Accord-ingly, Barnard et al. (2008) estimatedg300=0.76–0.77 andg500=0.70–0.72 for Mexico City aerosol for five days in theMCMA-2003 field campaign. We thus chose 0.6≤g≤0.75 asthe input range ofg332 andg368, and computed all pairs ofgandω that yielded modeled DDR in agreement with (within
1% relative error) the measurements. In the Krotkov method,the values ofg andω are determined from a separate Miecalculation. The method requires successful AERONET al-mucantar retrievals near the time periods of interest in orderto initialize the size distribution and real refractive index,n,in the Mie code. The shortest wavelength at whichn is re-trieved is 440 nm, and this value was assumed to apply alsoat 368 and 332 nm. The imaginary part of the refractive in-dex at each wavelength was then varied iteratively, until theg
andω computed from the Mie code yielded a modeled DDRin agreement with the UV-MFRSR observations.
Retrievals ofω from observed DDR are sensitive to thechoice of surface albedo, assumed in our modeling to beLambertian. A higher surface albedo will increase the dif-fuse component of the radiation field and therefore decreasethe DDR. Retrievals that underestimate the surface albedotherefore incorrectly attribute some of the diffuse radiationto aerosols, leading to an overestimation ofω if the aerosoloptical depth is specified independently (e.g., from directsun AERONET data, as done here). We show retrievalsfor two assumptions: a spectrally flat surface albedo of 0.06consistent with the surface albedo of urban surfaces (Castroet al., 2000), and a spectrally-varying surface albedo, esti-mated from measurements during MILAGRO from aircraft-based radiometers. Surface albedo measurements by Cod-dington et al. (2008) from the J-31 aircraft spanned the wave-length range 350–2000 nm; although reported measurementsin the UV range are sparse, they show values of 0.07–0.08at 385 nm with a systematic decrease towards lower wave-lengths. Madronich et al. (2007) compared spectral actinicfluxes measured at the T1 surface site with upwelling spec-tral actinic fluxes measured from T1 overpasses by the C-130aircraft, and found that a spectrally dependent surface albedowas required over the wavelength range 300–420 nm, to ex-plain the wavelength variation of the actinic flux under bothclean and polluted conditions. This wavelength-dependentsurface albedo was approximated by Madronich et al. (2007)with a linear interpolation between a value of 0.02 at 320 nmand 0.10 at 400 nm. We slightly revised this estimate hereto a linear variation between 0.015 at 320 nm and 0.085 at400 nm, based on the lower values for 385 nm reported byCoddington et al. (2008). Interpolation then yields surfacealbedos of 0.025 at 332 nm and 0.057 at 368 nm. While thisdifference of 0.032 albedo units may seem small, it will beshown below that it has a significant influence on the spectraldependence of retrievedω.
It should be noted that error may also be introduced inthe retrieval ofω with the assumption of a fixed NO2 col-umn concentration such as that used in this work’s retrievals.Studies have shown that the use of the climatological NO2value will result in an underestimation ofω during high pol-lution episodes (Krotkov et al., 2005c). While the fixed NO2value of∼0.4 DU (1.1×10¹⁶ molecules/cm2) used in allωretrievals is consistent with that used in the AERONET in-versions as well as with the background NO2 value observed
Atmos. Chem. Phys., 9, 5813–5827, 2009 www.atmos-chem-phys.net/9/5813/2009/
C. A. Corr et al.: UV single-scattering albedos during MILAGRO 5819
at the T1 site during MILAGRO (Johansson et al., 2009),such a value may not be representative of short-lived pollu-tion plumes that passed over the T1 site during MILAGRO.It can be shown that the error in retrieved1ω is determinedby the ratio of NO2 and aerosol extinction optical thicknessat particular wavelength:
1ω
ω∼
1τNO2
τ(7)
Use of background NO2 concentration when actualNO2∼2 DU (5×10¹⁶ molecule/cm2) under conditions withlow aerosol loading (τNO2
τ∼0.2, τNO2∼0.03 andτ∼0.15 at
368 nm) results in significant underestimation of the re-trieved ω at least 12% and 7% at 368 nm and 332 nm, re-spectively (Krotkov et al., 2005c). Accounting forτ spec-tral dependence in Eq. (7) the NO2 error is even larger at440 nm (1τNO2 being approximately the same at 368 nm and440 nm, butτ (368)>τ (440)). Therefore, under low aerosolloading conditions the NO2 error can change significantly notonly the absolute value ofω, but alsoω spectral dependence.However, the error becomes practically negligible for aerosolladen pollution plumes when the ratioτNO2
τis small.
3 Results and discussion
Although AERONET and UVMRP data are availablefor most of the days in March 2006, our screeningprocedures have limited retrievals to days with validcloud-screened AERONET almucantar (Version 2) re-trievals, needed to initialize the size distributions in theKrotkov method. AERONET almucantar inversions requireSZA>45◦ (Dubovik and King, 2000; Dubovik et al., 2000),while UV-MFRSR voltage corrections and derived aerosoloptical depths are most accurate at SZA smaller than 70◦,due to increases in angular response errors at larger SZA(Krotkov et al., 2005a). This limitation is more severe at thesurface elevation of Mexico City than at sea level, because ofthe relatively larger importance of the direct solar beam.
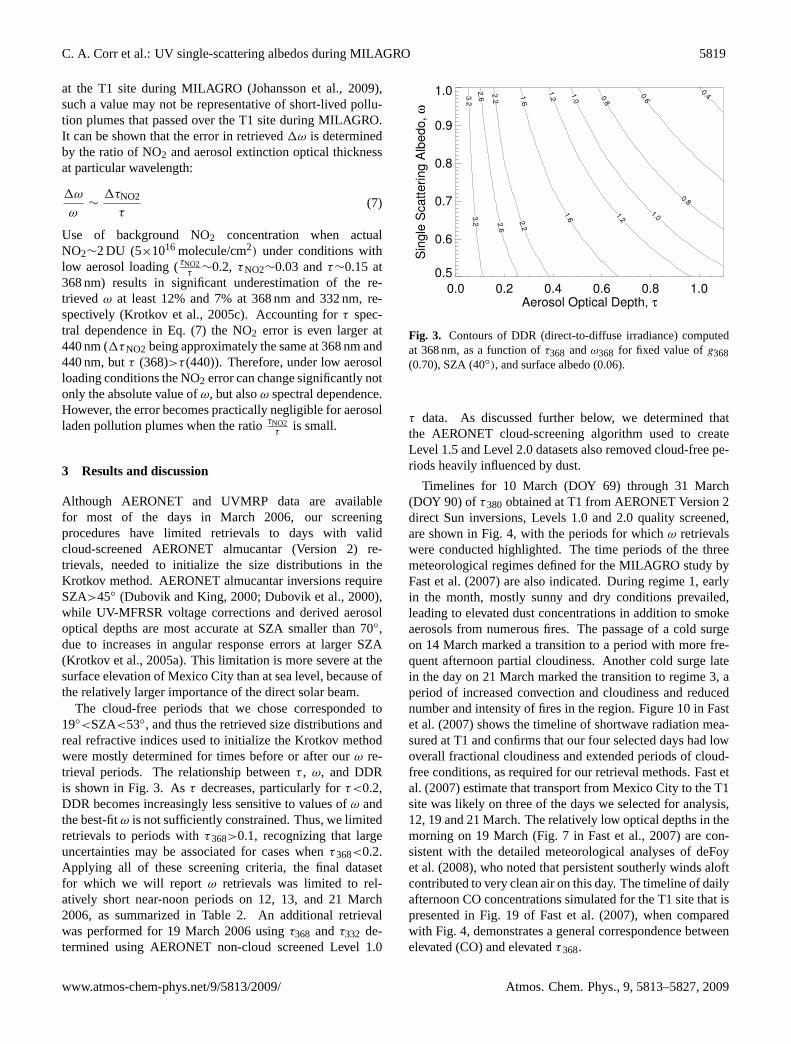
The cloud-free periods that we chose corresponded to19◦<SZA<53◦, and thus the retrieved size distributions andreal refractive indices used to initialize the Krotkov methodwere mostly determined for times before or after ourω re-trieval periods. The relationship betweenτ , ω, and DDRis shown in Fig. 3. Asτ decreases, particularly forτ<0.2,DDR becomes increasingly less sensitive to values ofω andthe best-fitω is not sufficiently constrained. Thus, we limitedretrievals to periods withτ368>0.1, recognizing that largeuncertainties may be associated for cases whenτ368<0.2.Applying all of these screening criteria, the final datasetfor which we will report ω retrievals was limited to rel-atively short near-noon periods on 12, 13, and 21 March2006, as summarized in Table 2. An additional retrievalwas performed for 19 March 2006 usingτ368 and τ332 de-termined using AERONET non-cloud screened Level 1.0
0.0 0.2 0.4 0.6 0.8 1.0Aerosol Optical Depth, τ
0.5
0.6
0.7
0.8
0.9
1.0
Sin
gle
Scattering A
lbedo,
ω
0.40.60.8
0.8
1.0
1.0
1.2
1.2
1.6
1.6
2.2
2.2
2.6
2.6
3.2
3.2
Figure 3. Contours of DDR (direct-to-diffuse irradiance) computed at 368 nm, as a function of
τ368 and ω368 for fixed value of g368 (0.70), SZA (40o), and surface albedo (0.06).
Fig. 3. Contours of DDR (direct-to-diffuse irradiance) computedat 368 nm, as a function ofτ368 andω368 for fixed value ofg368(0.70), SZA (40◦), and surface albedo (0.06).
τ data. As discussed further below, we determined thatthe AERONET cloud-screening algorithm used to createLevel 1.5 and Level 2.0 datasets also removed cloud-free pe-riods heavily influenced by dust.
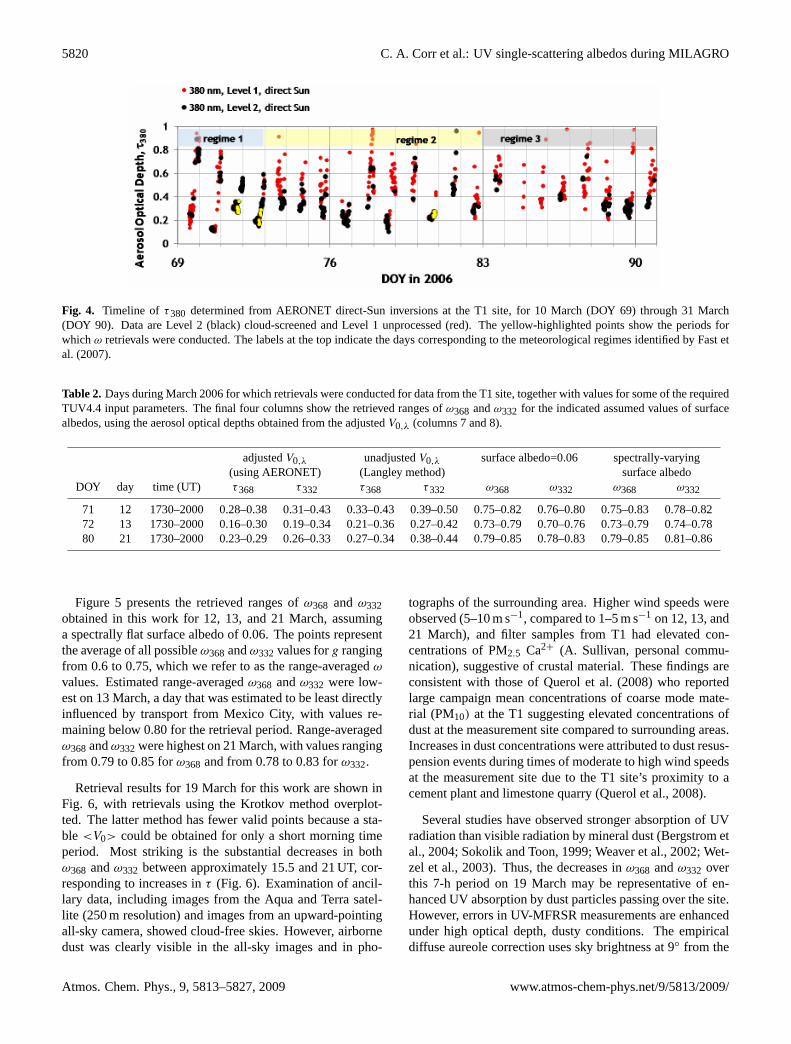
Timelines for 10 March (DOY 69) through 31 March(DOY 90) ofτ380 obtained at T1 from AERONET Version 2direct Sun inversions, Levels 1.0 and 2.0 quality screened,are shown in Fig. 4, with the periods for whichω retrievalswere conducted highlighted. The time periods of the threemeteorological regimes defined for the MILAGRO study byFast et al. (2007) are also indicated. During regime 1, earlyin the month, mostly sunny and dry conditions prevailed,leading to elevated dust concentrations in addition to smokeaerosols from numerous fires. The passage of a cold surgeon 14 March marked a transition to a period with more fre-quent afternoon partial cloudiness. Another cold surge latein the day on 21 March marked the transition to regime 3, aperiod of increased convection and cloudiness and reducednumber and intensity of fires in the region. Figure 10 in Fastet al. (2007) shows the timeline of shortwave radiation mea-sured at T1 and confirms that our four selected days had lowoverall fractional cloudiness and extended periods of cloud-free conditions, as required for our retrieval methods. Fast etal. (2007) estimate that transport from Mexico City to the T1site was likely on three of the days we selected for analysis,12, 19 and 21 March. The relatively low optical depths in themorning on 19 March (Fig. 7 in Fast et al., 2007) are con-sistent with the detailed meteorological analyses of deFoyet al. (2008), who noted that persistent southerly winds aloftcontributed to very clean air on this day. The timeline of dailyafternoon CO concentrations simulated for the T1 site that ispresented in Fig. 19 of Fast et al. (2007), when comparedwith Fig. 4, demonstrates a general correspondence betweenelevated (CO) and elevatedτ368.
www.atmos-chem-phys.net/9/5813/2009/ Atmos. Chem. Phys., 9, 5813–5827, 2009
5820 C. A. Corr et al.: UV single-scattering albedos during MILAGRO
Figure 4. Timeline of τ380 determined from AERONET direct-Sun inversions at the T1
site, for March 10 (DOY 69) through March 31 (DOY 90). Data are Level 2 (black)
cloud-screened and Level 1 unprocessed (red). The yellow-highlighted points show the
periods for which ω retrievals were conducted. The labels at the top indicate the days
corresponding to the meteorological regimes identified by Fast et al. [2007].
Fig. 4. Timeline of τ380 determined from AERONET direct-Sun inversions at the T1 site, for 10 March (DOY 69) through 31 March(DOY 90). Data are Level 2 (black) cloud-screened and Level 1 unprocessed (red). The yellow-highlighted points show the periods forwhichω retrievals were conducted. The labels at the top indicate the days corresponding to the meteorological regimes identified by Fast etal. (2007).
Table 2. Days during March 2006 for which retrievals were conducted for data from the T1 site, together with values for some of the requiredTUV4.4 input parameters. The final four columns show the retrieved ranges ofω368 andω332 for the indicated assumed values of surfacealbedos, using the aerosol optical depths obtained from the adjustedV0,λ (columns 7 and 8).
adjustedV0,λ unadjustedV0,λ surface albedo=0.06 spectrally-varying(using AERONET) (Langley method) surface albedo
DOY day time (UT) τ368 τ332 τ368 τ332 ω368 ω332 ω368 ω332
71 12 1730–2000 0.28–0.38 0.31–0.43 0.33–0.43 0.39–0.50 0.75–0.82 0.76–0.80 0.75–0.83 0.78–0.8272 13 1730–2000 0.16–0.30 0.19–0.34 0.21–0.36 0.27–0.42 0.73–0.79 0.70–0.76 0.73–0.79 0.74–0.7880 21 1730–2000 0.23–0.29 0.26–0.33 0.27–0.34 0.38–0.44 0.79–0.85 0.78–0.83 0.79–0.85 0.81–0.86
Figure 5 presents the retrieved ranges ofω368 and ω332obtained in this work for 12, 13, and 21 March, assuminga spectrally flat surface albedo of 0.06. The points representthe average of all possibleω368 andω332 values forg rangingfrom 0.6 to 0.75, which we refer to as the range-averagedω
values. Estimated range-averagedω368 andω332 were low-est on 13 March, a day that was estimated to be least directlyinfluenced by transport from Mexico City, with values re-maining below 0.80 for the retrieval period. Range-averagedω368andω332were highest on 21 March, with values rangingfrom 0.79 to 0.85 forω368 and from 0.78 to 0.83 forω332.
Retrieval results for 19 March for this work are shown inFig. 6, with retrievals using the Krotkov method overplot-ted. The latter method has fewer valid points because a sta-ble <V0> could be obtained for only a short morning timeperiod. Most striking is the substantial decreases in bothω368 andω332 between approximately 15.5 and 21 UT, cor-responding to increases inτ (Fig. 6). Examination of ancil-lary data, including images from the Aqua and Terra satel-lite (250 m resolution) and images from an upward-pointingall-sky camera, showed cloud-free skies. However, airbornedust was clearly visible in the all-sky images and in pho-
tographs of the surrounding area. Higher wind speeds wereobserved (5–10 m s−1, compared to 1–5 m s−1 on 12, 13, and21 March), and filter samples from T1 had elevated con-centrations of PM2.5 Ca2+ (A. Sullivan, personal commu-nication), suggestive of crustal material. These findings areconsistent with those of Querol et al. (2008) who reportedlarge campaign mean concentrations of coarse mode mate-rial (PM10) at the T1 suggesting elevated concentrations ofdust at the measurement site compared to surrounding areas.Increases in dust concentrations were attributed to dust resus-pension events during times of moderate to high wind speedsat the measurement site due to the T1 site’s proximity to acement plant and limestone quarry (Querol et al., 2008).
Several studies have observed stronger absorption of UVradiation than visible radiation by mineral dust (Bergstrom etal., 2004; Sokolik and Toon, 1999; Weaver et al., 2002; Wet-zel et al., 2003). Thus, the decreases inω368 andω332 overthis 7-h period on 19 March may be representative of en-hanced UV absorption by dust particles passing over the site.However, errors in UV-MFRSR measurements are enhancedunder high optical depth, dusty conditions. The empiricaldiffuse aureole correction uses sky brightness at 9◦ from the
Atmos. Chem. Phys., 9, 5813–5827, 2009 www.atmos-chem-phys.net/9/5813/2009/

C. A. Corr et al.: UV single-scattering albedos during MILAGRO 5821
Sun as a proxy for the aureole (Harrison at al., 1994). Thisproxy is an underestimation in general, but more so for dustyconditions, because larger particles, such as dust, preferen-tially forward scatter (largerg). The MFRSR diffuse voltageunderestimation results in an overestimation of the MFRSRdirect voltage, and thus an overestimation of the DDR. Inour retrieval method, the overestimated DDR leads directlyto underestimatedω. Further, the values ofg assumed forour retrievals may be too low for the dusty conditions. Fi-nally, we had difficulty obtaining stableV0,λ during most ofthis day, another indication that the standard MFRSR volt-age corrections are not adequate. We conclude that evidencepoints to a change to a dust-dominated aerosol type during19 March, with the late morning and afternoon aerosol hav-ing a lowerω than the aerosol observed on the other days, butthe appropriate values ofω368 andω332 cannot be establishedwith confidence.
A few estimates ofω for Mexico City aerosols have beenpublished to which our results for 12, 13 and 21 March canbe compared. Marley et al. (2009) computedω at the T1 sitein 2006 for visible wavelengths using ground-based aerosolabsorbance and scattering measurements, and obtained anaverage value of 0.75 and a range 0.44–0.90. Doran etal. (2007) used MFRSR data and the approach of Kassianovet al. (2005) to estimateω500 at the T1 site during morn-ing hours on DOY 71, 78 and 86, as 0.84, 0.85, and 0.89.AERONET retrievals ofω441 at similar times on the respec-tive days averaged 0.89, 0.90, and 0.92, withω674 averaging0.88, 0.89, and 0.90. Marley et al.’s (2009) averages on thesedays were 0.76, 0.79, and 0.75; they attributed the discrep-ancies to the difference between their surface measurementsthat included fine particles only, and the column measure-ments that included all particles, as well as differences inthe measurement wavelengths. The values obtained in thiswork for ω368 andω332 on DOY 71 and 78 are in line withthese other estimates, and indicate a generally decreasingω
with wavelengths shorter than 500 nm, as also suggested byBarnard et al. (2008), who attributed the enhanced absorptionin the near-UV to aerosol organic carbon. Figure 7 showsthat the averageω368 andω332 values retrieved for 12, 13 and21 March using the Krotkov method are substantially lowerthan AERONETω441 and ω670 averaged over those samedays. These findings are consistent with those reported byBarnard et al. (2008), who obtainedω500=0.88–0.95 (averageof 0.92) andω300=0.67–0.78 (average of 0.72) using MFRSRand actinic flux spectroradiometer data from the MCMA-2003 field campaign in Mexico City (Fig. 7). As summa-rized in Table 2, our MILAGRO estimates ofω368=0.73–0.85 andω332=0.70–0.83 are well aligned with their esti-mates at longer and shorter wavelengths, as is the AERONETω441=0.83–0.92 at T1 for the same three days in 2006.
The spectroradiometer-derivedωλ shown in Fig. 1 ofBarnard et al. (2008) suggest no significant spectral depen-dence for 300 nm<λ<400 nm. Our retrievals in Fig. 5 sug-gest only a small difference betweenω368 andω332, although
0312
15 16 17 18 19 20 21 22Time (Hr)
0.7
0.8
0.9
1.0
Sin
gle
Sca
tte
rin
g A
lbe
do
, ω
332nm
368nm
0313
15 16 17 18 19 20 21 22Time (Hr)
0.6
0.7
0.8
0.9
1.0
Sin
gle
Sca
tte
rin
g A
lbe
do
, ω
332nm368nm
0321
15 16 17 18 19 20 21 22Time (Hr)
0.7
0.8
0.9
1.0
Sin
gle
Sca
tte
rin
g A
lbe
do
, ω
332nm
368nm
Figure 5. Retrieved ranges of ω (bars) and range-averaged ω values (points) for 368 nm (red)
and 332 nm (black), for 12, 13, and 21 March 2006 (DOY 71, 72, and 80). Surface albedo was
fixed at 0.06 for both wavelengths.
Fig. 5. Retrieved ranges ofω (bars) and range-averagedω values(points) for 368 nm (red) and 332 nm (black), for 12, 13, and 21March 2006 (DOY 71, 72, and 80). Surface albedo was fixed at0.06 for both wavelengths.
a Student’s t-test found thatω368>ω332 at the 95% confi-dence level for most of the retrievals on all retrieval days.In Fig. 8, we show retrievedω assuming a spectrally-varyingsurface albedo, which resulted in higher range-averagedω332values. The revised retrievals for DOY 71 and 72 show al-most no spectral dependence, and for DOY 80, the slightspectral variation has changed sign.
www.atmos-chem-phys.net/9/5813/2009/ Atmos. Chem. Phys., 9, 5813–5827, 2009

5822 C. A. Corr et al.: UV single-scattering albedos during MILAGRO
14 16 18 20 22Time (Hr)
0.0
0.2
0.4
0.6
0.8
Ae
roso
l O
ptica
l D
ep
th,
τ
0319
14 16 18 20 22Time (Hr)
0.5
0.6
0.7
0.8
0.9
1.0
Sin
gle
Sca
tte
rin
g A
lbe
do
, ω
332nm368nm
14 16 18 20 22Time (Hr)
0.5
0.6
0.7
0.8
0.9
1.0
Sin
gle
Scattering A
lbedo,
ω
332nm368nmKrotkov 332nmKrotkov 368nm
Figure 6. Plots for 19 March showing AERONET Level 1.0 τ380 (top, left), retrieved ranges of ω
(bars) and range-averaged ω values (points) for 368 nm (red) and 332 nm (black) with surface
albedo fixed at 0.06 for both wavelengths (top, right), and retrieved ranges of ω (bars) and
range-averaged ω values (points) for 368 nm (red) and 332 nm (black), and ω values derived
using the Krotkov method at 368nm (dark blue) and 332 (light blue) with surface albedo
assumed to have a wavelength dependence, with values set at 0.025 and 0.057 at 332 nm and 368
nm (bottom).
Fig. 6. Plots for 19 March showing AERONET Level 1.0τ380 (top, left), retrieved ranges ofω (bars) and range-averagedω values (points)for 368 nm (red) and 332 nm (black) with surface albedo fixed at 0.06 for both wavelengths (top, right), and retrieved ranges ofω (bars) andrange-averagedω values (points) for 368 nm (red) and 332 nm (black), andω values derived using the Krotkov method at 368 nm (dark blue)and 332 (light blue) with surface albedo assumed to have a wavelength dependence, with values set at 0.025 and 0.057 at 332 nm and 368 nm(bottom).
300 400 500 600 700 800 900Wavelength, λ (nm)
0.70
0.75
0.80
0.85
0.90
0.95
1.00
Sin
gle
Sca
tte
rin
g A
lbe
do
, ω
Krotkov methodAERONETBarnard et al.[2008]
Figure 7. ω values determined using the Krotkov method (black) and as reported by AERONET
(orange) averaged over 12, 13, 21 March. Error bars represent the error in retrieved ω which is
inversely proportional to τ. Also shown are ω values averaged for five days in April 2003
determined by Barnard et al. [2008] using MFRSR and actinic flux spectroradiometer data from
the MCMA-2003 field campaign in Mexico City.
Fig. 7. ω values determined using the Krotkov method (black) andas reported by AERONET (orange) averaged over 12, 13, 21 March.Error bars represent the error in retrievedω which is inversely pro-portional toτ . Also shown areω values averaged for five daysin April 2003 determined by Barnard et al. (2008) using MFRSRand actinic flux spectroradiometer data from the MCMA-2003 fieldcampaign in Mexico City.
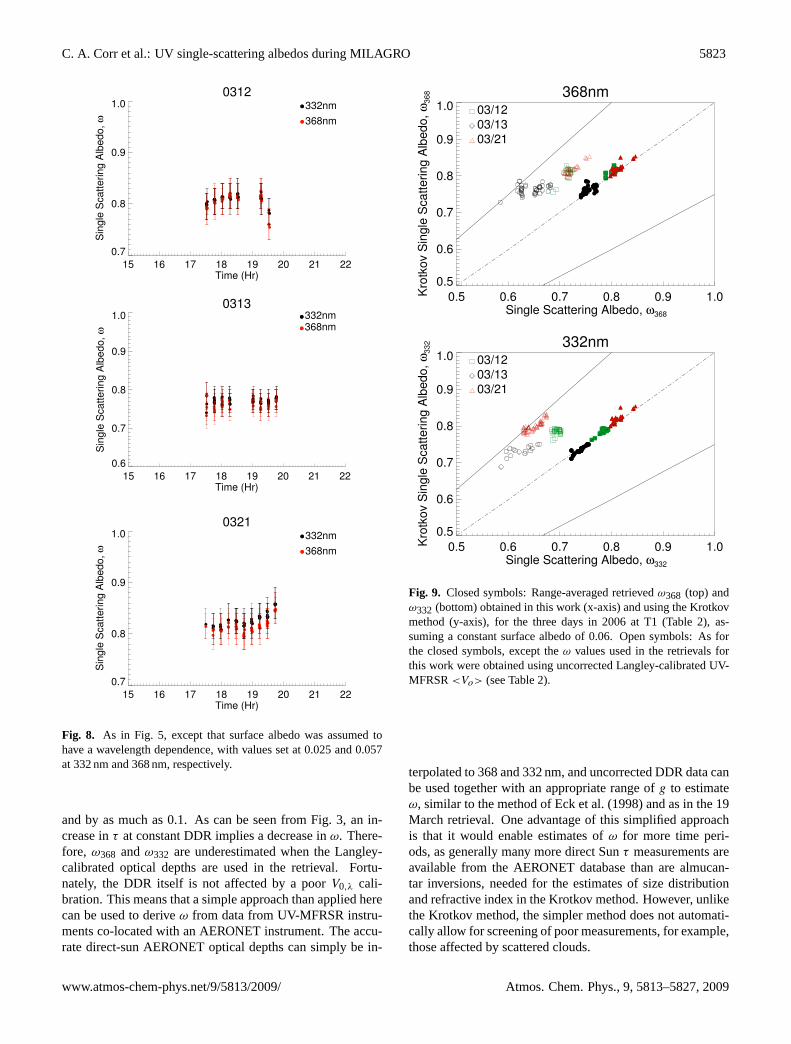
Figure 9 compares the range-averagedω368 andω332 ob-tained in this work for the constant surface albedo case withthe results obtained using the Krotkov method for the sametime periods. The excellent agreement suggests that ourchoice of range forg was appropriate for this application,and that using the uncorrected DDR (i.e., theV0,λ error can-cellation for both diffuse and direct components) is adequate,as long as a correctedτ is input to the retrieval. Based on ourcalculations, the assumed range ing leads to a range inω ofapproximately 0.05, within the±0.025 cited by Barnard etal. (2008) although additional uncertainties must be added toour reported ranges.
One advantage of the method proposed in this work is thatit does not require ancillary measurements of the aerosolsize distribution, as do the Krotkov method and other ap-proaches listed in Table 1. However, our results do demon-strate that accurate measurements ofτ are the most criticalfor ω retrievals. In Fig. 9, the open symbols show the range-averagedω368 andω332 obtained using the uncorrected, on-site Langley-calibratedτ from the UVMRP website. Asshown in Table 2, these uncorrected optical depths are sig-nificantly larger than those used in this work, by at least 0.04
Atmos. Chem. Phys., 9, 5813–5827, 2009 www.atmos-chem-phys.net/9/5813/2009/
C. A. Corr et al.: UV single-scattering albedos during MILAGRO 5823
0312
15 16 17 18 19 20 21 22Time (Hr)
0.7
0.8
0.9
1.0S
ing
le S
ca
tte
rin
g A
lbe
do
, ω
332nm
368nm
0313
15 16 17 18 19 20 21 22Time (Hr)
0.6
0.7
0.8
0.9
1.0
Sin
gle
Sca
tte
rin
g A
lbe
do
, ω
332nm368nm
0321
15 16 17 18 19 20 21 22Time (Hr)
0.7
0.8
0.9
1.0
Sin
gle
Sca
tte
rin
g A
lbe
do
, ω
332nm
368nm
Figure 8. As in Figure 5, except that surface albedo was assumed to have a wavelength
dependence, with values set at 0.025 and 0.057 at 332 nm and 368 nm, respectively.
Fig. 8. As in Fig. 5, except that surface albedo was assumed tohave a wavelength dependence, with values set at 0.025 and 0.057at 332 nm and 368 nm, respectively.
and by as much as 0.1. As can be seen from Fig. 3, an in-crease inτ at constant DDR implies a decrease inω. There-fore, ω368 andω332 are underestimated when the Langley-calibrated optical depths are used in the retrieval. Fortu-nately, the DDR itself is not affected by a poorV0,λ cali-bration. This means that a simple approach than applied herecan be used to deriveω from data from UV-MFRSR instru-ments co-located with an AERONET instrument. The accu-rate direct-sun AERONET optical depths can simply be in-
368nm
0.5 0.6 0.7 0.8 0.9 1.0Single Scattering Albedo, ω368
0.5
0.6
0.7
0.8
0.9
1.0
Kro
tkov S
ingle
Scattering A
lbedo,
ω3
68
03/13
03/12
03/21
332nm
0.5 0.6 0.7 0.8 0.9 1.0Single Scattering Albedo, ω332
0.5
0.6
0.7
0.8
0.9
1.0
Kro
tkov S
ingle
Scattering A
lbedo,
ω3
32
03/13
03/12
03/21
Figure 9. Closed symbols: Range-averaged retrieved ω368 (top) and ω332 (bottom) obtained in this
work (x axis) and using the Krotkov method (y axis), for the three days in 2006 at T1 (Table 2),
assuming a constant surface albedo of 0.06. Open symbols: As for the closed symbols, except the
ω values used in the retrievals for this work were obtained using uncorrected Langley-calibrated
UV-MFRSR <Vo> (see Table 2).
Fig. 9. Closed symbols: Range-averaged retrievedω368 (top) andω332 (bottom) obtained in this work (x-axis) and using the Krotkovmethod (y-axis), for the three days in 2006 at T1 (Table 2), as-suming a constant surface albedo of 0.06. Open symbols: As forthe closed symbols, except theω values used in the retrievals forthis work were obtained using uncorrected Langley-calibrated UV-MFRSR<Vo> (see Table 2).
terpolated to 368 and 332 nm, and uncorrected DDR data canbe used together with an appropriate range ofg to estimateω, similar to the method of Eck et al. (1998) and as in the 19March retrieval. One advantage of this simplified approachis that it would enable estimates ofω for more time peri-ods, as generally many more direct Sunτ measurements areavailable from the AERONET database than are almucan-tar inversions, needed for the estimates of size distributionand refractive index in the Krotkov method. However, unlikethe Krotkov method, the simpler method does not automati-cally allow for screening of poor measurements, for example,those affected by scattered clouds.
www.atmos-chem-phys.net/9/5813/2009/ Atmos. Chem. Phys., 9, 5813–5827, 2009

5824 C. A. Corr et al.: UV single-scattering albedos during MILAGRO
Figure 10. Measured and simulated jNO 2 (s
-1) for 13 March at the T1 site. The red line shows the
scanning actinic flux spectroradiometer (SAFS) measurement (see text). Other lines show results
from TUV simulations run every 15 minutes, beginning at 17:30 UTC. All simulations use
g=0.68, an Angström parameter of 0.7, assume no spectral variation in ω, and assume a
spectrally-invariant surface albedo a=0.025, except for the dashed line, for which a=0.06. Green
lines: τ332=0.31, ω332 =0.72 (corresponding most closely to midpoints of observations; see Table
2). Pink line: τ332=0.31, ω332=0.84. Blue line: τ332=0.19, ω332=0.78. Yellow line: τ 332=0.43,
ω332=0.78.
Fig. 10.Measured and simulatedjNO2 (s−1) for 13 March at the T1site. The red line shows the scanning actinic flux spectroradiometer(SAFS) measurement (see text). Other lines show results from TUVsimulations run every 15 min, beginning at 17:30 UTC. All simula-tions useg=0.68, an Angstrom parameter of 0.7, assume no spec-tral variation inω, and assume a spectrally-invariant surface albedoa=0.025, except for the dashed line, for whicha=0.06. Green lines:τ332=0.31,ω=0.72 (corresponding most closely to midpoints of ob-servations; see Table 2). Pink line:τ332=0.31,ω=0.84. Blue line:τ332=0.19,ω=0.78. Yellow line:τ332=0.43,ω=0.78.
4 Conclusions
We have applied the methodology of Petters et al. (2003)to the retrieval of column average aerosol single scatteringalbedos,ω, from measured direct and diffuse voltages in theUV spectral region for three days of measurements at theT1 site in Mexico during the MILAGRO field campaign inMarch 2006. The method is cross-checked against the morecomplex methodology proposed by Krotkov et al. (2005a,b), and is shown to yield consistent estimates ofω368 andω332 if well-calibrated AERONET aerosol optical depths areused in the retrieval. We find thatω368 generally ranged from0.73–0.85, andω332 from 0.70–0.86, depending on the dayand on the assumptions used in the retrievals. Our valuesalign well with other estimates ofω at UV and visible wave-lengths published for Mexico City and for the MILAGROcampaign. Our selected dates were all within the MILAGROtime period most heavily influenced by fire emissions, andour findings are also consistent with an aerosol compositionthat had significant contributions from dust or organic carbonspecies with enhanced absorption at UV wavelengths.
Uncertainties that affect our results, particularly the de-gree of wavelength dependence inω, are the value and spec-tral dependency of surface albedo. When surface albedowas set to a fixed value, a small spectral dependence inω,with ω368>ω332, was suggested by the data for all three re-
trieval days. However, when a wavelength-dependent surfacealbedo based on MILAGRO measurements was used in theretrievals, the spectral relationship between theω values waseliminated in most cases. Our findings are in general agree-ment with those of Barnard et al. (2008), who suggested alarge decrease inω from the visible to the near-UV, but weakspectral dependence below 400 nm.
As discussed by Barnard et al. (2008), the enhancementin absorption at UV wavelengths, as compared with visiblewavelengths, is larger than would be expected if black car-bon were the only absorbing species. They estimate that thisadditional UV absorption would be expected to significantlyslow photochemical pollutant formation, and may also in-crease local atmospheric heating rates, thereby influencingstability and convection. Marley et al. (2009) showed thatmeasured broadband UV-B irradiances at the T1 site werelower than those modeled for clear sky conditions, confirm-ing that the presence of absorbing gases and aerosols at theT1 site reduced UV-B radiation. It should be noted that un-der heavily polluted conditions in which the NO2 columnconcentration exceeds 2 DU retrievedω values may appearlower than reality. However, because the absorption cross-sections at 440 and the near-UV are similar (4.8×10⁻¹⁹ cm2
and∼4×10⁻¹⁹ cm2, respectively), there is not an enhancedabsorption by NO2 at 332 and 368 over 440 nm and the trendin ω with wavelength is likely real.
The variations in aerosol loading andω that we have es-timated from the MILAGRO data are large enough to havemeasurable impacts on photolysis rates. In Fig. 10 we showthe results of TUV simulations of the downwelling photol-ysis rates of NO2, jNO2, for 13 March for various assumedvalues ofτ332 and ω, and compare them to direct down-welling measurements from the scanning actinic flux spec-troradiometer (SAFS; Lefer et al., 2001). In these simula-tions we have kept assumed properties constant throughoutthe day in order to isolate the effects of varying assumptionson the computed photolysis rates, and have chosen the rangesin each parameter to span those typical of the 3 retrieval daysdiscussed in this paper. Figure 10 demonstrates that in gen-eral, the simulations are able to reproduce the measurementswith good accuracy, a finding that also holds on the other tworetrieval days. The green lines represent choices ofτ332 andω closest to our midpoint values for 13 March (Table 2), anddemonstrate that the choice of surface albedo (0.025 vs. 0.06)imposes only about a 1% change injNO2. In contrast, varyingω from 0.72 to 0.84 (a 17% increase) at constantτ332 (solidgreen and solid pink lines), leads to a∼3.5% increase injNO2,a value similar to the increase injNO2(∼4.5%) that arisesfrom a relatively large decrease inτ332 from 0.43 to 0.19 atconstantω (gold and blue lines). The calculations demon-strate thatjNO2 is atleast sensitive toω as it is toτ . The ef-fects of the changes in thejNO2values on O3 production wereexamined using a simple photochemical box model (Lefer etal., 2003). It was found that the % changes in the instanta-neous net O3 production rates varied∼1:1 with changes in
Atmos. Chem. Phys., 9, 5813–5827, 2009 www.atmos-chem-phys.net/9/5813/2009/
C. A. Corr et al.: UV single-scattering albedos during MILAGRO 5825
jNO2, emphasizing the need for the accurate quantification ofbothω andτ for photochemical modeling applications. Thetwo retrieval methods used in this work provide a simple,and effective means for determining these essential aerosoloptical parameters and may thus prove useful in the photo-chemistry field.
Acknowledgements.This work was conducted through the USDAUV-B Monitoring and Research Program and supported by NSFunder grant number ATM-0511911. The USDA UV-B Monitoringand Research Program is supported through the USDA CSREESgrant 2006-34263-16926 “Global Change/Ultraviolet Radiation”.Nickolay Krotkov acknowledges NASA support through grantNNX08AQ05G “Spectral absorption properties of aerosols inUV wavelengths”. Sasha Madronich acknowledges supportfrom The National Center for Atmospheric Research which issupported by the NSF. We thank Amando Leyva Contreras,Hector Estevez Perez, and Wayne W. Newcomb for their effortsin establishing and maintaining the Mexico City AERONET site,and for the use of those data in this work. Wayne W. Newcomb’srecent death in December ’09 highlights the importance to scienceof insightful, practical and can do people. Without his considerabletalents, these measurements during MILAGRO would not havebeen possible. He is sorely missed as a colleague to scientists and afriend to all.
Edited by: J. Gaffney
References
Bais, A. F.,Kazantzidis, A., Kazadzis, S., Balis, D. S, Zerefos, C.S., and Meleti, C.: Deriving an effective aerosol single scatteringalbedo from spectral surface UV voltage measurements, Atmos.Environ., 39, 1093–1102, 2005.
Barnard, J. C., Volkamer, R., and Kassianov, E. I.: Estimation of themass absorption cross section of the organic carbon componentof aerosols in the Mexico City Metropolitan Area, Atmos. Chem.Phys., 8, 6665–6679, 2008,http://www.atmos-chem-phys.net/8/6665/2008/.
Bergstrom, R. W., Pilewskie, P., Pommier, J., Rabbette, M., Rus-sell, P. B., Schmid, B., Redemann, J., Higurashi, A., Naka-jima, T., and Quinn, P. K.: Spectral absorption of solar radiationby aerosols during ACE-Asia, J. Geophys, Res., 109, D19S15,doi:10.1029/2003JD004467, 2004.
Bigelow, D. S., Slusser, J. R., Beaubien, A. F., and Gibson, J. H.:The USDA ultraviolet radiation monitoring program, B. Am.Meteorol. Soc., 79, 601–615, 1998.
Bornman, J. F. and Teramura, A. H.: Effects of UV-B on terrestrialplants, in: Environmental UV Photobiology, Plenum Press, NewYork, New York, 1993.
Castro, T., Mar, B., Longoria, R., Ruiz-Suarez, L. G., and Morales,L.: Surface albedo measurements in Mexico City metropolitanarea, Atmosfera, 14, 69–74, 2000.
Castro, T., Madronich, S., Rivale, S., Muhlia, A., and Mar, B.: Theinfluence of aerosols on photochemical smog in Mexico City, At-mos. Environ., 35, 1765–1772, 2001.
Coddington, O., Schmidt, K. S., Pilewskie, P., Gore, W. J.,Bergstrom, R. W., Roman, M., Redemann, J., Russell, P. B.,
Liu, J., and Schaaf, C. C.: Aircraft measurements of spec-tral surface albedo and its consistency with ground-based andspace-borne observations, J. Geophys, Res., 113, D17209,doi:10.1029/2008JD010089, 2008.
de Foy, B., Fast, J. D., Paech, S. J., Phillips, D., Walters, J. T.,Coulter, R. L., Martin, T. J., Pekour, M. S., Shaw, W. J., Kasten-deuch, P. P., Marley, N. A., Retama, A., and Molina, L. T.: Basin-scale wind transport during the MILAGRO field campaign andcomparison to climatology using cluster analysis, Atmos. Chem.Phys., 8, 1209–1224, 2008,http://www.atmos-chem-phys.net/8/1209/2008/.
Dickerson, R., Kondragunta, S., Stenchikov, G., Civerolo, K., Dod-dridge, B., and Holben, B.: The impact of aerosol on solar UV ra-diation and photochemical smog, Science, 278, 827–830, 1997.
Diffey, B. L.: Solar ultraviolet-radiation effects on biological-systems, Phys. Med. Biol, 36, 299–328, 1991.
Doran, J. C., Barnard, J. C., Arnott, W. P., Cary, R., Coulter, R.,Fast, J. D., Kassianov, E. I., Kleinman, L., Laulainen, N. S., Mar-tin, T., Paredes-Miranda, G., Pekour, M. S., Shaw, W. J., Smith,D. F., Springston, S. R., and Yu, X.-Y.: The T1-T2 study: evo-lution of aerosol properties downwind of Mexico City, Atmos.Chem. Phys., 7, 1585–1598, 2007,http://www.atmos-chem-phys.net/7/1585/2007/.
Dubovik, O. and King, M. D.: A flexible inversion algorithm forretrieval of aerosol optical properties from Sun and sky radiancemeasurements, J. Geophys, Res., 105, 20673–20696, 2000.
Dubovik, O., Smirnov, A., Holben, B. N., King, M. D., Kauf-man, Y. J., Eck,, T. F., and Slutsker, I.: Accuracy assessmentsof aerosol optical properties retrieved from Aerosol Robotic Net-work (AERONET) Sun and sky radiance measurements, J. Geo-phys, Res., 105, 9791–9806, 2000.
Dubovik, O., Holben, B., Eck, T. F., Smirnov, A., Kaufman, Y. J.,King, M. D., Tanre, D., and Slutsker, I.: Variability of absorptionand optical properties of key aerosol types observed in world-wide locations, J. Atmos. Sci., 59, 590–608, 2002.
Eck, T. F, Holben, B. N., Slutsker, I., and Setzer, A.: Measure-ments of irradiance attenuation and estimation of aerosol singlescattering albedo for biomass burning aerosols in Amazonia, J.Geophys. Res., 103, 31865–31878, 1998.
Elminir, H. K.: Sensitivity of ultraviolet solar radiation to anthro-pogenic air pollutants and weather conditions, Atmos. Res., 84,250–264, 2007.
Elterman, L., Wexler, R., and Chang, D. T.: Features of troposphericand stratospheric dust, Appl. Optics, 8, 893–903, 1969.
Fast, J. D., de Foy, B., Acevedo Rosas, F., Caetano, E., Carmichael,G., Emmons, L., McKenna, D., Mena, M., Skamarock, W.,Tie, X., Coulter, R. L., Barnard, J. C., Wiedinmyer, C., andMadronich, S.: A meteorological overview of the MILAGROfield campaigns, Atmos. Chem. Phys., 7, 2233–2257, 2007,http://www.atmos-chem-phys.net/7/2233/2007/.
Goering, C. D., L’Ecuyer, T. S., Stephens, G. L., Slusser, J. R.,Scott, G., Davis, J., Barnard, J. C., and Madronich, S.: Simulta-neous retrievals of column ozone and aerosol optical propertiesfrom direct and diffuse solar voltage measurements, J. Geophys,Res., 110, D05204, doi:10.1029/2004JD005330, 2005.
Harrison, L., Michalsky, J., and Berndt, J.: Automated multifil-ter rotating shadow-band radiometer – an instrument for opticaldepth and radiation measurements, Appl. Optics, 33, 5118–5125,1994.
www.atmos-chem-phys.net/9/5813/2009/ Atmos. Chem. Phys., 9, 5813–5827, 2009
5826 C. A. Corr et al.: UV single-scattering albedos during MILAGRO
Harrison, L. and Michalsky, J.L,: Objective algorithms for the re-trieval of optical depths from ground-based measurements, Appl.Optics, 33, 5126–5132, 1994.
He, S. and Carmichael, G. R.: Sensitivity of photolysis rates andozone production in the troposphere to aerosol properties, J. Geo-phys. Res., 104, 26307–26324, 1999.
Hofzumahaus, A., Kraus, A., Kylling, A., and Zerefos, C. S.: Solaractinic radiation (280–420 nm) in the cloud-free troposphere be-tween ground and 12 km altitude: Measurements and model re-sults, J. Geophys. Res., 107, 8139, doi:10.1029/2001JD900142,2002.
Holben, B. N., Eck, T. F., Slutsker, I., Tanre, D., Buis, J. P., Set-zer, A., Vermote, E., Reagan, J. A., Kaufman, Y. J., Nakajima,T., Lavenu, F., Jankowiak, I., and Smirnov, A.: AERONET – Afederated instrument network and data archive for aerosol char-acterization, Rem. Sens. Environ., 66, 1–16, 1998.
Holben, B. N., Tanre, D., Smirnov, A., Eck, T. F., Slutsker, I.,Abuhassan, N., Newcomb, W. W., Schafer, J. S., Chatenet, B.,Lavenu, F., Kaufman, Y. J., Castle, J. V., Setzer, A., Markham,B., Clark, D., Frouin, R., Halthore, R., Karneli, A., O’Neill, N.T., Pietras, C., Pinker, R. T., Voss, K., and Zibordi, G.: An emerg-ing ground-based aerosol climatology: Aerosol optical depthfrom AERONET, J. Geophys. Res., 106, 12067–12097, 2001.
Johansson, M., Rivera, C., de Foy, B., Lei, W., Song, J., Zhang,Y., Galle, B., and Molina, L.: Mobile mini-DOAS measurementof the emission of NO2 and HCHO from Mexico City, Atmos.Chem. Phys. Discuss., 9, 865–882, 2009,http://www.atmos-chem-phys-discuss.net/9/865/2009/.
Kassianov, E. I., Barnard, J. C., and Ackerman, T. P.: Re-trieval of aerosol microphysical properties using surface Multi-filter Rotating Shadowband Radiometer (MFRSR) data: Mod-eling and observations, J. Geophys. Res., 110, D09201,doi:10.1029/2004JD005337, 2005.
Kleinman, L. I.: The dependence of tropospheric ozone productionrate on ozone precursors, Atmos. Environ., 39, 575–586, 2005.
Krotkov, N. A., Bhartia, P. K., Herman, J. R., Fioletov, V., andKerr, J.: Satellite estimation of spectral surface UV voltage inthe presence of tropospheric aerosols 1. Cloud-free case, J. Geo-phys. Res., 103, 8779–8794, doi:10.1029/98JD00233, 1998.
Krotkov, N., Bhartia, P. K., Herman, J., Slusser, J., Labow, G., Scott,G., Janson, G., Eck, T. F., and Holben, B.: Aerosol ultravioletabsorption experiment (2002 to 2004), part 1: ultraviolet multi-filter rotating shadowband radiometer calibration and intercom-parison with CIMEL sunphotometers, Opt. Eng., 44, 041001,doi:10.1117/1.1886818, 2005a.
Krotkov, N., Bhartia, P. K., Herman, J., Slusser, J., Scott, G., Labow,G., Vasilkov, A. P., Eck, T. F., Dubovik, O., and Holben, B. N.:Aerosol ultraviolet absorption experiment (2002 to 2004), part2: absorption optical thickness, refractive index, and single scat-tering albedo, Opt. Eng., 44, 041005, doi:10.1117/1.1886819,2005b.
Krotkov, N., Herman, J. J., Cede, A., and Labow, G.: Partitioningbetween aerosol and NO2 absorption in the UVA, in: UltravioletGround- and Space-based Measurements, Models, and EffectsV, edited by: Bernhard, G., Slusser, J. R., Herman, J. R., andGao, W., Proceedings of SPIE, 5886, Bellingham, WA, 588601,2005c.
Kudo, R., Uchiyama, A., Yamazaki, A., Kobayashi, E., andNishizawa, T.: retrieval of aerosol single-scattering properties
from diffuse and direct irradiacnce: Numerical studies, J. Geo-phys. Res., 113, D09204, doi:10.1029/2007JD009239, 2008.
Lefer, B. L., Hall, S. R., Cinquini, L., Shelter, R. E., Barrick, J. D.,and Crawford, J. H.: Comparison of airborne NOi photolysis fre-quency measurements during PEM Tropics B, J. Geophys. Res.,106, 32645–32656, 2001.
Lefer, B. L., Shetter, R. E., Hall, S. R., Crawford, J. H., and Olson,J. R.: Impact of clouds and aerosols on photolysis frequenciesand photochemistry during TRACE-P: 1. Analysis using radia-tive transfer and photochemical box models, J. Geophys. Res.,108, 8821, doi:10.1029/2002JD003171, 2003.
Liu, S. C., McKeen, S. A., and Madronich, S.: Effect of an-thropogenic aerosols on biologically active ultraviolet radiation,Geophys. Res. Lett., 18, 2265–2268, 1991.
Longstreth, J., de Gruijl, F. R., Kripke, M. L., Abseck, S., Arnold,F., Slaper, H. I., Velders, G., Takizawa, Y., and van der Leun, J.C.: Health risks, J. Photoch Photobio-B, 46, 20–39, 1998.
Madronich, S. and Flocke, S.: The role of solar radiation in atmo-spheric chemistry, in: Handbook of Environmental Chemistry,edited by: Boule, P., Springer-Verlag, Heidelberg, 1–26, 1998.
Madronich, S., Shetter, R., Hall, S., Lefer, B., and Slusser, J.: Ultra-violet characteristics of PBL aerosol in Mexico City, Eos Trans.AGU, 88(52), Fall Meet. Suppl., Abstract A32A-06, 2007.
Marley, N. A., Gaffney, J. S., Castro, T., Salcido, A., and Freder-ick, J.: Measurements of aerosol absorption and scattering in theMexico City Metropolitan Area during the MILAGRO field cam-paign: a comparison of results from the T0 and T1 sites, Atmos.Chem. Phys., 9, 189–206, 2009,http://www.atmos-chem-phys.net/9/189/2009/.
Michalsky, J. J., Schlemmer, F. A., Berkheiser, W. E., Berndt, J. L.,Harrison, L. C., Laulainen, N. S., Larson, N. R., and Barnard, J.C.: Multiyear measurements of aerosol optical depth in the At-mospheric Radiation Measurement and Quantitative Links pro-grams, J. Geophys. Res., 106, 12099–12107, 2001.
Moffet, R. C., de Foy, B., Molina, L. T., Molina, M. J., and Prather,K. A.: Measurement of ambient aerosols in northern Mexico Cityby single particle mass spectrometry, Atmos. Chem. Phys., 8,4499–4516, 2008,http://www.atmos-chem-phys.net/8/4499/2008/.
Petters, J. L., Saxena, V. K., Slusser, J. R., Wenny, B.N., and Madronich, S.: Aerosol single scattering albedoretrieved from measurements of surface UV voltage anda radiative transfer model, J. Geophys. Res., 108, 4288,doi:10.1029/2002JD002360, 2003.
Querol, X., Pey, J., Minguillon, M. C., Perez, N., Alastuey, A.,Viana, M., Moreno, T., Bernabe, R. M., Blanco, S., Cardenas, B.,Vega, E., Sosa, G., Escalona, S., Ruiz, H., and Artnano, B.: PMspeciation and sources in Mexico during the MILAGRO-2006Campaign, Atmos. Chem. Phys., 8, 111–128, 2008,http://www.atmos-chem-phys.net/8/111/2008/.
Reuder, J. and Schwander, H.: Aerosol effects on UV radiation innonurban regions, J. Geophys. Res., 104, 4065–4077, 1999.
Slusser, J., Gibson, J., Bigelow, D., Kolinski, D., Disterhoft, P.,Lantz, K., and Beaubien, A.: Langley method of calibrating UVfilter radiometers, J. Geophys. Res., 105, 4841–4849, 2000.
Sokolik, I. N. and Toon, O. B.: Incorporation of mineralogical com-position into models of the radiative properties of mineral aerosolfrom UV to IR wavelengths, J. Geophys. Res., 104, 9423–9444,1999.
Atmos. Chem. Phys., 9, 5813–5827, 2009 www.atmos-chem-phys.net/9/5813/2009/

C. A. Corr et al.: UV single-scattering albedos during MILAGRO 5827
Stone, E. A., Snyder, D. C., Sheesley, R. J., Sullivan, A. P., Weber,R. J., and Schauer, J. J.: Source apportionment of fine organicaerosol in Mexico City during the MILAGRO experiment 2006,Atmos. Chem. Phys., 8, 1249–1259, 2008,http://www.atmos-chem-phys.net/8/1249/2008/.
Taylor, T. E., L’Ecuyer, T. S., Slusser, J. R., Stephens, G. L., andGoering, C. D.: An operational retrieval algorithm for determin-ing aerosol optical properties in the ultraviolet, J. Geophys. Res.,113, D03201, doi:10.1029/2007JD008661, 2008.
Weaver, C. J., Ginoux, P., Hsu, N. C., Chou, M. D., and Joiner, J.:Radiative forcing of Saharan dust: GOCART model simulationscompared with ERBE data, J. Atmos. Sci., 59, 736–747, 2002.
Wenny, B. N., Schafer, J. S., DeLuisi, J. J., Saxena, V. K., Barnard,W. F., Petropavlovskikh, I. V., and Vergamini, A. J.: A study ofregional aerosol radiative properties and effects on ultraviolet-Bradiation, J. Geophys. Res., 103, 17083–17097, 1998.
Wetzel, M. A., Shaw, G. E., Slusser, J. R., Borys, R. D., and Cahill,C. F.: Physical, chemical, and ultraviolet radiative characteris-tics of aerosol in central Alaska, J. Geophys. Res., 108, 4418,doi:10.1029/2002JD003208, 2003.
Yokelson, R. J., Urbanski, S. P., Atlas, E. L., Toohey, D. W., Al-varado, E. C., Crounse, J. D., Wennberg, P. O., Fisher, M. E.,Wold, C. E., Campos, T. L., Adachi, K., Buseck, P. R., and Hao,W. M.: Emissions from forest fires near Mexico City, Atmos.Chem. Phys., 7, 5569–5584, 2007,http://www.atmos-chem-phys.net/7/5569/2007/.
www.atmos-chem-phys.net/9/5813/2009/ Atmos. Chem. Phys., 9, 5813–5827, 2009


![Arctic organic aerosol measurements show particles from mixed … · 2015-07-22 · [2] Changing snow and sea ice cover, associated albedo feedbacks and large seasonal variation in](https://img.dokumen.tips/doc/110x75/5e7aa8453399e747ea16b682/arctic-organic-aerosol-measurements-show-particles-from-mixed-2015-07-22-2-changing.jpg)